 Agricultural Nutrient Balance
Key message
Agriculture is a major source of nutrient inputs to the Baltic Sea, as in many regions globally. The activity is estimated to contribute about half of the total waterborne nitrogen and phosphorus inputs to the Baltic Sea, with a considerable portion originating from fertilizer consumption and manure input. Various drivers determine the size and structure of the agricultural sector in the region. Globalization, demographics and changing consumer demand broadly influence agriculture through market forces, while agricultural subsidies and regulations are to reinforce or weaken those market forces. Further, adoption or rejection of technologies such as precision fertilization and advanced crop protection may offer opportunities to simultaneously meet a variety of economic or regulatory goals.
The nutrient balance driver indicator set aims to highlight the links between the use of agricultural nutrients, their flow to the environment, and the sustainable use of nutrient resources. These links can be used to assess the potential risks of a surplus or deficit nutrients for agricultural land. Much of the nutrient inputs to agriculture occur when inorganic fertilizers or manure are applied to agricultural fields to increase crop growth. Not all the applied nutrients will be retained in the soil or taken up by crops and this portion can contribute to the nutrient load to the Baltic Sea. Particularly in regions with high animal husbandry density, the distributional challenges for the efficient use of manure resources can lead to nutrient loading.
Fertilizer consumption and animal husbandry in the Baltic Sea catchment has been relatively stable over the past decade and HELCOM has been working towards management of agricultural nutrients. The recent EU agricultural outlook report suggests that agricultural activity and nutrient balance in the Baltic Sea region will be stable over this decade (2020-2031).
Citation
The data and resulting data products (e.g. tables, figures and maps) available on the indicator web page can be used freely given that it is used appropriately and the source is cited. The indicator should be cited as follows:
HELCOM (2023). Agricultural nutrient balance. HELCOM driver indicator report. Online. [Date Viewed], [Web link]. ISSN 2343-2543
Background
Agriculture is a vital economic activity and the largest source of nutrient inputs to the Baltic Sea, contributing to over 70-90% of nitrogen and 60-80% of phosphorus diffuse and almost half of total waterborne inputs to the sea (HELCOM 2011 and 2021). The activity is estimated to contribute about half of the total waterborne nitrogen and phosphorus inputs to the Baltic Sea. In the Baltic Sea area, the impact of nutrient pollution on the marine ecosystem is intensified because the Baltic Sea is an enclosed sea and water exchange with the open ocean is limited (Capell et al. 2021). Through the Baltic Sea Action Plan (BSAP), the Helsinki Commission (HELCOM) coordinates reduction goals for nitrogen and phosphorus loads for all member states. Further, several EU directives and regulations address input of nutrients pressure (i.e., the Nitrates Directive, the Water Framework Directive, the Urban Wastewater Treatment Directive, and the EU Fertilisers Regulation) and Member States regularly evaluate nitrogen and phosphorous surplus or deficit in agricultural soils. These efforts and available data support the assessment of nutrient balance.
Nutrient balance is defined as the difference between nutrient inputs (fertilizer consumption, manure input and other inputs) and nutrient outputs (the uptake of nutrients for crop and pasture production) in agricultural environments (Eurostat 2022). Positive values indicate nutrient build-up in the environment, while negative values indicate net nutrient removal from the environment. Calculation of nitrogen and phosphorus balances have been established as a key indicator for the documentation and analysis of the sustainability of agriculture production (Lehn et al. 2019, OECD 2019).
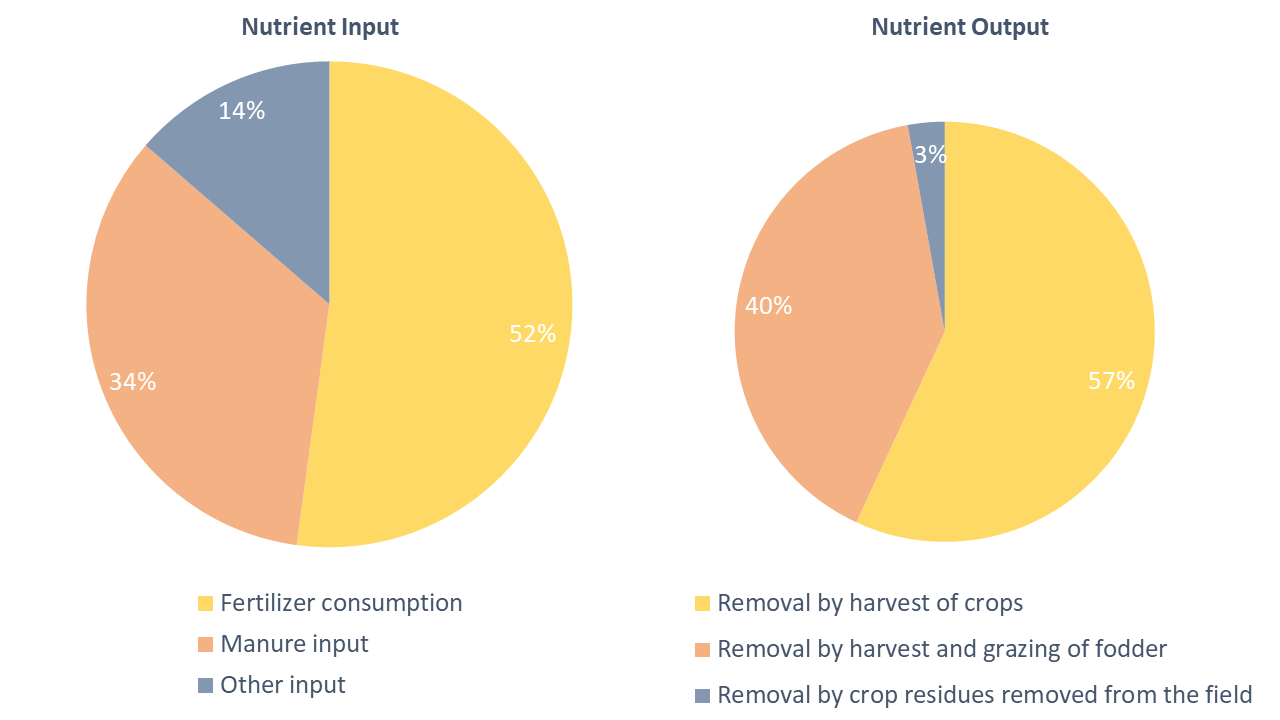
Figure 1: Relative contribution of components of nutrient inputs and outputs to the agricultural soil in the Baltic Sea in 2019 (Eurostat 2022).
In the Baltic Sea nutrient balance, inorganic fertilizer consumption and manure input are the major components of the nutrient input (52% and 34%, respectively), while the crop harvesting is the major source of the nutrient outputs (57%) (Figure 1). In order to improve understanding of potential changes in nutrient balance, the components underlying the calculation can also be analysed.
Eurostat provides country statistics for most of these components. Due to lack data availability, Russia was not included in the driver indicator assessment.
Drivers
Various drivers determine the size and structure of the agricultural sector in the region. Globalization, demographics and changing consumer demand broadly influence agriculture through market forces (Hazell and Wood 2008; Sands et al. 2014; Pihlainen et al. 2020). Agricultural subsidies and regulation can be applied to reinforce or weaken those market forces (Huang et al. 2010, Springmann and Freund, 2022). Adoption or rejection of technologies such as precision fertilization and advanced crop protection may offer opportunities to simultaneously meet a variety of economic or regulatory goals by e.g., increasing yields without creating additional environmental impacts (Sands et al. 2014, Capell et al. 2021, Pardey and Alston 2021).
A brief summary of relevant drivers of relevance to this topic are provided below and a more detailed overview of these can be found in the HOLAS 3 Thematic Assessment of Economic and Social Analyses.
Consumer demand
Consumer demand for food is a significant structuring force in agriculture. The food choices consumers make influence prices and thereby the types of crops that farmers grow and the agriculture methods that are employed (Hazell and Wood 2008, Sands et al. 2014, Pihlainen et al. 2020). The EU agricultural outlook 2021-31 (EC 2021) presents the medium-term outlook for EU agricultural markets, income and environment to 2031 based on a set of macroeconomic assumptions. According to report, the total EU agricultural area and production of arable crops are projected to decrease slightly in the next decade due to land competition and changing consumer demand (EC 2021). Demand for feed is also projected to decrease due to a decline in the bovine and pig populations. On the other hand, the projection suggests that the demand for organic agriculture production will grow, reaching 15% of the total agricultural land by 2031.
Consumer demand for animal products has dramatically changed over the past 50 years at a global scale. Although sustainability concerns are expected to impact EU meat markets over the coming decade, EU meat consumption per capita is projected to reach 67.6kg by 2030. Further, the EU is expected to remain the world’s largest exporter of dairy products, as global population and income growth could boost demand (EC 2021). EU gross beef production is expected to fall by 8% by 2031 in line with a similar drop in consumption (EC 2021). Similar to beef, pig meat production is expected to decline by 4.6% in 2031. On the other hand, EU poultry consumption is still expected to grow over this period though at a reduced rate than the previous decade, resulting in an increase from 23.5 kg per capita in 2021 to 24.8kg in 2031 (5% growth by 2031).
Global and regional trends in consumption determine the intensity and magnitude of the agricultural sector (Sands et al. 2014). Although there is a decreasing consumer demand projection in the EU, global demand can still add pressure on the Baltic Sea in the form of excess nitrogen and phosphorus. The global market for agricultural products reduces the direct links between national consumption and production. So, rather than focusing on the consumption of agricultural products in the Baltic Sea region, the nutrient balance indicator set tracks production (e.g., number of animals, tonnes of crops produced) and the by-products of production (e.g., manure).
Globalization
As previously stated, global and regional trends in consumption determine the intensity and magnitude of the agricultural sector (Sands et al. 2014). The global market for agricultural products reduces the direct links between national consumption and production. Globalization has altered where and how goods are made with significant impacts on European economies and societies (Jacques 2016). Longer and more complex supply chains have changed transportation needs and shifted some the impact of various industrial processes to other parts of the world. Mass production, lower cost of manufacturing and lower prices increased the consumption of globally traded goods, which can be incompatible with regional patterns of economic activity (Hazell and Wood 2008). Therefore, international demand is significantly important to national production for all industries including agriculture. In this context, globalization directly impacts the regional market and consumer demand for agricultural products, and consequently crop production and animal husbandry.
Demographics
Changes in the number, density, and location of people living in the Baltic Sea region affect the demand for many industries including agriculture (Sands et al. 2014). However, it cannot be assumed that change in any particular direction for any of these demographic characteristics is inherently better for the environment. Any change in various demographic characteristics will present a variety of challenges and benefits to managing our relationship to the Baltic Sea (de Sherbinin et al. 2007). All changes in demographics are likely to have an impact on consumer demand, and, due to globalization, global demographics are also likely to impact regional production (Hazell and Wood 2008).
Subsidies and regulations
In order to make agricultural activity profitable, promote the health of rural economies and ensure a domestic food supply, agricultural subsidies and regulations are a significant factor for the industry (Hazell and Wood 2008; Huang et al. 2010; Springmann and Freund 2022). Common Agricultural Policy (CAP), the agricultural policy of the European Union, is the most significant regulation in supporting the sustainable use of fertilisers in agriculture, guaranteeing that farmers can sustain productivity while also decreasing the harmful effects of input of nutrients. CAP implements a system of agricultural subsidies, and the EU spends around 50 billion EUR on the CAP annually with the primary goal being to support farmers’ income and improve the environmental impact of agricultural production (Rizov et al. 2013). According to EU financial factsheets, CAP accounts for 33.1% of the 2021 EU-27 budget (55.71 billion EUR) in 2021 (https://agriculture.ec.europa.eu/).
These subsidies have encouraged producers to make investments in agricultural activities including crop production and animal husbandry. According to OECD (2018), subsidies represented 25% of the value of production in OECD countries, and 15% in non-OECD countries. There are many forms of subsidies in terms of the objectives and the outcomes, and they can be useful tools for reaching variety of goals (Franck et al. 2013; Pe’er, G. et al. 2019). However, their broader impact regarding financial profitability or environmental sustainability should be monitored to ensure significant unintended consequences do not arise.
Technology adoption
Technology adoption is an important driver which can have both negative and positive influences on nutrient balance. Advanced technologies including precision agriculture and robotic systems in farming make more efficient and environmentally friendly agricultural production possible. For instance, using precision agriculture technologies, farmers can use the minimum quantities of required fertilizes and target very specific areas (Mandal and Banik 2022). These new technologies can provide several benefits such as higher crop productivity, decreased use of water and fertilizer, reduced impact on natural ecosystems and less runoff of nutrients into rivers and groundwater (Maffezzoli et al. 2022). According to Capell et al. (2021), technological advances in agriculture were assumed to result in a 5% reduction in N and P fertiliser application in 30 years, due to implementation of precision farming and auto-steering on large farms (>100 ha).
On the other hand, technology adoption can also result in increases in nutrient balance, e.g., due to inorganic fertilizer production and application. According to projections, growing demand for organic products will cause an increase in total organic agricultural land in the next decade (EC 2021).
Driver Indicators
Agricultural nutrient balance is an indicator set which consists of gross nutrient balance for nitrogen and phosphorus. Animal husbandry and crop production indicators are supporting indicators for the gross nutrient balance indicator and more information on these indicators can be found in the annex section. The individual indicators express similar information from different perspectives and are best considered as a group. These indicators can be used as a partial quantified proxy for the drivers of consumer demand, globalization, demographics, subsidies and regulation, and technology adoption. An overview of relevant data trends and information is provided below in sections.
Note that these indicators are calculated at a national level which will obscure any underlying spatial heterogeneity which may be present. Excess nutrients released far from the Baltic are more likely to be retained in inland habitats than those released in coastal environments. Significant and effective agricultural zoning measures could be in force despite a nationally positive nutrient balance.
Gross nutrient balance to agricultural lands
The indicator gross nutrient balance to agricultural lands is intended to be used to assess the potential risks of surplus or deficits of nitrogen and phosphorus. Eurostat calculates gross nutrient balance as the balance between inputs and outputs of nutrients to agricultural soil. Inputs are the consumption of fertilizers, input of manure, and other inputs, while outputs are the removal of nutrients by the harvest of crops, the removal of nutrients through the harvest and grazing of fodder, and crop residues removed from the field. Excess nutrients may be retained in the local soil or other inland habitat, rather than reaching the Baltic Sea. However, larger positive imbalances are more likely to result in nutrient loading to the Baltic Sea. Gross nutrient balance is calculated on a per hectare basis which will not reflect the magnitude of the impact caused by a nutrient surplus or deficit. Total tonnes of nutrients are presented as part of the following nutrient input and output sections.
For nitrogen, there is a stable trend in gross nutrient balance in the Baltic Sea region (Figure 2). However, both Germany (F1,8 = 6.075, p = 0.039), Latvia (F1,8 = 6.359, p = 0.035) have shown a decreasing trend. Denmark, Germany, and Poland have the highest nutrient surplus per hectare in parallel with high levels of animal husbandry and crop production. The regional nitrogen balance is projected to remain relatively stable over the next decade (-10 / +10 kg per hectare by 2031) (EC 2021). The large nitrogen surplus in Denmark appears to be the result of high inputs (Annex Figure 1) from manure production (Annex Figure 2). Germany also has a noticeably elevated nitrogen surplus, though without a single dominant cause. Reductions in the later part of the decade appear driven by reduced fertilizer use (Annex Figure 2). Other countries exist along a continuum, with Latvia with the smallest surplus, and Poland and Finland with relatively higher nitrogen surpluses (Figure 2).
Phosphorus shows a marginally stable trend (F1,8 = 5.262, p = 0.051) but presents a nationally more diverse picture with both phosphorus deficiency (negative values indicating declining soil fertility), and phosphorus surplus (indicating the risk of significant nutrient runoff) present in the region (Figure 3). The regional phosphorus balance is projected to remain relatively stable over the next decade (-2 / +2 kg per hectare by 2031) (EC 2021). Both Germany (F1,8 = 6.595, p = 0.033) and Lithuania (F1,8 = 30.387, p < 0.001) have shown significant decreasing trends over the past decade.
As in nitrogen balance, Denmark has the highest phosphorus surplus (Figure 3) mainly driven by high inputs from manure production (Annex Figure 4). Finland has a relatively higher phosphorus surplus driven by higher consumption of fertilizers (Annex Figure 4) and lower crop harvesting (Annex Figure 8). On the other hand, the high phosphorus deficiency in Estonia is driven by low nutrient inputs (Annex Figure 3) by both fertilizer consumption and manure production (Annex Figure 4). Similar to Estonia, Germany has phosphorus deficiency resulting from decreasing fertilizer consumption and manure input (Annex Figure 3). Sweden also has phosphorus deficiency stemming from high crop harvesting and fodder harvesting (Annex Figure 8). Latvia and Lithuania have near zero phosphorus balances in the recent years (Figure 3).
Detailed information and analysis on nutrient input and output elements (i.e., fertilizer consumption, manure production, livestock population, and crop production) can be found in the Annex section.
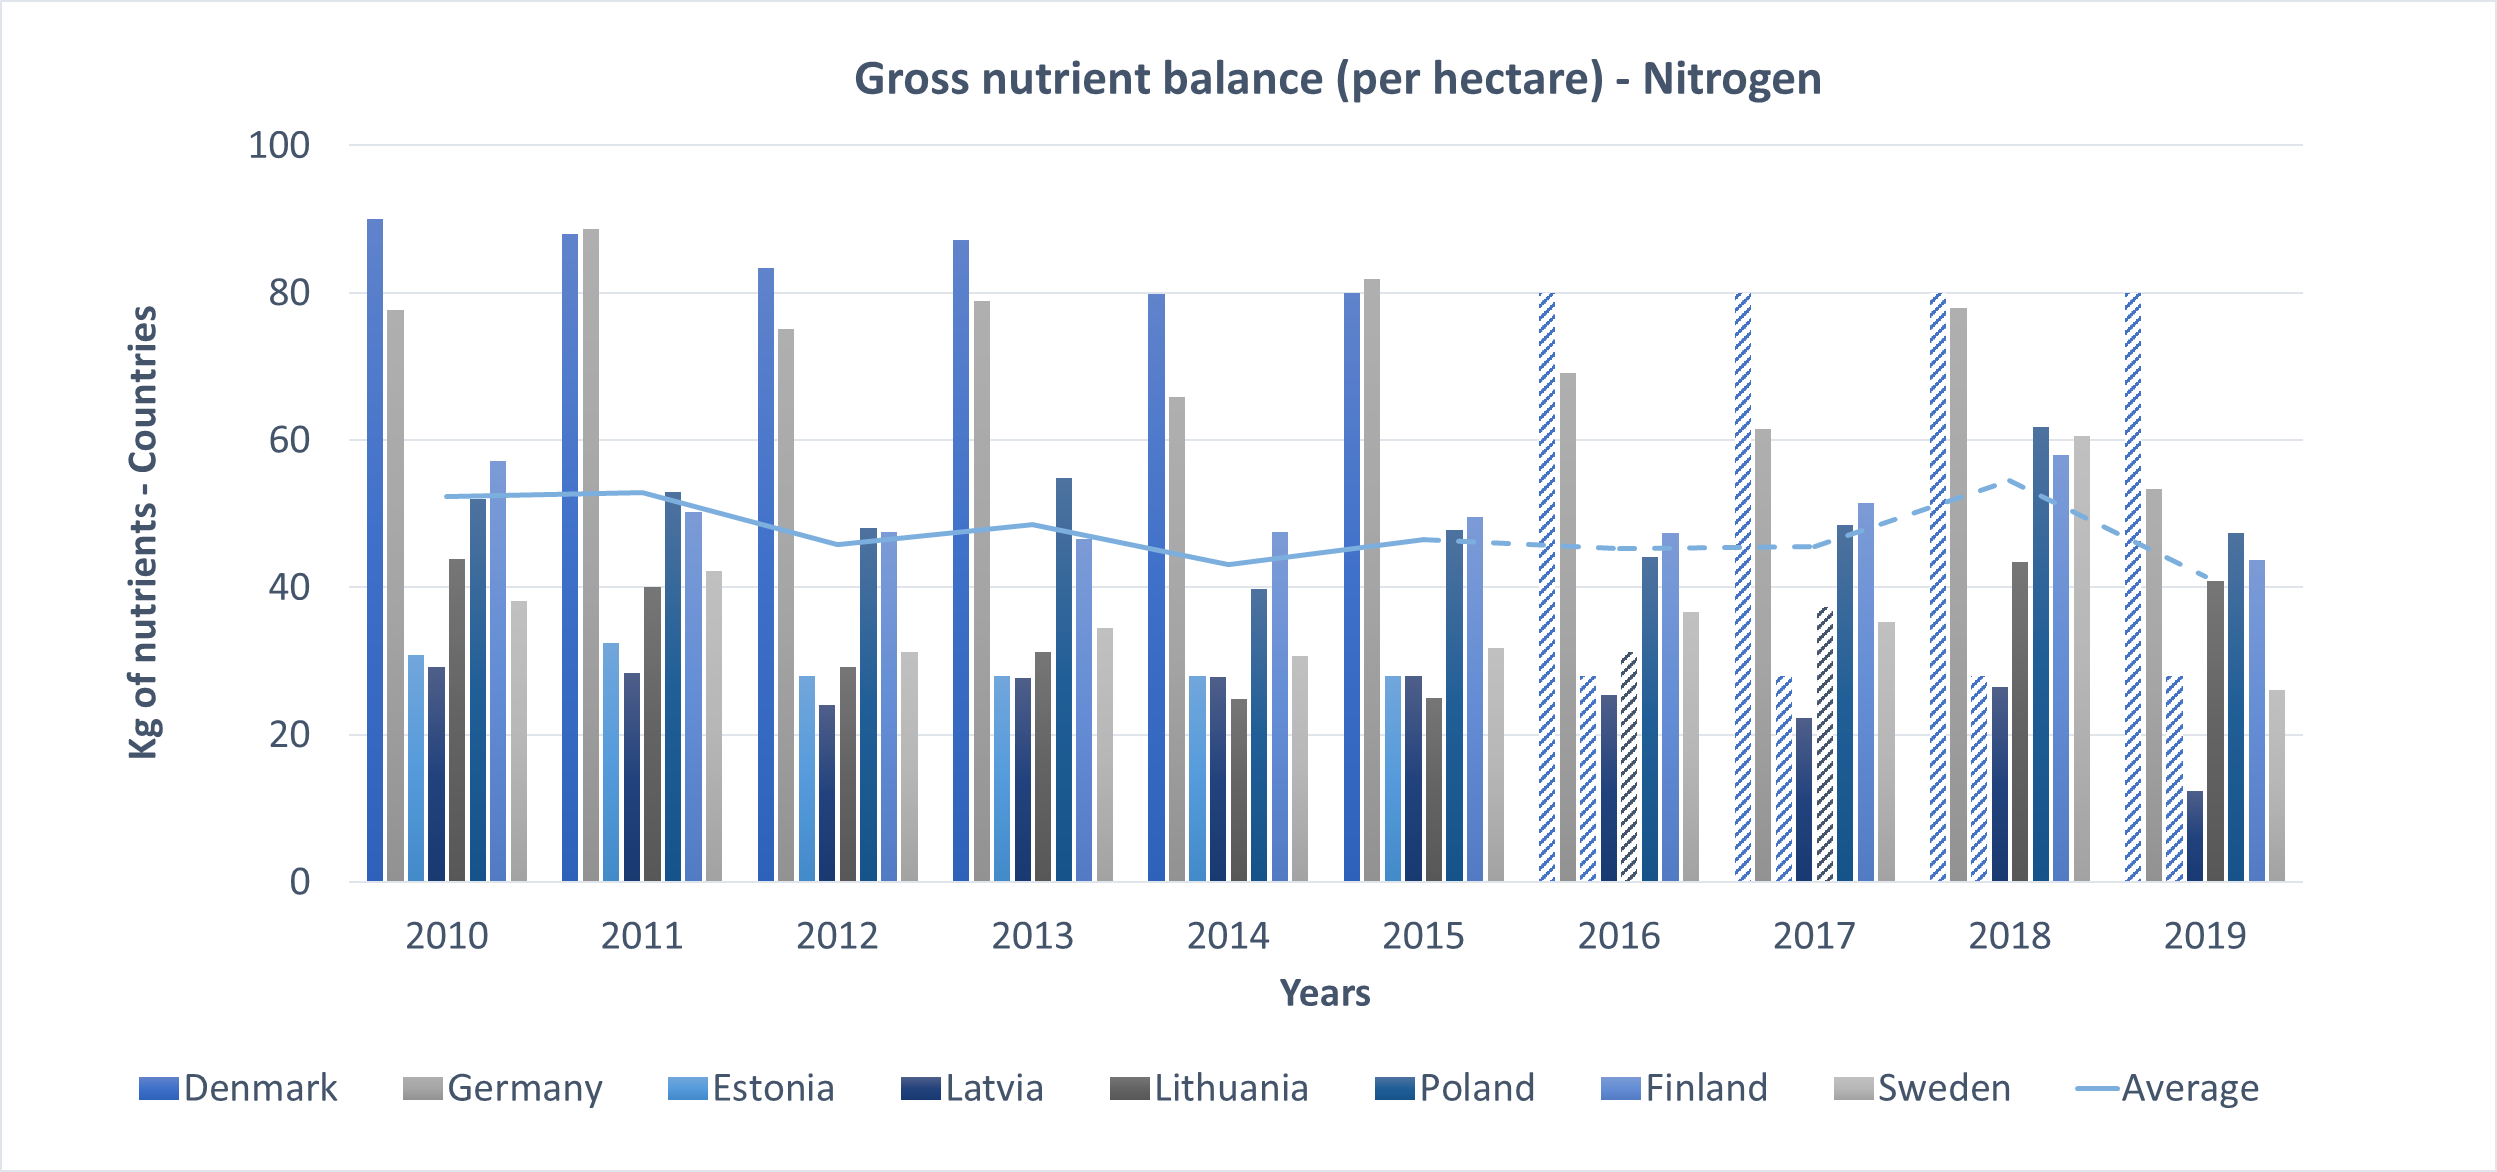
Figure 2: Gross nutrient balance, kilogram of nitrogen per hectare by country and average. Chart does not include data from Russia or any non-HELCOM countries. Data points based on the assumption of no change are indicated with hatched pattern. The data in Eurostat has good temporal coverage for Germany, Poland, Finland, Sweden, Lithuania and Latvia thus the confidence is considered as high.
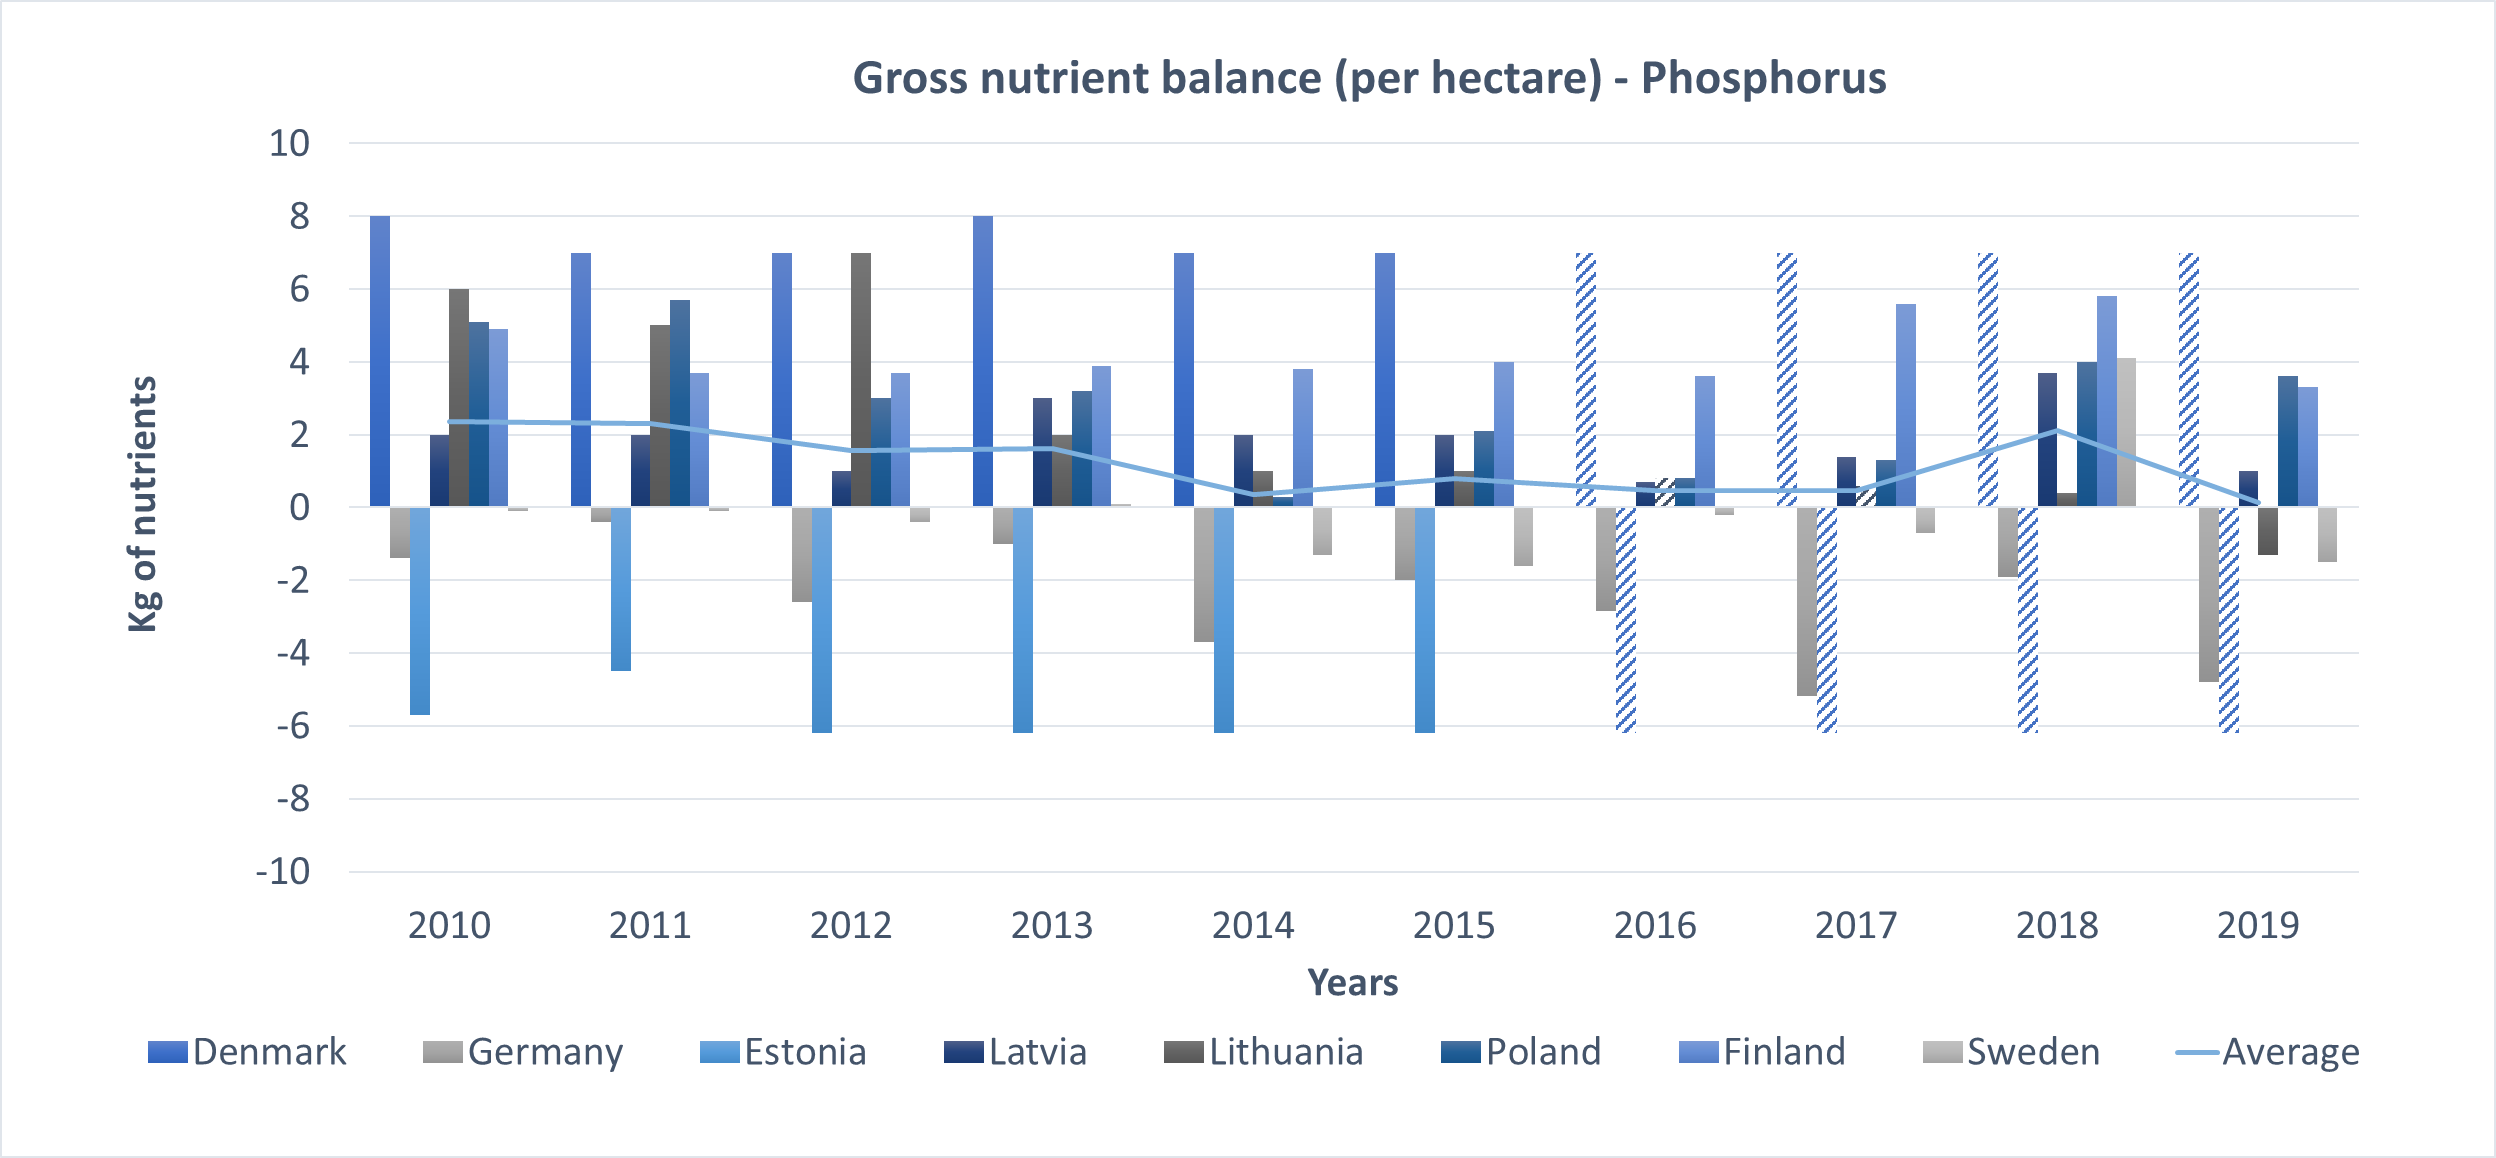
Figure 3: Gross nutrient balance, kilogram of phosphorus per hectare by country and average. Chart does not include data from Russia or any non-HELCOM countries. Data points based on the assumption of no change are indicated with hatched pattern. The data in Eurostat has good temporal coverage for Germany, Poland, Finland, Sweden, Lithuania and Latvia thus the confidence is considered as high.
Confidence
The data in Eurostat has good temporal coverage for Germany, Poland, Finland, Sweden, Lithuania and Latvia thus the confidence is considered as high. However, missing data for Denmark and Estonia required a no change assumption to be applied for several years (2015-2019) for all datasets and no data was available for Russia. This lowers the overall confidence in the outcomes.
Additionally, the spatial resolution of the available data was at the national level. For most HELCOM countries the difference in total national territory and territory in the Baltic Sea catchment is minor. However, as only 8% of Germany drains in the Baltic Sea catchment area, a multiplier of 0.08 was applied to the German data and this was indicated in figure captions. This calculation was not applied to gross nutrient balance data since data was per hectare. Further, the location of animals within the catchment is also important, as animals kept further from the Baltic will have less of an effect on Baltic nutrient levels due to inland nutrient retention. This lowers the overall confidence in the outcomes.
Thus, overall, the indicator evaluation has moderate confidence.
Conclusions
Nutrient balance in the Baltic Sea region has been relatively stable over the past decade although several national trends were observed. Both in nutrient inputs and outputs, Poland has the highest relative contribution. All Baltic Sea countries have nitrogen surpluses per hectare, and the highest surplus values were observed in Denmark driven by high inputs from manure production. Germany and Latvia have shown a decreasing nitrogen surplus trend. Denmark, Germany, and Poland have the highest nitrogen surplus per hectare in parallel with high levels of animal husbandry and crop production. Unlike nitrogen, phosphorus balance shows a more diverse picture with both deficiencies and surpluses. Germany, Estonia, Lithuania and Sweden have shown phosphorus deficiency and the highest deficiency values were observed in Estonia.
In terms of explanation of the input of nutrient pressure, the driver indicators have clarity of impact, while their proximity to the related drivers is relatively poor. Identified trends in nutrient balance components may reflect the nitrogen and phosphorus input to the Baltic Sea, however, these indicators cannot be closely linked to specific relevant drivers like consumer demand, globalization or demographics in the Baltic Sea. Future work should focus on the potential data sources of optimal driver indicators such as use of best available technologies and subsidies and developing more advanced market metrics such as apparent per capita use and self-sufficiency rates.
Links to society and environment (DAPSIM)
Activities
Pressures
The following pressure assessments are carried out through indicator evaluations:
Status
The following status assessments are carried out through indicator evaluations:
- Total nitrogen (TN) concentrations,
- Total Phosphorus (TP) concentrations,
- Dissolved inorganic nitrogen (DIN) concentrations,
- Dissolved inorganic Phosphorus (DIP) concentrations.
Each of these indicators can be considered to have a direct possible relationship with the driver(s) described in this report, in particular on the potential to achieve a state representative of good environmental status (GES). In addition, there are ecological impacts of nutrient concentration increases that are reflected by the distance to achievement (i.e. the distance to threshold value in the state evaluations), as well as indirect eutrophication impacts such as increased algal blooms or reduced water clarity. Furthermore, such impacts may also be transferred through Baltic Sea food webs and have consequences for biodiversity components. Other relevant indicators are available on the HELCOM indicator web page.
Impacts
Impacts on society as a consequence of the distance from GES can also be evaluated, where losses of potential benefits or disruption of human activities can be considered. Either or both of these impacts may catalyse the need for measures.
Measures
Several measures were found related to agricultural nutrient balance. Subsidies, regulations, and technology adoption drivers are well covered by the existing measures from the EU and HELCOM. Further refinement of these measures is always possible. On the other hand, existing measures are not addressing consumer demand, globalization, and demographics.
In this context, new measures can be recommended to address these drivers. In terms of consumer demand, organic food branding does already exist but, while this concept is environmentally beneficial, it is not necessarily addressing nutrient-responsible farming. No similar branding mechanism was found for nutrient responsibility in general, and consumer knowledge about the right amount of nutrient use in agricultural products is weak. Using different types of branding measures, this knowledge gap can be improved. Globalization and demographics largely affect consumer demand, and measures for consumer demand should consider these drivers. It is unclear what measures might target these drivers.
Related measures are listed below:
The Helsinki Convention, Annex III Part 2: Prevention of pollution from agriculture
In accordance with the relevant parts of this Convention, the Contracting Parties shall apply the measures described and take into account Best Environment Practice (BEP) and Best Available Technology (BAT) to reduce the pollution from agricultural activities.
Baltic Sea Regional Nutrient Recycling Strategy
The development of the Baltic Sea Regional Nutrient Recycling Strategy was stipulated by the decision of the HELCOM 2018 Ministerial Meeting which also recognized that, in addition to abating eutrophication, recycling of nutrients could contribute to reducing greenhouse gas emissions and securing phosphorus resources.
Nutrient input reduction scheme
The HELCOM nutrient input reduction scheme is a regional approach to sharing the burden of nutrient reductions to achieve the goal of a Baltic Sea unaffected by eutrophication agreed by the Baltic Sea countries.
The EU Water Framework Directive
The purpose of the EU Water Framework Directive is to establish a framework for the protection of European waters in order for Member States to reach “good status” objectives for water bodies throughout the EU.
The Nitrates Directive forms an integral part of the Water Framework Directive and is one of the key instruments in the protection of waters against agricultural pressures.
Related Baltic Sea Action Plan (BSAP) actions
- E5: Implement and enforce the provisions of part 2 of Annex III “Prevention of pollution from agriculture” of the 1992 Helsinki Convention.
- E10: Discourage application of manure and other organic fertilizers in the autumn in fields without green plant cover in winter
- E13: Develop by 2025 recommendations for Best Available Technology (BAT)/Best Environmental Practice (BEP) to reduce ammonia and greenhouse gas emissions from livestock housing, manure storage and spreading.
- E14: Develop by 2025 recommendations for manure management specifically for horses, sheep, goats, and fur farming.
- E15: Apply as a minimum the EU’s updated Best Available Techniques (BAT) Reference Document and Conclusions on BAT for intensive rearing of poultry and pigs, especially for the facilities located within areas critical to nutrient losses.
- E20: Revise by 2023 the HELCOM Recommendation 24/3 on “Measures aimed at the reduction of emissions and discharges from agriculture” ensuring reduction of agricultural ammonia emissions and considering relevant Best Available Technology (BAT) and Best Environmental Practice (BEP).
- E30: Implement adequate measures, especially in agriculture and wastewater management, to achieve the objectives of the Baltic Sea Regional Nutrient Recycling Strategy by 2027.
- E32: Enhance the use of recycled nutrients in agriculture making use of best available technologies and fertilize according to crop needs.
- E35: Improve the conditions for the development of a market for recycled fertilizer products by setting incentives with the aim of making the use of such products equally attractive to farmers as the use of mineral fertilizers.
Related HELCOM Recommendations
- HELCOM Recommendation 24-3 Measures aimed at the reduction of emissions and discharges from agriculture
- HELCOM Recommendation 41/3: The use of national manure standards
- HELCOM Recommendation 42-43/2 Amendments to Part II Annex III “Criteria and measures concerning the prevention of pollution from land-based sources” of the 1992 Helsinki Convention
Future development
Future development of this indicator may be relevant to bring in more data or more suitable information to build stronger conceptual links within the DAPSIM conceptual management framework. Such developments, as well as the development of other relevant driver indicators associated with the topic, if relevant, may support a better overall understanding processes and thus increase the potential for clear management action.
It is expected that finalization and adoption of the regulation on statistics on agricultural inputs and products will stabilize the availability of agricultural statistics in the future. The indicator should be adapted to fit any changes in data availability caused by the regulation. Additionally, statistics on manure storage facilities and capacities should be considered for future indicators if sufficient data becomes available. Note that proximity of nutrient balance driver indicators to the related drivers is relatively far and they cannot be closely linked. Therefore, future work should also focus on the potential data sources of optimal driver indicators which can explain the relationship of driver and the activity-pressure-pair, such as use of best available technologies and subsidies. In addition, more efforts are required to develop methodologies for supply and demand related optimal driver indicators such as self-sufficiency rates and apparent per capita use.
In terms of data, future work should use spatial data from the German Baltic Sea catchment area and the nutrient area balance of Germany on community level instead of 0.08 catchment area ratio. Further, it is recommended to review the potential use of compilations of pollution load data (PLC) data in the future work, although it was not possible to use in this exercise due to data characteristics.
Beyond HOLAS 3, it is recommended to discuss the relationship between measures and driving forces. Future work should focus on what extent the existing measures address driving forces and how driver indicators can be used to identify required measures.
Methodology
The indicator and report focus on utilizing available data and information to provide an overview of trends in drivers (or proxies indicative of such drivers) that can be informative in a causal framework (i.e., DAPSIM, as applied in HELCOM).
The work carried out represents an initial step towards addressing drivers in HELCOM work and at this stage focusses on selected aspects where 1) experts identified valid potential, and 2) where suitable data were available. The following text describes how such data were handled and utilized.
An overview of the methodology applied can be found in the HOLAS 3 Thematic Assessment of Economic and Social Analyses.
Proposed driver indicators:
While the concept of Drivers in any DAPSI(W)R(M)-based framework is well established, the statistics used to generate indicators of a driver do not necessarily neatly correspond to one of the DAPSI(W)R(M) elements. A driver indicator may very closely represent a driver (for example total population is a direct representation of the demographics driver), closely represent another DAPSI(W)R(M) element (for example the number of fishing days at sea is a direct representation of the Activity of commercial fishing), or not clearly fall into a single DAPSI(W)R(M) element at all (for example agricultural nutrient balance). Additionally, simple proximity to the targeted driver does not make a driver indicator informative. Operating subsidies in commercial fishing are a direct measure of the Subsidy and Regulation Driver but without extensive knowledge about what the operating subsidies are used for, who they target, the tax regime the operator exists in, etc., it is unclear what effect an increase or decrease in the level of operating subsidies would have. On the other hand, despite not being particularly close to any Driver, agricultural nutrient balance is excellent at capturing the cumulative impact of numerous drivers and can be used as tool for illustrating the impact of observed changes in drivers. This multi-dimensional ambiguity was difficult to understand without a way of tracking these topics.
To explore these relationships for proposed potential driver indicators (both for implemented driver indicators and driver indicators rejected for various reasons), quadrant charts were developed. These figures were utilized to explain the proximity to drivers (y-axis) and the clarity of impact (x-axis) for each investigated driver indicator. It is important to highlight that these figures are development tools and can only reflect the information the researchers had at the time of the analysis. Further, the points were qualitatively placed by the Secretariat based on subjective criteria. Differences of opinion are certain to exist. Small changes in the position of points on the chart should be disregarded.
Clarity of impact (x-axis): This axis demonstrates the explanatory power of the driver indicator in capturing the relationship between the Driver and the chosen Activity-Pressure pair (Agriculture-Input of nutrients, Fishing-Fish extraction, Urban uses-Input of nutrients). Changes in the level of data (for example regional vs global population) will affect the clarity of the driver indicator. Indicators with very low clarity of impact were placed on the left side of the chart, while indicators with high clarity of impact were placed on the right side of the chart.
Proximity to driver (y-axis): This axis demonstrates the proximity of indicator to the explained driver. Indicators which were very closely related to driver itself were placed higher on the chart, while indicators which are closer to Activities or Pressures were placed lower on the chart. Points placed closer to the middle were not direct measurements of any particular DAPSI(W)R(M) element and instead capture aspects from multiple elements.
Based on these characteristics, driver indicators were shown in four general categories:
- Optimal driver indicators: Closely related to drivers with high clarity of impact.
- Opaque driver indicators: Closely related to drivers with low clarity of impact.
- Alternate driver indicators: Not closely related to drivers but with high clarity of impact.
- Not useful as driver indicator: Not closely related to drivers and with low clarity of impact.
All driver indicators that were not placed in the “Not useful as a driver indicator” were considered for full development. However, not all these driver indicators were eventually developed due to insufficient time or resources, insufficient data, or the presence of multiple more informative driver indicators.
The charts present a quick overview of the perceived status of investigated driver indicators and suggest potential directions for further development.
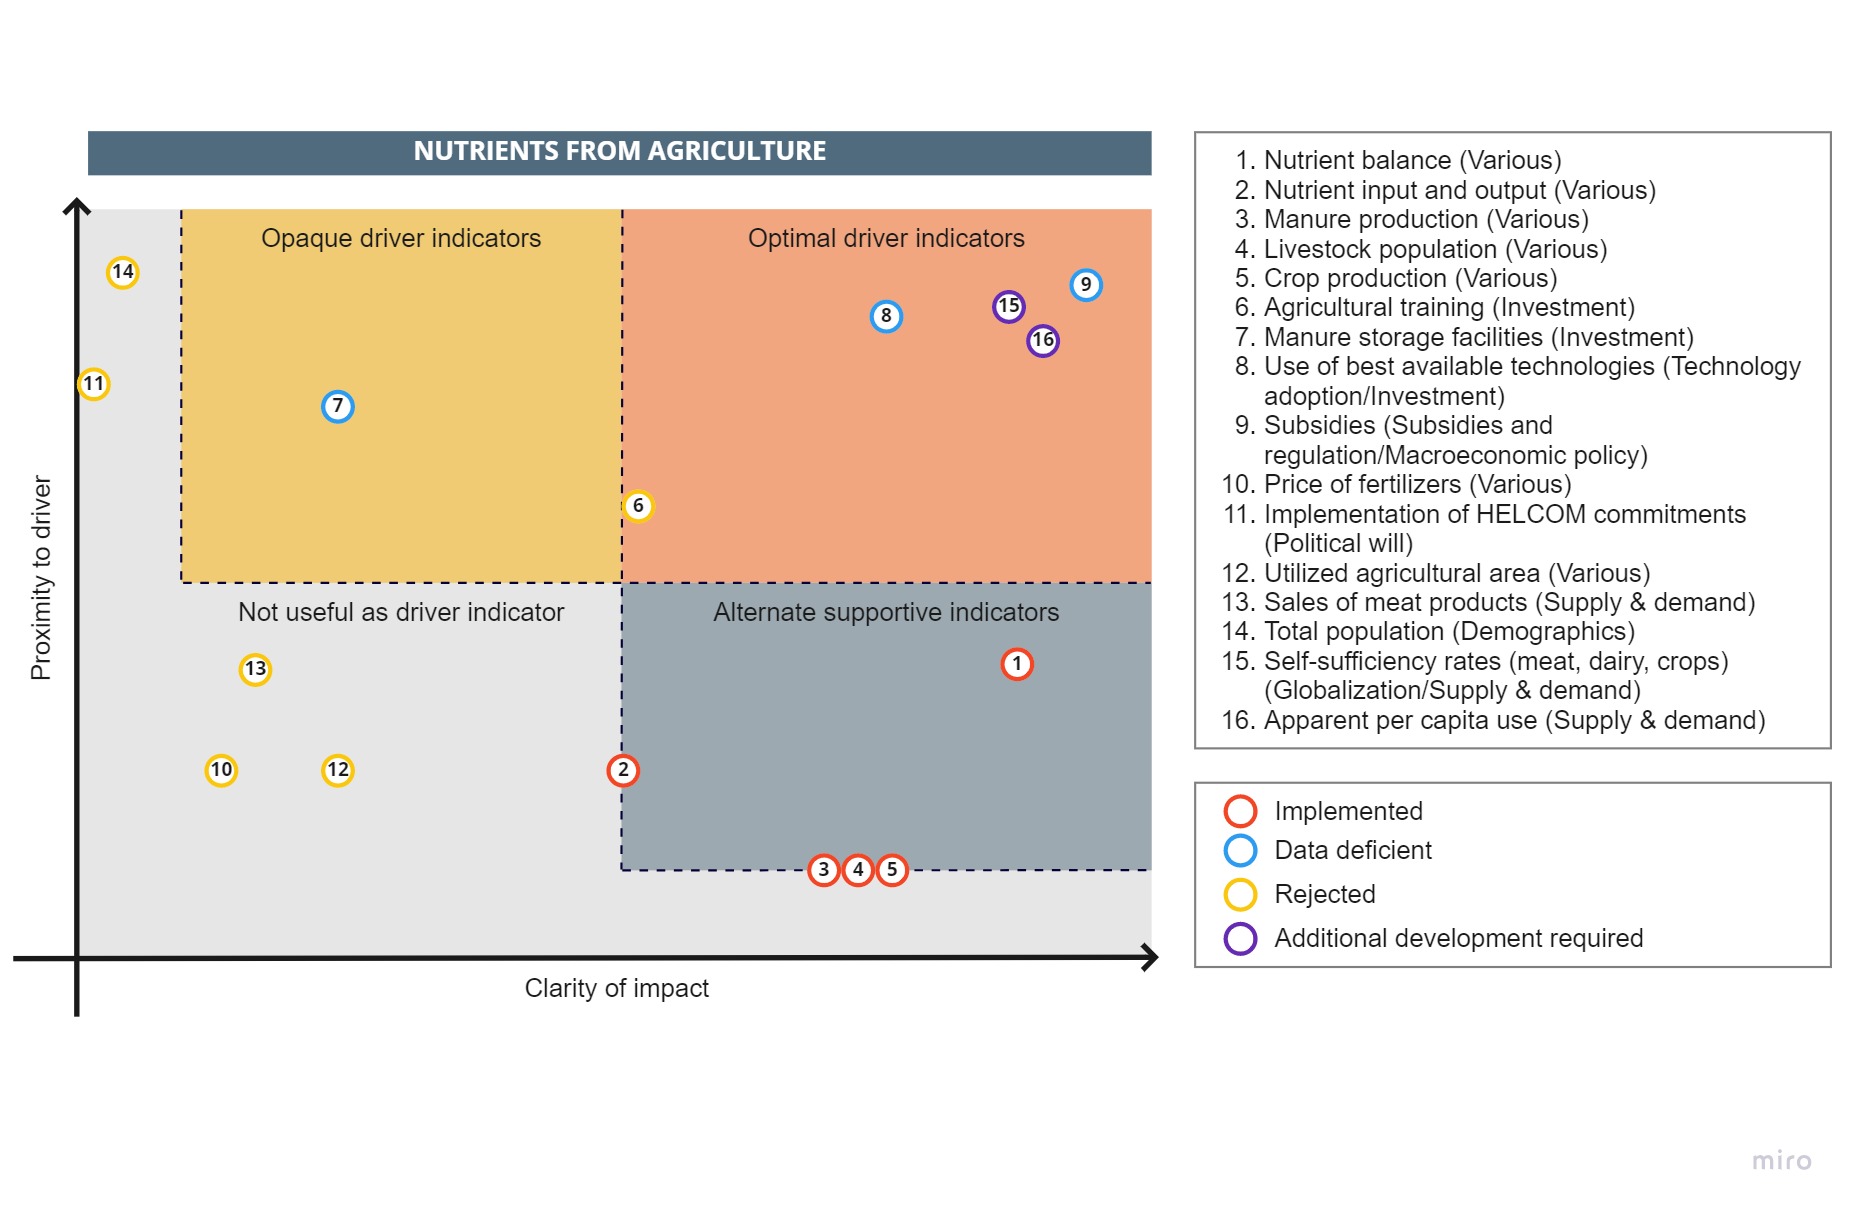
Figure 4. Driver indicators relevant for nutrients from agriculture pressure – activity pair, their proximity to drivers and clarity of impact. Driver indicators were subjectively categorized under opaque driver indicators, optimal driver indicators, not useful as driver indicator and alternate supportive driver indicators categories.
Data processing
Nutrient balance
Gross nutrient balance per hectare dataset was complete for each country. Other datasets (nutrient input total and sub-categories, and nutrient output total and sub-categories) have the same missing data points in specific years. Data for Denmark (2016-2019) and Estonia (2014-2019) are assumed to remain at a constant level (i.e., the last known data point). Lithuanian data for 2016-2018 were calculated using a constant slope between known 2015 and 2019 data points. Latvian data for 2017 was calculated using a constant slope between known 2016 and 2018 data points.
Manure production
Data gaps in total manure nutrient production were filled by summing bovine, pig, and poultry manure nutrient production, and assuming manure nutrient production from other sources to be negligible (e.g., horses, goats, sheep, etc.).
Full bovine and pig livestock counts were available for all countries in all years. Data gaps in bovine and pig manure nutrient production were filled by applying the annual population change to the manure nutrient production values.
Poultry manure production was largely available up to 2014 (Estonia data also missing 2013) and poultry livestock counts were available in 2013 and 2016 for all countries. Poultry livestock counts for 2014 and 2015 were calculated by applying a constant slope between the known 2013 and 2016 data points. Lithuanian manure production values for 2017 were calculated using a constant slope between know 2016 and 2018 data points. For 2017-2019, poultry livestock counts and manure nutrient production values for Denmark and Estonia are assumed to remain at a constant 2016 level. All other remaining data points were filled by applying the annual population change to the manure nutrient production values.
For most HELCOM countries the difference in total national territory and territory in the Baltic Sea catchment is minor. However, as only 8% of Germany drains in the Baltic Sea catchment area, a multiplier of 0.08 was applied to the German data and this was indicated in figure captions. This calculation was not applied to gross nutrient balance data since data was per hectare.
Animal population
Poultry livestock information was only available for 2013 and 2016. All data for 2014 and 2015 were calculated based on the slope between 2013 and 2016 data. For 2017-2019, poultry livestock counts for Denmark and Estonia are assumed to remain at a constant 2016 level. All other remaining data points were filled by converting between poultry livestock counts and manure nutrient production values.
For most HELCOM countries the difference in total national territory and territory in the Baltic Sea catchment is minor. However, as only 8% of Germany drains in the Baltic Sea catchment area, a multiplier of 0.08 was applied to the German data and this was indicated in figure captions. This calculation was not applied to gross nutrient balance data since data was per hectare.
Statistics
Trends in all data sets were analysed using the linear regression function in Microsoft Excel. Results are only presented for significant or near significant (when the p-value was lower than 0.05) increasing and decreasing trends. Stable and fluctuating trends were identified by observation where there is no significant trend (when the p-value was higher than 0.05).
Data
Eurostat data tables:
Gross nutrient balance (aei_pr_gnb)
Nutrient input (aei_pr_gnb)
Fertilizer consumption (aei_pr_gnb)
Nutrient output (aei_pr_gnb)
Manure production (aei_pr_gnb)
Animal livestock (apro_mt_lscatl, apro_mt_lspig, apro_ec_poula)
Crop production (apro_cpsh1)
Contributors
Kemal Pinarbaşi, Luke Dodd, Owen Rowe, Susanna Kaasinen, Jannica Haldin.
Acknowledgements: EG ESA, State and Conservation WG, GEAR WG and participants of workshops leading to this development.
Archive
This current version of the indicator is the first iteration. Future updates or evolution of the indicator document will be provided online, and older versions will be archived via a link in this section of the document.
References
Buckwell, A., Nadeu, E., 2016. Nutrient Recovery and Reuse (NRR) in European Agriculture. A Review of the Issues, Opportunities, and Actions. RISE Foundation, Brussels
Capell, R., Bartosova, A., Tonderski, K., Arheimer, B., Pedersen, S. M., Zilans, A., (2021). From local measures to regional impacts: Modelling changes in nutrient loads to the Baltic Sea. Journal of Hydrology.
de Sherbinin, A., Carr, D., Cassels, S., & Jiang, L. (2007). Population and Environment. Annual review of environment and resources, 32, 345–373. https://doi.org/10.1146/annurev.energy.32.041306.100243
EC (2021), EU agricultural outlook for markets, income and environment, 2021-2031. European Commission, DG Agriculture and Rural Development, Brussels.
European Environment Agency, EEA (2022) EEA Glossary. https://www.eea.europa.eu/help/glossary/eea-glossary. Date accessed: 12/08/2021.
EuroStat, 2022, Manure production, Table aei_pr_gnb accessed from http://ec.europa.eu/eurostat/ Last access date: 15.08.2022
EuroStat, 2022, Bovine population, Table apro_mt_lscatl accessed from http://ec.europa.eu/eurostat/ Last access date: 15.08.2022
EuroStat, 2022, Pig population, Table apro_mt_lspig accessed from http://ec.europa.eu/eurostat/ Last access date: 15.08.2022
EuroStat, 2022, Utilised agricultural area (UAA) managed by low-, medium- and high-input farms, Table aei_ps_inp accessed from http://ec.europa.eu/eurostat/ Last access date: 15.08.2022
EuroStat, 2016, Poultry annual data, Table apro_ec_poula accessed from http://ec.europa.eu/eurostat/ Last access date: 15.08.2022
Franck, C., Grandi, S. M. & Eisenberg, M. J. Agricultural subsidies and the American obesity epidemic. Am. J. Preventive Med. 45, 327–333 (2013).
Hazell, P., & Wood, S. (2008). Drivers of Change in Global Agriculture. Philosophical Transactions: Biological Sciences, 363(1491), 495–515. http://www.jstor.org/stable/20208446
HELCOM. 2011, Fifth Baltic Sea Pollution Load Compilation (PLC-5). Baltic Sea Environment Proceedings No. 128
HELCOM. 2020, Indicator Manual Version 2020-1. Baltic Sea Environment Proceedings n°175. HELCOM
HELCOM. 2021, Background information on the Baltic Sea catchment area for the Seventh Baltic Sea Pollution load compilation (PLC-7).
Hong B, Swaney DP, Mörth CM, Smedberg E, Eriksson Hägg H, Humborg C, Howarth RW, Bouraoui F (2012) Evaluating regional variation of net anthropogenic nitrogen and phosphorus inputs (NANI/NAPI), major drivers, nutrient retention pattern and management implications in the multinational areas of Baltic Sea basin. Ecol Model 227:117–135
Huang, J., Yang, J., & Rozelle, S. (2010). China’s agriculture: drivers of change and implications for China and the rest of world. Agricultural Economics, 41, 47–55. doi:10.1111/j.1574-0862.2010.00487.x
IPBES: Global assessment report on biodiversity and ecosystem services of the Intergovernmental Science-Policy Platform on Biodiversity and Ecosystem Services, 2019. E. S. Brondizio, J. Settele, S. Díaz, and H. T. Ngo (editors). IPBES secretariat, Bonn, Germany. 1148 pages. https://doi.org/10.5281/zenodo.3831673
Jacques, Peter (2006). Globalization and the World Ocean. Globalization and the Environment Series. Lanham, MD: Alta Mira Press.
Lehn, Friederike et al. (2019): National Nutrient Balances in the Baltic Sea Region. Online unter: https://www.openagrar.de/receive/openagrar_mods_00064303.
Maffezzoli, F.A., Ardolino, M., Bacchetti, A., Perona, M., & Renga, F. (2022). Agriculture 4.0: a systematic literature review on the paradigm, technologies and benefits. Futures.
Mandal, Subhadeep & Banik, Ganesh. (2022). Application of Biosensors in Precision Agriculture. 10.1016/B978-0-12-822548-6.00150-3.
Moss B. Water pollution by agriculture. Philos Trans R Soc Lond B Biol Sci. 2008 Feb 12;363(1491):659-66. doi: 10.1098/rstb.2007.2176. PMID: 17666391; PMCID: PMC2610176.
Niskanen, O., Iho, A., & Kalliovirta, L. (2020). Scenario for structural development of livestock production in the Baltic littoral countries. Agricultural Systems, 179, [102771]. https://doi.org/10.1016/j.agsy.2019.102771
Oenema, O., Oudendag, D., Velthof, G.L., 2007. Nutrient losses from manure management in the European Union. Livest. Sci. 112, 261–272.
Pardey P. G. and Alston J. M., (2021) The Drivers of US Agricultural Productivity Growth, Federal Reserve Bank of Kansas City
Pe’er, G. et al. A greener path for the EU Common Agricultural Policy. Science 365, 449–451 (2019).
Pihlainen, S., Zandersen, M., Hyytiäinen, K., Andersen, H. E., Bartosova, A., Gustafsson, B., Jabloun, M., McCrackin, M., Meier, H. E. M., Olesen, J. E., Saraiva, S., Swaney, D., & Thodsen, H. (2020). Impacts of changing society and climate on nutrient loading to the Baltic Sea. The Science of the Total Environment, 731, [138935]. https://doi.org/10.1016/j.scitotenv.2020.138935
Rahman, Md. Mizanur & Alam, Mohammad & Islam, Md. Moshiul & Kamal, Mohammed & Rahman, G K M Mustafizur & Haque, M. & Miah, Md & Biswas, Jatish. (2022). Potential of legume-based cropping systems for climate change adaptation and mitigation. 10.1016/B978-0-323-85797-0.00030-6.
Rizov, M., Pokrivcak, J. and Ciaian, P. (2013), CAP Subsidies and Productivity of the EU Farms. J Agric Econ, 64: 537-557. https://doi.org/10.1111/1477-9552.12030
OECD (2018). Agricultural Policy Monitoring and Evaluation
OECD (2019), Innovation, Productivity and Sustainability in Food and Agriculture: Main Findings from Country Reviews and Policy Lessons, OECD Food and Agricultural Reviews, OECD Publishing, Paris, https://doi.org/10.1787/c9c4ec1d-en.
Sands, Ronald D., Carol A. Jones, and Elizabeth Marshall. Global Drivers of Agricultural Demand and Supply, ERR-174, U.S. Department of Agriculture, Economic Research Service, September 2014
Springmann, M., Freund, F. Options for reforming agricultural subsidies from health, climate, and economic perspectives. Nat Commun 13, 82 (2022). https://doi.org/10.1038/s41467-021-27645-2
Sundblad, E.-L., Grimvall, A. and Zweifel, U. L. (2021) Societal drivers behind pressures on the marine environment. Report no. 2021:4, the Swedish Institute for the Marine Environment.
Withers, P.J.A.; Neal, C.; Jarvie, H.P.; Doody, D.G. (2014) Agriculture and Eutrophication: Where Do We Go from Here? Sustainability 2014, 6, 5853-5875. https://doi.org/10.3390/su6095853
Tybirk, K., Luostarinen, S., Hamelin, L., Rodhe, L. Haneklaus, S., Poulsen, H.D. and Jensen, A.L.S. 2013. Sustainable manure management in the Baltic Sea Region.
Annex
Supporting indicators Nutrient inputs
The gross nutrient balance calculation includes three categories of nutrient inputs: consumption of fertilizers (except manure), input of manure, other inputs. The other inputs category includes a wide variety of nutrient sources including biological fixation of nitrogen by leguminous crops and atmospheric deposition for nitrogen.
Agricultural nitrogen inputs have remained stable over the past decade both overall and for each input subcategory (Figures 3 and 4). Both Germany (F1,8 = 6.261, p = 0.036) and Lithuania (F1,8 = 9.721, p = 0.014) have shown a decreasing trend, while Sweden (F1,8 = 6.631, p = 0.032) has shown an increasing trend.
Nitrogen input sub-categories have remained stable at the regional level (Annex Figure 2), however several national trends exist. Latvia (F1,8 = 0.698, p < 0.001), Lithuania (F1,8 = 27.351, p < 0.001), and Sweden (F1,8 = 9.996, p = 0.013) have an increasing trend in nitrogen fertilizer consumption. In terms of nitrogen contribution from manure production, Germany (F1,8 = 5.604, p = 0.045) and Finland (F1,8 = 16.502, p = 0.003) have shown decreasing trends, while Sweden (F1,8 = 20.607, p < 0.001) has shown an increasing trend.
Poland has the largest amount of utilized agricultural area in the Baltic Sea catchment area (48% of total utilized agricultural area in the Baltic Sea catchment area; Eurostat 2022). Consequently, Poland has the largest impact on nitrogen input by contributing to 51% of the total agricultural nitrogen inputs. Denmark also has a noticeably high nitrogen input driven by manure production. Estonia and Latvia have the lowest amount of nitrogen input among the Baltic Sea countries. Fertilizer consumption has the highest contribution both to nitrogen and phosphorus input (50%). It comprises 1,942,000 tonnes of nitrogen and 250,000 tonnes of phosphorus in the Baltic Sea countries (Eurostat, 2022).
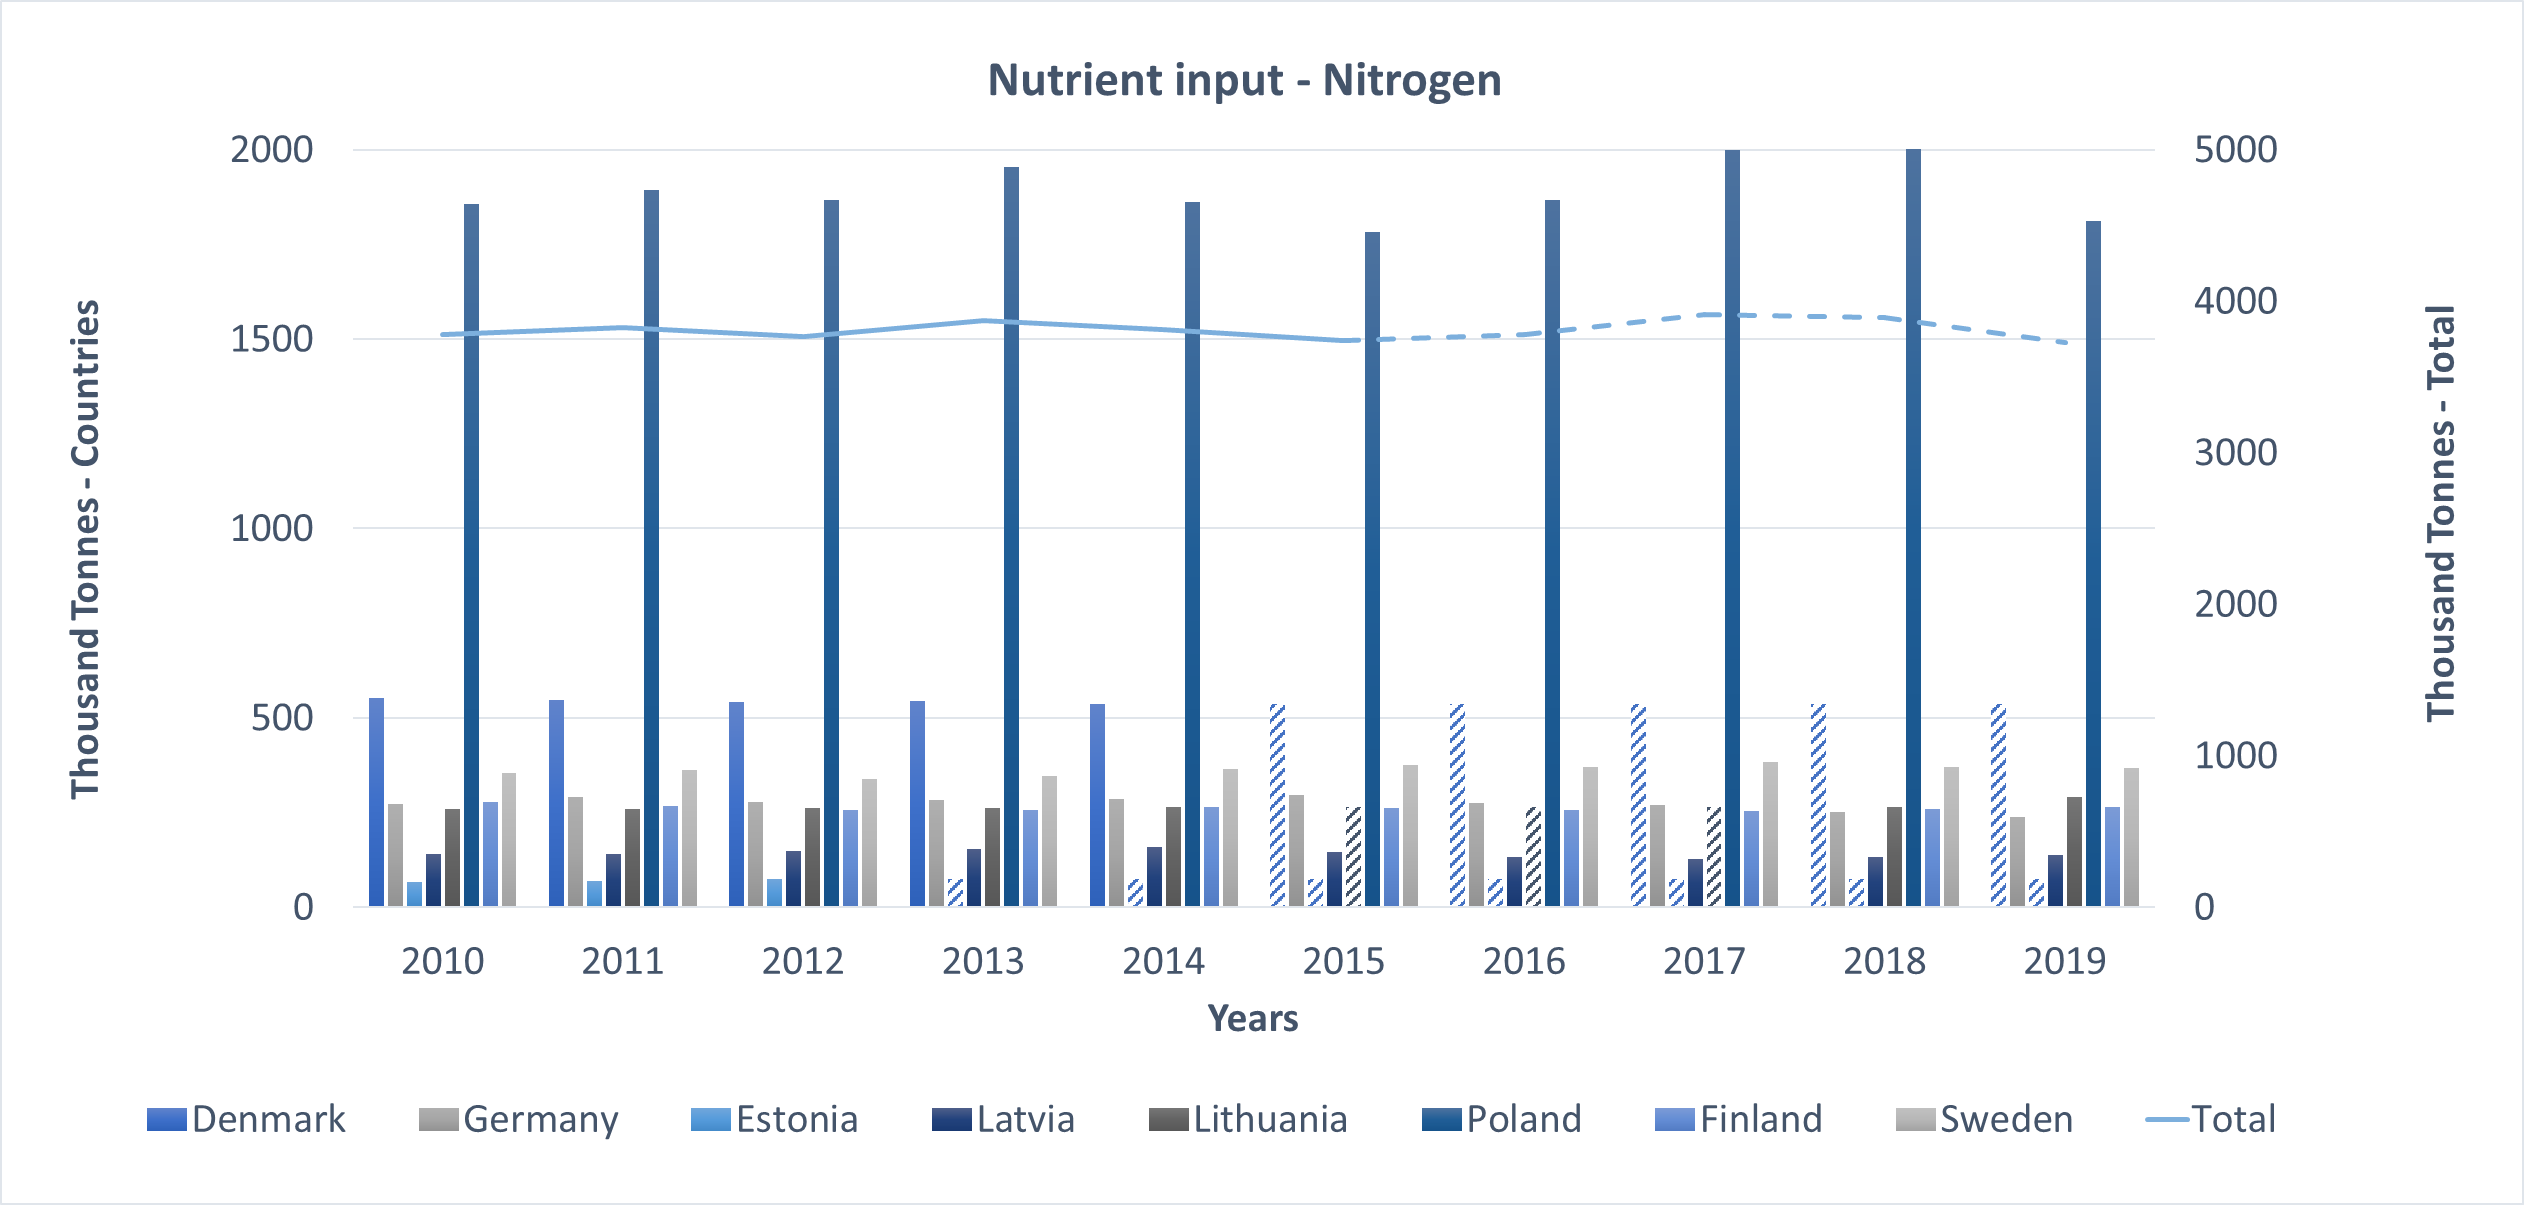
Annex Figure 1: Total nitrogen input chart by country (left axis) and total (right axis). Charts do not include data from Russia or any non-HELCOM countries. Data points based on the assumption of no change are indicated with hatched pattern. German data was multiplied by the ratio of national territory in the Baltic Sea catchment area (0.08).
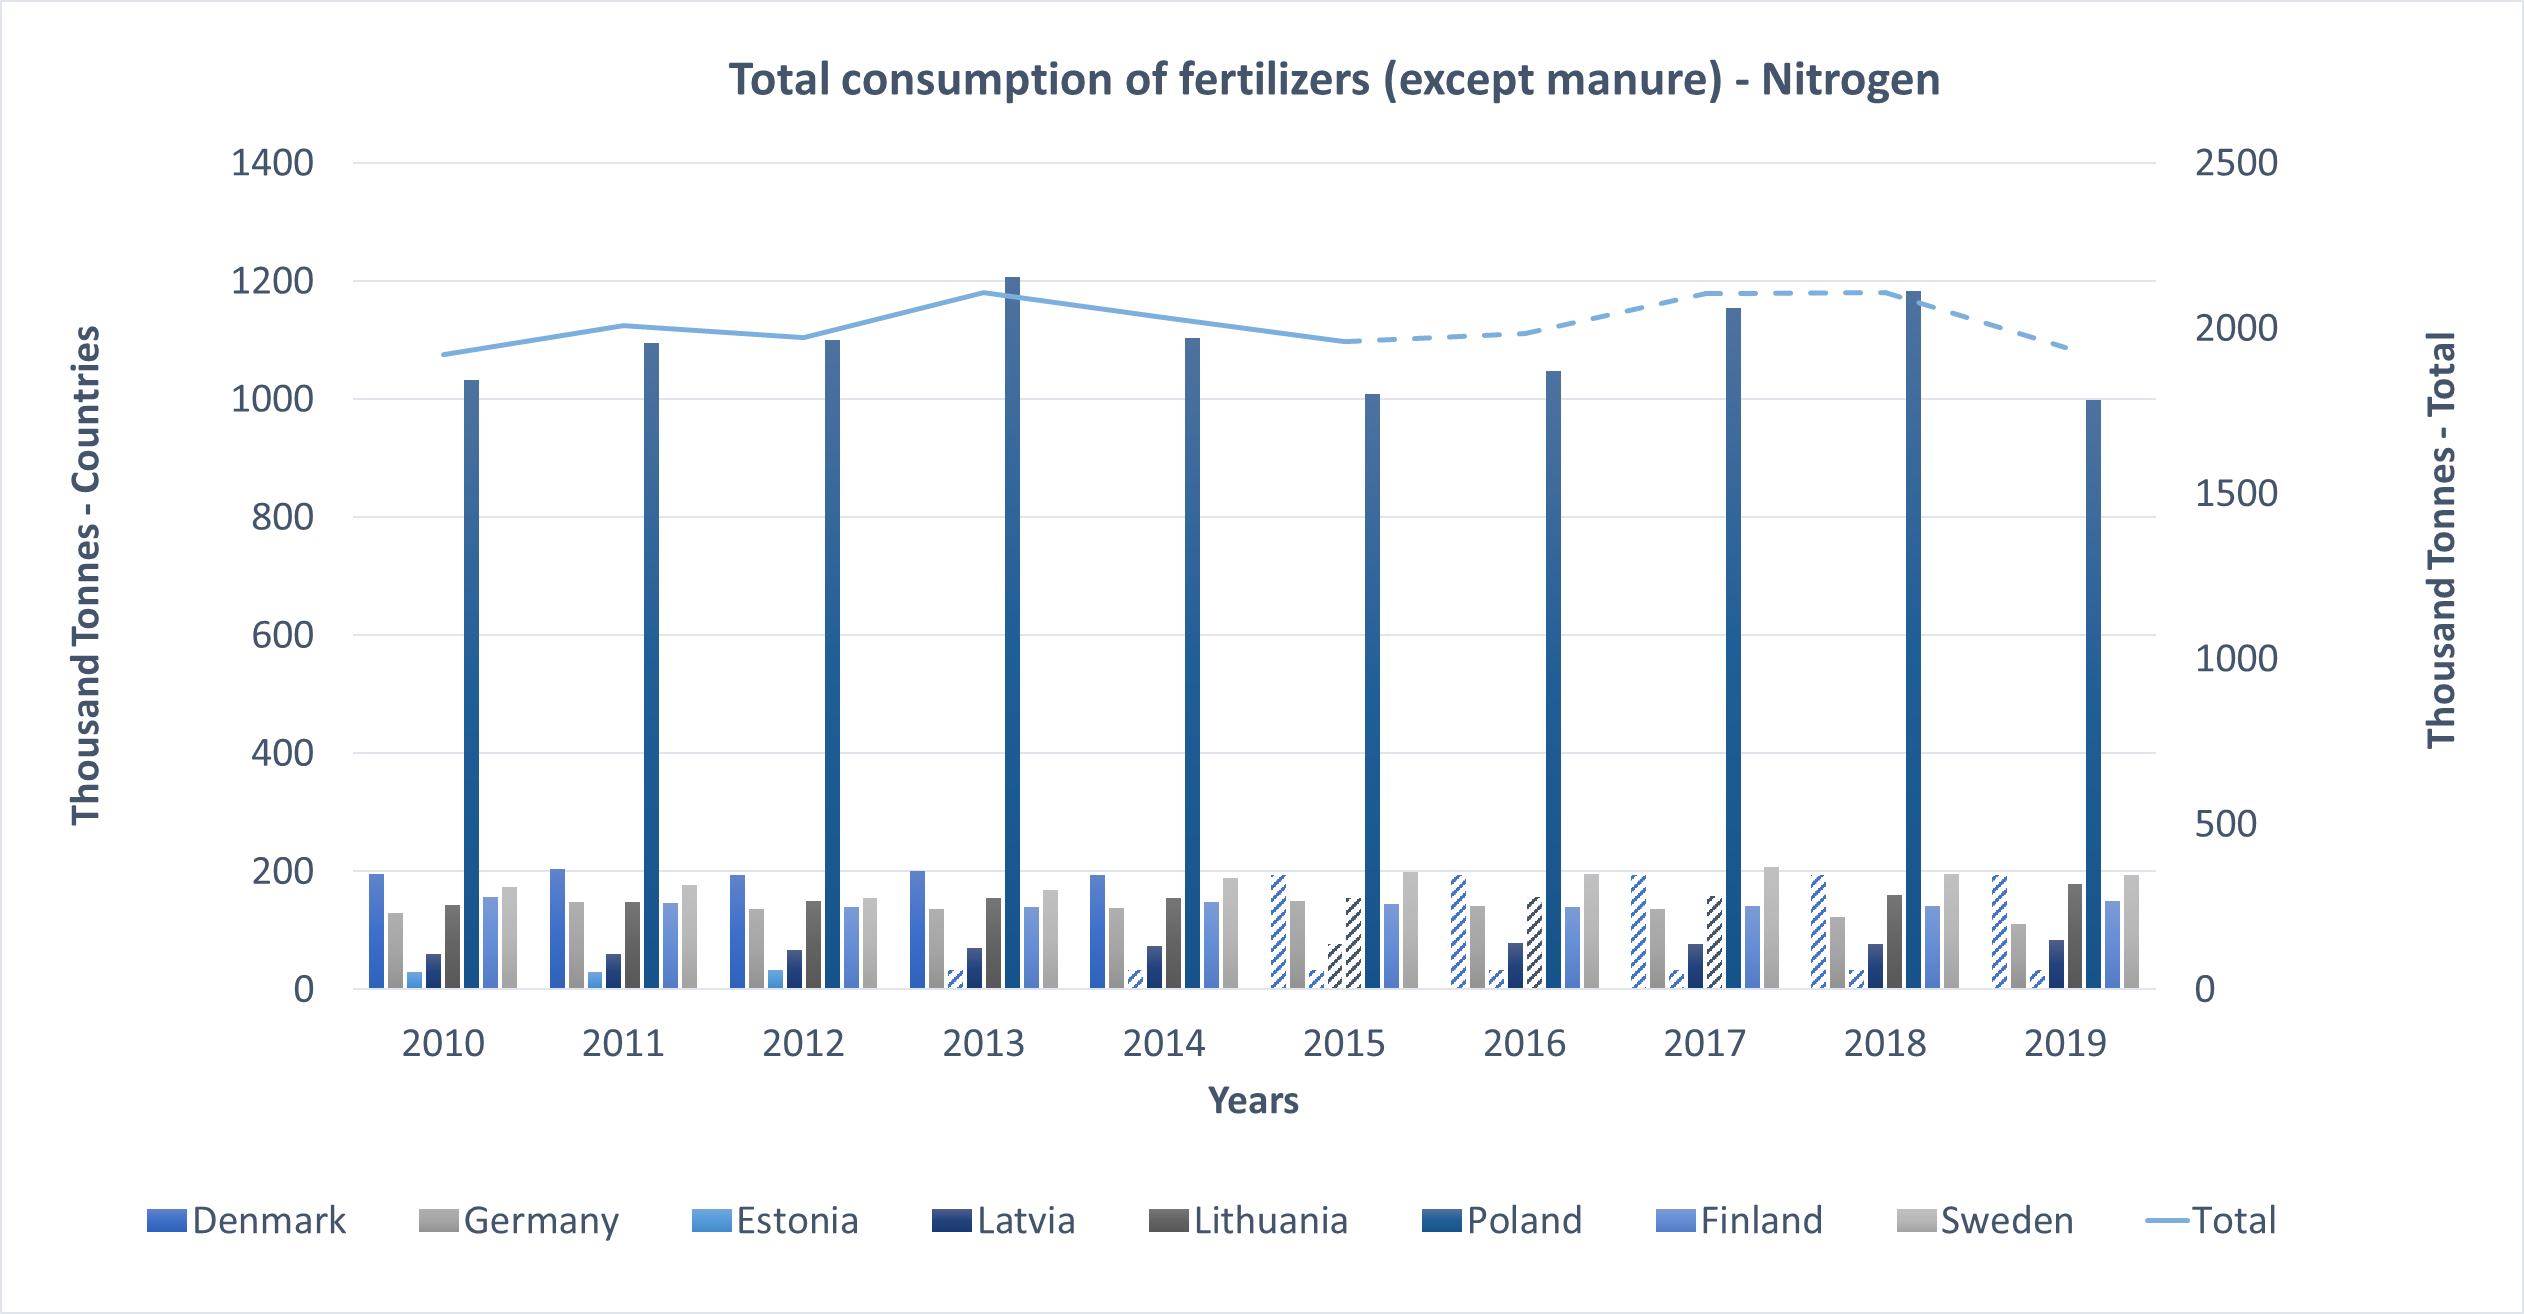
Annex Figure 2: Nitrogen input sub-categories, consumption of nitrogen fertilizers and nitrogen contribution from manure production charts by country (left axis) and total (right axis). Charts do not include data from Russia or any non-HELCOM countries. Data points based on the assumption of no change are indicated with hatched pattern. German data was multiplied by the ratio of national territory in the Baltic Sea catchment area (0.08).
Agricultural phosphorus inputs to the Baltic Sea region have remained stable over the past decade (Annex Figure 3), however many significant national trends exist. Both Latvia (F1,8 = 26.121, p = 0.009) and Sweden (F1,8 = 58.531, p < 0.001) have significantly increased inputs while Germany (F1,8 = 9.682, p = 0.014) and Lithuania (F1,8 = 10.028, p = 0.013) have decreased over the same time frame. Phosphorus input sub-categories have also remained stable at the regional level (Annex Figure 4). However, the national trends present in total phosphorus input are driven by significant changes one or more sub-categories: fertilizer consumption – increasing trends: Latvia (F1,8 = 86.522, p < 0.001), Sweden (F1,8 = 58.194, p < 0.001), fertilizer consumption – decreasing trends: Germany (F1,8 = 4.470, p = 0.067), Lithuania (F1,8 = 10.249, p = 0.013); manure production – decreasing trend: Germany (F1,8 = 14.016, p = 0.006). Similar to nitrogen input, Poland has the largest proportion by contributing to 53% of the total nitrogen input.
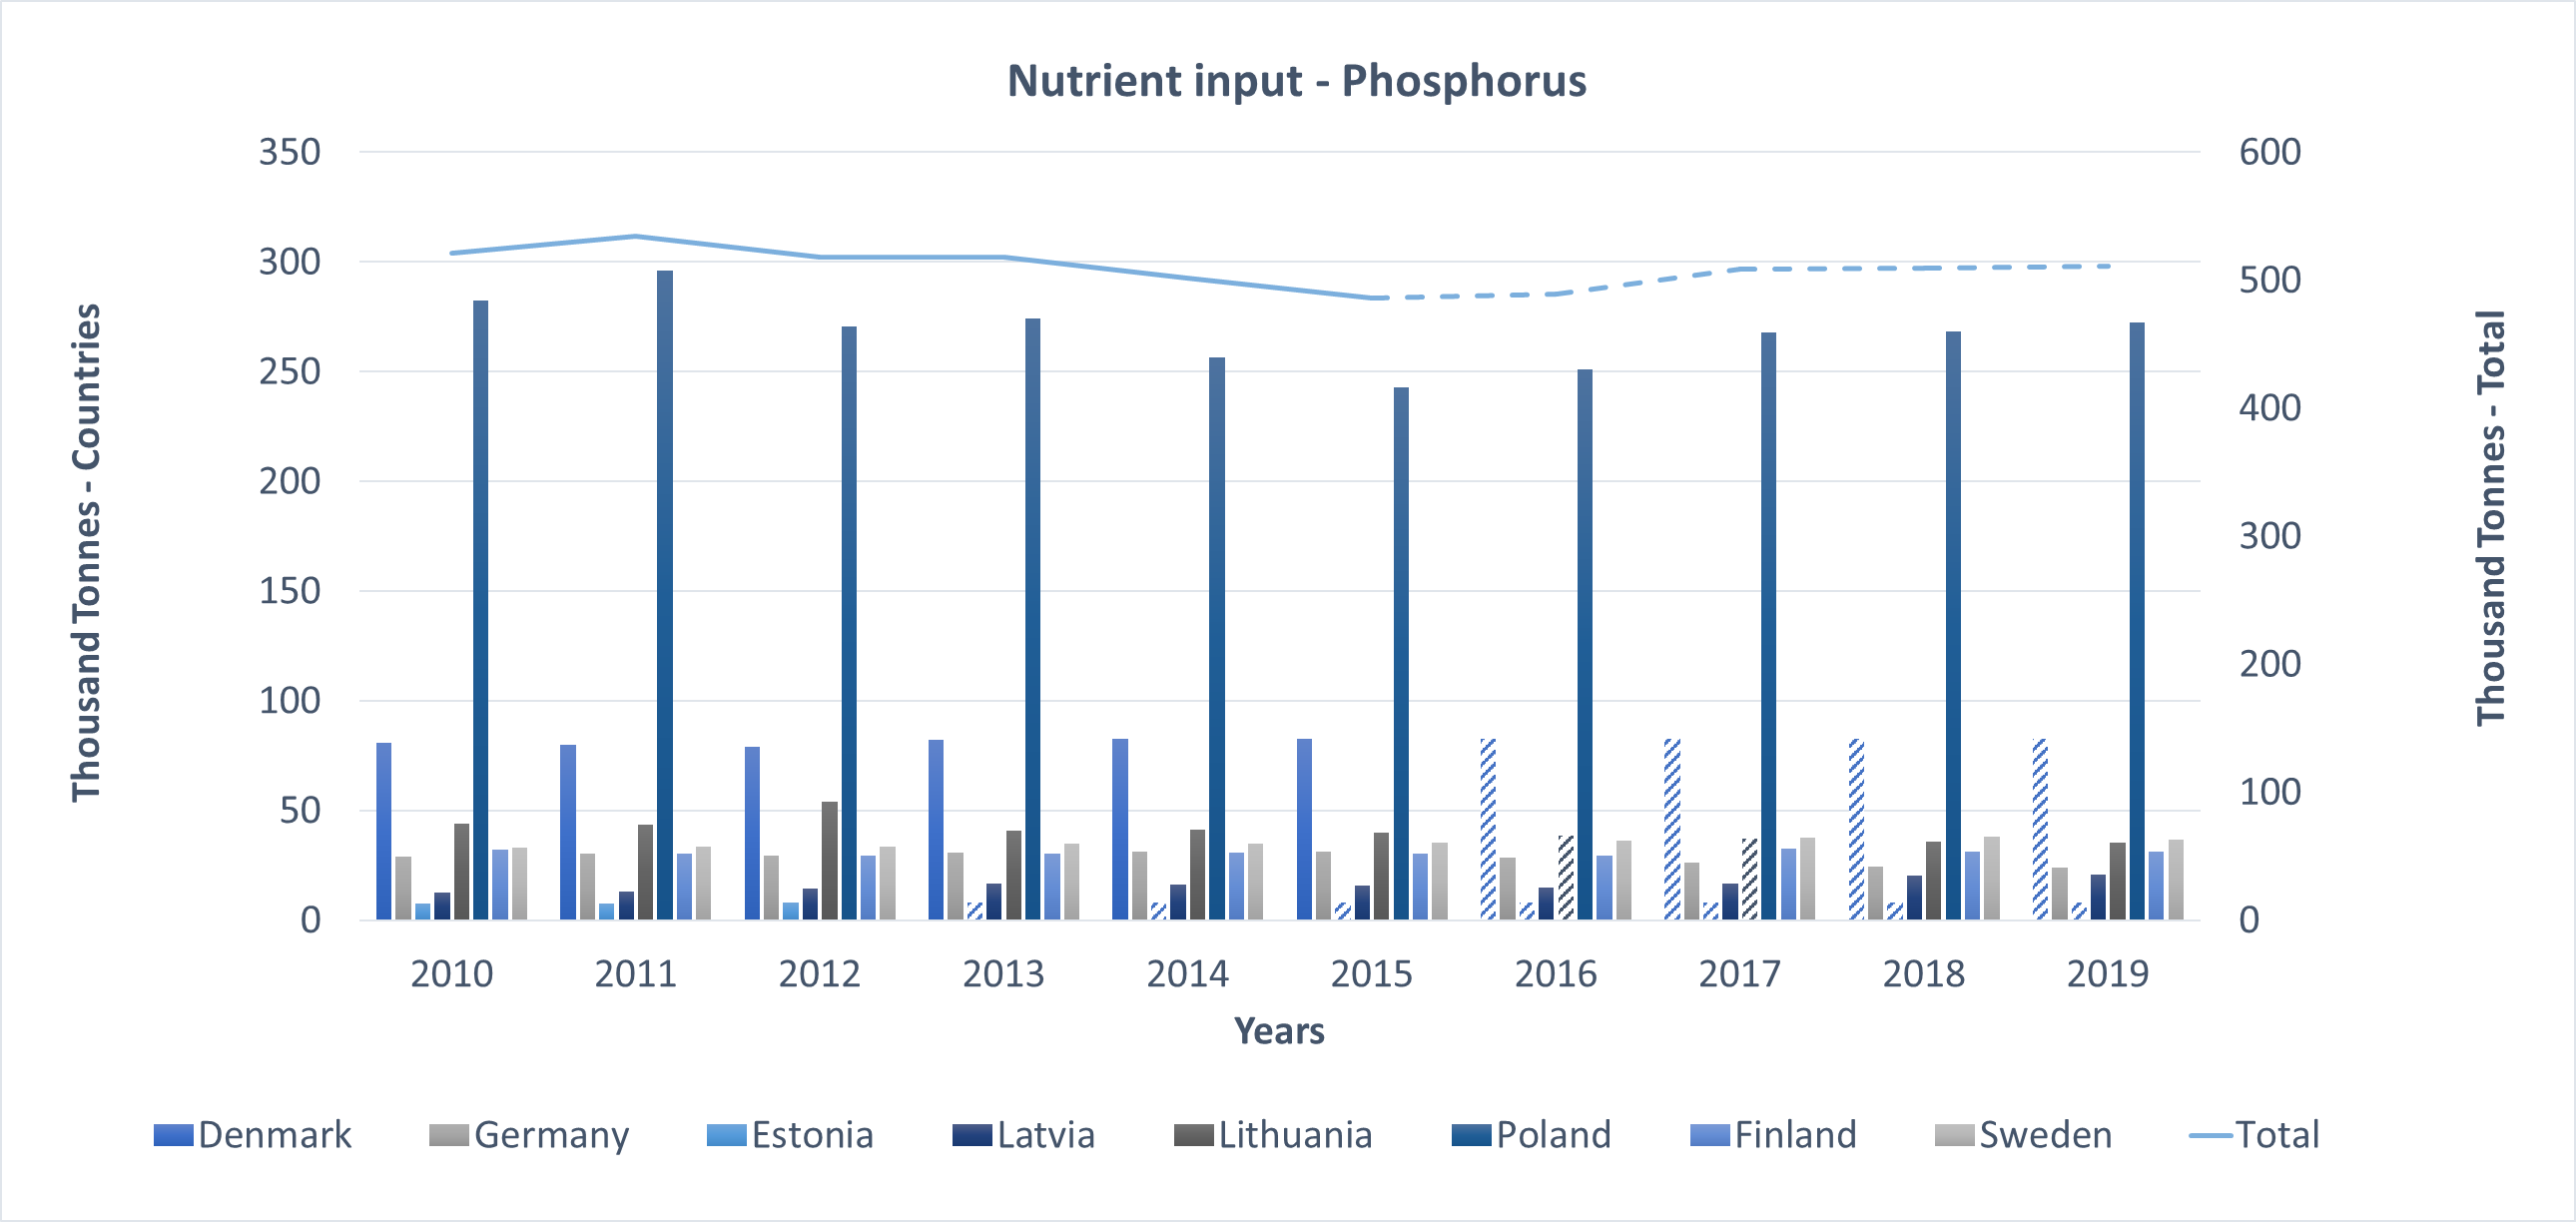
Annex Figure 3: Total phosphorus input chart by country (left axis) and total (right axis). Charts do not include data from Russia or any non-HELCOM countries. Data points based on the assumption of no change are indicated with hatched pattern. German data was multiplied by the ratio of national territory in the Baltic Sea catchment area (0.08).
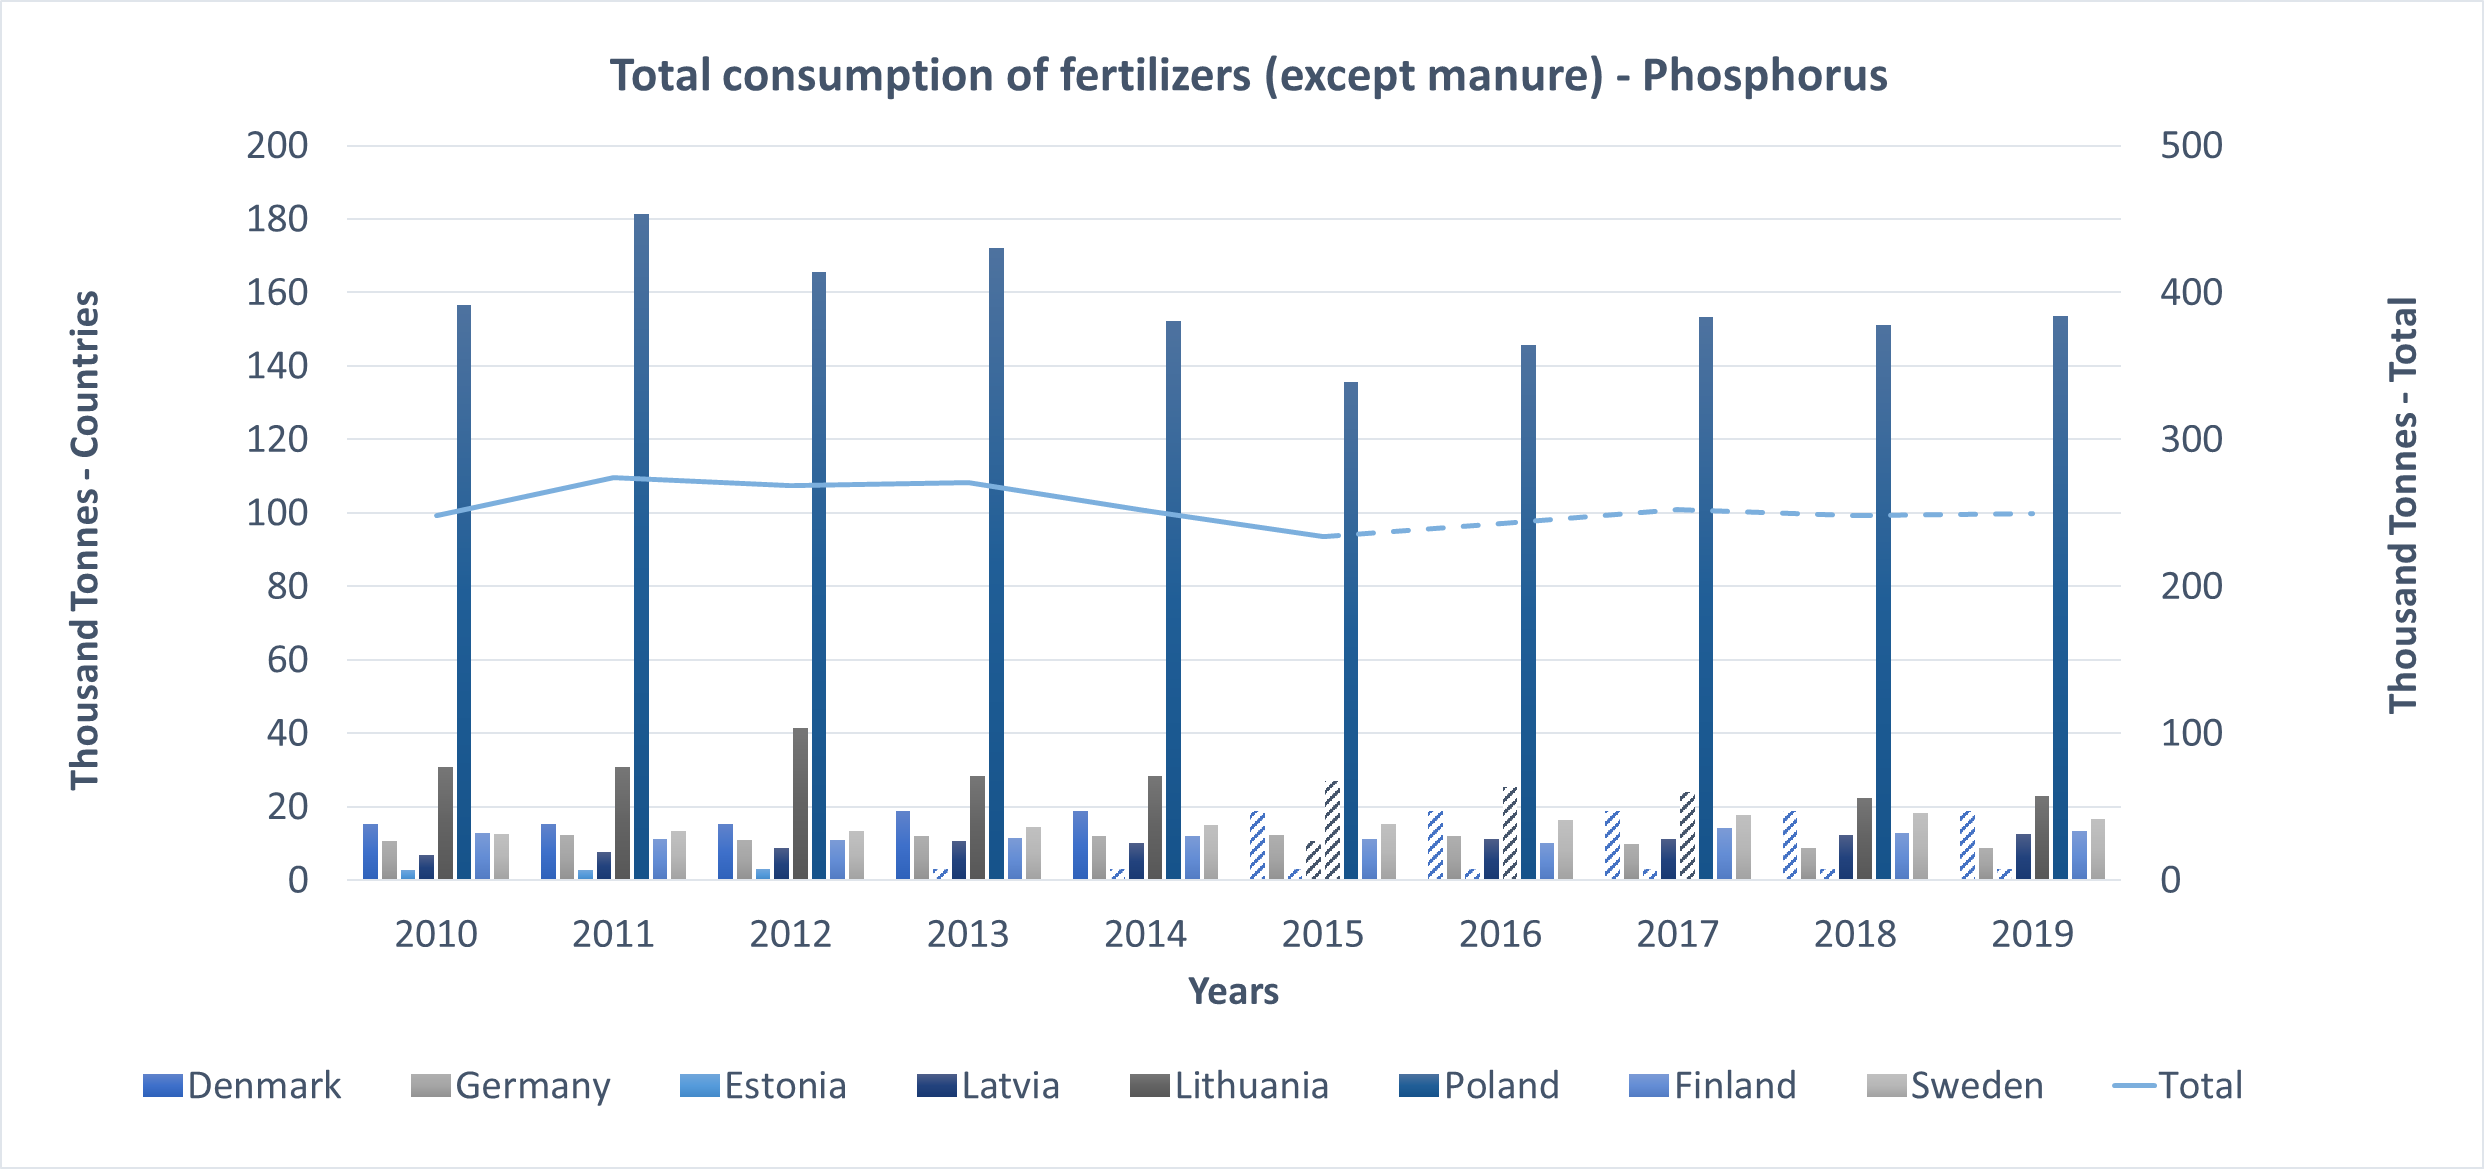

Annex Figure 4: Phosphorus input sub-categories, consumption of phosphorus fertilizers and phosphorus contribution from manure production charts by country (left axis) and total (right axis). Charts do not include data from Russia or any non-HELCOM countries. Data points based on the assumption of no change are indicated with hatched pattern. German data was multiplied by the ratio of national territory in the Baltic Sea catchment area (0.08).
Other inputs
Except fertilizer consumption and manure input, other inputs such as biological fixation of nitrogen by leguminous crops, grass-legume mixtures and atmospheric deposition on agricultural soils were considered in Eurostat total nutrient input calculation. Leguminous plants are for instance pulses, clover, lucerne, and soybean. The leguminous fixation of clover or other leguminous mixtures in permanent and temporary grassland is also considered. Nitrogen contribution from the other inputs (F1,8 = 17.615, p < 0.003) has shown a decreasing trend while phosphorus contribution from the other inputs has remained stable over the past decade.
Nutrient outputs
The gross nutrient balance calculation includes three categories of nutrient outputs: the removal of nutrients by the harvest of crops, the removal of nutrients through the harvest and grazing of fodder, and crop residues removed from the field.
Crop harvesting and fodder harvesting, and grazing represent the vast majority of the total nutrient outputs (57% and 46%, respectively). As in nitrogen input, Poland has the largest impact on nitrogen output. Denmark and Sweden have a noticeably high nitrogen and phosphorus output driven by both crop harvesting and fodder harvesting and grazing. Crop residues removed from the field has a very low contribution to the total nutrient output (3%, Figure 1), therefore, crop residues removed from the field were not analysed in depth.
There was a stable trend in agricultural nitrogen output both in overall and each output sub-category between 2010 and 2019 (Annex Figure 5 and 6), however national trends were observed in several sub-categories. Latvia (F1,8 = 34.764, p < 0.001) and Lithuania (F1,8 = 5.345, p = 0.049) have shown a significant increasing trend in nitrogen removal by crop harvesting. In contrast, Latvia (F1,8 = 13.433, p = 0.006) and Lithuania (F1,8 = 85.259, p < 0.001) have shown a significant decreasing trend in removal by harvesting or grazing of fodder.
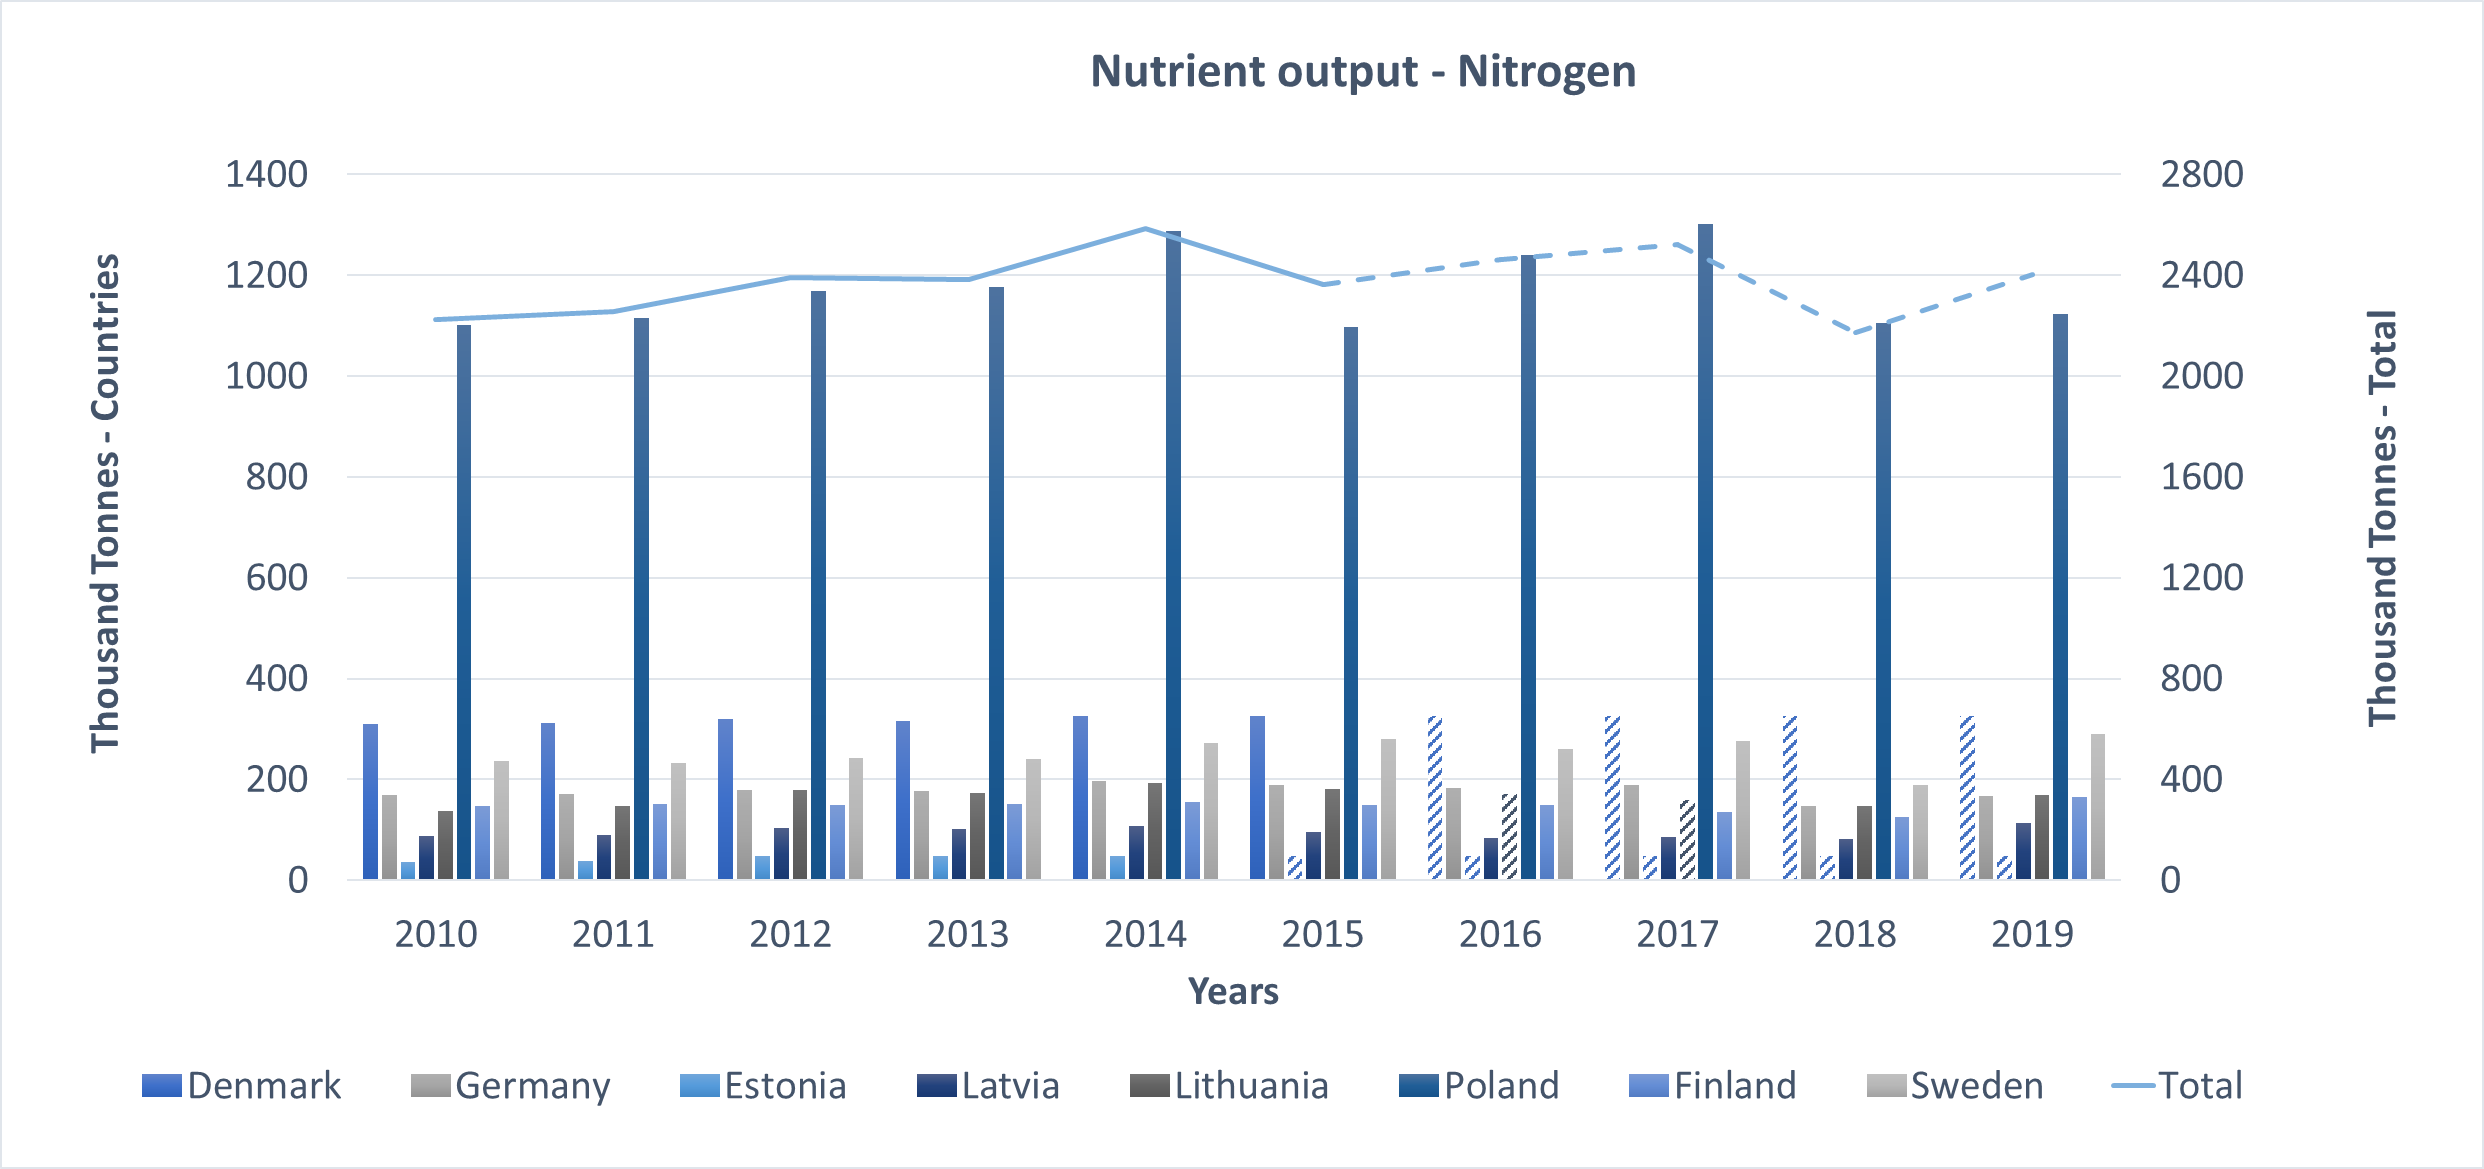
Annex Figure 5: Total nitrogen output by country (left axis) and total (right axis). Chart does not include data from Russia or any non-HELCOM countries. Data points based on the assumption of no change are indicated with hatched pattern. German data was multiplied by the ratio of national territory in the Baltic Sea catchment area (0.08).
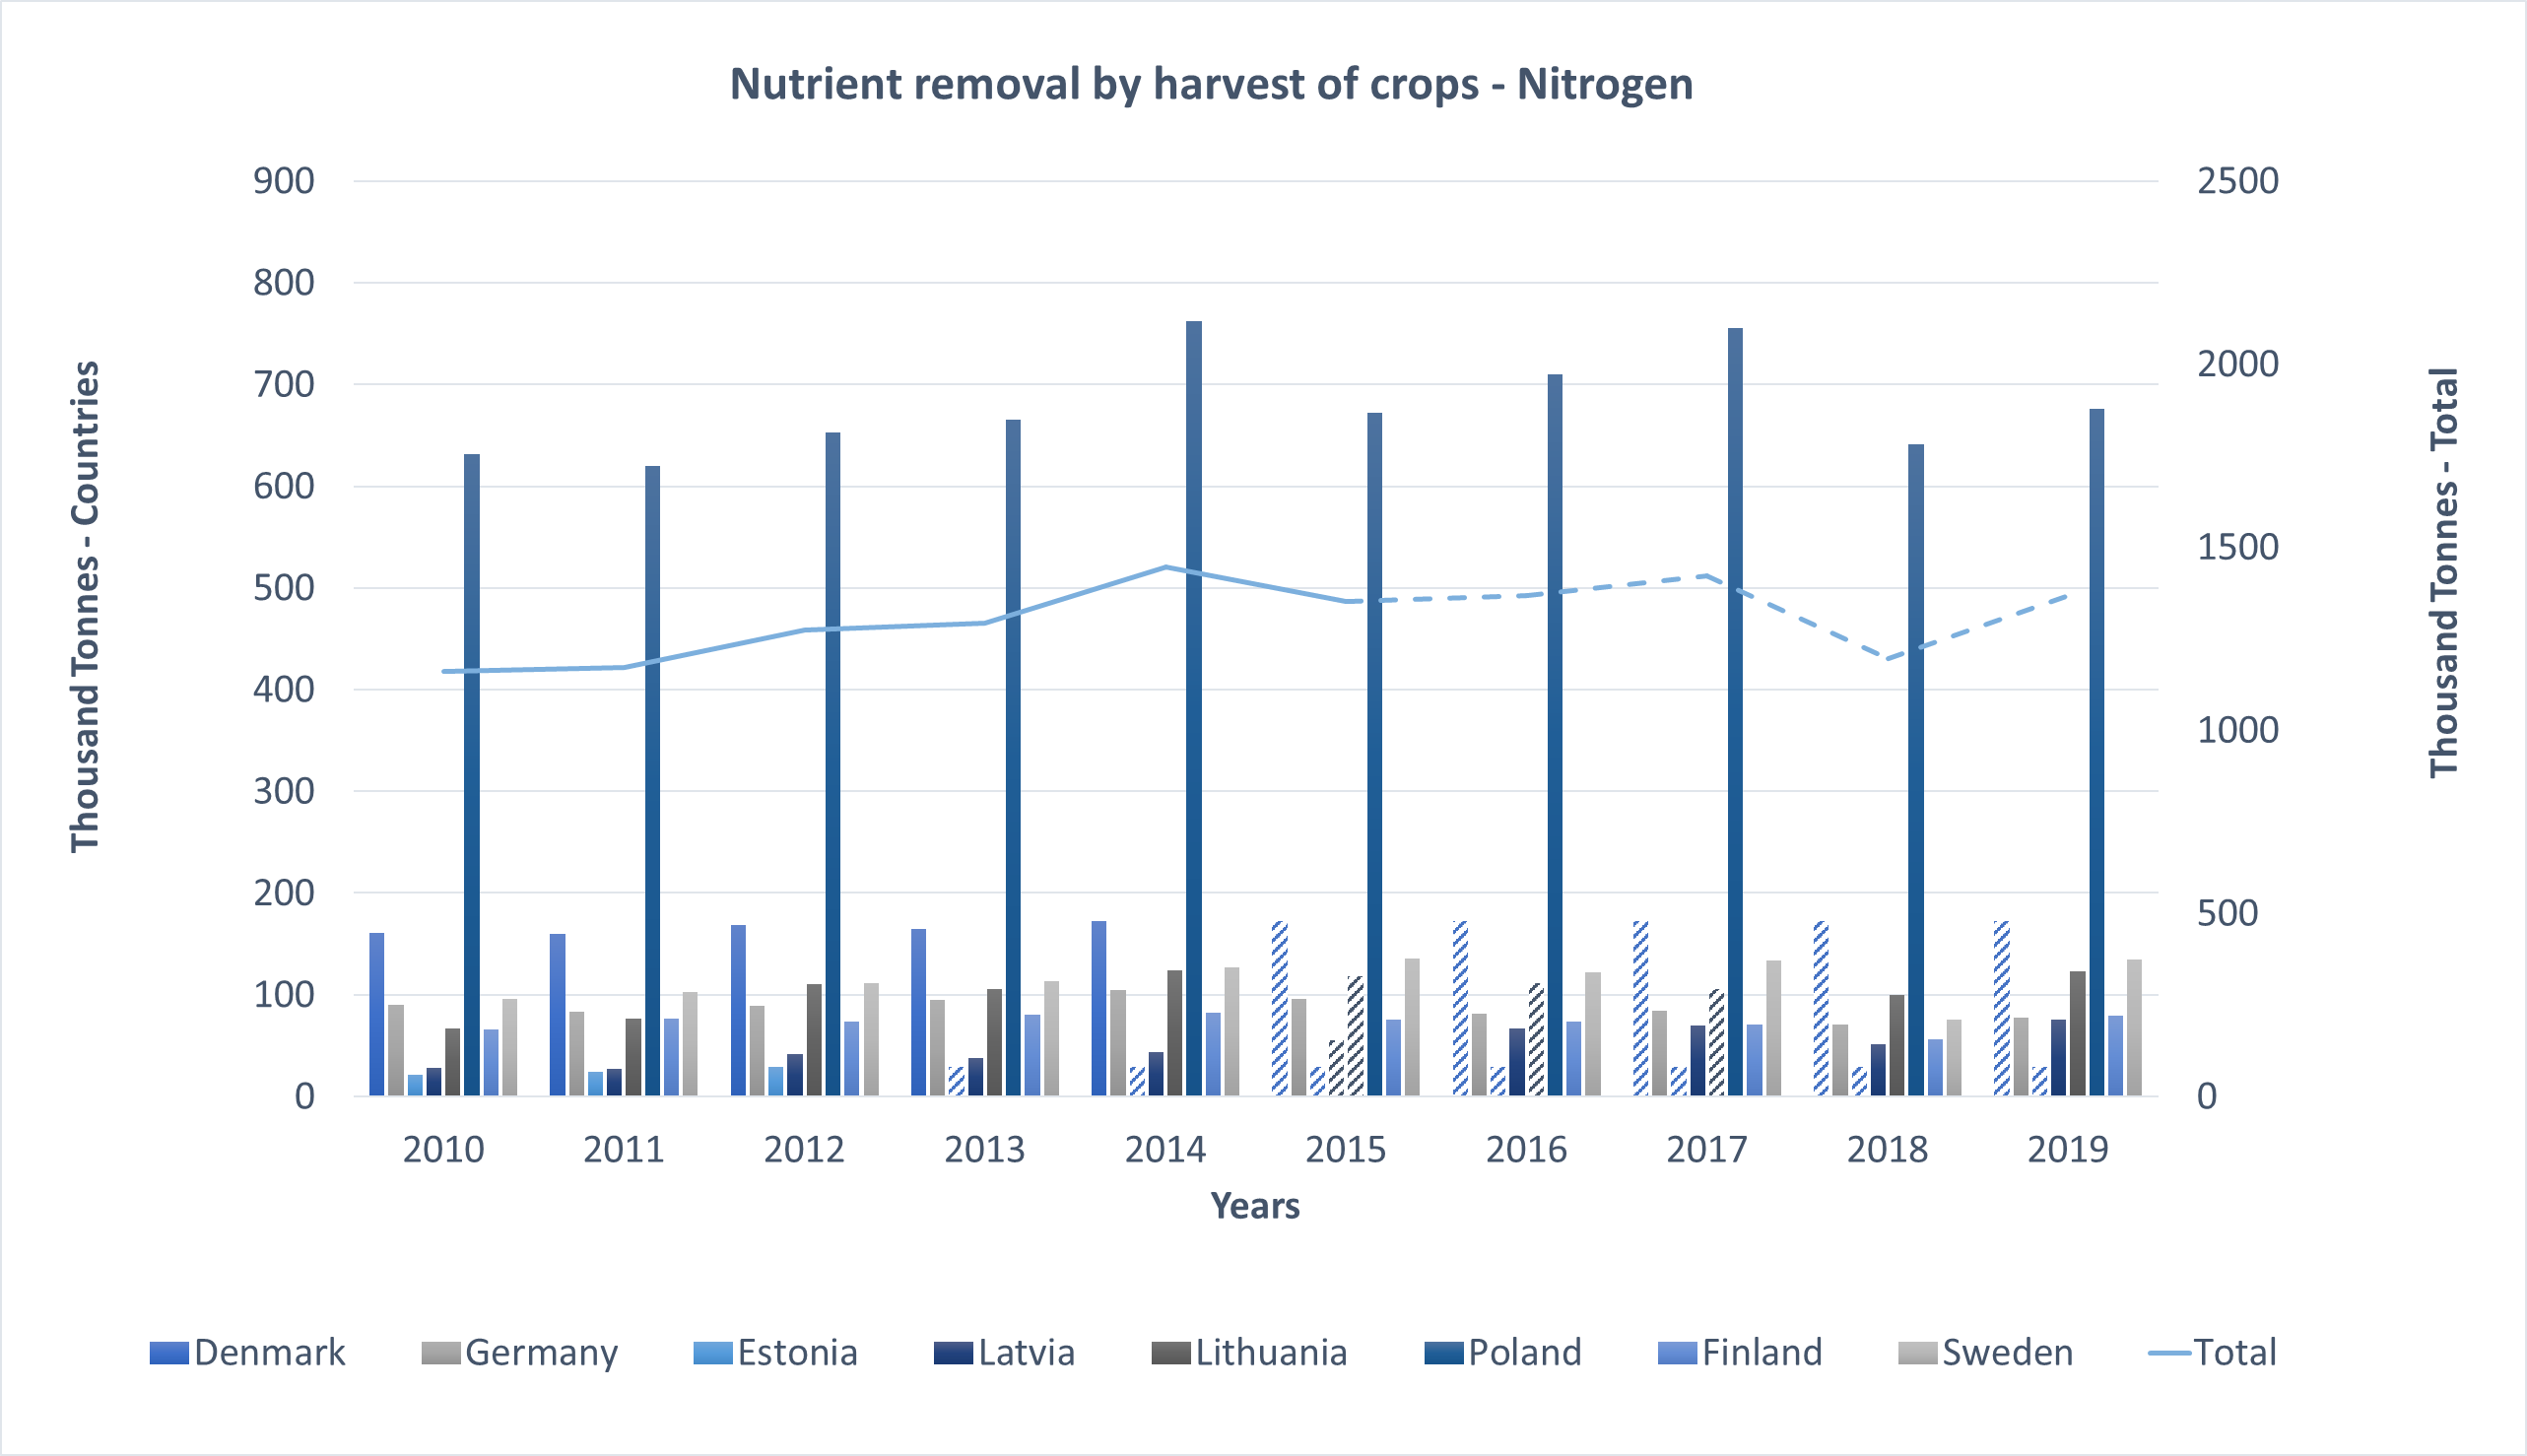
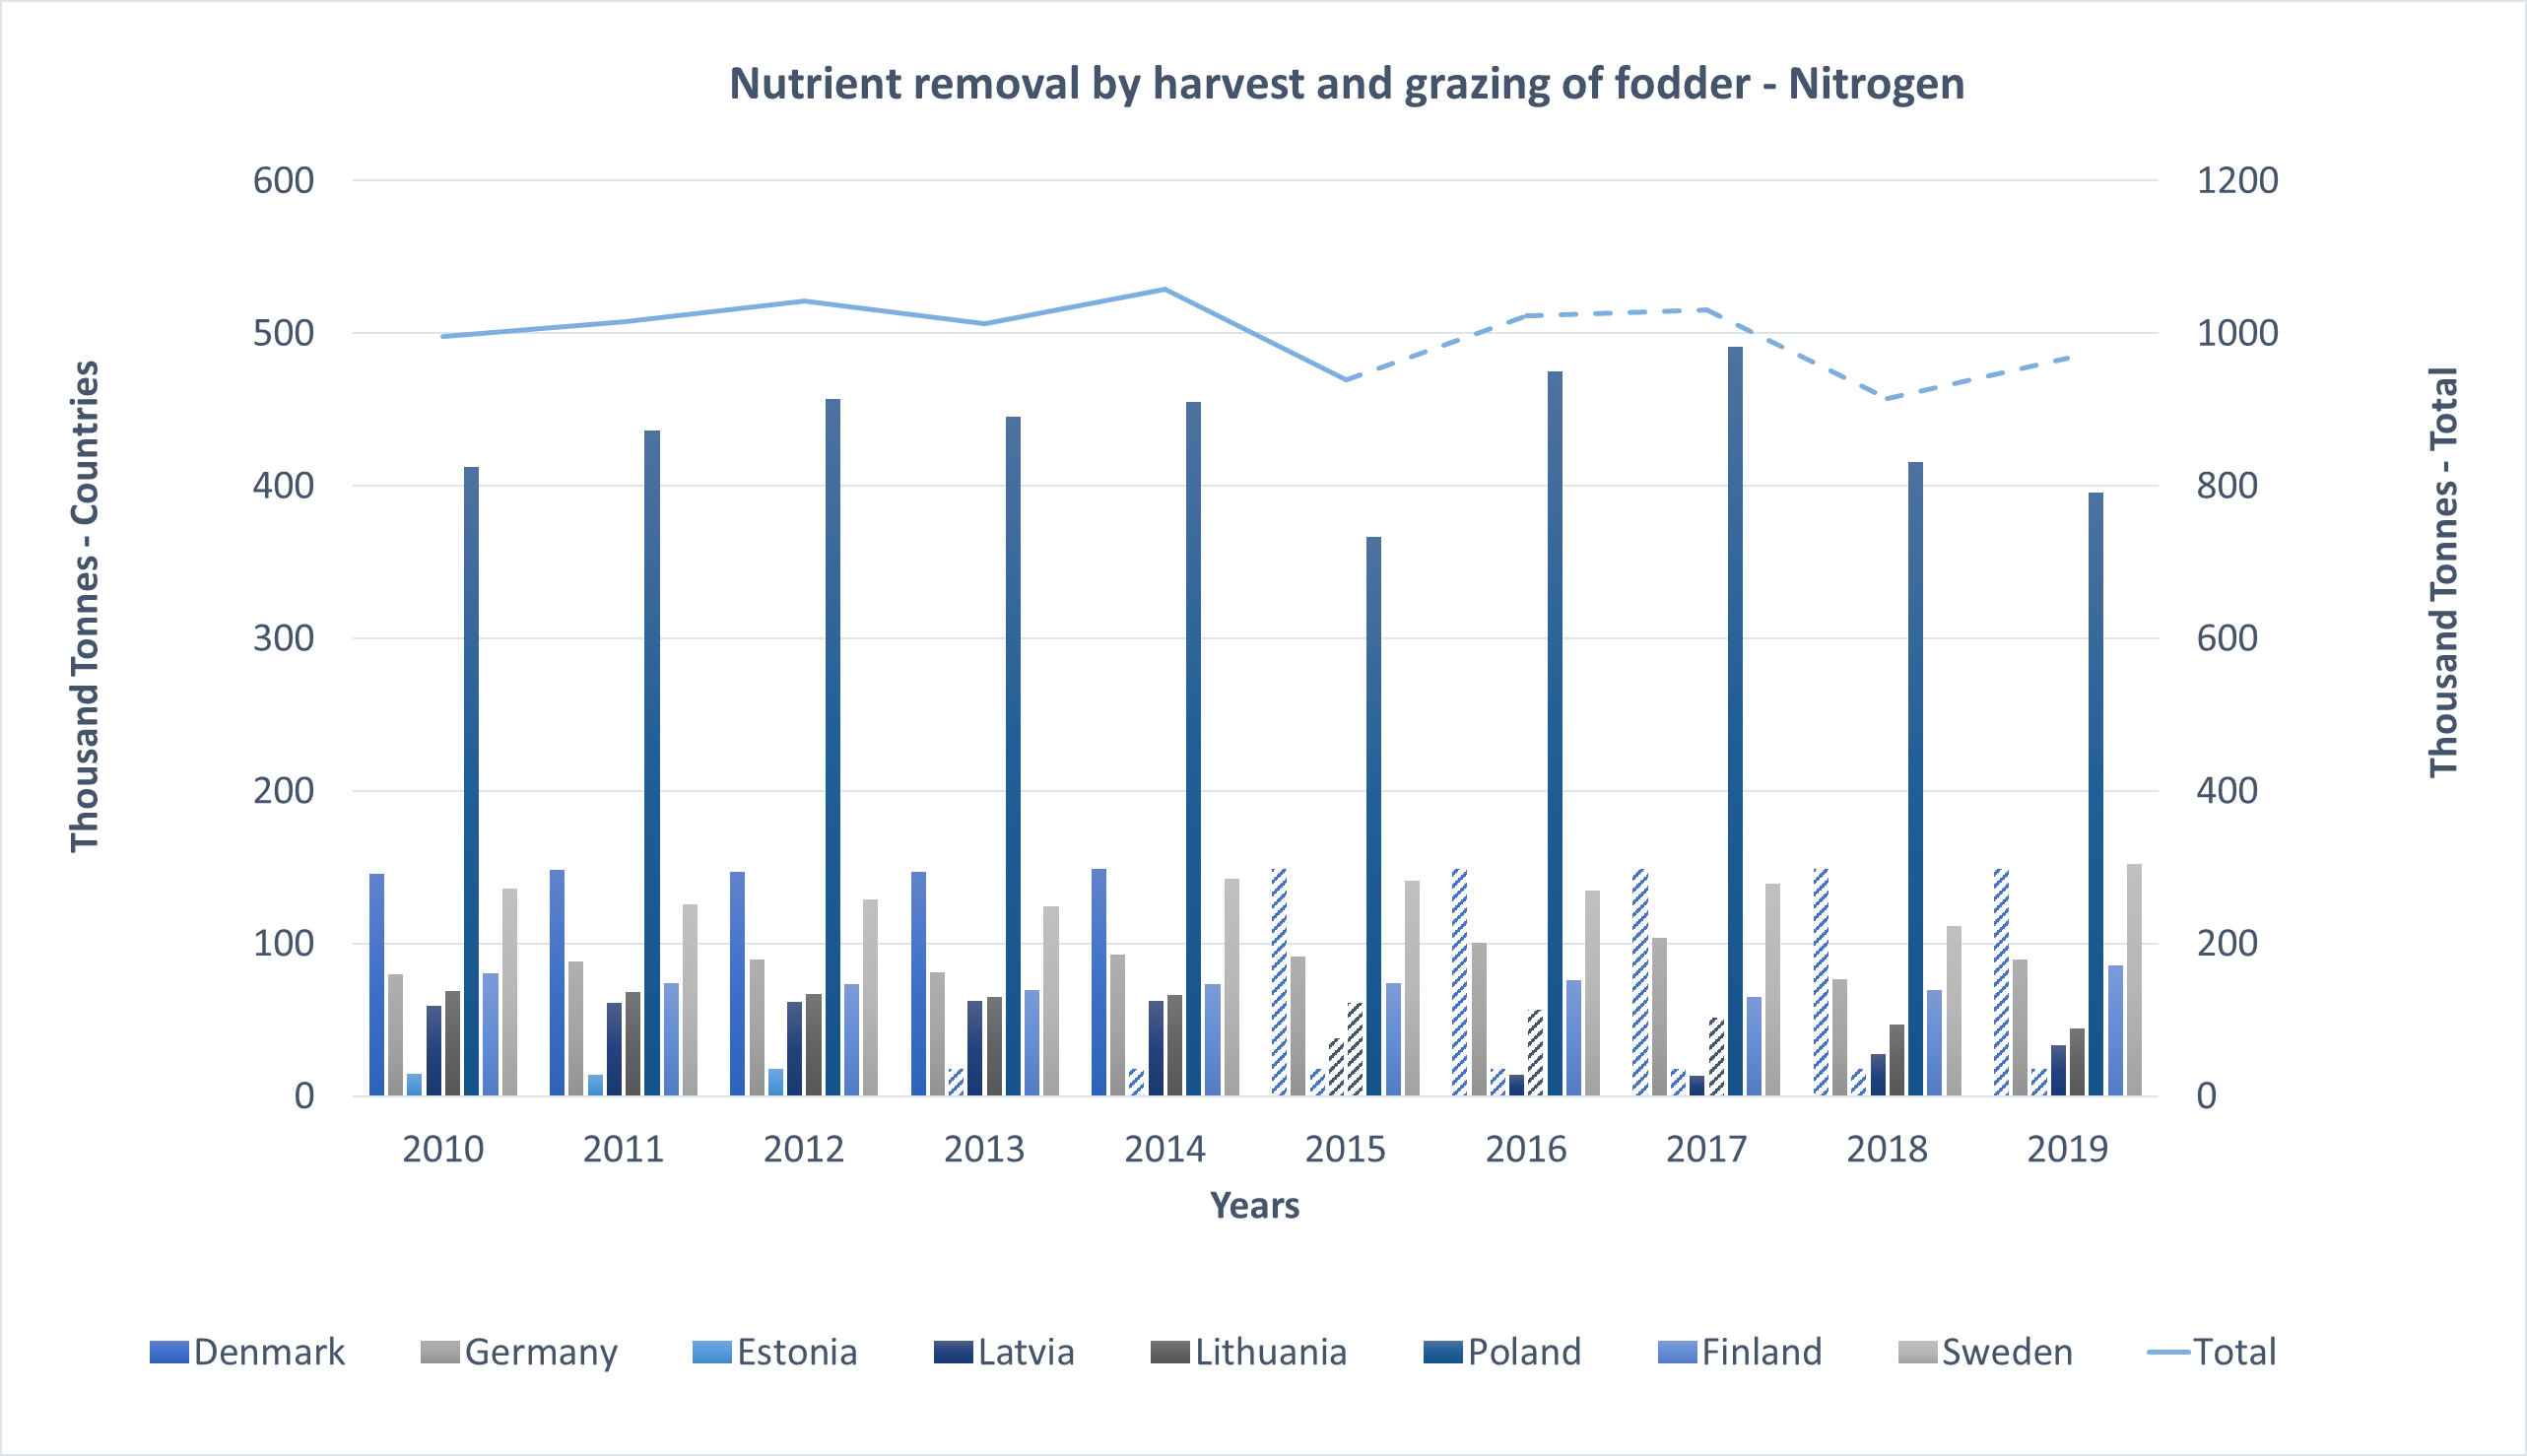
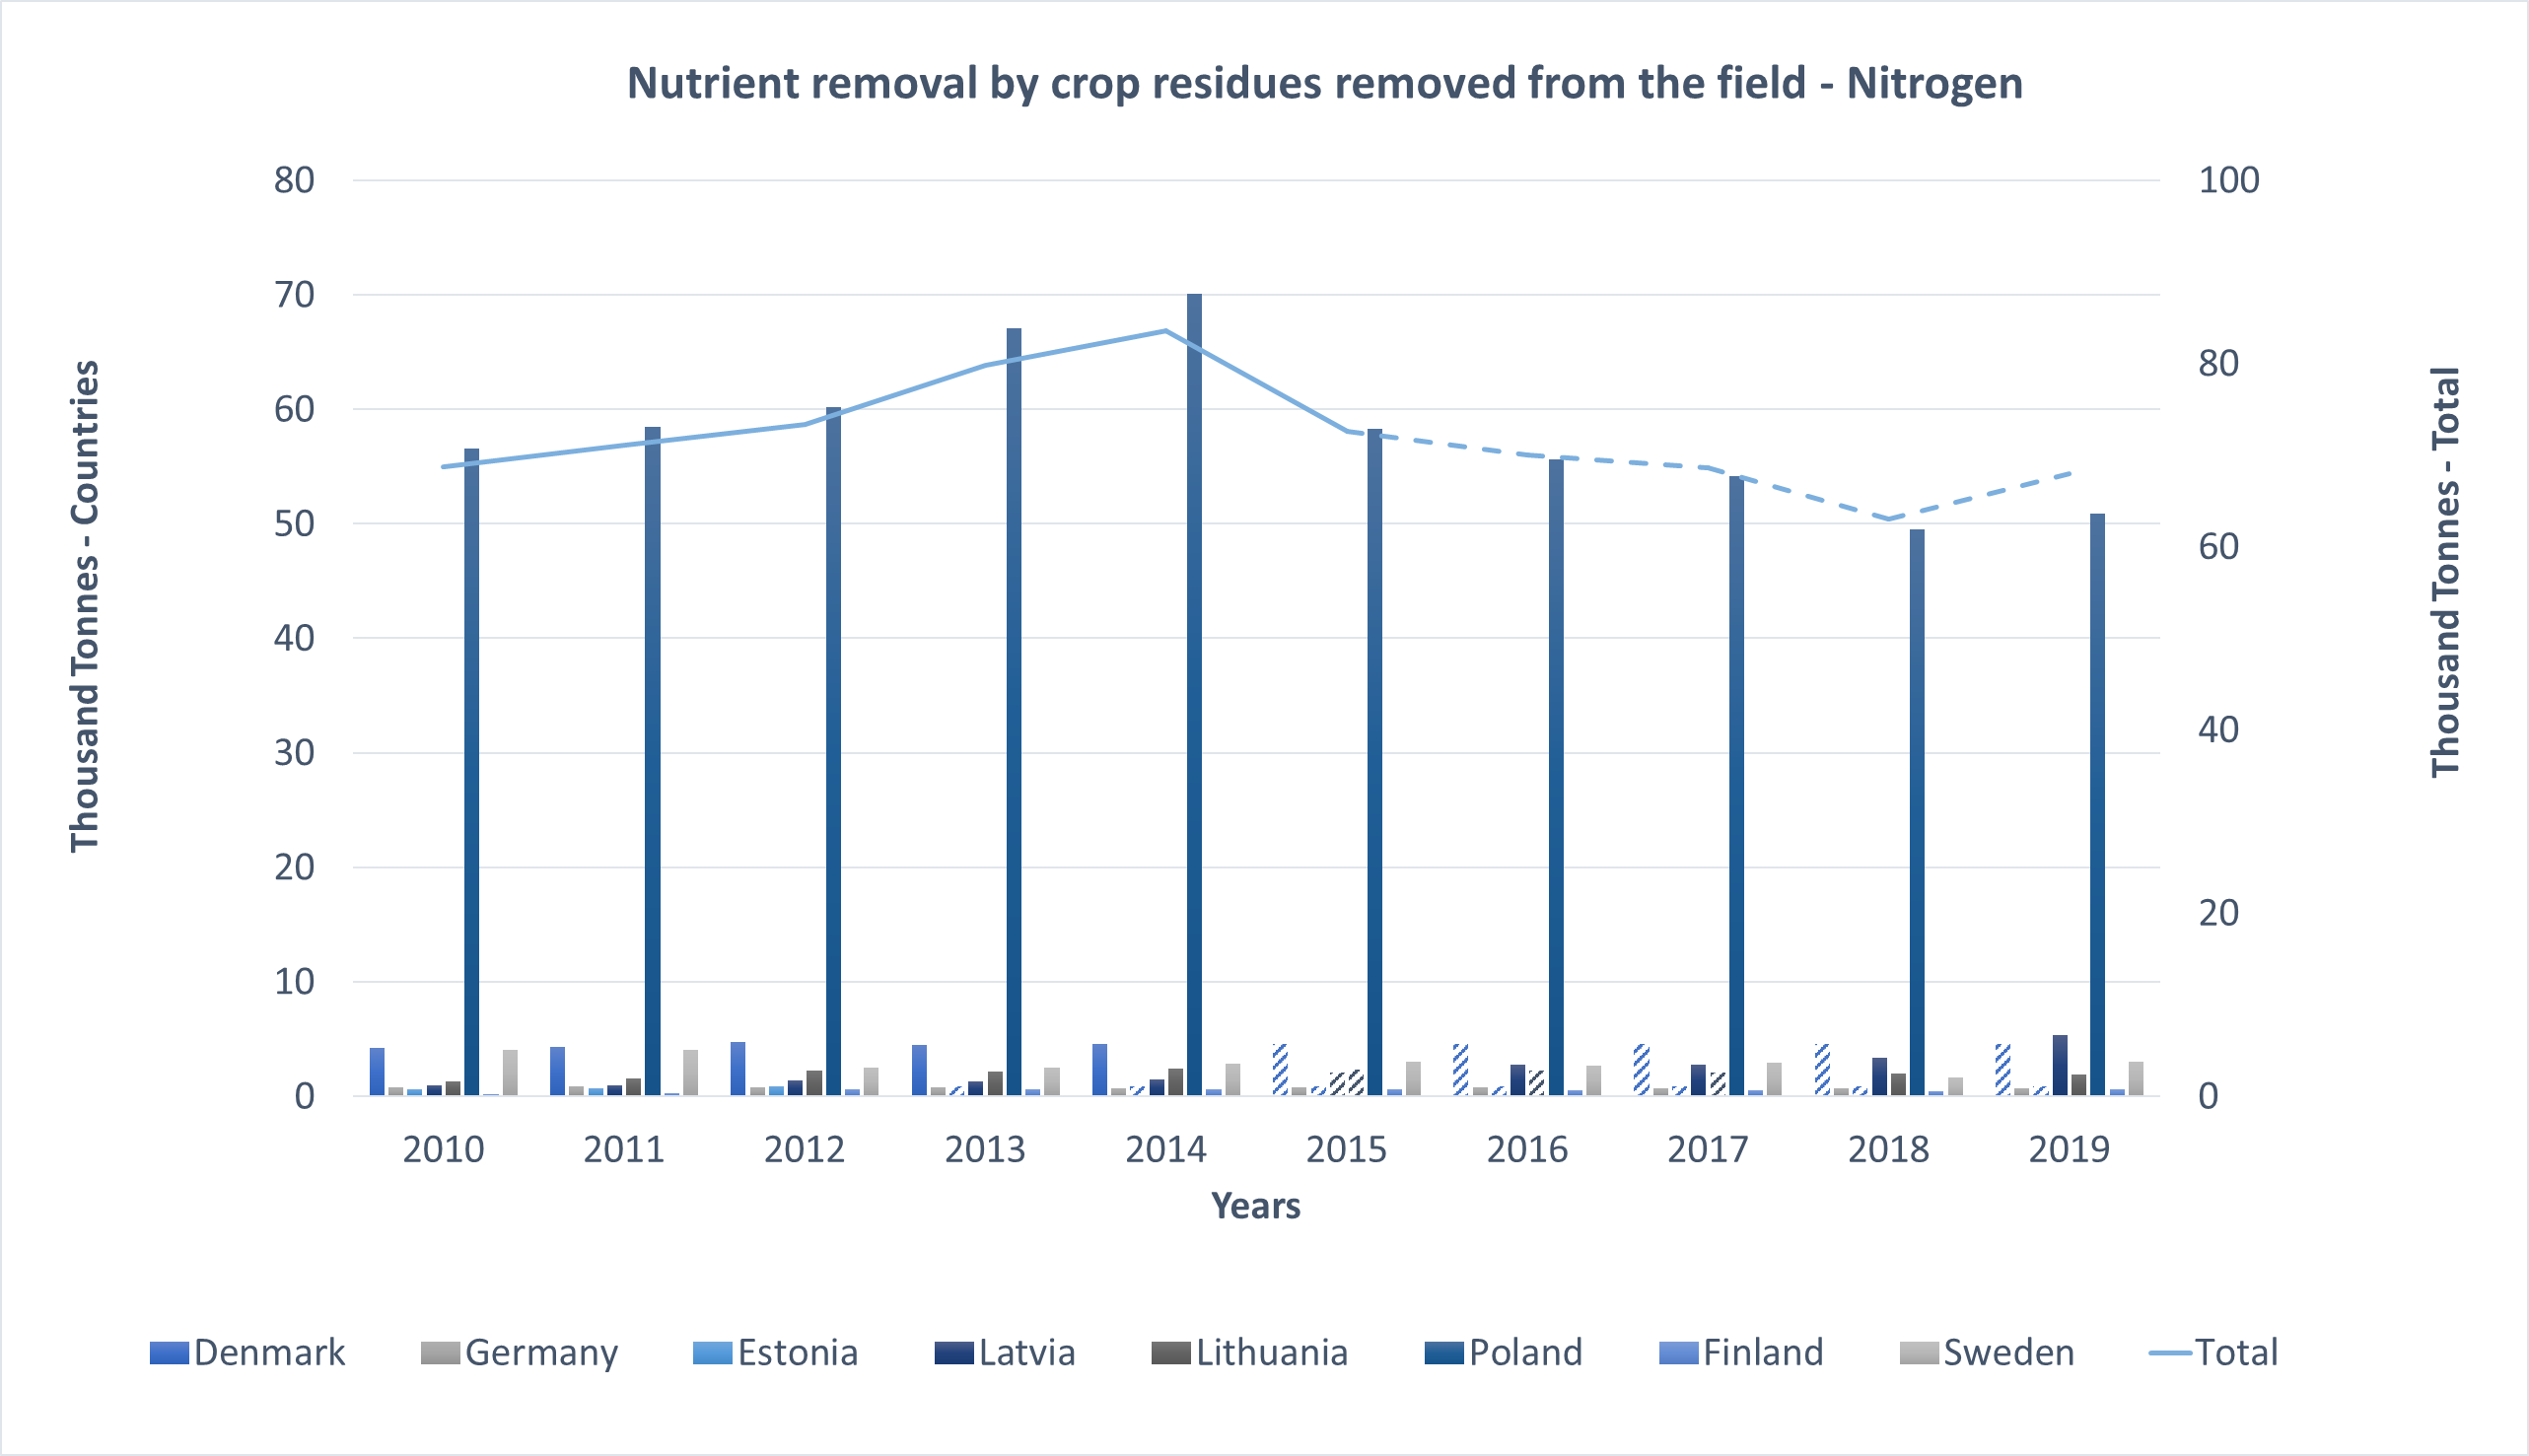
Annex Figure 6: Nitrogen output sub-categories, removal by harvest of crops, harvest and grazing of fodder, and crop residues removed from the field by country (left axis) and total (right axis). Chart does not include data from Russia or any non-HELCOM countries. Data points based on the assumption of no change are indicated with hatched pattern. German data was multiplied by the ratio of national territory in the Baltic Sea catchment area (0.08).
At the regional scale, agricultural phosphorus outputs have shown a stable trend, both overall and for each output sub-category (Annex Figure 7). National trends were observed in several sub-categories. In terms of crop harvesting, Latvia (F1,8 = 7.766, p = 0.023) and Lithuania (F1,8 = 30.719, p < 0.001) have shown significant increasing trends. While fodder harvesting and grazing has significantly increased in Lithuania (F1,8 = 28.766, p < 0.001. Similar to nitrogen output, Poland has the largest impact on phosphorus outputs (50% of the total phosphorus outputs).
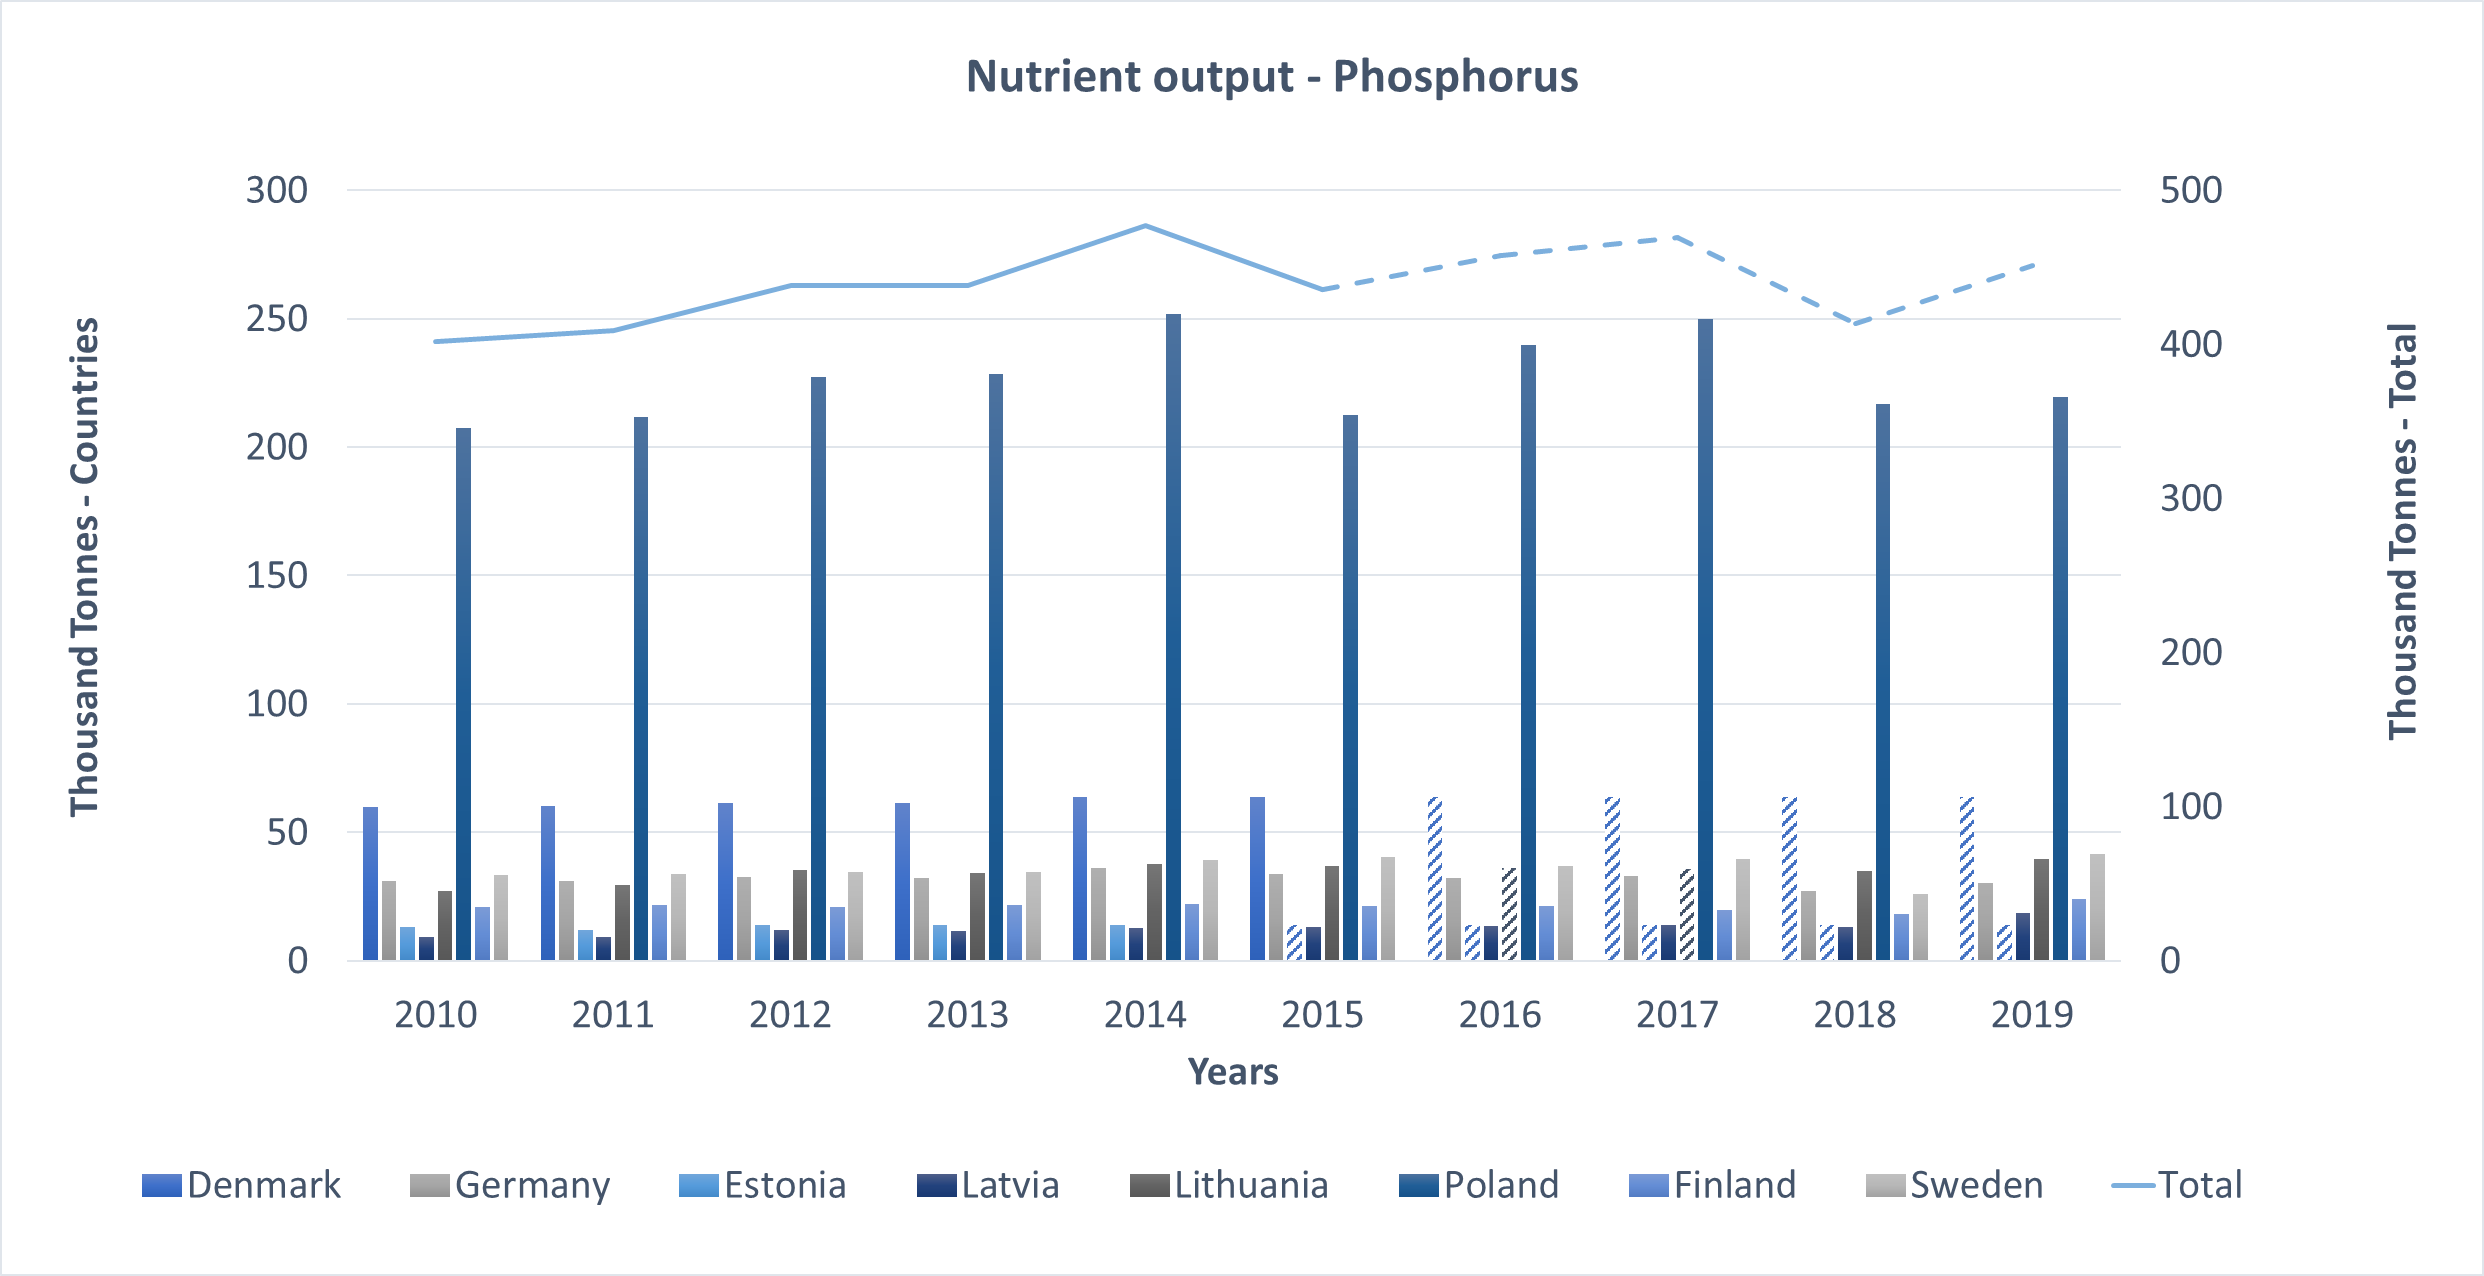
Annex Figure 7: Total phosphorus output by country (left axis) and total (right axis). Chart does not include data from Russia or any non-HELCOM countries. Data points based on the assumption of no change are indicated with hatched pattern. German data was multiplied by the ratio of national territory in the Baltic Sea catchment area (0.08).
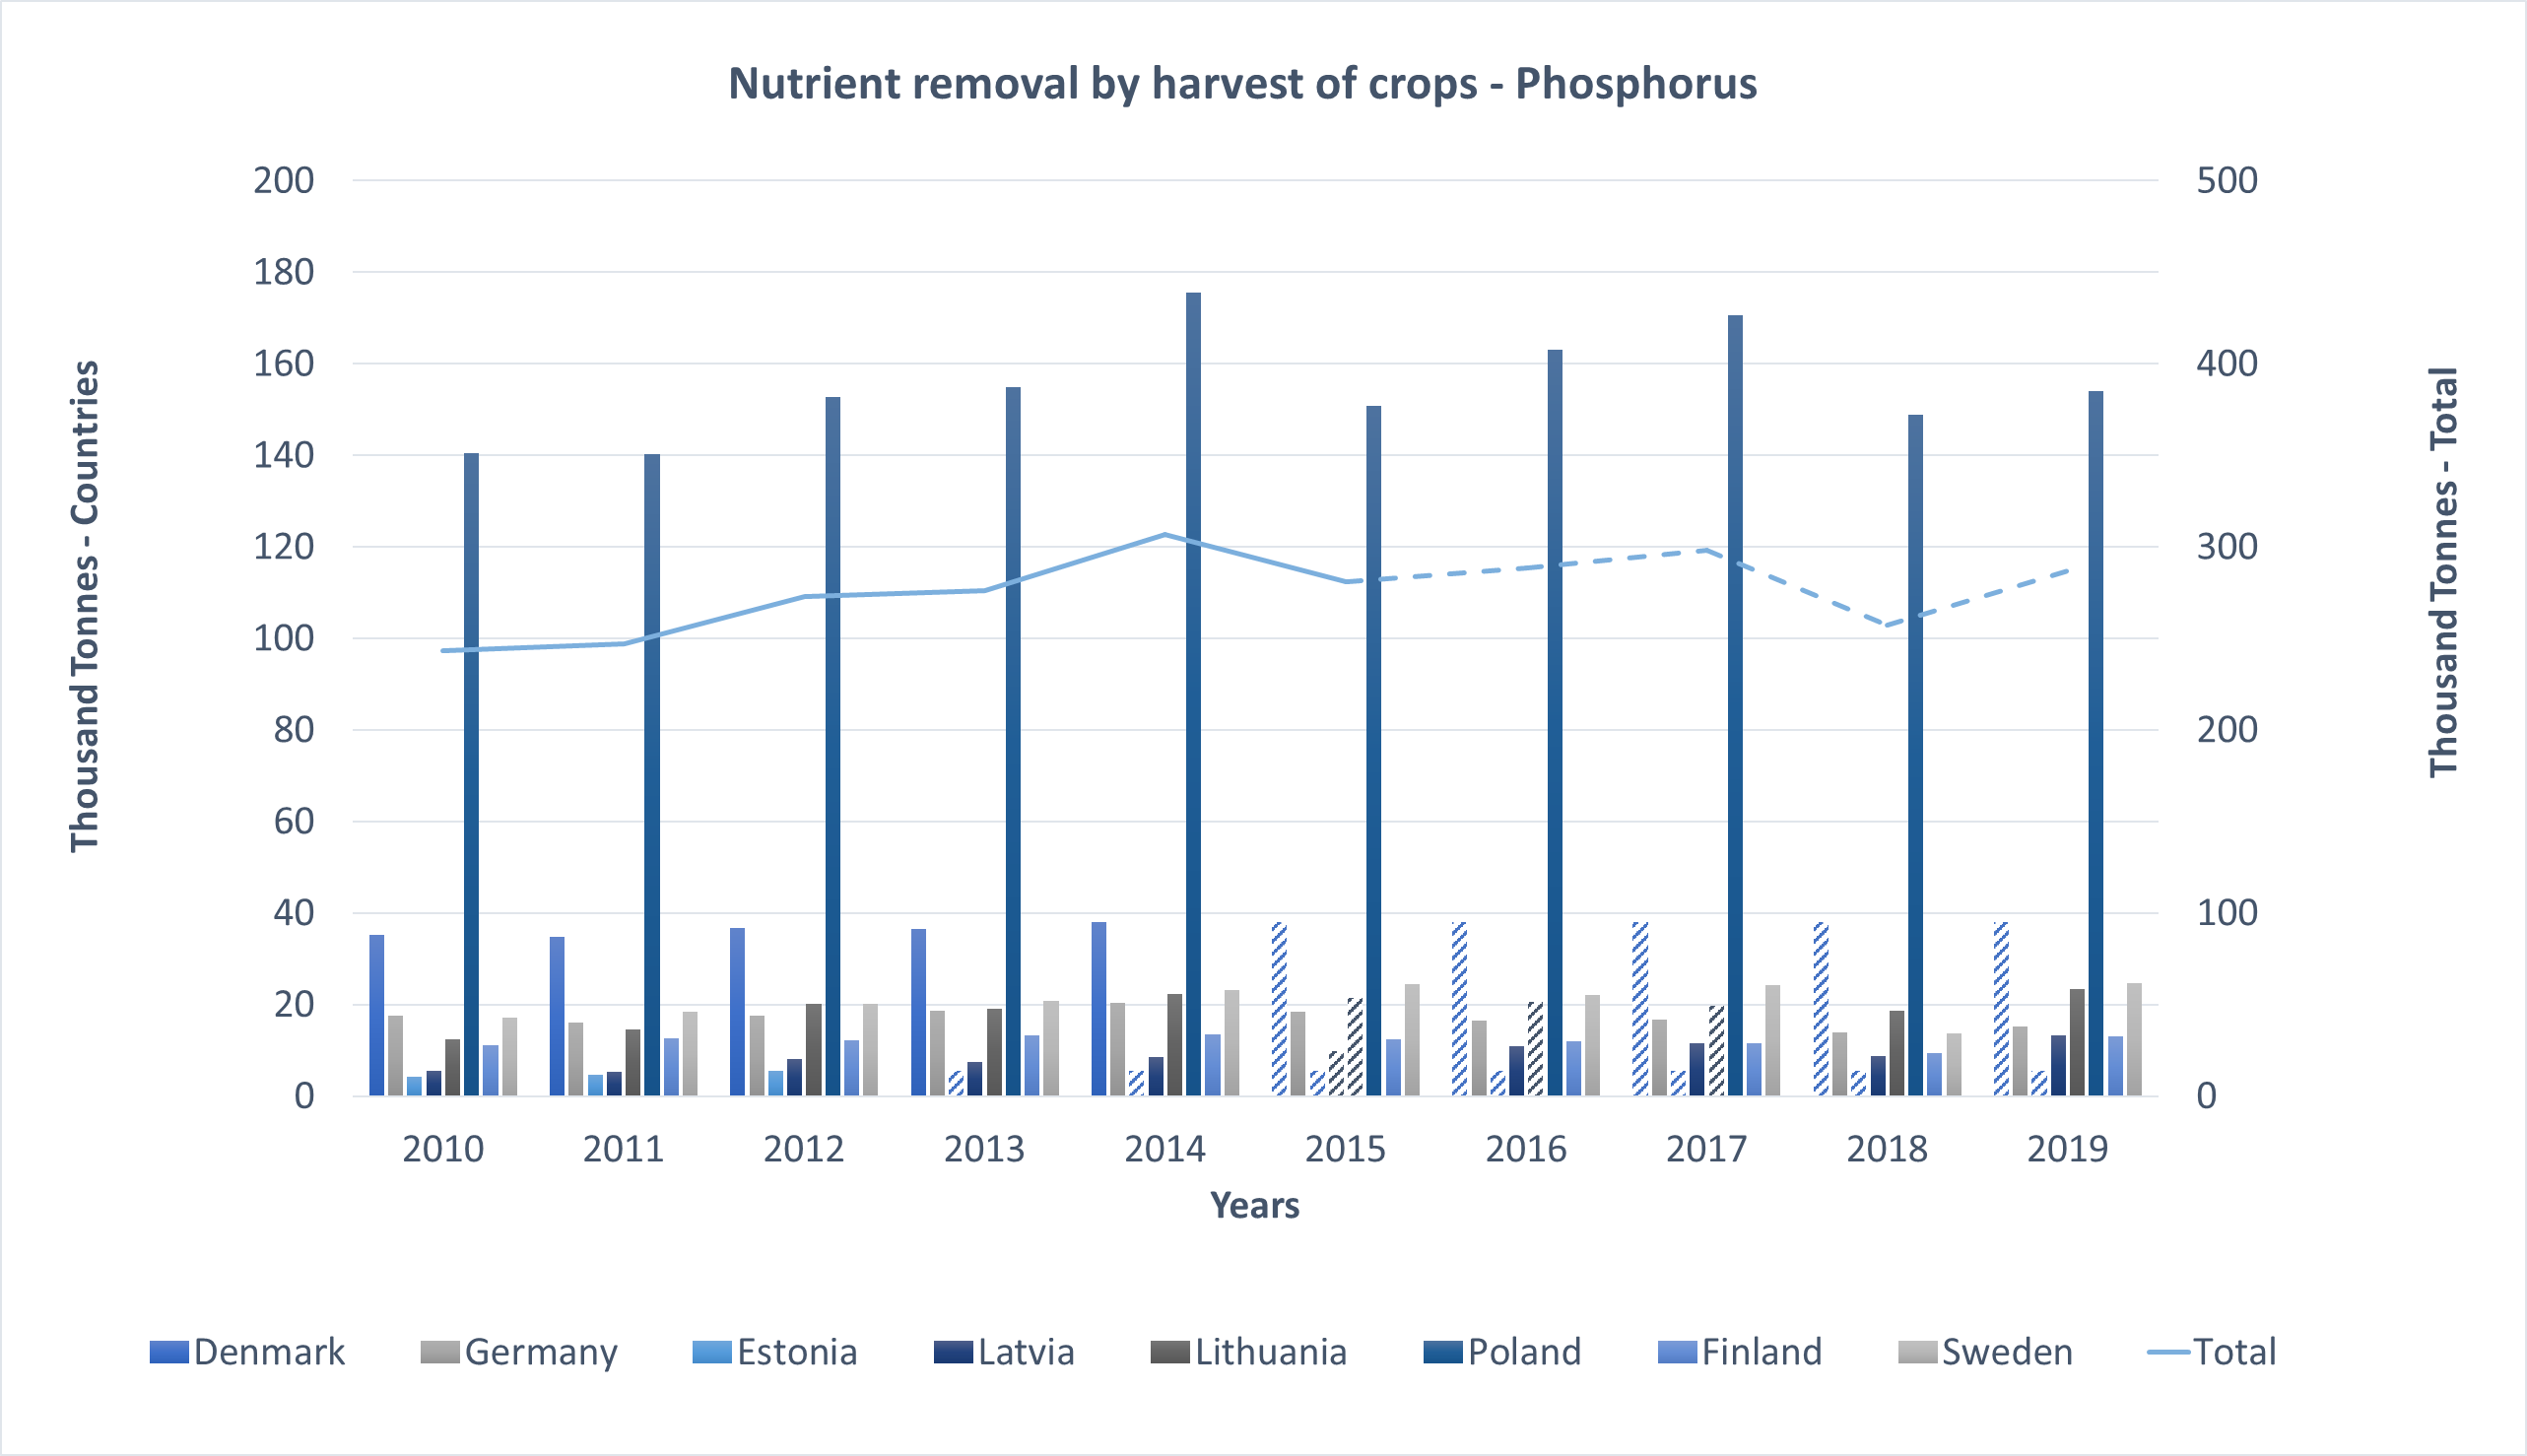
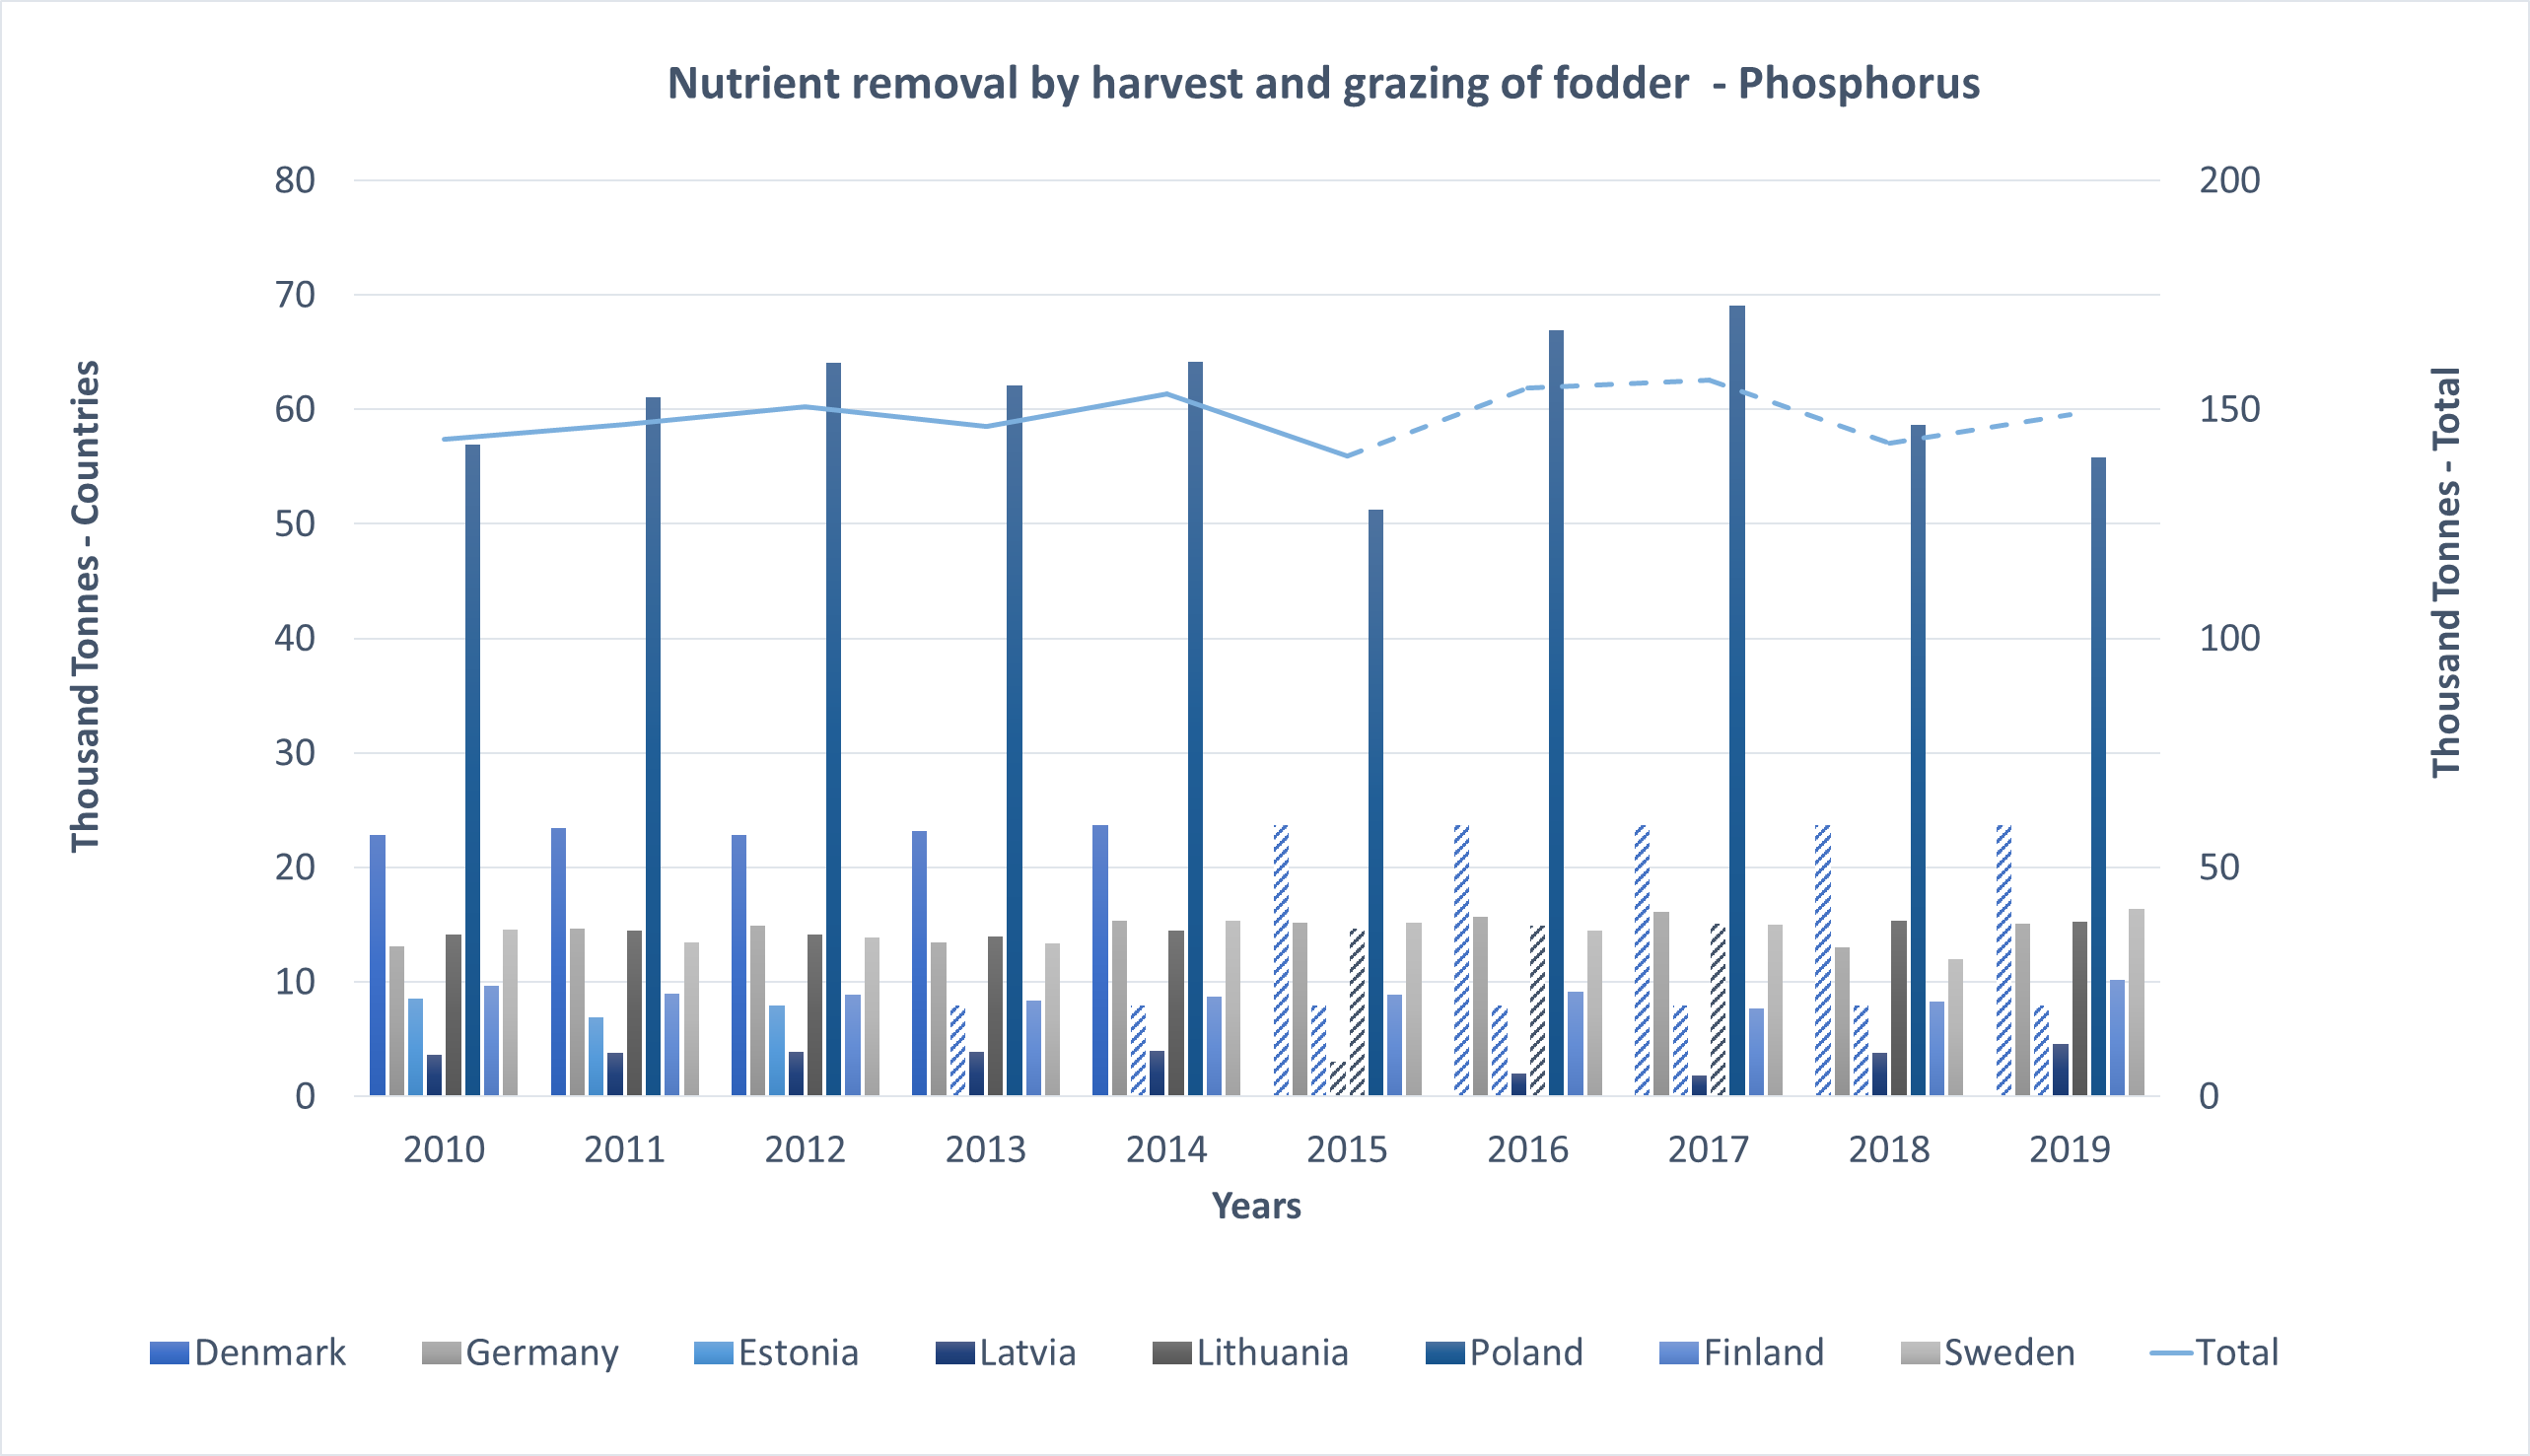
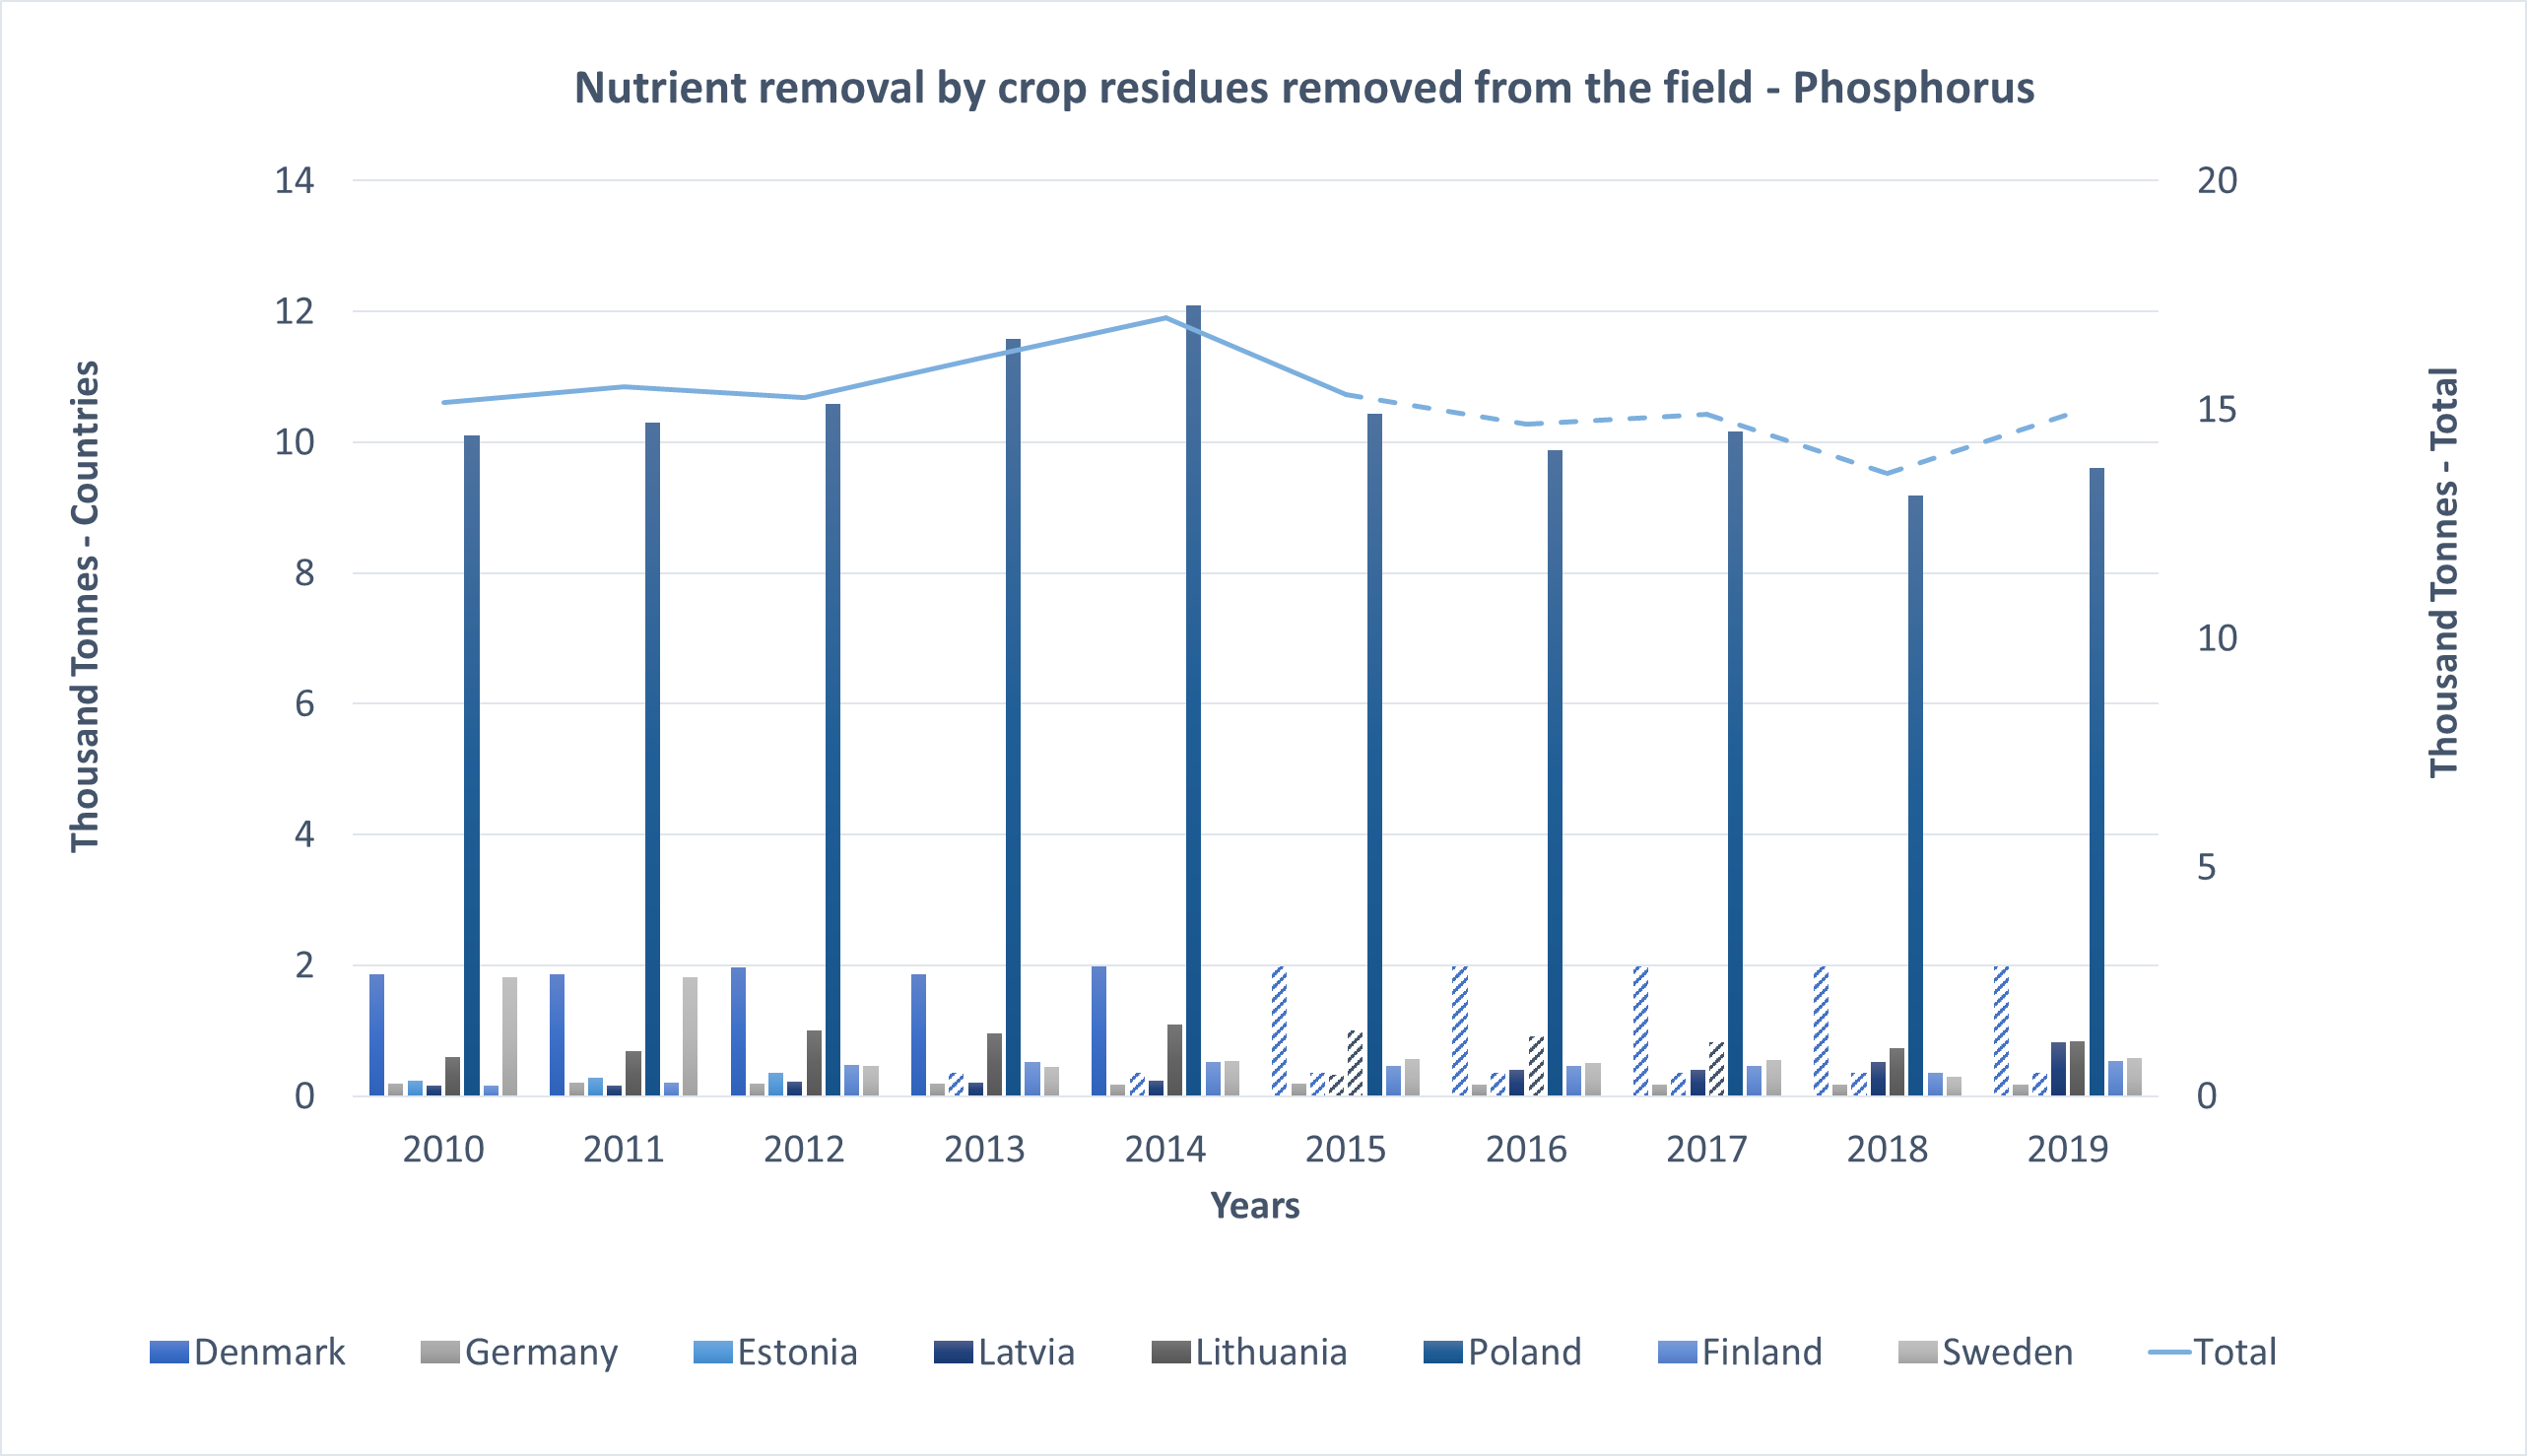
Annex Figure 8: Phosphorus output sub-categories, removal by harvest of crops, harvest and grazing of fodder, and crop residues removed from the field by country (left axis) and total (right axis). Chart does not include data from Russia or any non-HELCOM countries. Data points based on the assumption of no change are indicated with hatched pattern. German data was multiplied by the ratio of national territory in the Baltic Sea catchment area (0.08).
Animal husbandry
Manure production
In the Baltic Sea region, there are differing densities of animal husbandry – and thus production of manure. Manure in the Baltic Sea countries comprises 1,270,000 tonnes of nitrogen and 250,000 tonnes of phosphorus (Eurostat, 2022).
Eurostat used available excretion coefficients (amount of N and P in manure at the time of excretion) and livestock numbers to estimate national manure production (Eurostat 2022). Data on pigs and bovine animals are available from a variety of European statistics sources such as annual livestock statistics, the Farm Structure Survey and livestock registers, while poultry data is only available from the Farm Structure Survey (2013 & 2016). More information on data characteristics and calculations can be found in data and methodology sections below.
Manure production by country
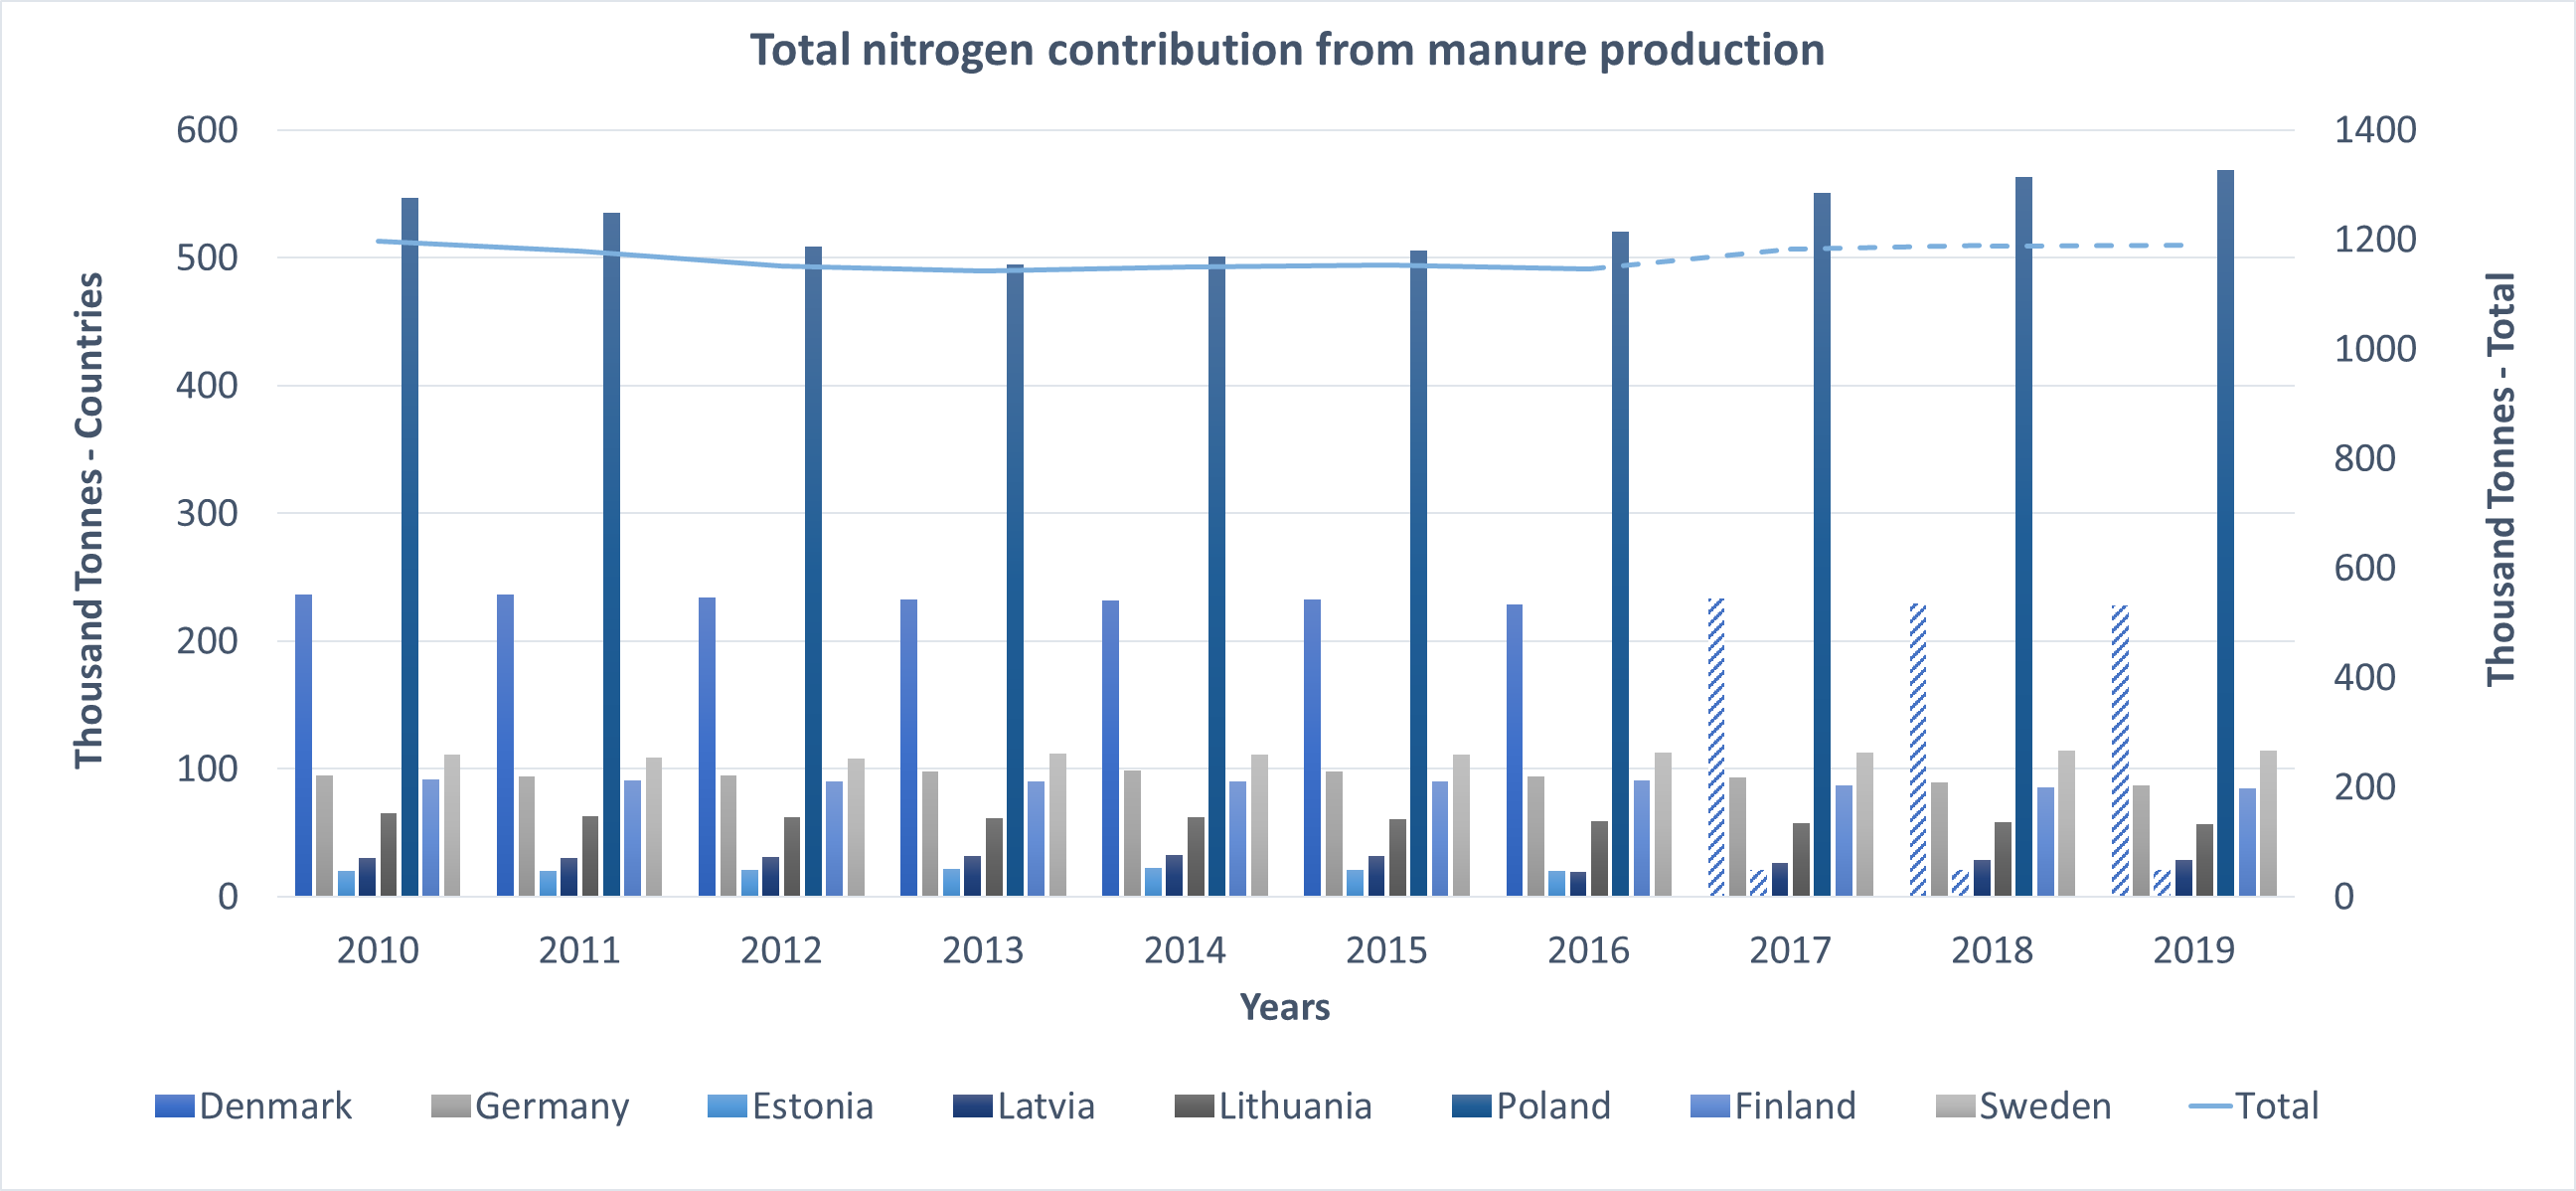
Nitrogen and phosphorus contribution from manure production have remained stable at the regional level (Annex Figure 9 and 10) After decreasing over the first part of the decade, Poland’s production has rebounded to levels similar to 2010. In terms of nitrogen contribution, Germany (F1,8 = 5.604, p = 0.045) and Finland (F1,8 = 16.502, p = 0.003) have shown significant decreasing trends while Sweden (F1,8 = 20.607, p < 0.001) has shown an increasing trend. On the other hand, phosphorus contribution from Germany manure production has shown a (F1,8 = 14.016, p = 0.006) significant decreasing trend. Other Baltic Sea countries have shown more stable manure production trends. Poland, Denmark and Germany have the highest manure production in parallel with denser levels of husbandry (domestic animals per catchment area) (HELCOM 2021).

Annex Figure 9: Total nitrogen from manure production by country (left axis) and totalled (right axis). Total production does not include data from Russia or any non-HELCOM countries. Data points based on the assumption of no change are indicated with hatched pattern. German data was multiplied by the ratio of national territory in the Baltic Sea catchment area (0.08).
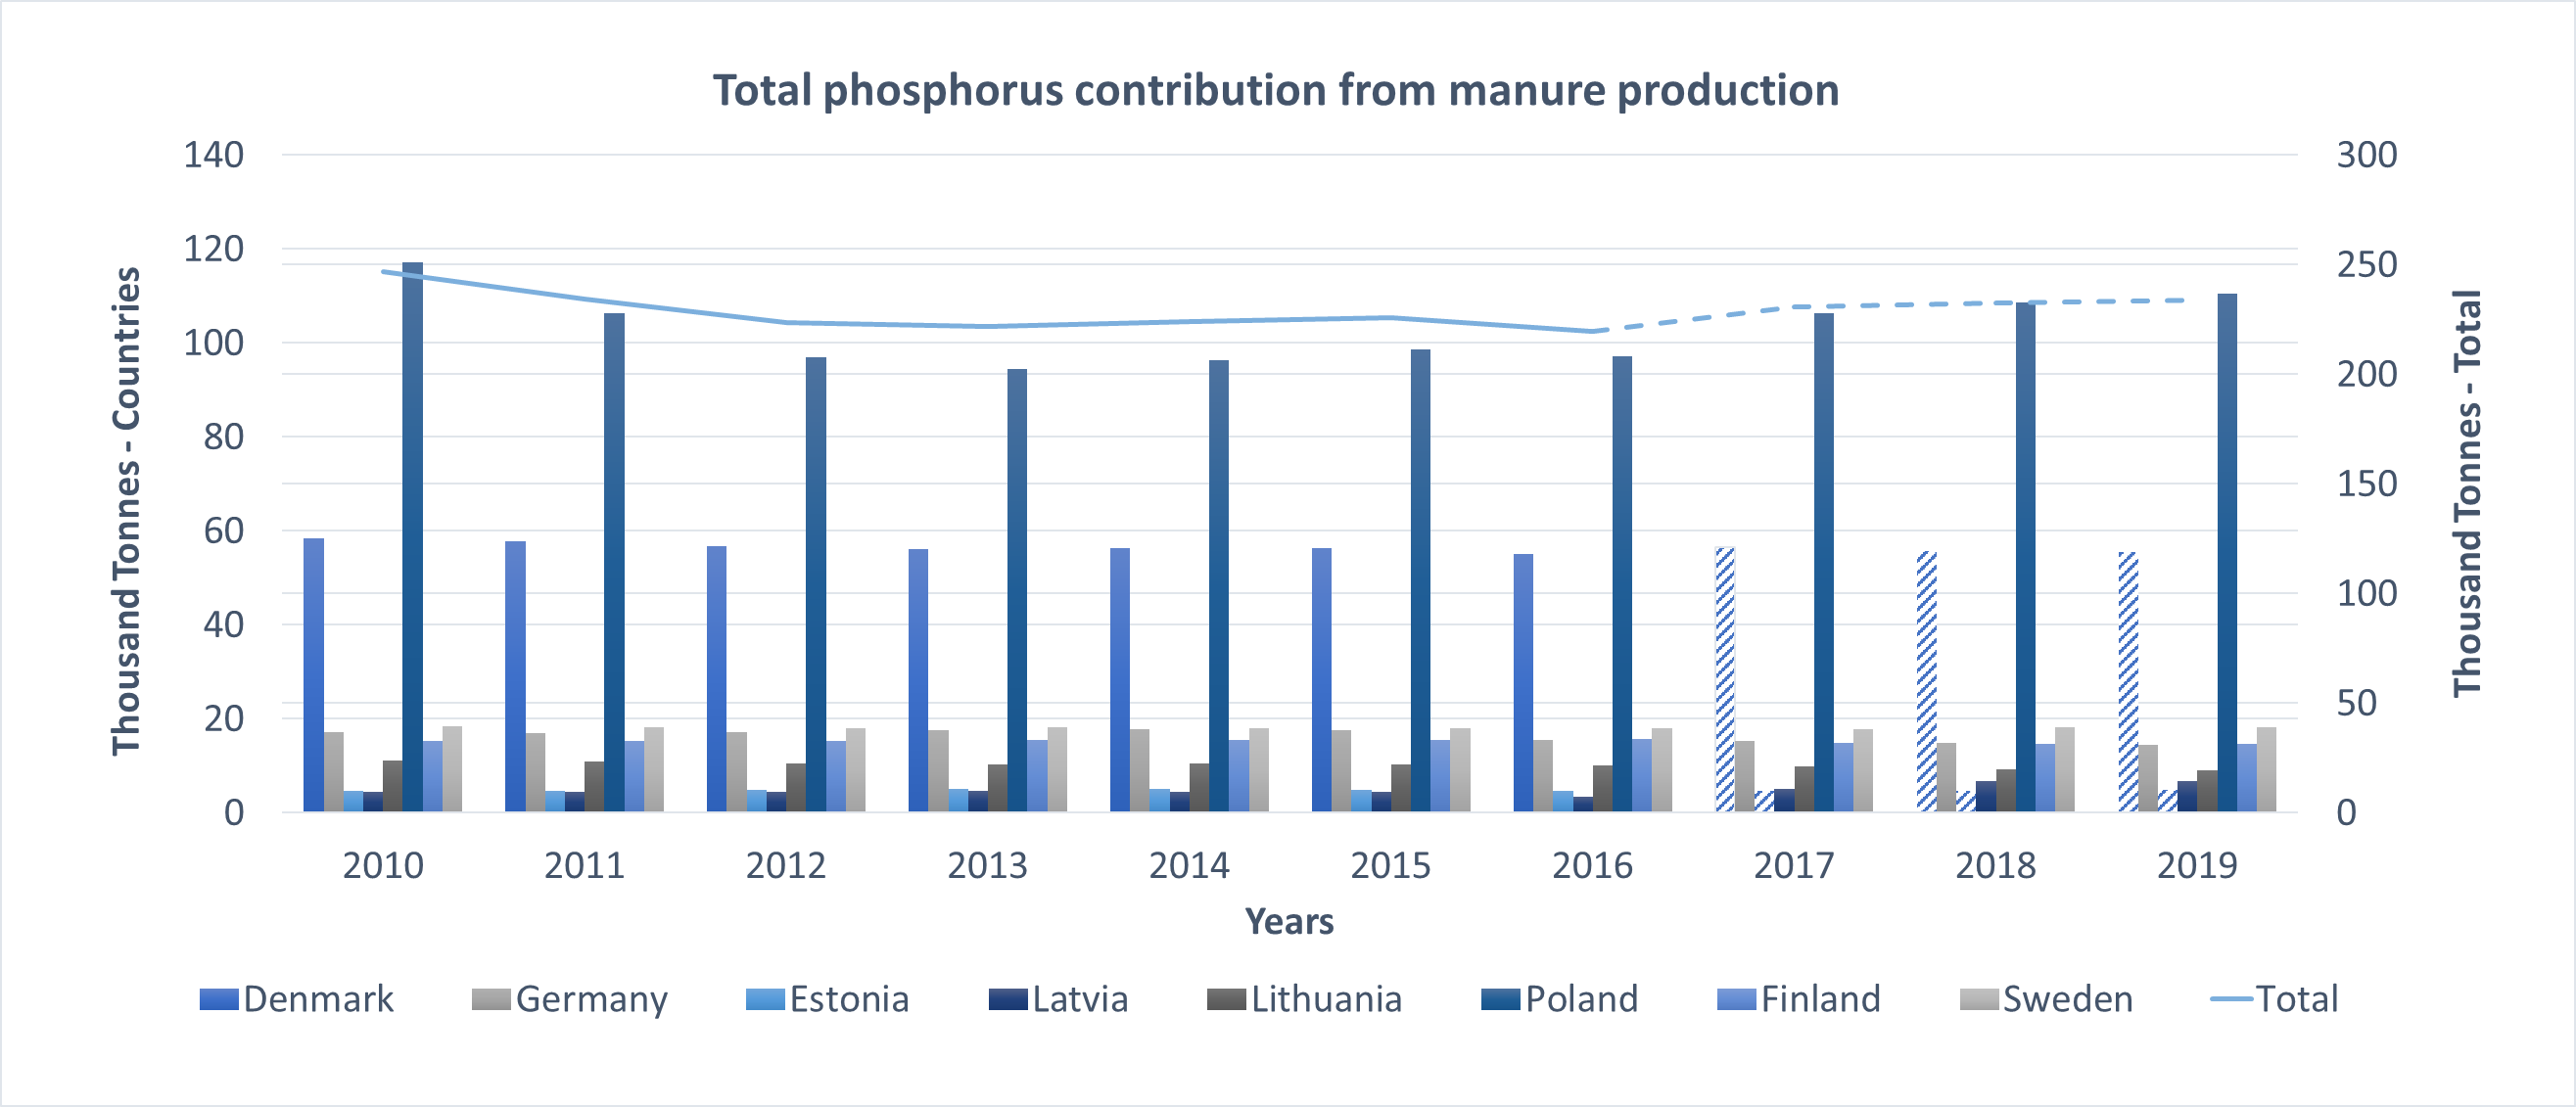
Annex Figure 10: Total phosphorus from manure production by country (left axis) and totalled (right axis). Total production does not include data from Russia or any non-HELCOM countries. Data points based on the assumption of no change are indicated with hatched pattern. German data was multiplied by the ratio of national territory in the Baltic Sea catchment area (0.08).
Manure production by animal group
In the Baltic Sea countries, bovine animals manure production, contributes most significantly to the overall load of both N and P (Annex Figure 11). There is a slight decrease in nitrogen and phosphorus contribution from pig manure (N: F1,8 = 7.673, p = 0.024; P: F1,8 = 7.797, p = 0.023) in the region (14 and 15%, respectively) between 2010 and 2019 (Annex Figure 11). On the other hand, nitrogen and phosphorus contribution from poultry manure (N: F1,8 = 20.438, p = 0.002; P: F1,8 = 5.655, p = 0.044) increased (31 and 15% respectively) between 2012 and 2018. Contribution from bovine manure was more stable compared to pig and poultry manure.
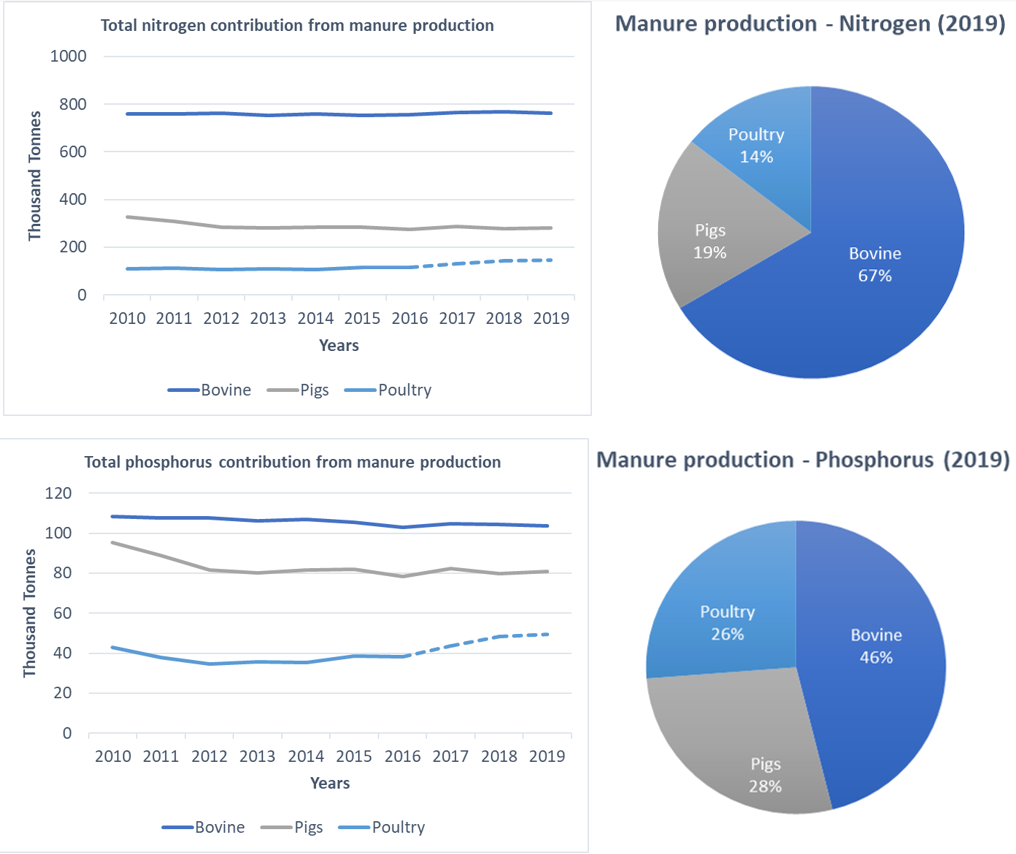
Annex Figure 11: Total nutrient contribution from manure production (left), estimated from animal numbers and excretion coefficients, and proportion of manure nutrient production by animal group in 2019 (right). Chart does not include data from Russia or any non-HELCOM countries. Data points based on the assumption of no change are indicated with hatched pattern. German data was multiplied by the ratio of national territory in the Baltic Sea catchment area (0.08).
Livestock population
According to Eurostat (2022), the total number of animals in different animal husbandry classes in the Baltic Sea area was: 285 million poultry, 29 million pigs, 12.2 million cattle and 1.5 million animals belonging to other classes (horses, sheep, goats etc.) in 2021. Information on data characteristics and calculations can be found in data processing section.
Animal population by country
Country specific trends can be observed in livestock population. Within the relatively flat trend in bovine livestock, there is an increasing trend in Poland (F1,8 = 349.963, p < 0.001) and a decreasing trend in Germany (F1,8 = 86.184, p < 0.001). In pig livestock population, there are increasing trends in Denmark (F1,8 = 12.798, p = 0.007), and Germany (F1,8 = 12.798, p = 0.007), while there are decreasing trends in Latvia (F1,8 = 20.830, p = 0.002), Lithuania (F1,8 = 70.800, p < 0.001), Finland (F1,8 = 28.978, p < 0.001), and Sweden (F1,8 = 7.135, p = 0.028). While total regional bovine and pig livestock have a relatively flat trend (Figures 15 and 16), poultry livestock population (N: F1,8 = 49.538, p < 0.001) increased 63% between 2012-2019 (Annex Figure 14)
Livestock intensity (livestock units per square km) is highest in Denmark and Germany and lowest in Estonia, Latvia and Lithuania (HELCOM 2021). In 2021, Poland had the largest relative share of bovine livestock (55% of total livestock units) and the second largest share of pigs (36%), while Demark was the largest pig producer in the region (47%). Poland has the highest share of poultry (70%).
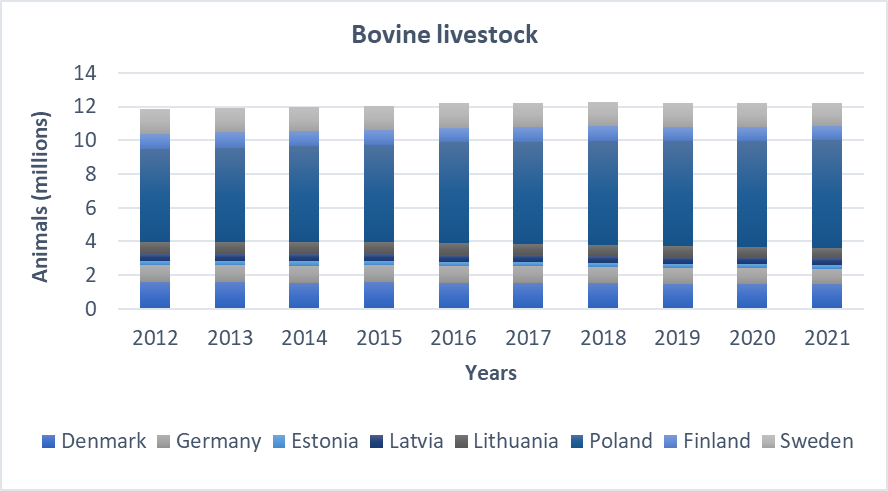
Annex Figure 12: Bovine livestock in the Baltic Sea countries. Chart does not include data from Russia or any non-HELCOM countries. German data was multiplied by the ratio of national territory in the Baltic Sea catchment area (0.08).
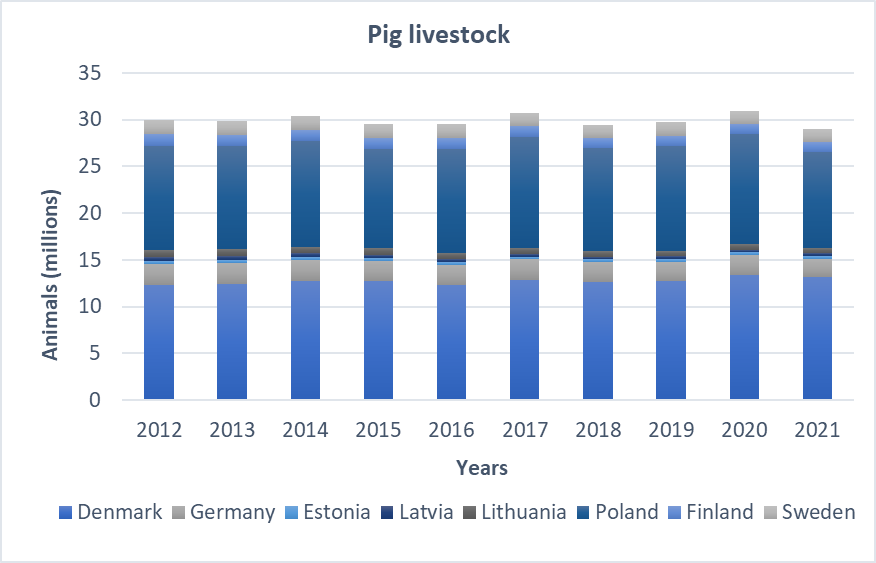
Annex Figure 13: Pig livestock in the Baltic Sea countries. Chart does not include data from Russia or any non-HELCOM countries. German data was multiplied by the ratio of national territory in the Baltic Sea catchment area (0.08).
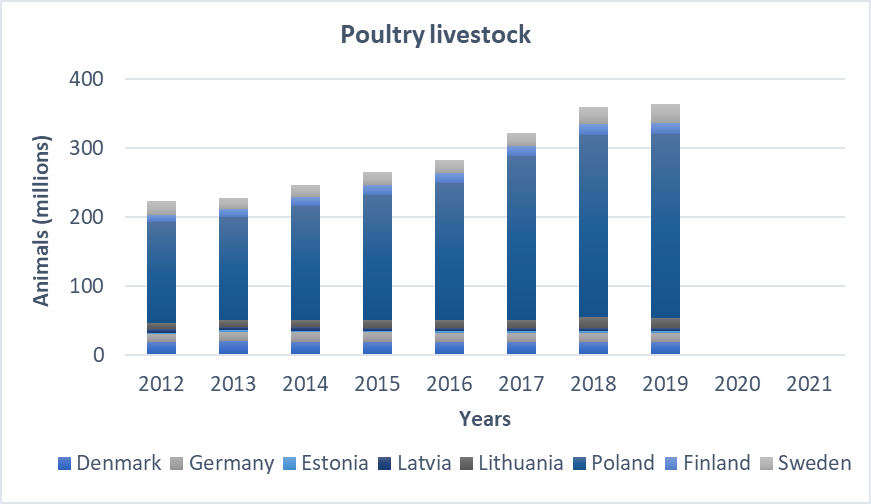
Annex Figure 14: Poultry livestock (million animals) in the Baltic Sea countries. 2014 and 2015 data were calculated based on 2013-2016 slope. Chart does not include data from Russia or any non-HELCOM countries. German data was multiplied by the ratio of national territory in the Baltic Sea catchment area (0.08).
Crop production
Crop production is a significant activity for the Baltic Sea region and crop harvesting represents the majority of total nutrient outputs (57%)(Figure 1, calculated by using nutrient output categories in Eurostat, 2022). Cereal production constitutes a major part of the total production (82%). Among Baltic Sea countries, Poland has the largest crop production. Denmark, Sweden and Lithuania also have a noticeably high crop production.
Crop production by crop type
In terms of cereal production, Poland (F1,11 = 5.891, p = 0.038) and Latvia (F1,11 = 14.840, p = 0.003) have shown significant increasing trend (Annex Figure 15). Total harvested protein crops production (F1,11 = 6.921, p = 0.027) (Annex Figure 16) and total harvested fruits, berries and nuts production (F1,11 = 9.588, p = 0.012) (Annex Figure 18) have also shown significant increasing trend.
It is important to mention that pulses utilize soil bacteria to draw nitrogen from the air. This process replaces the need to add nitrogen fertilizers in pulse crops. Farmers often leave the pulses’ roots in the soil after the crop has been harvested. Using the nitrogen left behind, the next crop can grow without less need for additional chemical fertilizers. Consequently, pulses improve the productivity of the agricultural field (Rahman et al, 2022).
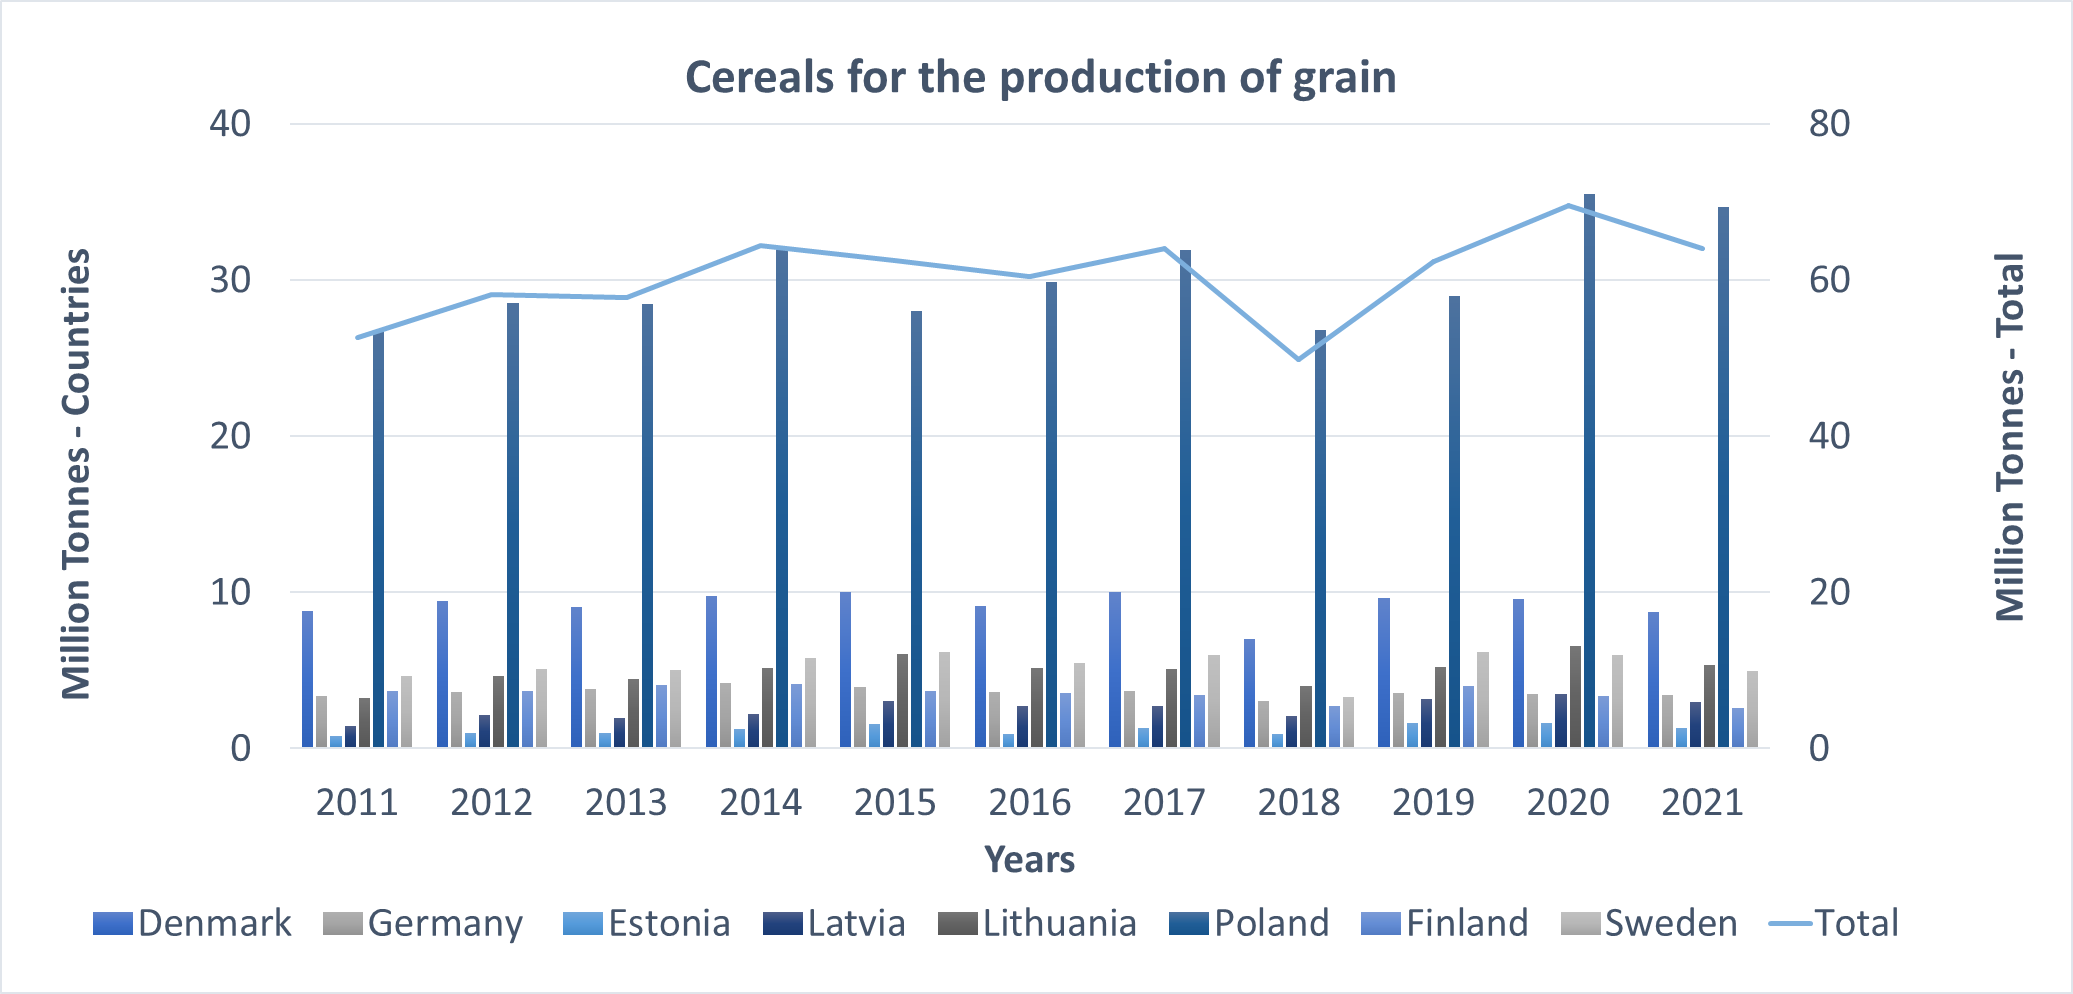
Annex Figure 15: Harvested cereal crop production in EU standard humidity by country (left axis) and totalled (right axis). Chart does not include data from Russia or any non-HELCOM countries. German data was multiplied by the ratio of national territory in the Baltic Sea catchment area (0.08).
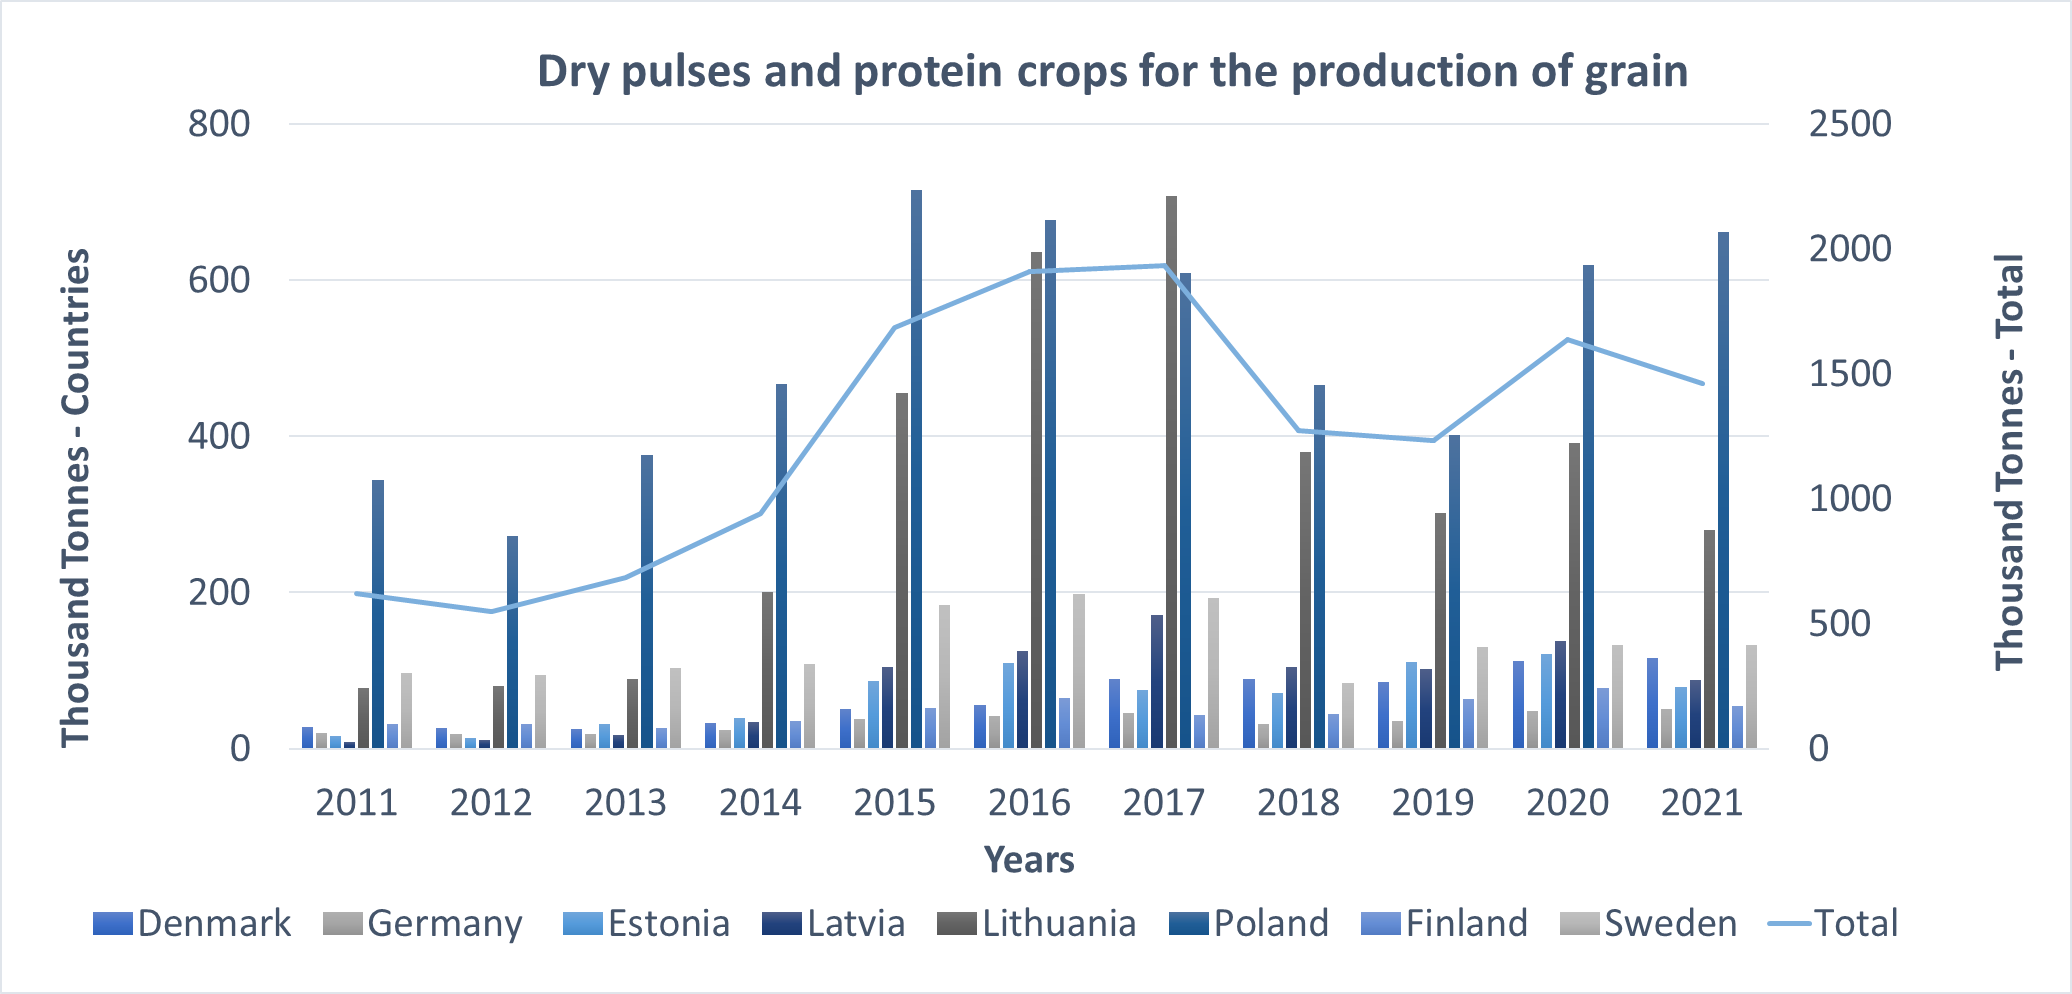
Annex Figure 16: Harvested protein crops production in EU standard humidity by country (left axis) and totalled (right axis). Chart does not include data from Russia or any non-HELCOM countries. German data was multiplied by the ratio of national territory in the Baltic Sea catchment area (0.08).
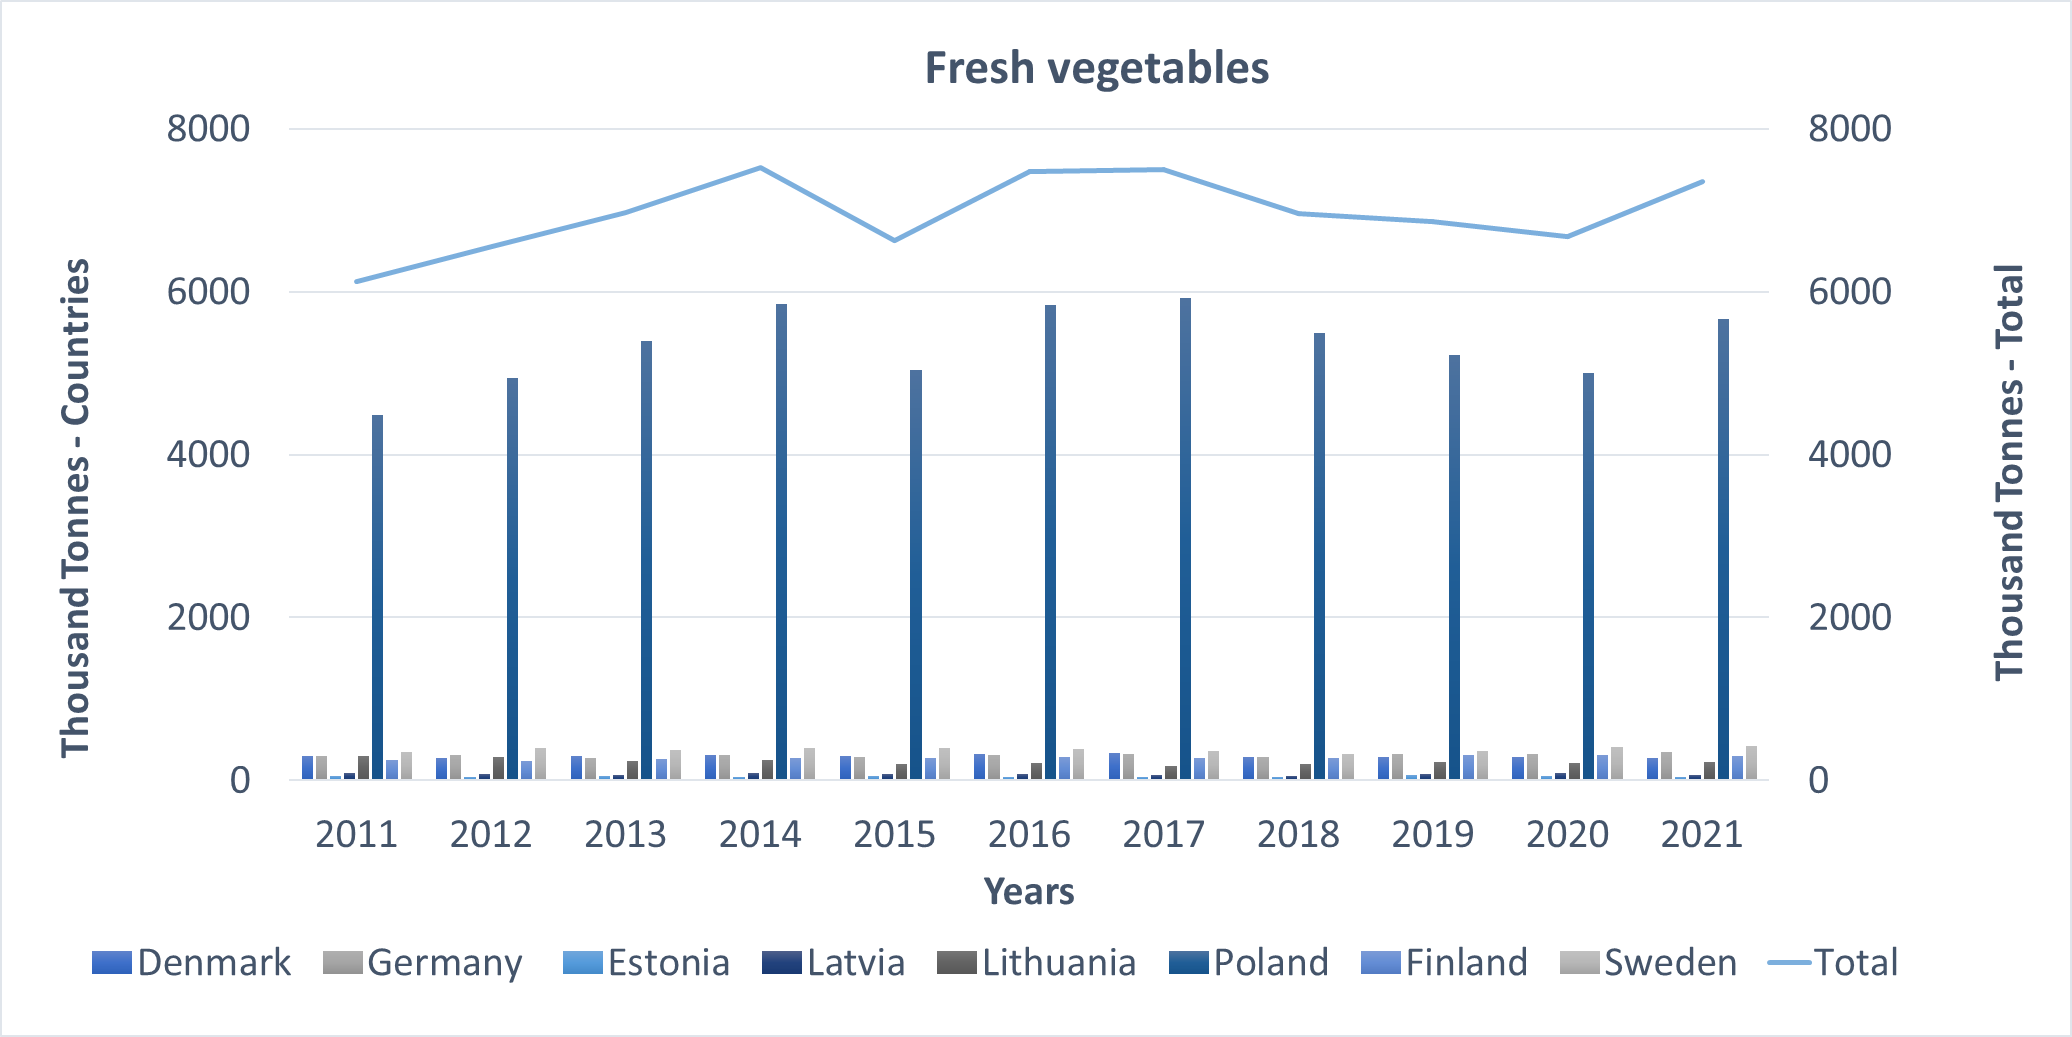
Annex Figure 17: Harvested fresh vegetable production in EU standard humidity by country (left axis) and totalled (right axis). Chart does not include data from Russia or any non-HELCOM countries. German data was multiplied by the ratio of national territory in the Baltic Sea catchment area (0.08).
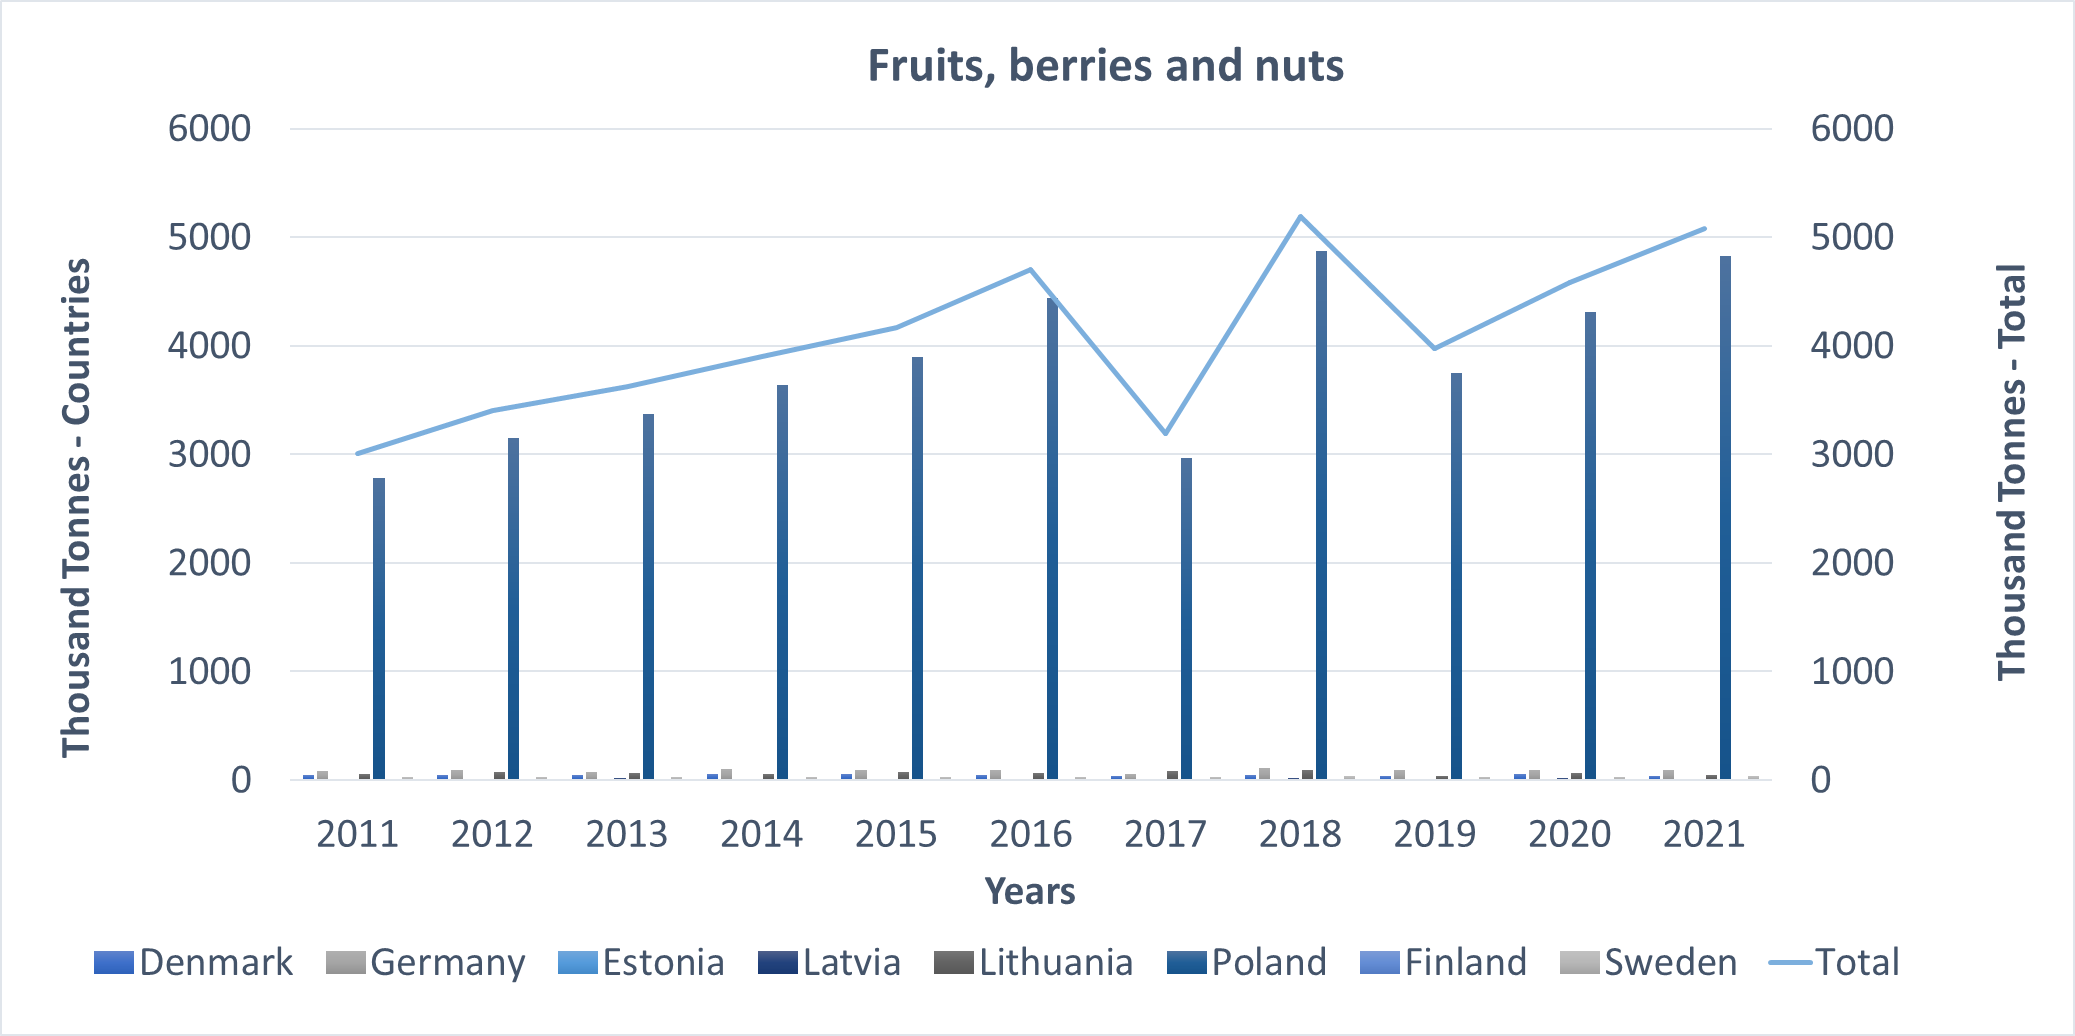
Annex Figure 18: Harvested fruits, berries and nuts production in EU standard humidity by country (left axis) and totalled (right axis). Chart does not include data from Russia or any non-HELCOM countries. German data was multiplied by the ratio of national territory in the Baltic Sea catchment area (0.08).
Conclusions
Fertilizer consumption has the highest contribution both to nitrogen and phosphorus input (50%). Latvia and Sweden have shown an increasing trend in both nitrogen and phosphorus fertilizer consumption. Manure production has been stable over the past decade. CPs show significant variation in the population of specific livestock groups. For instance, Poland has the largest relative share of bovine livestock while Denmark has the largest relative share of pig livestock. This could have impacts on sub-basin nutrient inputs; however, these are not reflected in the Baltic Sea scale. There was a fluctuating trend in agricultural nitrogen and phosphorus output both in overall and each output sub-category. National trends also showed significant variation in nutrient outputs while Poland, Denmark and Sweden have the highest crop harvesting activity. Total crop production in the Baltic Sea Region has been increasing over the past decade (25% increase in total production).