Filtering the indicators
It is possible to filter the indicator based on type (e.g. state, pressure), category (e.g. core, pre-core) and policy relevance (Baltic Sea Action Plan and Marine Strategy Framework Directive).
Search for Indicators
Acidification
1 Key message
Baltic Sea acidification
The Baltic Sea carbonate system is undergoing large changes due to: 1) increasing CO2 in the atmosphere, 2) increasing inputs of total alkalinity (AT) from land, 3) changes in the balance between primary production and respiration due to eutrophication/ oligotrophication, and 4) warming, shifting the carbonate speciation towards higher CO2 partial pressure (pCO2) and lower pH levels.
In some areas of the Baltic Sea, pH is decreasing and pCO2 is increasing at rates substantially higher than experienced from ocean acidification alone.
Although the impact of current levels of pH and pCO2 on populations of indigenous marine organisms is small, continued acidification may threaten species that cannot adapt to a future warmer and acidified Baltic Sea. Organisms exposed to upwelling of hypoxic, corrosive water from the deeper basins are particularly affected.
AT and pH are monitored by the SMHI on a monthly basis, whereas pCO2 is monitored continuously on the commercial ship Finnmaid in a cooperation between IOW and SYKE (Figure 1). Such observations can be used to estimate long-term trends as well as seasonal variations of these key variables. While longer time series exist for the open Baltic Sea, many other areas only have a few spot samples, particularly in the coastal zone. This means that a broader understanding of the acidification development is limited by a sparse spatial and temporal monitoring of key variables.
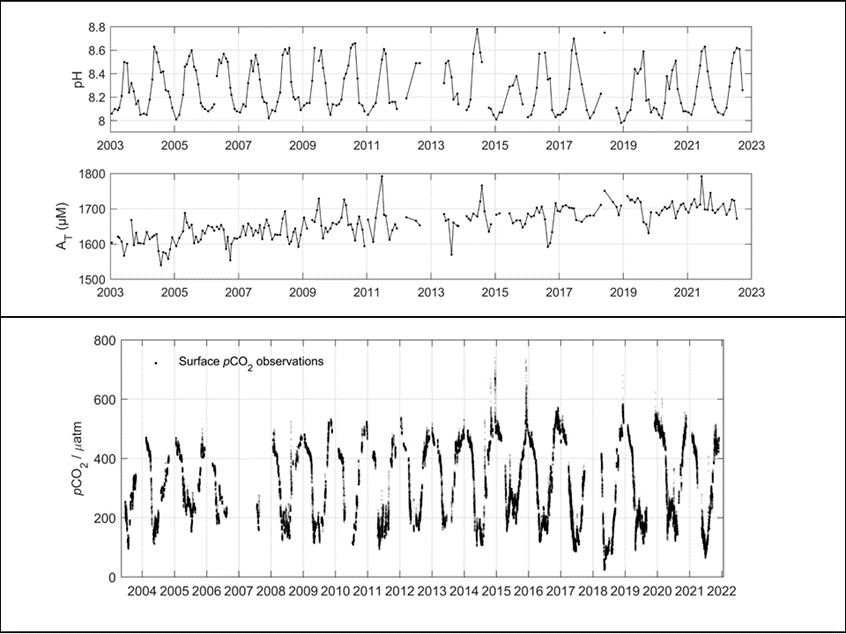
Figure 1. Upper: pH and total alkalinity (AT) data from the monitoring station BY15 (Eastern Gotland Basin) provided by the SMHI. Lower: pCO2 data from an area close to BY15 on the shipping route of Finnmaid.
Citation
The data and resulting data products (e.g. tables, figures and maps) available on the indicator web page can be used freely given that it is used appropriately and the source is cited. The indicator should be cited as follows:
HELCOM (2023) Baltic Sea acidification. HELCOM element indicator report. Online. [Date Viewed], [Web link].
ISSN 2343-2543
Agricultural Nutrient Balance
Drivers and Driver Indicators for Agricultural Nutrient Balance
In the HOLAS 3 work, a limited number of drivers and driver indicators were explored, focusing on early testing and development of the driver – driver indicator methodology and concept. The selected topics and reports are not all encompassing and are proof-of-concept examples.
Please note that driver indicators are clearly differentiated from other HELCOM indicators as they do not address status or pressure directly and can thus not be used other than as supporting information on relevant broader processes.
DAPSIM (Driver-Activity-Pressure-State-Impact-Measure) is a conceptual management framework utilized in HELCOM for visualizing the relationships between society and the environment (HELCOM, 2020). Each component in this framework has connections to one or more other components that allow for the effect of any given component on the other components to be either qualitatively or quantitatively addressed throughout the framework. In this framework the D stands for drivers. For HOLAS 3 purposes, drivers were considered to be ‘’societal and environmental factors that, via their effect on human behaviour or environmental conditions, may influence activities, pressures, or the state of the marine environment’’. It was also requested that for HOLAS 3 drivers of societal relevance were the focus of the pilot development work.
To make the information on drivers useful in an assessment context, they should be connected with other DAPSIM framework components through explanatory proxies. Thus, driver indicators are explanatory proxies that can be quantified or succinctly described and are linked to changes in drivers. Therefore, quantification of drivers and understanding the trends are desirable to ensure a concrete link. Analyses of these driver indicators can be used as a tool to understand societal trends, inform policy makers of environmental risks and to comprehend the interconnectedness of society and the environment, and identify efficient measures.

Beach litter
1 Key message
Macro litter on beaches
This core indicator evaluates the state of the marine environment based on the amount of litter items present on beaches along the Baltic Sea. Good status is achieved when there are less than 20 litter items per 100 m (median without fragments < 2.5 cm) of beach for the entire Baltic Sea. The current evaluation assesses the status during the period 2016-2021.
The beach litter indicator reflects the status of marine macrolitter on beaches along the coast of the Baltic Sea area, both geographical distribution and changes over time. Surveys of litter stranded on the coastline or deliberately left by people on beaches and shores are a primary tool for detection of litter in the marine environment and have been used world-wide to quantify and describe the composition of marine litter pollution. The indicator is defined in terms of median litter abundance per 100 m beach for comparison with the threshold value of less than 20 litter items per 100 m beach.
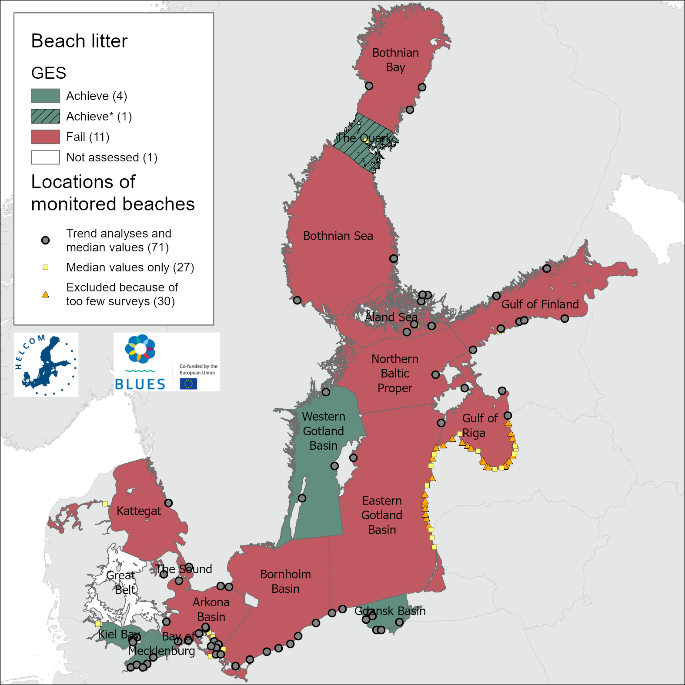
Figure 1. Beach litter evaluation of sub-basins of median values below (green) or above (red) the threshold value of 20 litter items per 100 m. “Achieve *” refers to The Quark which has a median value below the threshold value but includes only limited data for one beach and less than 40 surveys, and consequently the results are less robust. The evaluation has been carried out using Scale 2 HELCOM assessment units (defined in the HELCOM Monitoring and Assessment strategy, 2013, Attachment 4). Different signatures for national monitoring beaches are shown depending on if they have sufficient data for determining robust median values, or also trend analyses or if they are excluded due to too few surveys. See ‘data chapter’ for interactive maps and data at the HELCOM Map and Data Service.
The status evaluation of marine beach litter in the Baltic Sea for 2016-2021 shows that 11 out of 16 sub-basins are above the HELCOM threshold value of 20 litter items per 100 m beach (figure 1). One sub-basin lacks beaches for litter monitoring and therefore cannot be assessed. Three sub-basins; The Sound, Eastern Gotland Basin, and Gulf of Riga, do have median values well above the threshold value. Only one beach is included in The Sound and the results may thus not be representative for the entire sub-basin. For the other two sub-basins, negative trends indicate improving environmental conditions. Eight sub-basins are close to the threshold value, ranging between 23-33 litter items per 100 m beach. These are also below the Baltic Sea-wide baseline level of 40 litter items per 100 m beach for the years 2015-2016. Three of the sub-basins are improving and the others do not show significant trends. Only one sub-basin, the Gdansk one, showed a deteriorating littering trend, but the median value is still below the threshold value.
The most commonly found category of litter is various plastic items and fragments above 2.5 cm. Several of the items on the top-ten list are related to single use plastics and other types of user plastic. Single use plastics are common litter items and a driving force for the trends of marine litter. Marine litter from sea-based sources are only contributing slightly to littering on Baltic Sea beaches.
1.1 Citation
The data and resulting data products (e.g. tables, figures and maps) available on the indicator web page can be used freely given that it is used appropriately and the source is cited. The indicator should be cited as follows:
HELCOM (2023) Beach litter. HELCOM core indicator report. Online. [Date Viewed], [Web link]
ISSN 2343-2543

Breeding success of waterbirds
1 Key message
Breeding success of waterbirds
Waterbird breeding success (also known as breeding productivity) is a highly informative parameter for assessing the state of waterbirds and thereby the status of the marine environment. Problems in the marine environment are reflected rapidly in such a parameter, in contrast to abundance, which can show response time lags of several years between effects of disturbance and impact on the population size. This candidate indicator represents a pilot example for the common guillemot near Gotland and shows how the indicator evaluation works. The results indicate that the species is in good condition with regard to breeding success. The population growth rate indicates an increase in population size over three generations, which is equal to 74.4 years in the case of this species. The good status regarding breeding success points in particular to favourable feeding conditions. With regard to the state of the Baltic Sea, on the other hand, it must be taken into account that the common guillemot benefits from an imbalance in the ecosystem caused by overfishing of cod, leading to small fish being very common and available as a quantitatively significant food source. Results of the indicator (Figure 1) are therefore not usable in isolation from background information or other key ecosystem evaluations.
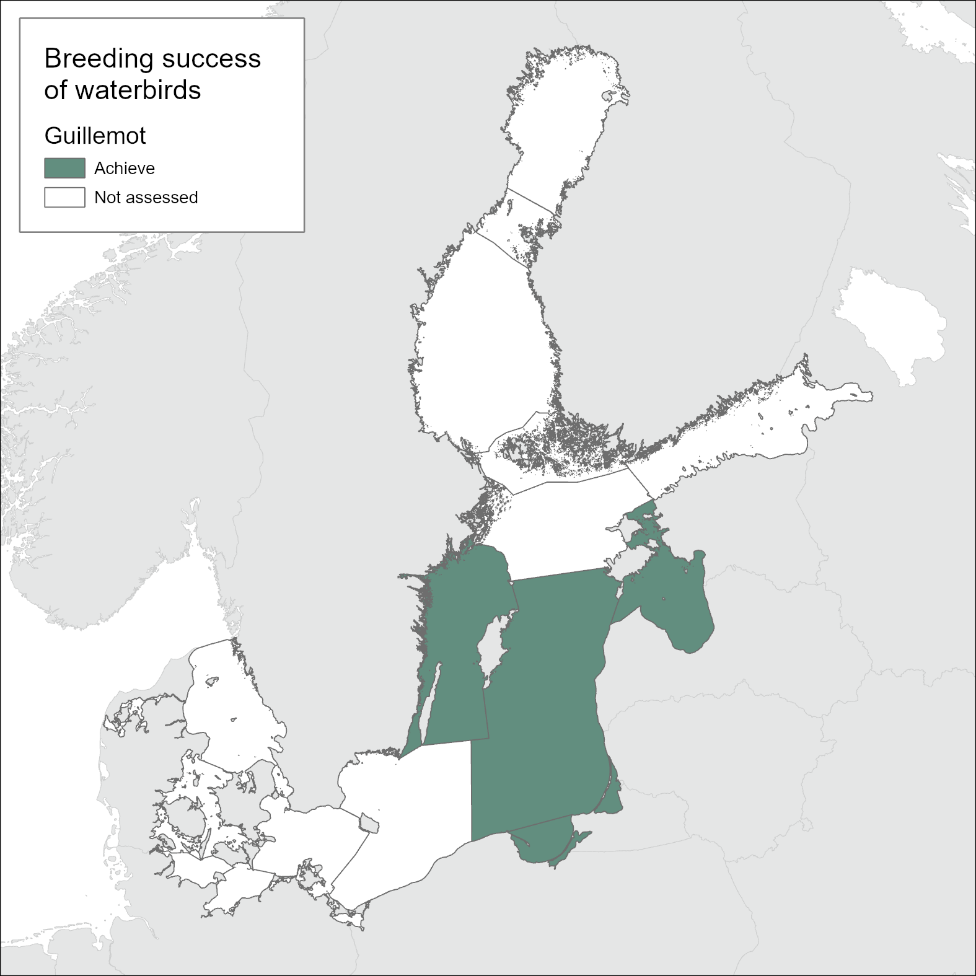
Figure 1. Status evaluation results based on evaluation of the indicator ‘Breeding success of waterbirds’. The evaluation is carried out using open sea areas of Baltic Sea subdivisions (Scale 2 HELCOM assessment units, defined in the HELCOM Monitoring and Assessment Strategy Annex 4. This pilot assessment is based on the breeding success of one species (common guillemot) in one subdivision (Gotland Group). See ‘data chapter’ for interactive maps and data at the HELCOM Map and Data Service.
1.1 Citation
The data and resulting data products (e.g. tables, figures and maps) available on the indicator web page can be used freely given that it is used appropriately and the source is cited. The indicator should be cited as follows:
HELCOM (2023). Breeding success of waterbirds. Online. [Date Viewed], [Web link].
ISSN 2343-2543.
Bycatch
1 Key message
Number of drowned mammals and waterbirds in fishing gear
The widespread lack of adequate data on both by-catch rates and fishing effort has hampered a comprehensive evaluation of by-catch in marine mammals and waterbirds. Marine mammals were evaluated on the population level. Based on the available data, none of the populations of each of the four species of marine mammals (harbour porpoise, ringed seal, harbour seal, grey seal) achieved good status. The harbour seal population of the South-western Baltic and Kattegat could not be assessed. Furthermore, the quality and number of bycatch data for other seal species is inadequately low in the Baltic Sea region. Thus, the evaluation is primarily based on the number of hunted animals. Waterbirds were evaluated on the geographical scale of subdivisions (aggregated sub-basins), with evaluations available for a total of 11 species in four subdivisions. The threshold for good status was not met in any case (Figure 1). The results of this indicator demonstrate that significant mortality from by-catch in fishing gear is widespread across species of marine mammals and waterbirds in the Baltic Sea. In addition to urgent measures to mitigate the problem, monitoring is needed to observe the success of such measures. Information on fishing effort and by-catch of marine mammals and waterbirds is not being recorded and reported in an adequate way allowing the indicator to be fully operationalised. The underlying data quality issues result in a general low confidence in the evaluation as, for example, even where threshold values may be exceeded it may not represent a full understanding of the overall pressure.
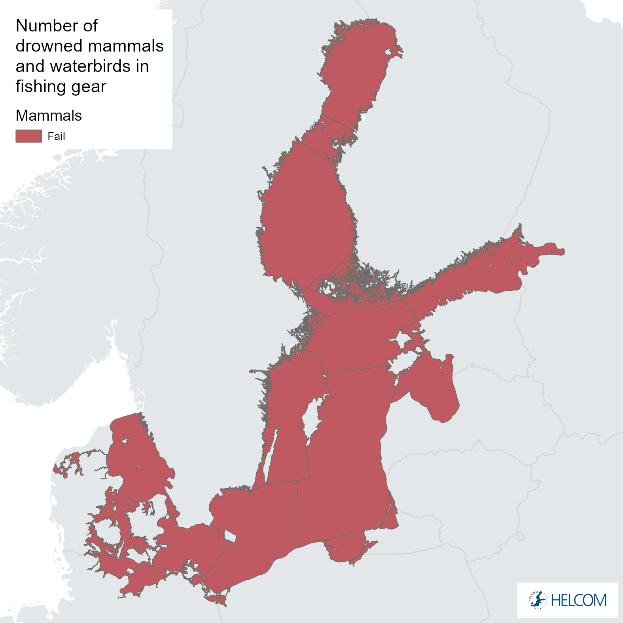
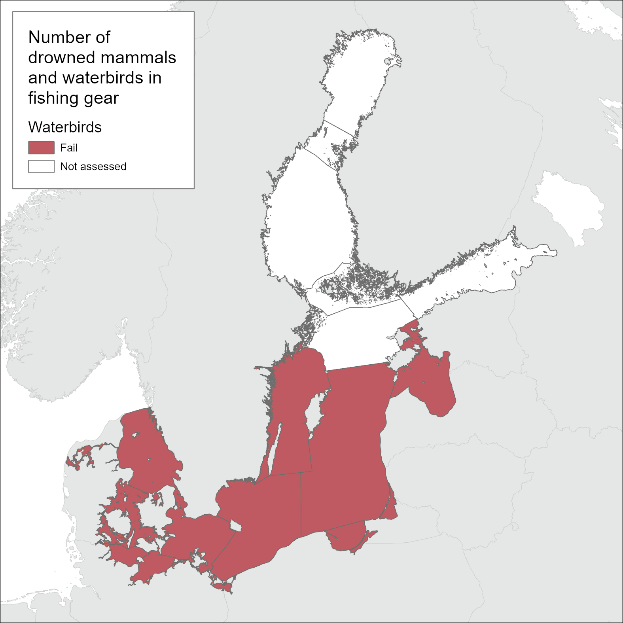
Figure 1. Status evaluation results based on evaluation of the indicator ‘Number of drowned mammals and waterbirds in fishing gear’: marine mammals (left) and waterbirds (right). The evaluation is carried out using Baltic Sea sub-basins of Scale 2 HELCOM assessment units (defined in the HELCOM Monitoring and Assessment Strategy Annex 4). See ‘data chapter’ for interactive maps and data at the HELCOM Map and Data Service.
1.1 Citation
The data and resulting data products (e.g. tables, figures and maps) available on the indicator web page can be used freely given that it is used appropriately and the source is cited. The indicator should be cited as follows:
HELCOM (2023). Number of drowned mammals and waterbirds in fishing gear. HELCOM core indicator report. Online. [Date Viewed], [Web link].
ISSN 2343-2543.

Cadmium
1 Key message
Cadmium (Cd)
This core indicator evaluates the status of the marine environment based on concentrations of cadmium (Cd) measured in seawater, biota and sediments, in the Baltic Sea. Good Environmental Status (GES) is achieved when the concentrations of cadmium in specified matrices are below the specific threshold values.
The indicator presents a status evaluation using all in the monitoring data for the HELCOM region during the assessment period 2016 – 2021 (Figure 1).
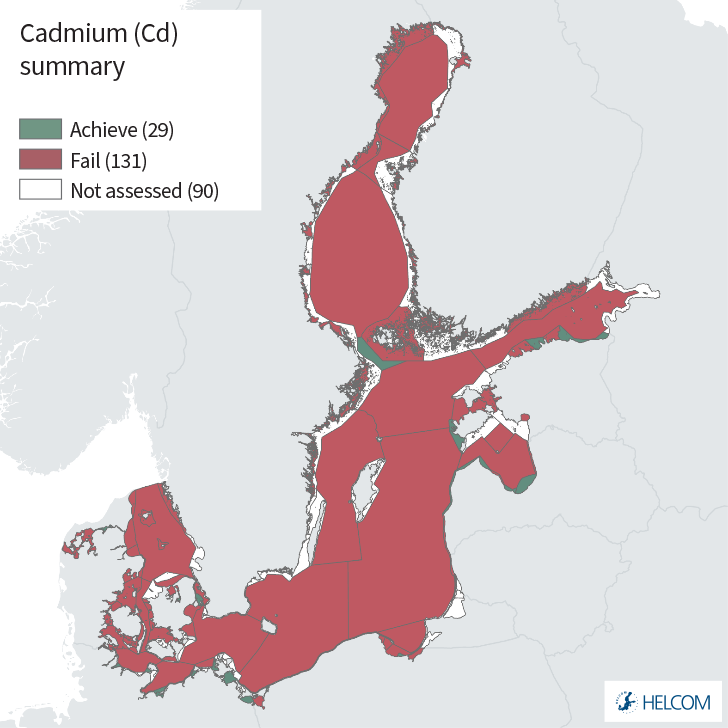
Figure 1. Status evaluation results based on cadmium concentrations. One-Out-All-Out (OOAO) method applied based on evaluations in seawater, biota and in sediment. The evaluation is carried out using Scale 4 HELCOM assessment units (defined in the HELCOM Monitoring and Assessment Strategy Annex 4). See ‘data chapter’ for interactive maps and data at the HELCOM Map and Data Service.
Cadmium (Cd) is evaluated in 160 assessment units, including all seventeen sub-basins and the threshold value is achieved (in GES) in 29 of these assessment units, including one open sea sub-basin (SEA-014 Åland Sea). Failure to achieve the threshold value occurs in all three monitoring matrices (water, biota and sediment), contributing to this overall evaluation (generated via a one-out-all-out, OOAO) approach. Where distinct directional trends were possible to assign in the biota monitoring matrix the downward trends (decreasing concentrations, 18) outnumbered those stations with identified upward trends (increasing concentrations, 6), though in general the majority of these station still failed to achieve the threshold value and were sub-GES (5 out of 24 being in GES).
The confidence of the indicator evaluation is moderate, with a few assessment units achieving high or low confidence. The data on metal concentrations is generally spatially adequate and time series are available for several stations.
The indicator is applicable in the waters of all countries bordering the Baltic Sea.
1.1 Citation
The data and resulting data products (e.g. tables, figures and maps) available on the indicator web page can be used freely given that it is used appropriately and the source is cited. The indicator should be cited as follows:
HELCOM (2023) Metals (cadmium). HELCOM Core Indicator Report. Online. [Date Viewed], [Web link].
ISSN: 2343-2543

Chlorophyll
1 Key message
Chlorophyll-a
This core indicator evaluates the average summer (June – September) chlorophyll-a concentration in surface water (0 – 10 m) during the assessment period 2016–2021.
In open sea areas, good status of chlorophyll-a was achieved in the Kattegat and the Kiel Bay. In the remaining 17 sub-basins, the status was not good (Figure 1). Single coastal assessment units in Sweden, Denmark, Finland, Germany, Poland and Estonia are reported to be in good status. Yet overall, in most of the coastal waters of the Baltic Sea, chlorophyll-a was evaluated to be below good status (see Annex 14.2).
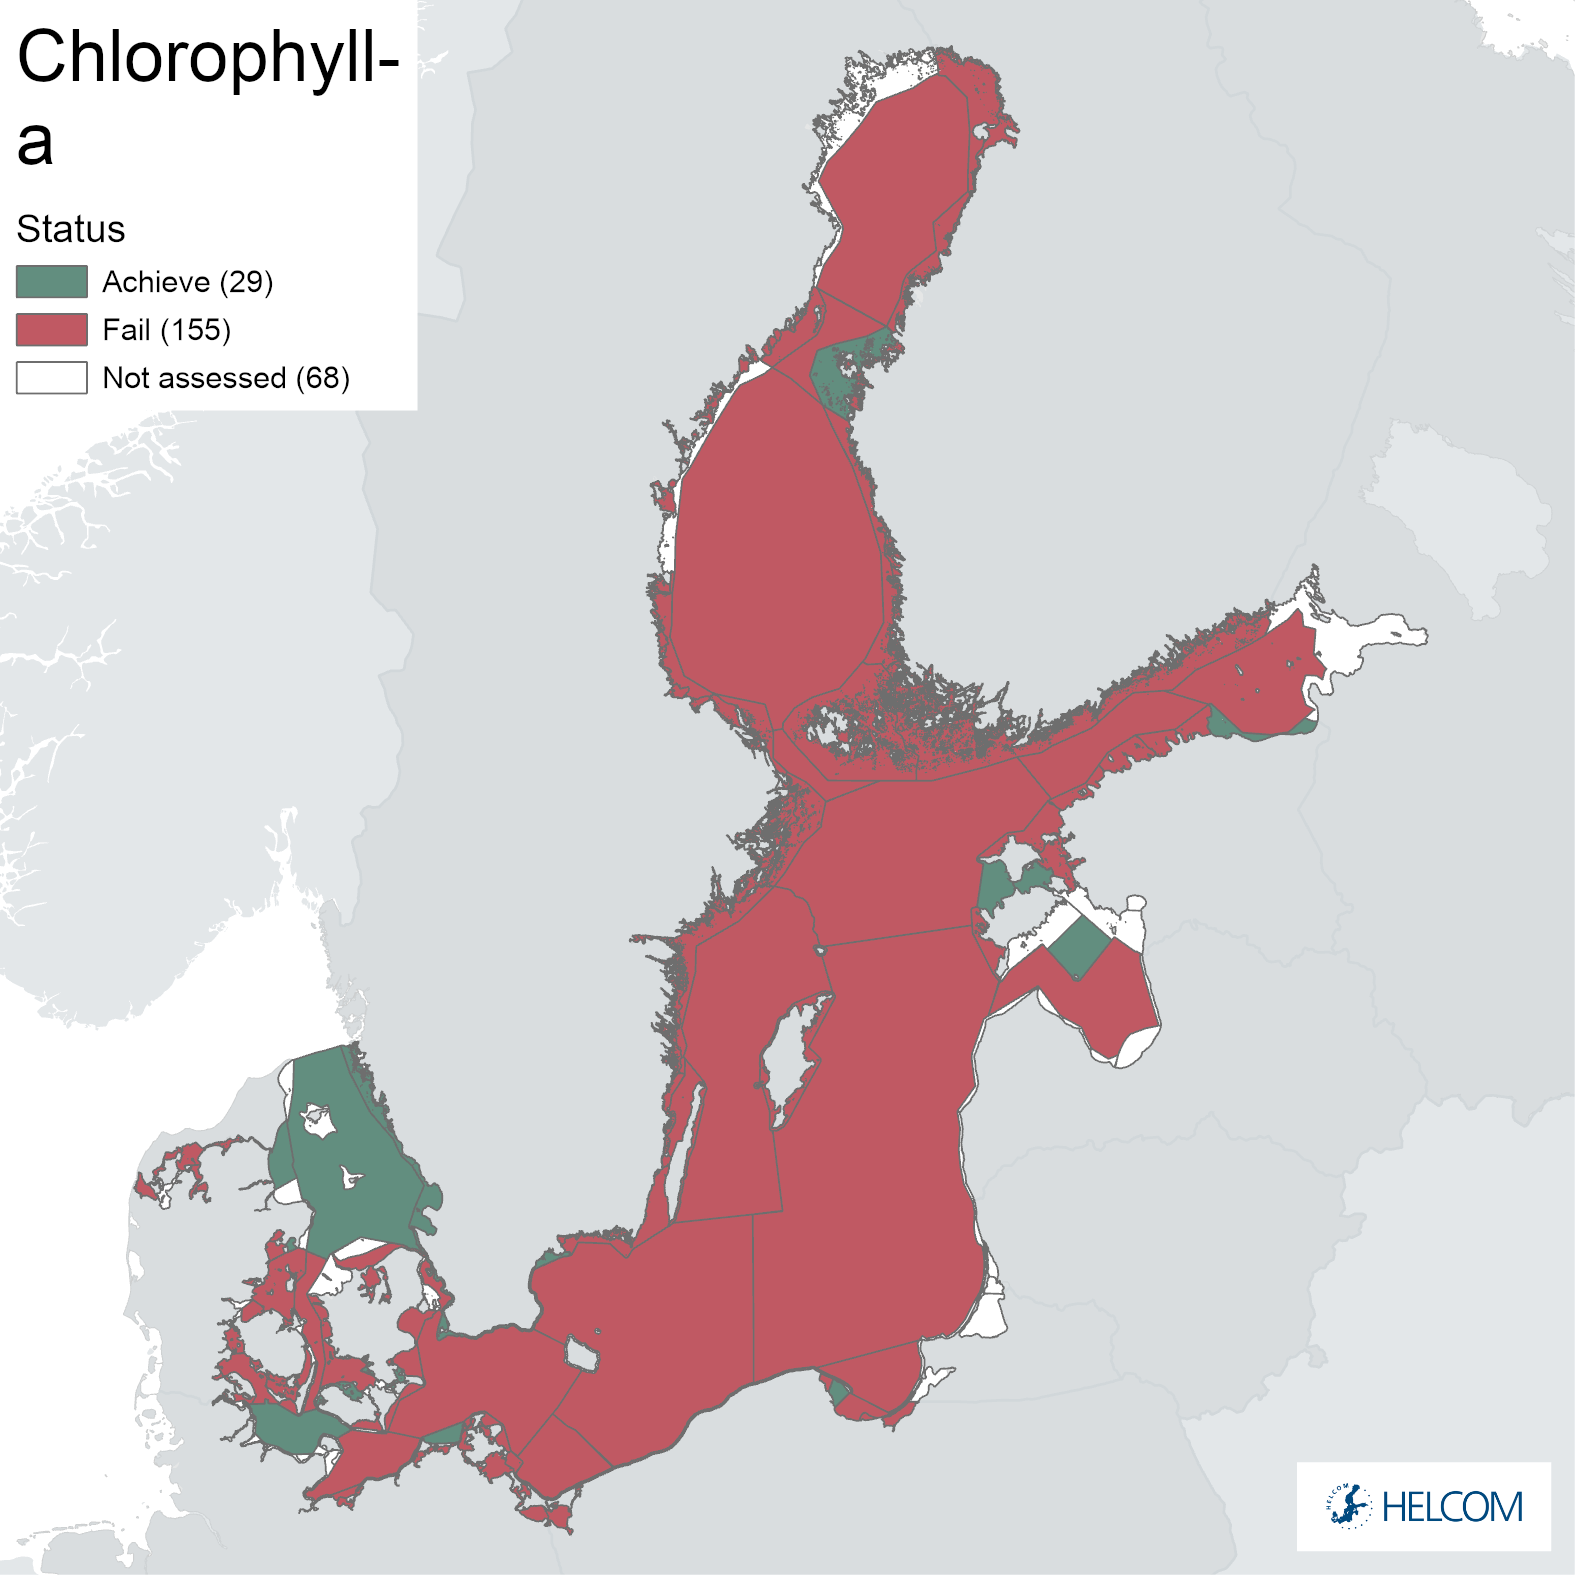
Figure 1. Status evaluation results for the indicator ‘chlorophyll-a’. The evaluation is carried out using Scale 4 HELCOM assessment units (defined in the HELCOM Monitoring and Assessment Strategy Annex 4). See ‘data chapter’ for interactive maps and data at the HELCOM Map and Data Service.
In many subbasins, the summer chlorophyll-a -concentration increased until the 1990s or early 2000s (e.g., Western Gotland Basin, Gulf of Riga, Northern Baltic Proper, Gulf of Finland Eastern and Western). After that, the concentration leveled out or even decreased in most of the areas, with the exception of Bothnian Bay, where a significant deteriorating trend has been detected between 1990-2021. In the most South-Western sub-basins (Kattegat, Great Belt, Kiel Bay, Bay of Mecklenburg) the chlorophyll-a concentration has significantly decreased from 1990- 2021. However, there are recent signs of change in Kattegat, The Sound, Great Belt and adjacent estuaries, where concentrations have turned to an increase since about 2012. When comparing the latest two assessments of HOLAS II and HOLAS 3, the chlorophyll-a status has changed from ‘fail’ to ‘good status’ in Kiel Bay. Overall, the status has improved in four sub-basins and deteriorated in five sub-basins.
The confidence of the presented chlorophyll-a status estimate is high in the Bothnian Sea, Western Gulf of Finland, Northern Baltic Proper, Western Gotland Basin, Eastern Gotland Basin, Gulf of Riga, Gdansk Basin, Bornholm Basin, Pomeranian Bay, Arkona Basin, Bay of Mecklenburg, Kiel Bay and Kattegat, and moderate in the remaining open sea assessment units.
1.1 Citation
The data and resulting data products (e.g. tables, figures and maps) available on the indicator web page can be used freely given that it is used appropriately and the source is cited. The indicator should be cited as follows:
HELCOM (2023). Chlorophyll-a. HELCOM core indicator report. Online. [Date Viewed], [Web link].
ISSN 2343-2543

Coastal fish key groups
1 Key message
Abundance of coastal fish key functional groups
This core indicator evaluates the abundance of selected functional groups of coastal fish in the Baltic Sea. As a rule, good status is achieved when the abundance of cyprinids or mesopredators (i.e. mid trophic-level fish) is within an acceptable range for the specific coastal area. The status of functional groups of coastal fish in the Baltic Sea has been evaluated by assessing the status of cyprinids and mesopredators during the period 2016-2020 (Figures 1 and 2).
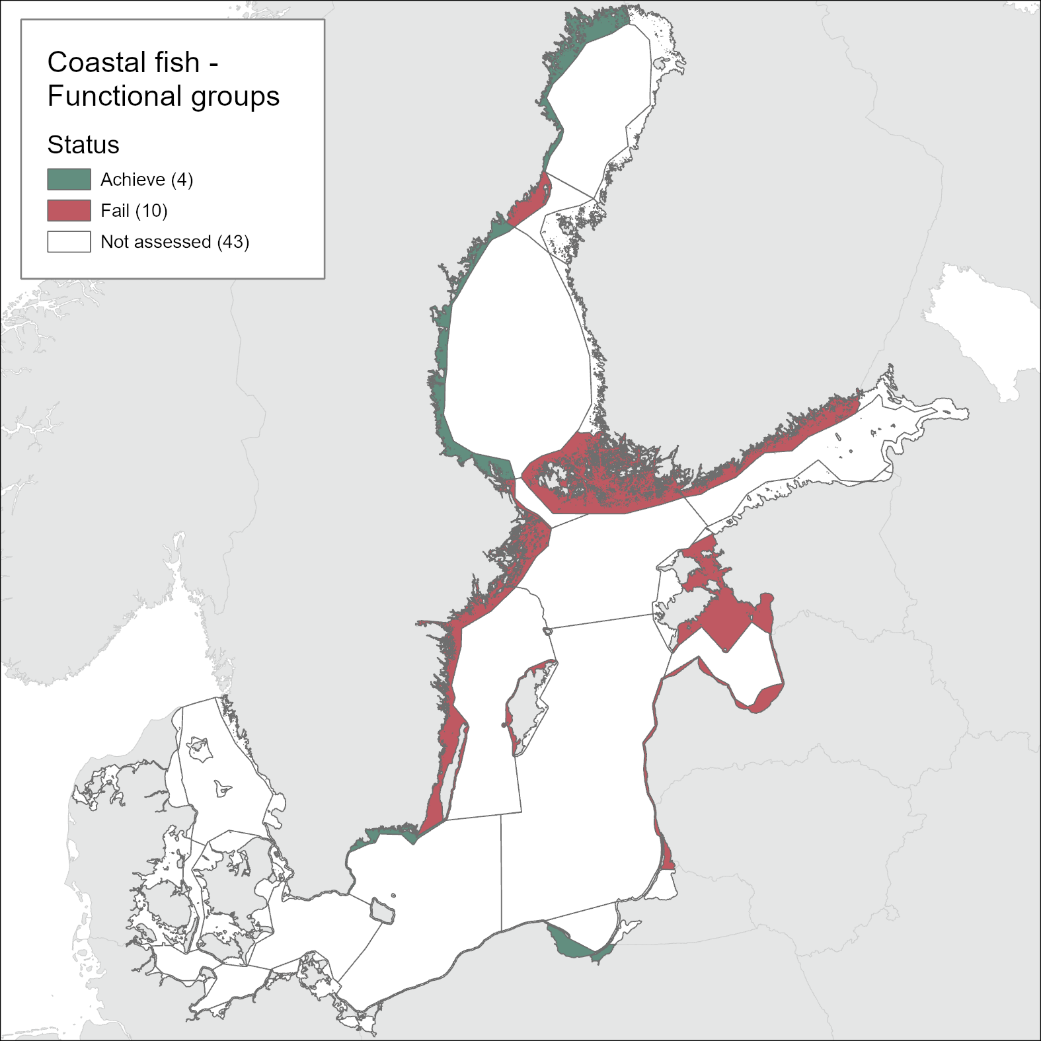
Figure 1. Status evaluation results based on the evaluation of the indicator ‘abundance of coastal fish key functional groups’ – integrated results of the two functional groups, cyprinids and mesopredators (see Figure 2 for separate). The evaluation is carried out using Scale 3 HELCOM assessment units (defined in the HELCOM Monitoring and Assessment Strategy Annex 4). See ‘data chapter’ for interactive maps and data at the HELCOM Map and Data Service.
For cyprinids/mesopredators, good status is achieved in 20 of the 32 monitored locations, but integration of the results of all key species over HELCOM assessment units using the One-Out-All-Out principle, showed that good status achieved in only 4 of the 14 evaluated assessment units. In the majority of the monitoring locations (24 locations) cyprinids is evaluated, and in 13 of these the threshold is met. For mesopredators the status appears to be better as the threshold is met in 7 of the in total 9 locations evaluated. Note that in one Swedish location (Kvädöfjärden), both cyprinids and mesopredators are evaluated, and neither meets the threshold, and in two Swedish areas included, the time-series is too short to allow for an evaluation of status.
In the locations classified as not good, the abundance of cyprinids and mesopredators was too high in all but two of the 12 locations (i.e. Hiiumaa in Estonia, and Jurkalne in Latvia).
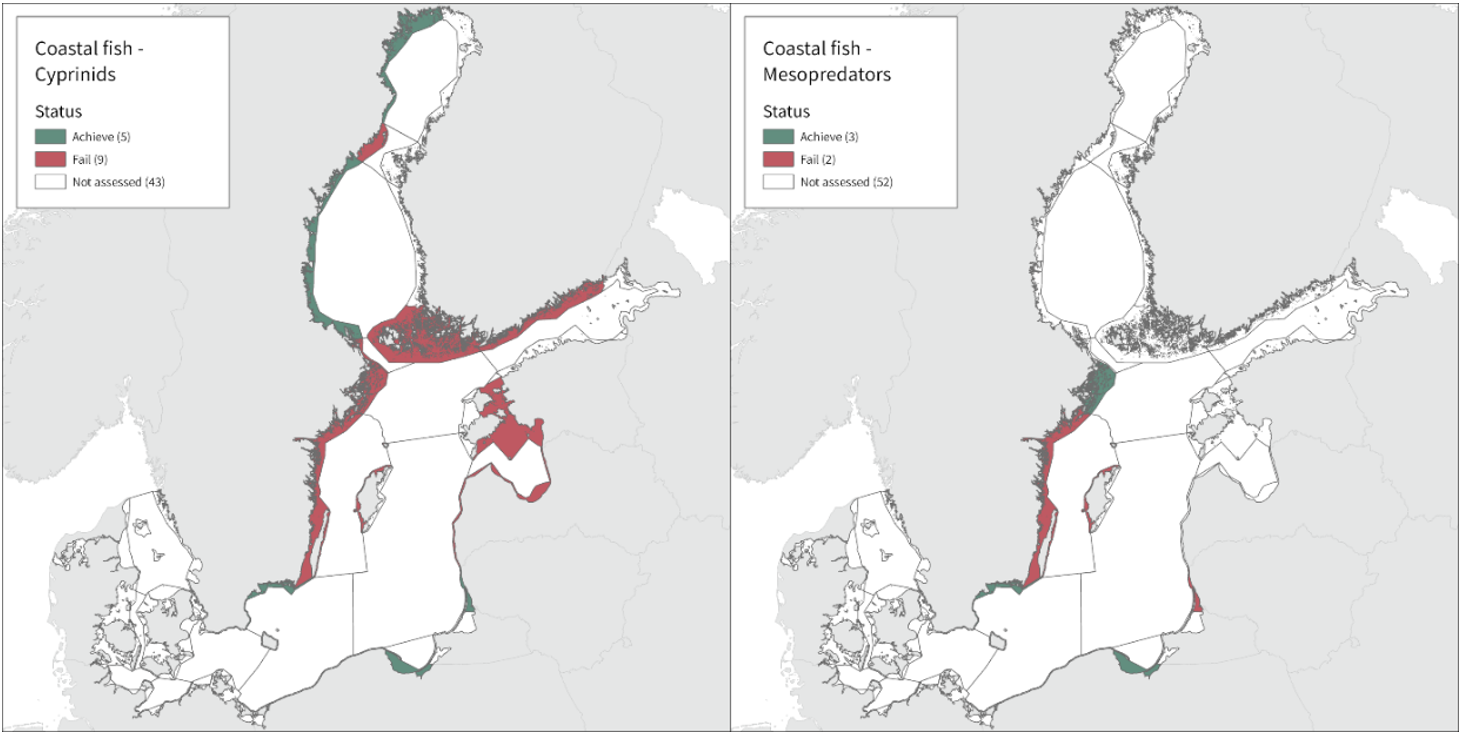
Figure 2. Status evaluation results based on the evaluation of the indicator ‘abundance of coastal fish key functional groups’ – results shown separately for the two functional groups cyprinids to the left and mesopredators to the right. The evaluation is carried out using Scale 3 HELCOM assessment units (defined in the HELCOM Monitoring and Assessment Strategy Annex 4). See ‘data chapter’ for interactive maps and data at the HELCOM Map and Data Service.
Generally, good status is not achieved in more central parts of the Baltic Sea including the Swedish part of the Quark, Åland Sea, Northern Baltic Proper and Western Gotland Basin, in more southern Finnish coastal waters (Archipelago Sea and Gulf of Finland), and in Estonian and Latvian coastal waters. Note that functional groups are not evaluated in the Finnish coastal areas of the Bothnian Bay and Bothnian Sea due to lack of data.
The level of confidence in the evaluation differs between areas and regions due to differences in monitoring methodology as well due to lower temporal and spatial coverage of monitoring in some countries, the latter generally relating to resource availability. The methodological confidence is high in all areas, and the confidence in the accuracy of the evaluation is high in the majority of the assessment units. The confidence in the temporal coverage is high in all areas except for Latvian and Lithuanian coastal areas, and the confidence in spatial representability is moderate to high in all assessment units evaluated besides those in Estonia and Latvia. The overall integrated confidence evaluation considering all four categories is high in five assessment units and intermediate in the remaining nine units, with no clear spatial pattern.
The indicator is operational in the coastal waters of most countries bordering the Baltic Sea. For the time being, it is not applicable in some areas where coastal fish monitoring data are scarce, or where the group meso-predators overlaps heavily with the species reported under the indicator “Abundance of coastal fish key species” and further studies as well as time series are needed to yield a reliable evaluation. In the future, in line with increasing knowledge, the indicator might undergo further development.
1.1 Citation
The data and resulting data products (e.g. tables, figures and maps) available on the indicator web page can be used freely given that it is used appropriately and the source is cited. The indicator should be cited as follows:
HELCOM (2023) Abundance of coastal fish key functional groups. HELCOM core indicator report. Online. [Date Viewed], [Web link].
ISSN 2343-2543

Coastal fish key species
1 Key message
Abundance of key coastal fish species
This core indicator evaluates the abundance of typical key species of fish, such as perch, flounder, pike, pikeperch, whitefish, and eelpout, to assess environmental status in coastal areas of the Baltic Sea. As a rule, good status is achieved when the abundance is above a set site- and species-specific threshold value.
The current evaluation assesses status during the period 2016-2020 (Figure 1).
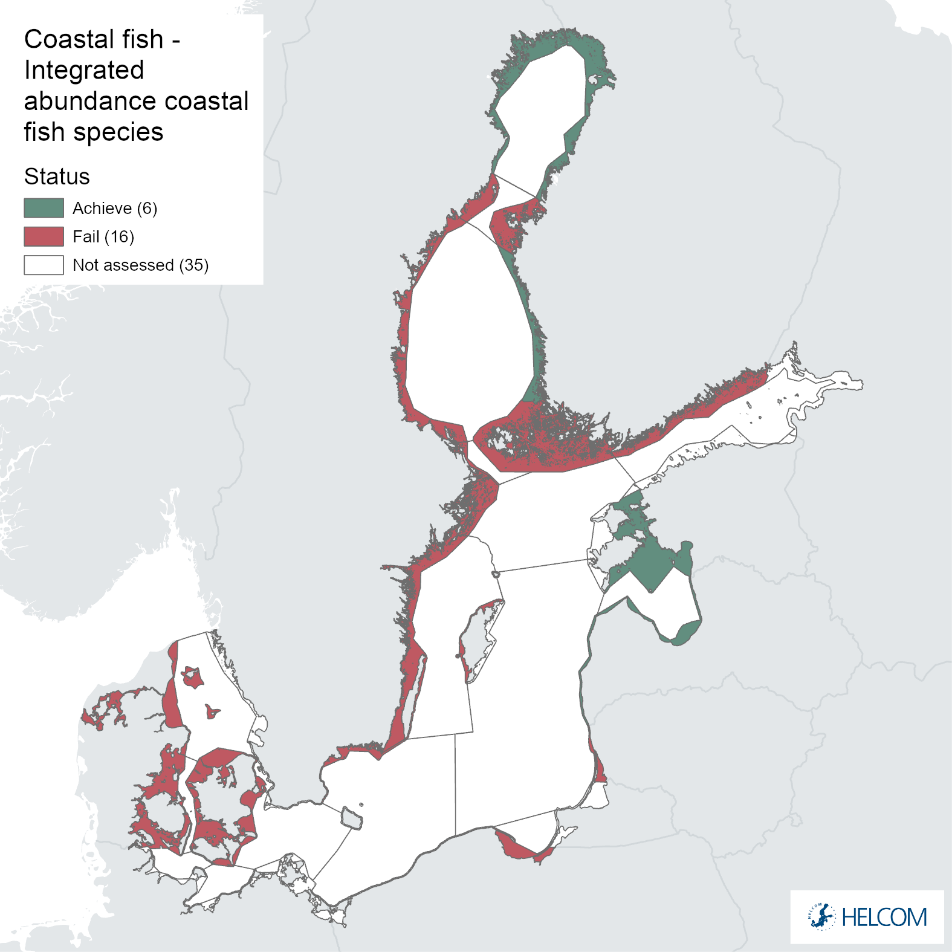
Figure 1. Status evaluation results based on the evaluation of the indicator ‘abundance of key coastal fish species’. The evaluation is carried out using Scale 3 HELCOM assessment units (defined in the HELCOM Monitoring and Assessment Strategy Annex 4). See ‘data chapter’ for interactive maps and data at the HELCOM Map and Data Service.
Overall, this evaluation included between one and five key species per monitoring location and assessment unit. Good status for perch was achieved in 24 of 31 monitoring locations, and for flounder in 8 of 26 locations. An additional two monitoring locations were evaluated for flounder abundance, but time-series remained too short in these locations to do a full status evaluation. For the remaining species considerably fewer locations were evaluated, and yielded the following results: 2 of 7 locations achieved good status for pike, 6 of 9 for pikeperch, 5 of 11 for whitefish, and 10 of 14 for eelpout. When comparing the two best represented key species, perch and flounder, good status is generally more often reached in areas in the northern and eastern parts of the Baltic Sea where perch is the key species. In the western and southern areas of the Baltic Sea where flounder is the key species, the status is more often not good. For pike, pikeperch, whitefish, and eelpout, the more limited data does indicate that the status for pike and whitefish tend to be poor in the majority of locations, while pikeperch and eelpout both achieve good status in two thirds or more of monitoring locations. Integration of the results of all key species over HELCOM assessment units using the One-Out-All-Out principle showed that good status is achieved in 6 of 22 evaluated units. Good status is only achieved in the Bothnian Bay, the Finnish side of the Bothnia Sea, and along the coasts of Estonia, and Latvia. In all, this indicates an overall poor status of coastal fish key species in the Baltic Sea.
The level of confidence in the evaluation differs between coastal areas and regions as a result of differences in monitoring methodology, as well as lower temporal and spatial coverage of monitoring in some countries. The methodological confidence is high in all monitoring locations while the confidence in the accuracy of the evaluation is consistently high in only three assessment units. The confidence in the temporal coverage is high in all assessment units except for in six, where the individual monitoring locations have data missing during one or more years (in Sweden, Poland, Denmark and Finland), and the confidence in spatial representability is highest in the Finnish, Lithuanian, Polish, and Danish areas, but poorer in the other countries. The integrated confidence considering all four categories varies between high and intermediate depending on assessment unit, and is high in the majority of evaluated assessment units.
The indicator is operational in the coastal waters of most countries bordering the Baltic Sea. For the time being, it is not applicable in some areas where coastal fish monitoring data are scarce and further studies as well as time series are needed to yield a reliable evaluation of these areas. In the future, in line with increasing knowledge, the indicator might undergo further development.
1.1 Citation
The data and resulting data products (e.g. tables, figures and maps) available on the indicator web page can be used freely given that it is used appropriately and the source is cited. The indicator should be cited as follows:
HELCOM (2023) Abundance of coastal fish key species. HELCOM core indicator report. Online. [Date Viewed], [Web link].
ISSN 2343-2543

Coastal fish size
1 Key message
Size structure of coastal fish
This core indicator evaluates the size distribution of typical key species of fish, such as perch, flounder, and pikeperch in the coastal areas of the Baltic Sea, to assess environmental status. As a rule, good status is achieved when the size of large fish (size at L90) is above a set gear- and species-specific threshold value.
The current evaluation assesses status during the period 2016-2020 (Figure 1).
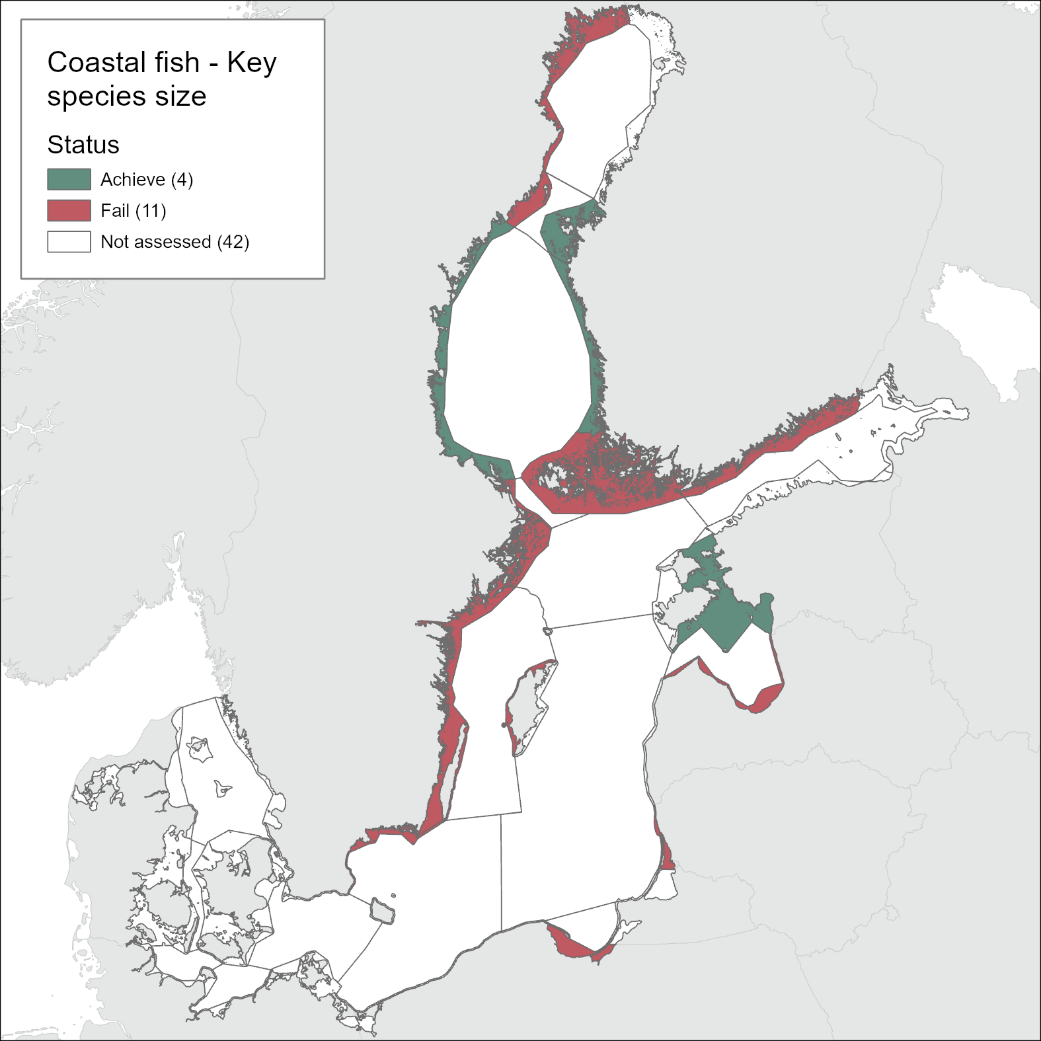
Figure 1. Status evaluation results based on the indicator ‘Size structure of coastal fish’. The evaluation is carried out using Scale 3 HELCOM assessment units (defined in the HELCOM Monitoring and Assessment Strategy Annex 4). See ‘data chapter’ for interactive maps and data at the HELCOM Map and Data Service.
Good status is achieved in 14 out of the total 28 evaluated monitoring locations for perch. Status was not evaluated in relation to a threshold for flounder and pikeperch, but flounder showed stable L90-values over time in 11 out of the in total 12 evaluated monitoring locations, with one area showing an increasing trend over time. Pikeperch showed stable values over time in 2 out of 3 evaluated monitoring locations, with one area showing an increasing trend over time. Integration of the results for perch over HELCOM assessment units using the One-Out-All-Out principle, showed that good status is achieved in only 4 out of 15 evaluated units. Good status is achieved in the Finnish coastal waters of the Quark, in the Bothnian Sea, and in the Estonian coastal waters of the Gulf of Riga.
The indicator is operational in the coastal waters of most countries bordering the Baltic Sea, except Denmark, Germany, and Russia. For the time being, it is not applicable in some areas where coastal fish monitoring data are scarce and further studies as well as time series are needed to yield a reliable evaluation of these areas. In the future, in line with increasing knowledge, the indicator might undergo further development, specifically thresholds for determining good environmental status may be developed for flounder, pikeperch, and other key species in the coastal area.
1.1 Citation
The data and resulting data products (e.g. tables, figures and maps) available on the indicator web page can be used freely given that it is used appropriately and the source is cited. The indicator should be cited as follows:
HELCOM (2023). Size structure of coastal fish (Coastal fish size). HELCOM core indicator report. Online. [Date Viewed], [Web link].
ISSN 2343-2543.
Continuous noise
1 Key message
This indicator is a HELCOM pre-core indicator
This HELCOM pre-core indicator is evaluated for the purposes of the ‘State of the Baltic Sea’ report (HOLAS 3) and further development towards a core indicator is expected in the future. An overview of indicator development is set out in the HELCOM indicator manual.
This indicator evaluates the state of the marine environment based on sound pressure levels in the Baltic Sea in 2018 which is a year considered to be representative for the conditions in the 6-year assessment period (2016-2021). Good status is achieved when the indicator is below the spatial threshold, which expresses a proportion of area, for all months in 2018, for fish (125 Hz decidecade band) and marine mammals (500 Hz decidecade band). The recommendation from EU TG-Noise, the EU expert body working on establishing EU wide methodology and threshold values for the evaluation of underwater noise, is to use a spatial threshold of 20% or lower in the evaluation. As there has not been an opportunity to discuss and agree on a regionally specific threshold value at this stage (i.e., a pre-core evaluation is carried out in this first iteration) for the Baltic Sea, the choice was made to use 20%, which is interpreted as the default value. In accordance with decision by HOD-2021, two variants of the indicator were evaluated. One variant uses the median total sound pressure level as metric. This indicator was below the 20% spatial threshold for all assessment units for both fish (125 Hz decidecade band) and marine mammals (500 Hz decidecade level). The other variant uses the median excess (elevation of ambient noise by anthropogenic sources) as metric. This indicator was below the 20% spatial threshold for all assessment units for marine mammals (figure 1, below), but exceeded the 20% spatial threshold for 9 out of 17 assessment units for masking of fish communication (figure 1, left above), although not for fish behavioural disturbance where it was below the threshold value (figure 1, right above). The pre-core indicator is still to be developed in a range of aspects. While spatial and temporal threshold values have just been adopted at EU level, formal discussions and agreements still remain about their implementation, including the possibility of adopting stricter thresholds and decisions left to be made at the regional level. Most important, this relates to decisions on habitat designation and establishing species(group)-specific values for level of onset of negative effects (LOBE). The indicator will therefore be further discussed and developed towards HOLAS 4.
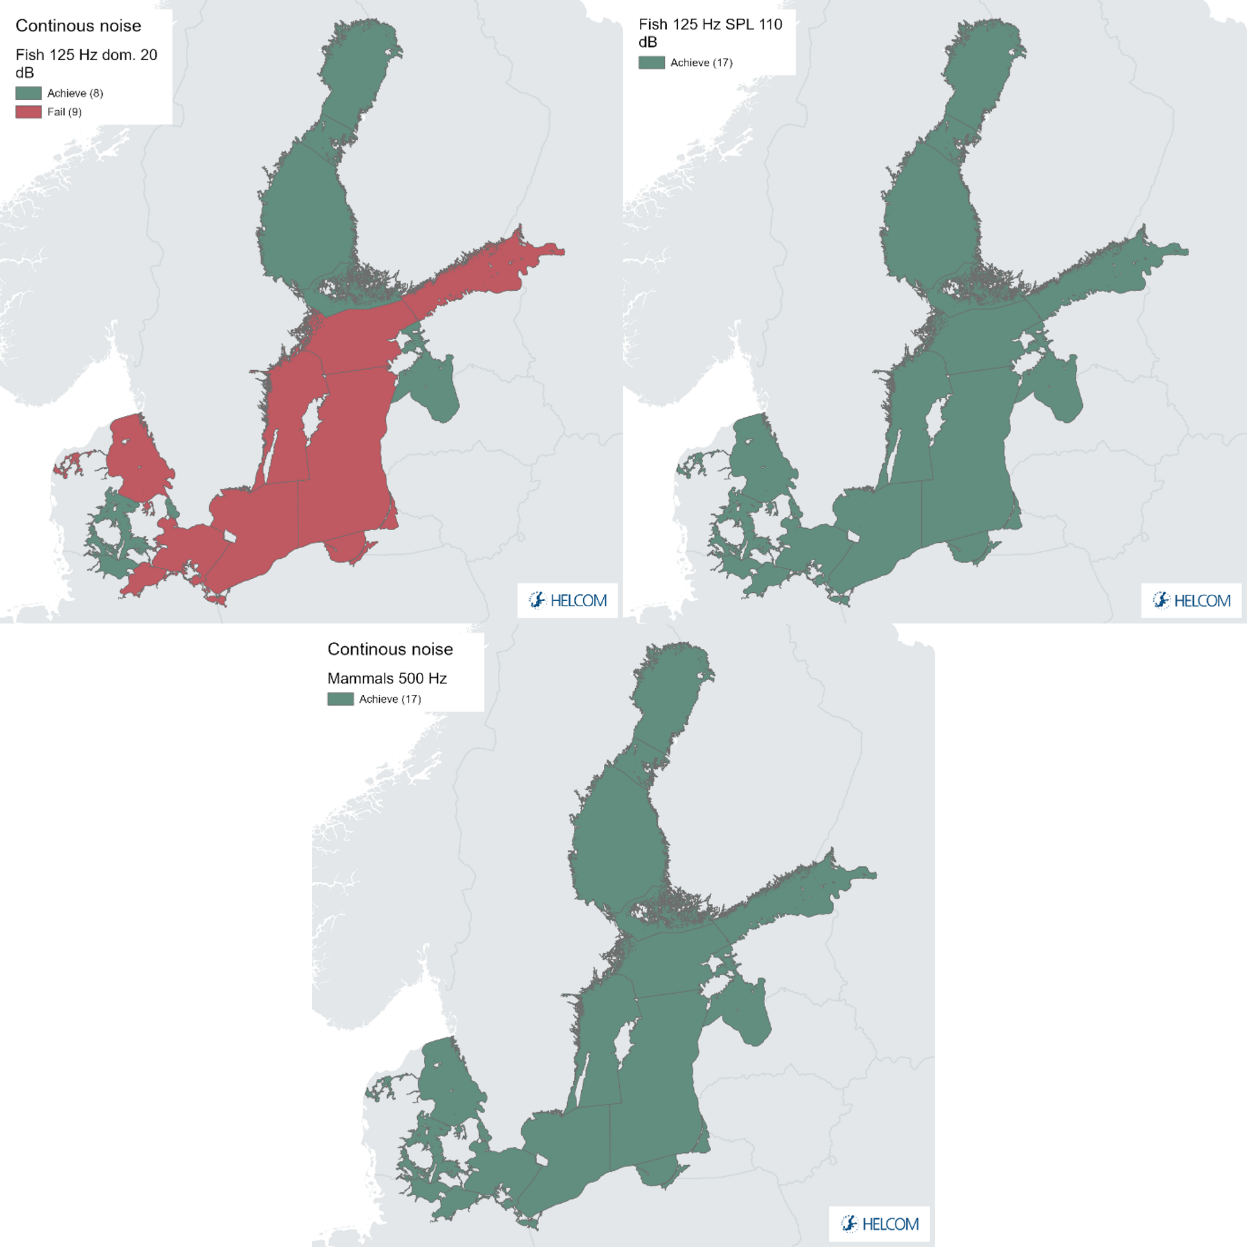
Key message figure 1. Continuous noise evaluation. Fish (Baltic herring and cod) above, on the left side for masking of fish communication and for fish behavioural disturbance on the right side; marine mammals (all seals and harbour porpoise) both for behavioural disturbance and masking, below. Green indicates that the indicator is below the 20% spatial threshold for all months in 2018, red indicates that the indicator was above the 20% spatial threshold in at least one month of 2018. The evaluation has been carried out using Scale 2 HELCOM assessment units (defined in the HELCOM Monitoring and 24 Assessment strategy, 2013, Attachment 4). Note that the outcome of the evaluation depends on the choice of the spatial threshold and therefore may change, if a different (lower) value should be agreed upon by HELCOM at a later time. See ‘data chapter’ for interactive maps and data at the HELCOM Map and Data Service.
1.1 Citation
The data and resulting data products (e.g. tables, figures and maps) available on the indicator web page can be used freely given that it is used appropriately and the source is cited. The indicator should be cited as follows:
HELCOM, 2023. Continuous low frequency anthropogenic sound. [HELCOM core indicator report]. Online. [Date Viewed], [Web link].
ISSN 2343-2543

Copper
1 Key message
Copper (Cu)
This core indicator evaluates the status of the marine environment based on concentrations of copper (Cu) in Baltic Sea sediments. Good status is achieved when the concentrations of Cu are below the specific threshold value agreed regionally to represent Good Environmental Status (GES). The indicator presents a status evaluation using available data in the HELCOM region during the assessment period 2016 – 2021.
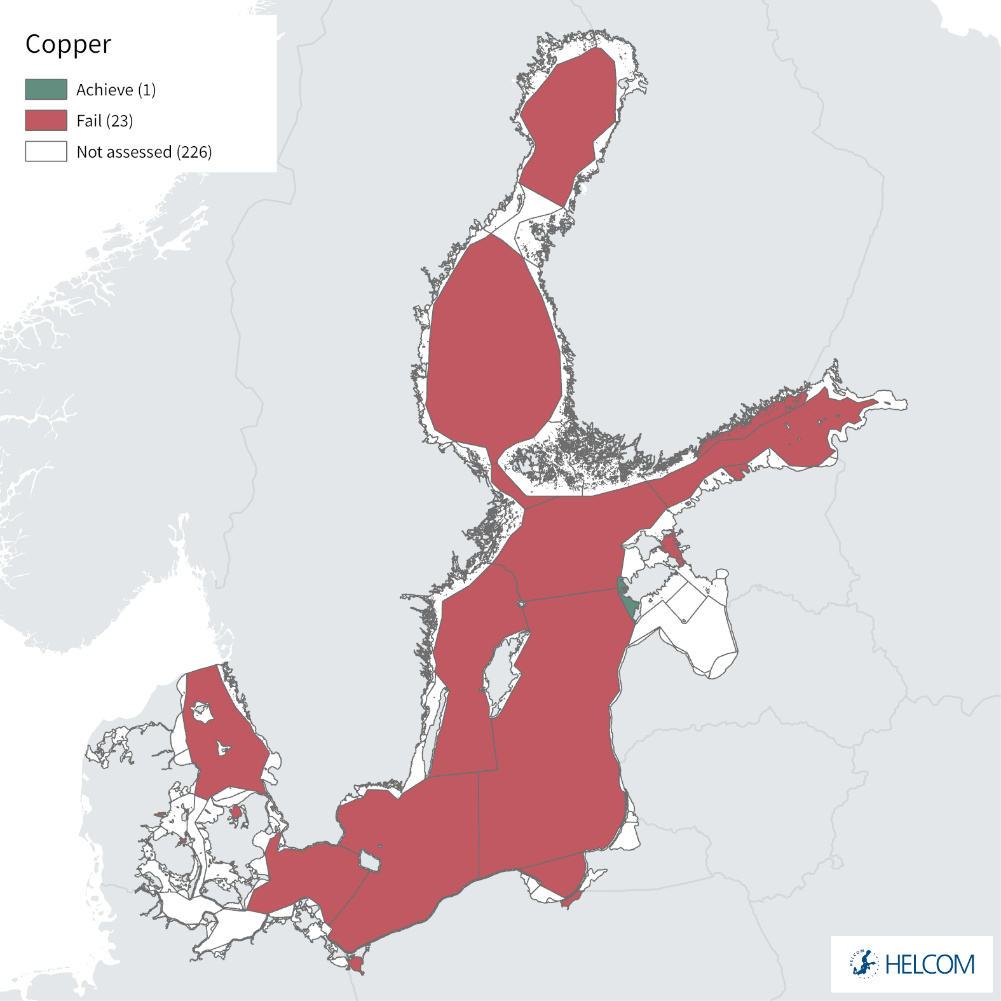
Figure 1. Status evaluation results based on evaluation of the copper (Cu) indicator. The evaluation is carried out using Scale 4 HELCOM assessment units (defined in the HELCOM Monitoring and Assessment Strategy Annex 4). See ‘data chapter’ for interactive maps and data at the HELCOM Map and Data Service.
Good status is achieved for one of the 24 assessment units evaluated, Estonia coastal waters in the Eastern Gotland Basin. All open sea assessment units evaluated (11) fail to achieve the agreed threshold value (sub-GES). The remaining coastal areas (12), except for the Kihelkonna Bay CWB (EST-011), also fail to achieve the threshold value and are also thus considered to be sub-GES.
Load estimations of Cu to the Baltic Sea from natural sources and human activities have been compiled by Ytreberg et al. (2022) for the year 2018. Total annual input of copper to the Baltic Sea was 1560 t/year, where the largest source is from riverine input (850 t/year) followed by shipping (518 t/year) atmospheric deposition (116 t/year), leisure boating (57 t/year) and direct point sources (19 t/year).
The indicator requires organic carbon as a supporting parameter as the threshold value of 30 mg/kg (dry weight sediment) corrected to 5% organic carbon evaluates toxicity related to the bioavailability of copper.
The confidence of the indicator evaluation results is considered to be moderate to high in those assessment units where data was available and an evaluation was possible to achieve. The methodology applied to derive the threshold value is based on the Technical Guidance Document No. 27 (European Commission, 2018) and from expert elicitation workshops. The threshold value is derived based on a probabilistic approach using a species sensitivity distribution (SSD) curve and the overall methodological confidence is scored as high. The confidence in the status evaluation is however considered to be moderate, mainly due to uncertainties in how to account for local background concentrations of copper.
The indicator is applicable in the waters of all the countries bordering the Baltic Sea.
1.1 Citation
The data and resulting data products (e.g. tables, figures and maps) available on the indicator web page can be used freely given that it is used appropriately and the source is cited. The indicator should be cited as follows:
HELCOM (2023). Copper. HELCOM core indicator report. Online. [Date Viewed], [Web link].
ISSN 2343-2543.

Cumulative impact from physical pressures on benthic biotopes
Key message
The benthic biotopes in the Baltic Sea are negatively affected by several human activities causing physical disturbance to the seafloor. The indicator Cumulative impact from physical pressures on benthic biotopes (CumI) performs a predictive evaluation of the cumulative (i.e., aggregated) potential impact of several anthropogenic physical pressures on the benthic biotopes in the Baltic Sea. In this sense, the CumI performs a risk analysis, assessing the risk for a certain change in the environmental state due to the pressures exerted. The CumI is thus addressing the Baltic Sea Action Plan (BSAP) ecological objective of Natural distribution, occurrence and quality of habitats and associated communities (within the BSAP segment of Natural Marine Landscapes) and the Marine Strategy Framework Directive (MSFD) assessment criterion D6C3 that examines the extent of benthic Broad habitats (MSFD BHTs, based on EUSeaMap 2021) adversely affected by physical disturbance. The benthic biotopes addressed by the CumI refer to the benthic abiotic habitats including their associated biological benthos communities.
The current evaluation of the CumI includes bottom trawling fishery and mariculture, extraction and disposal of sediments (e. g. dredging and dumping), construction/building and operation of pipelines and cables, platforms and wind farms, coastal protection and shipping. The indicator predicts the cumulative impact of these multiple pressures. Studying single pressures in isolation (sectoral approach) only provides a biased or skewed evaluation in terms of seafloor integrity as a whole as multiple pressures are typically acting on the environment at the same time. Therefore, this cumulative approach is in line with the ecosystem approach, addressing the potential impact of multiple co-occurring pressures. This is an approach that underlies the BSAP and the MSFD. The indicator does not perform a mapping of actual real impacts. It is based on a modelling approach, using biotope sensitivities (i.e., the sensitivities of the benthic communities living in specific broad habitat types) and the magnitude of the pressure, often derived from general pressure data reported by HELCOM Contracting Parties. The resulting impacts can be interpreted as the potential change in the environmental state of benthic biotopes, given an undisturbed environment. Thus, it is important to note that the CumI is a risk indicator and, thus, does not deliver a state evaluation, while still contributing to the overall evaluation of seafloor integrity.
The highest cumulative impact risk from the physical pressures listed above generally occurs in the southern part of the Baltic Sea and in the Kattegat (Figure 1), dominated by wide-area pressures such as bottom trawling fishery. Bottom trawling can have long-lasting effects on biotopes, especially those dominated by long-lived benthic fauna. Extraction and disposal of sediments is generally the most severe pressure in most of the northern areas of the Baltic Sea. Locally, in archipelago areas and especially in coastal fairways, erosion from shipping can have an impact on seafloor sediments. Pressures such as coastal protection are constrained to very narrow stretches or points on the coastline and are occurring in the whole Baltic Sea region. However, they may not be visible in the static map in Figure 1 due to the small-scale pressure in the coastal region footprint and large scale of the map (see interactive results under the HELCOM Map and Data Service, MADS).
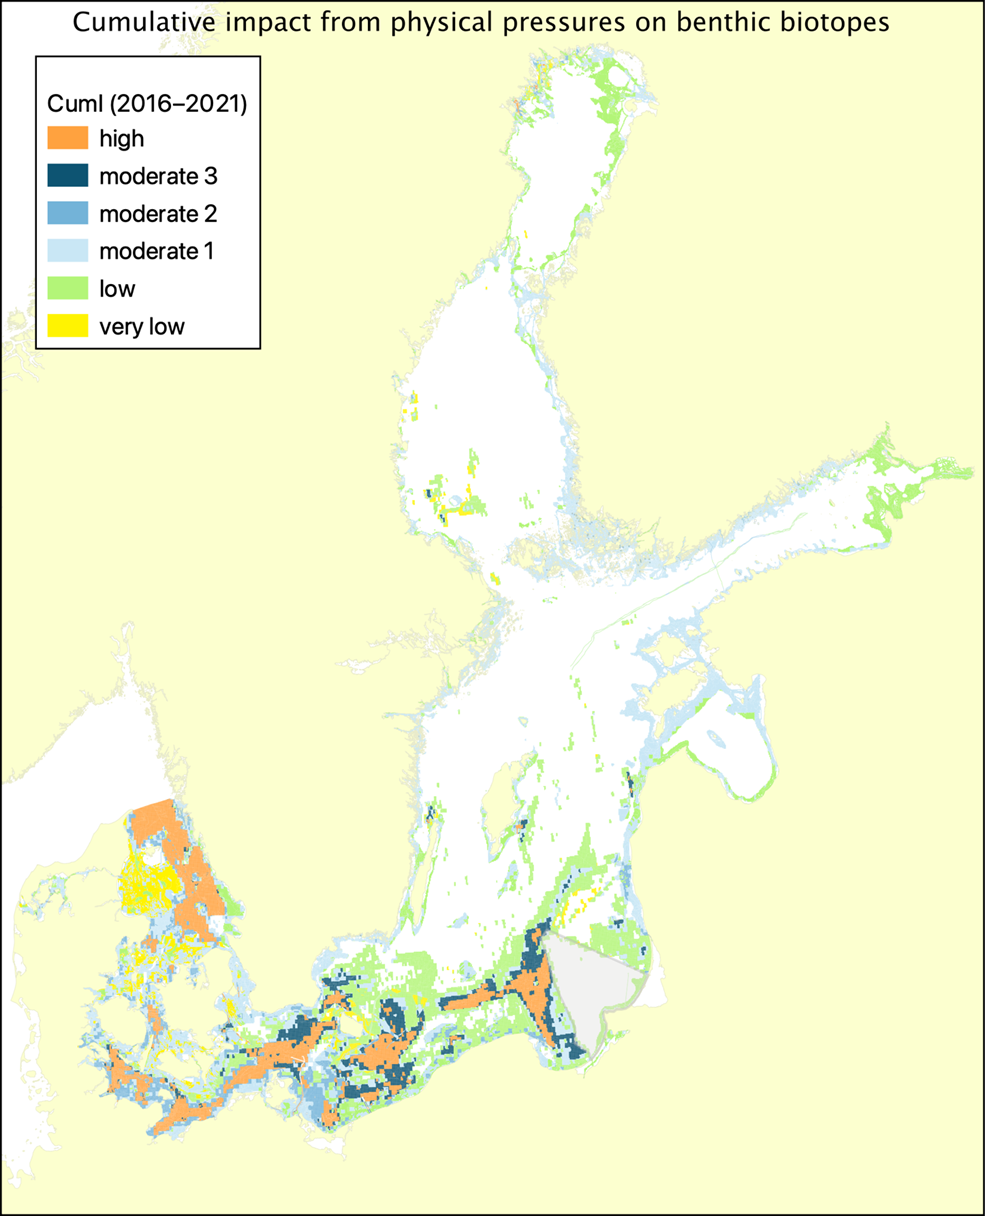
Figure 1: Impact evaluation result of the Cumulative impact from physical pressures on benthic biotopes indicator in the Baltic Sea using HELCOM data from 2016 to 2021. The map shows the combined potential impact from physical disturbance, including bottom trawling fishery and mariculture, extraction and disposal of sediments, platforms and wind farms, pipelines and cables, coastal protection and shipping. The area off the coast of Oblast Kaliningrad is a region without information on physical pressures from bottom trawling fishery, a major regional pressure; the general area without data is marked with a half-transparent grey “triangle”. White areas within the Baltic Sea area represent regions with no impact.
1.1 Citation
HELCOM (2023) Cumulative impact from physical pressures on benthic biotopes. HELCOM indicator report. Online. [Date Viewed], [Web link]. ISSN 2343-2543

Cyanobacterial bloom
1 Key message
Cyanobacterial bloom index
This indicator is a HELCOM pre-core indicator.
This HELCOM pre-core indicator is evaluated for the purposes of the ‘State of the Baltic Sea’ report (HOLAS 3) and further development towards a core indicator is expected in the future (threshold values are preliminary). An overview of indicator development is set out in the HELCOM indicator manual.
This pre-core indicator evaluates summer-time (June –August) cyanobacterial surface accumulations and cyanobacteria biomass, summarized in the cyanobacterial bloom index, during the assessment period 2016-2021.
Good status of the cyanobacterial bloom index was not achieved in any of the 13 assessed open sea sub-basins. The indicator status shows a significant deteriorating trend from the levels in 1990 to 2021 in all assessed sub-basins except for Bornholm Basin, Eastern Gotland Basin, Gulf of Finland Eastern and Gdansk Basin.
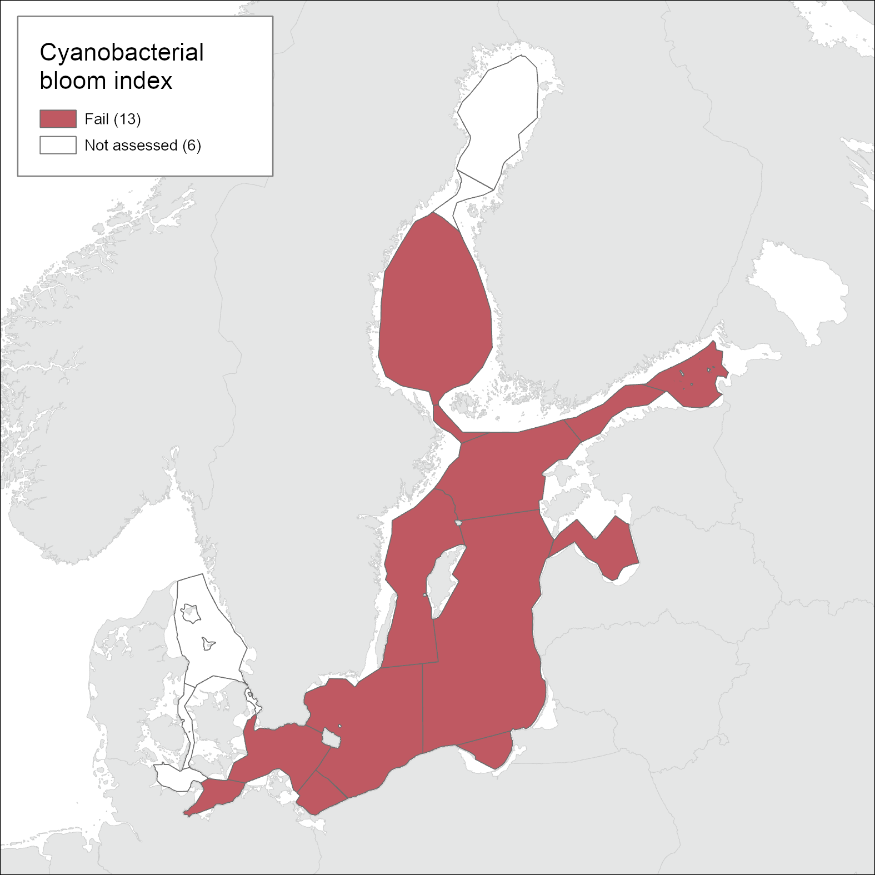
Figure 1. Status evaluation results for the indicator ‘Cyanobacterial Bloom Index’. The evaluation is carried out using Scale 4 HELCOM assessment units, applied only in the open sea units at this scale (defined in the HELCOM Monitoring and Assessment Strategy Annex 4). See Results section below for details. See ‘data chapter’ for interactive maps and data at the HELCOM Map and Data Service.
The confidence in the indicator status evaluation was high in all assessment units except for moderate in the Pomeranian Bay and the Gdansk Basin. The lower confidence in these assessment units was mainly due to low spatial confidence.
The indicator is operational in the following open sea assessment units: Bay of Mecklenburg, Arkona Basin, Bornholm Basin, Pomeranian Bay, Gdansk Basin, Eastern Gotland Basin, Western Gotland Basin, Gulf of Riga, Northern Baltic Proper, Gulf of Finland Western, Gulf of Finland Eastern, Åland Sea and Bothnian Sea. The indicator is at present not considered relevant for the assessment units; Great Belt, The Sound and Kattegat. The reason is that active growth of cyanobacteria is restricted to salinities below about 12.
1.1 Citation
The data and resulting data products (e.g. tables, figures and maps) available on the indicator web page can be used freely given that it is used appropriately and the source is cited. The indicator should be cited as follows:
HELCOM (2023). Cyanobacteria bloom index. HELCOM pre-core indicator report. Online. [Date Viewed], [Web link].
ISSN 2343-2543

Diatom/Dinoflagellate index
1 Key message
Diatom/Dinoflagellate index
This indicator is a HELCOM pre-core indicator.
This HELCOM pre-core indicator is evaluated for the purposes of the ‘State of the Baltic Sea’ report (HOLAS 3) and further development towards a core indicator is expected in the future. An overview of indicator development is set out in the HELCOM indicator manual.
The Diatom/Dinoflagellate index (Dia/Dino index) reflects the dominance patterns in the phytoplankton spring bloom. It has high relevance for the pathway of the food into the pelagic or benthic food webs. In principle, the indicator is applicable in all coastal and open sea assessment units, except lagoons, large river plumes and the Bothnian Bay; however, thresholds for the good status are defined only for the southern and central Baltic Sea up to now.
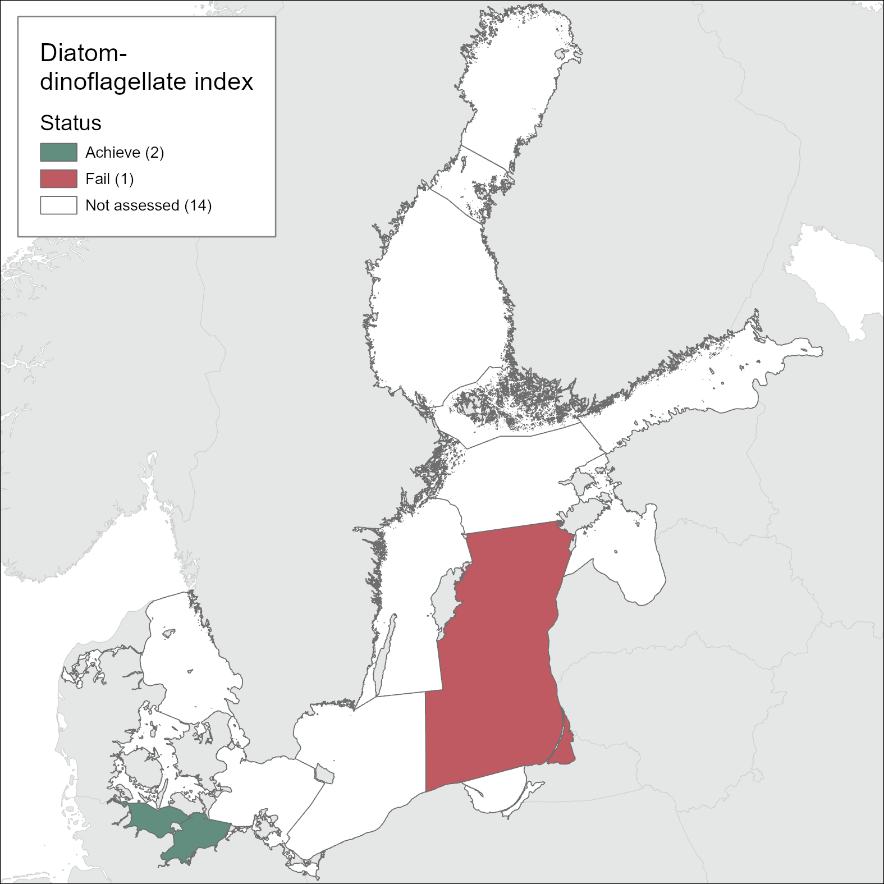
Figure 1. Preliminary status evaluation of the Kiel Bay, Bay of Mecklenburg and Eastern Gotland Basin based on the ratio of diatoms and dinoflagellate biomass for spring during the assessment period 2011-2016 (data utilised from 2016-2020). Due to national database issues Danish phytoplankton data are not included in this evaluation. This current test evaluation is carried out at HELCOM assessment scale 2 (HELCOM Monitoring and Assessment Strategy Attachment 4). See ‘data chapter’ for interactive maps and data at the HELCOM Map and Data Service.
The indicator is not yet agreed as a HELCOM core indicator but is currently being tested in the HOLAS 3 evaluation for the Kiel Bay, Bay of Mecklenburg, and the Eastern Gotland Basin assessment units. In the basins Bay of Mecklenburg and Kiel Bay, good environmental status (GES) was reached each year, achieving an overall index of 0.94 and 0.97, respectively, between 2016 and 2020 (threshold 0.75). In the eastern Gotland Basin, good status was just missed, that means the average Dia/Dino index of the years 2016 – 2020 was below the threshold value of 0.5 (Figure 1). Data from 2021 is not presently available due to the length of national preparation processes, thus only the 2016-2020 period is evaluated.
The confidence of the indicator evaluation depends on the data frequency. The data must represent the diatom and dinoflagellate blooms adequately. If the diatom bloom is not sufficiently represented in the data, an alternative Dia/Dino index may be applied, based on silicate consumption data. This indicator is robust; its calculation is simple and traceable. Phytoplankton monitoring is operational in the whole Baltic Sea using methods prescribed in the COMBINE manual. Currently, a high quality of the data is assured by the experts of the HELCOM Phytoplankton Expert Group (EG PHYTO).
1.1 Citation
The data and resulting data products (e.g. tables, figures and maps) available on the indicator web page can be used freely given that it is used appropriately and the source is cited. The indicator should be cited as follows:
HELCOM (2023). Diatom/Dinoflagellate index. HELCOM pre-core indicator report. Online. [Date Viewed], [Web link].
ISSN 2343-2543

Diclofenac
1 Key message
Diclofenac
This indicator is a HELCOM pre-core indicator.
This HELCOM pre-core indicator is evaluated for the purposes of the ‘State of the Baltic Sea’ report (HOLAS 3) and further development towards a core indicator is expected in the future (threshold values are preliminary). An overview of indicator development is set out in the HELCOM indicator manual.
This pre-core indicator evaluates the status of the marine environment based on concentrations of diclofenac in Baltic Sea water and biota. Good status is achieved when the concentrations of diclofenac are below the proposed threshold values.
Pharmaceuticals represent a major group of substances of emerging concern. They are invaluable to modern healthcare. However, due to their widespread use they are continuously emitted into the environment. Diclofenac concentrations in EU surface waters have previously been identified to exceed the predicted no-effect concentration (e.g. Loos et al. 2018). Currently the distribution, role and fate of diclofenac in the Baltic Sea is not clearly understood. While diclofenac can be assumed to be primarily emitted into the environment via wastewaters, information on its occurrence in the environment is mainly scattered, with little established on-going monitoring.
The status evaluation presented here is based on the available data, and liable to change as longer time series are produced, and more datapoints become available. Moreover, as long-term time series are not available, the evaluation is solely based on comparing the detected concentration levels to the proposed quality standards. Defining trends will only be possible after monitoring has been carried out to encompass the required spatial distribution and temporal periods.
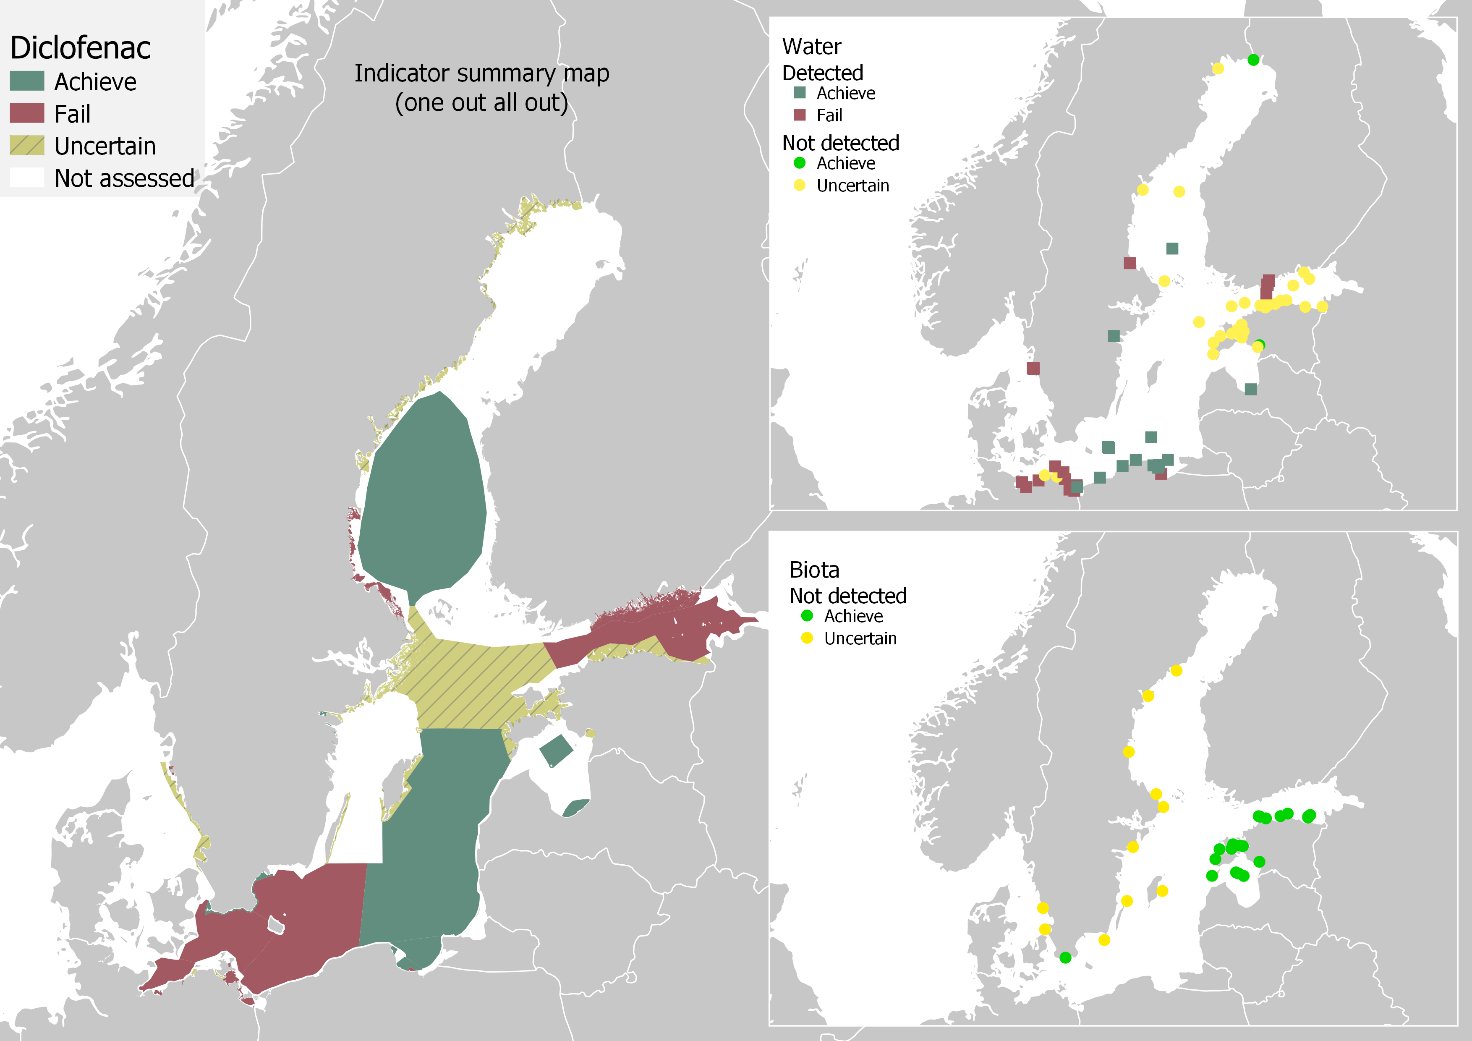
Figure 1. Status evaluation results based on the pre-core indicator for diclofenac. The evaluation is carried out using Scale 4 HELCOM assessment units. One-Out-All-Out (OOAO) method was utilized, where even one datapoint exceeding the proposed status threshold values results in failure to achieve good status. Overviews of sample locations and results in Baltic Sea water and biota are presented in upper and lower inset maps, respectively. Yellow circles in the inset maps indicate samples where the analytical limit* was higher than the proposed threshold values.
*The term “analytical limit” is used in this report as no differentiation between LOD and LOQ could be assigned to the reported values in all cases.
According to the available data, failure to achieve the threshold value and thus good environmental status occurs in the coastal waters of Finland, Germany, Poland, and Sweden and in open sea areas at the Bay of Mecklenburg (SEA-005), Arkona basin (SEA-006), Bornholm basin (SEA-007), and Gulf of Finland (SEA-013). On the other hand, good environmental status is achieved in certain coastal areas of Estonia, Latvia, Poland, and Sweden. Additionally, the good status is achieved in open sea areas in the Gdansk basin (SEA-008), Eastern Gotland basin (SEA-009), and Bothnian Sea (SEA-015).
Diclofenac is a synthetic substance, that is used solely for medication. According to Ek Henning et al. (2020), its annual total usage in Baltic Sea coastal countries ranged from 1,500 kg/a in Estonia to 29,000 kg/a in Germany. According to a questionnaire carried out by HELCOM and the Interreg Baltic Sea Region project CWPharma, diclofenac is used in veterinary medication only in Estonia, with the usage being 0.4 kg/a. While the information reported by Ek Henning, and the responses received through the HELCOM questionnaire might be incomplete, it seems safe to assume that diclofenac discharges primarily originate from its excretion as a result of usage in human medication, and that the substance reaches the environment mainly through treated municipal wastewaters.
While data is increasingly available on diclofenac occurrence in the environment, the majority of currently available data focuses on concentrations in wastewaters. Data from surface waters focuses mainly on inland waters, but some information on coastal and marine waters is available. Further data on concentrations in the marine environment, especially in biota, is required to make a more robust status evaluation, and to allow for a more comprehensive trend evaluation.
The indicator is applicable in the saline waters of all countries bordering the Baltic Sea and is relevant for water and biota. The indicator is established, and further monitoring data is currently being gathered. The data coverage has increased in the recent years, but is still scattered, and long-term time series are missing. Thus, the results and confidence in the indicator evaluation are considered as intermediate.
1.1 Citation
The data and resulting data products (e.g. tables, figures and maps) available on the indicator web page can be used freely given that it is used appropriately and the source is cited. The indicator should be cited as follows:
HELCOM (2023). Diclofenac. HELCOM Pre-Core indicator report. Online. [Date Viewed], [Web link].
ISSN 2343-2543.

Dissolved inorganic nitrogen
1 Key message
Dissolved inorganic nitrogen (DIN)
The core indicator evaluates average dissolved inorganic nitrogen (DIN) concentration in surface waters (0 – 10 m) during winter (December – February) for the assessment period 2016-2021.
Of the 19 open-sea assessment units only Kiel Bay achieved good status with DIN concentration below defined threshold values, which reflects good conditions. (Figure 1). The winter-time DIN was still at elevated levels in 18 sub-basins. Improving trends since the 1990s, meaning decreasing DIN concentrations, were recorded in 11 out of 19 open-sea assessment units, mainly in the Western and Northern Baltic Sea areas. None of the assessment units showed a deteriorating trend, i.e. increasing DIN concentrations. In the remaining eight assessment units no significant trends were observed and DIN concentrations have generally remained at the level of the 1990s with considerable multi-year variability in the Gdansk Basin, Pomeranian Bay, Gulf of Riga and Gulf of Finland Western.
When comparing the latest two assessments of HOLAS II and HOLAS 3 one basin, Kiel Bay, changed its status from moderate to good. Four Western Baltic Sea basins showed an improvement in the DIN status, while three basins (Gdansk Basin, Eastern and Western Gotland Basin) showed a deterioration and in the rest of the assessment units the status was more or less stable.
Concerning the coastal waters DIN was assessed only in Polish and selected Swedish water bodies. Some of these water bodies achieved good status while others failed. There were a number of cases where a good status of coastal water bodies was assessed adjacent to open sea basins that had a moderate or worse status. This could be due to a lack of alignment of threshold values between coastal waters and open sea basins (Annex – table 1).
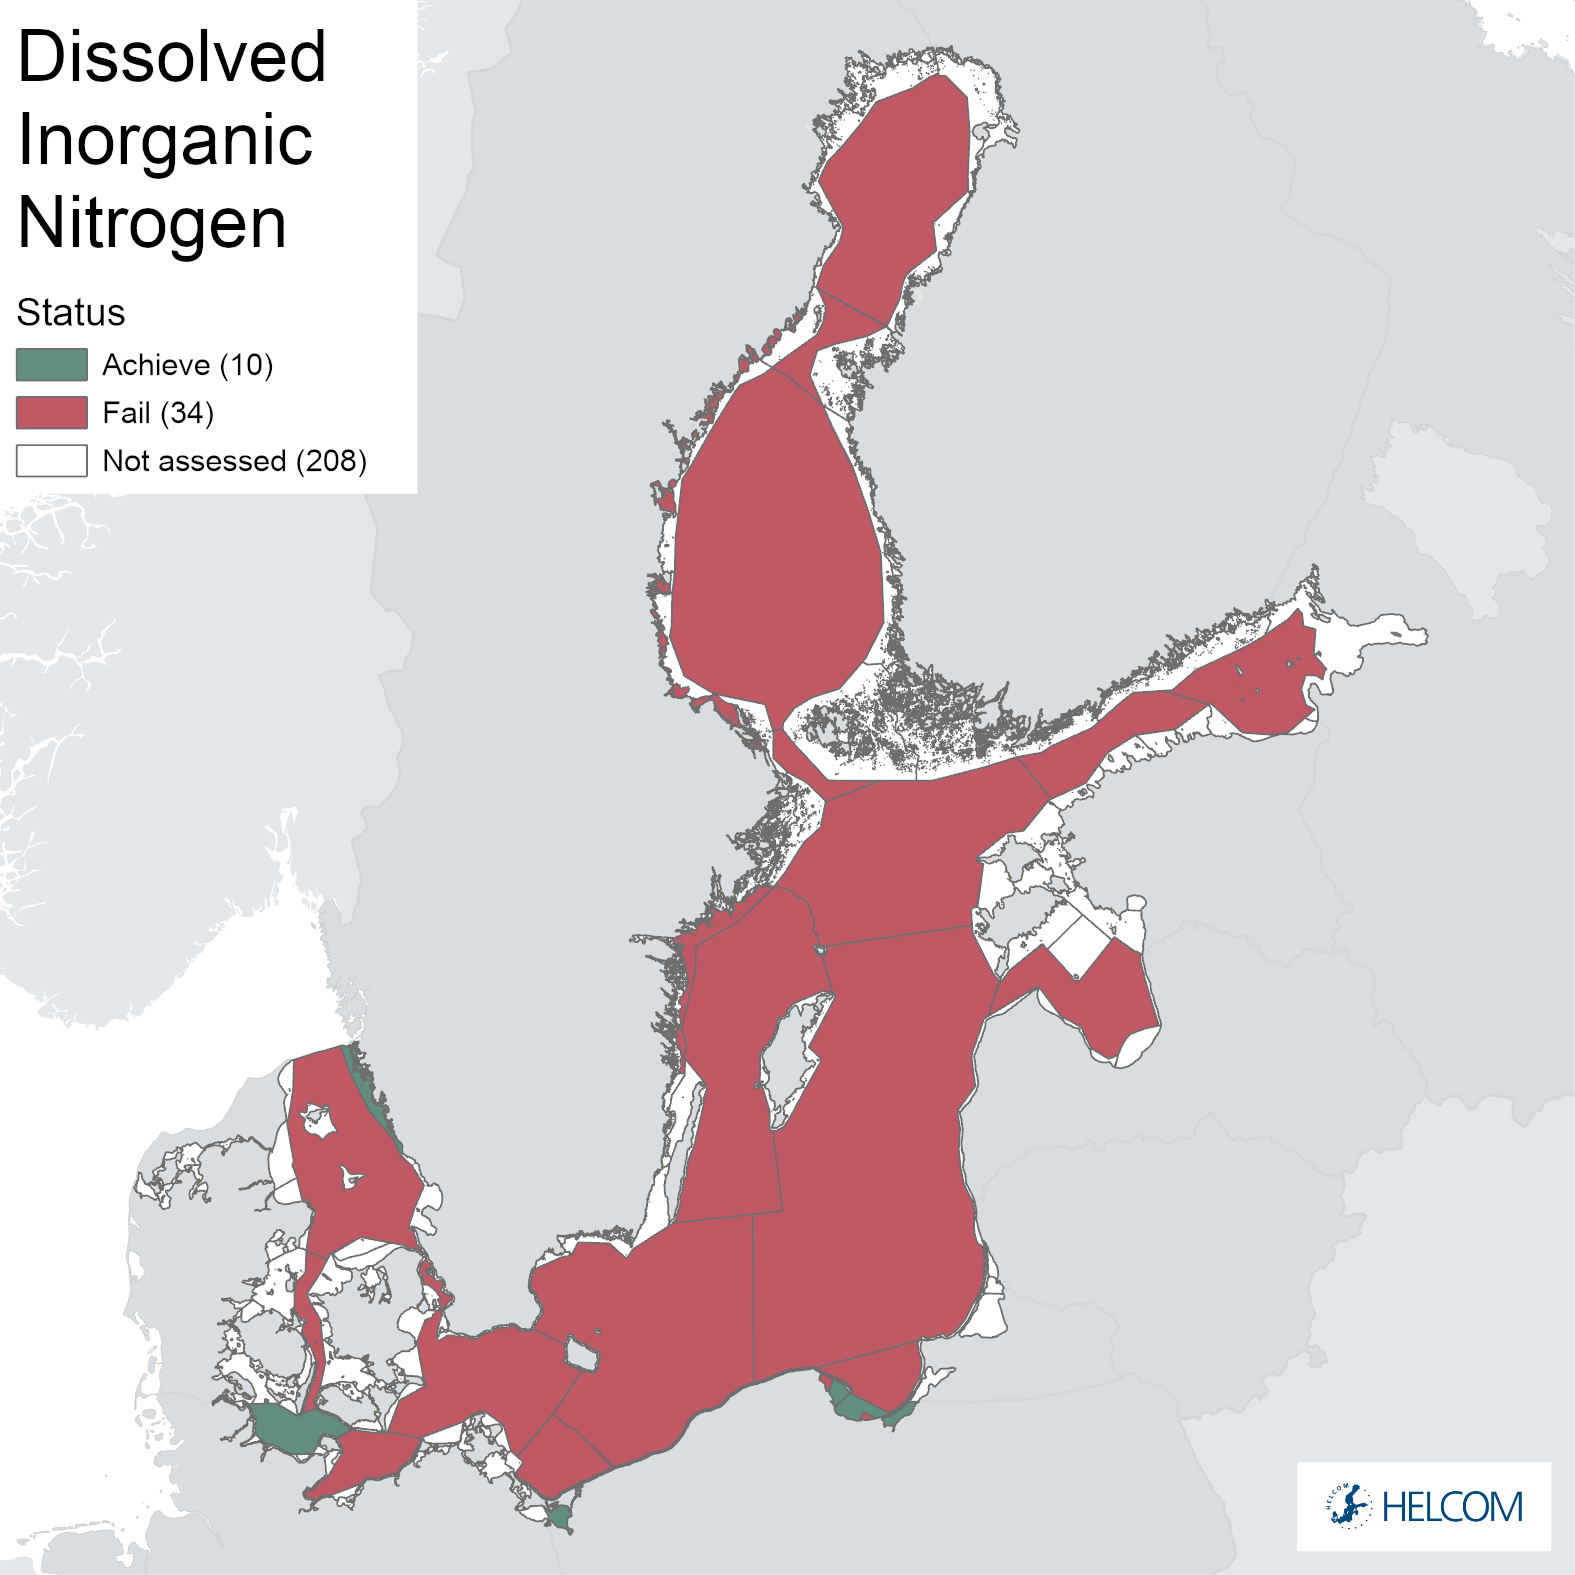
Figure 1. Status evaluation of the indicator ‘DIN’. The evaluation is carried out using Scale 4 HELCOM assessment units (defined in the HELCOM Monitoring and Assessment Strategy Annex 4). See Results section below for details. See ‘data chapter’ for interactive maps and data at the HELCOM Map and Data Service.
The confidence in the indicator DIN status evaluation was high in 8 basins, moderate in 8 basins and low in 3 basins (see Figure 7). Low confidence was caused by insufficient spatial sampling, sometimes also by insufficient temporal sampling.
The indicator is applicable in all open sea assessment units. In coastal waters, total nitrogen may have been assessed instead of DIN (see Total Nitrogen indicator report) in line with the national assessments under the Water Framework Directive.
1.1 Citation
The data and resulting data products (e.g. tables, figures and maps) available on the indicator web page can be used freely given that it is used appropriately and the source is cited. The indicator should be cited as follows:
HELCOM (2023). Dissolved inorganic nitrogen (DIN). HELCOM core indicator report. Online. [Date Viewed], [Web link].
ISSN 2343-2543.
Dissolved inorganic phosphorus
1 Key message
Dissolved inorganic phosphorus (DIP)
This core indicator evaluates the average dissolved inorganic phosphorus (DIP) concentration in surface waters (0 – 10 m) during winter (December – February) for the assessment period 2016-2021.
Of the 19 open-sea sub-basins, good status (DIP concentration below defined threshold value, which reflects good conditions) was not achieved in any of the sub basins (Figure 1). The winter-time DIP was still at elevated levels in all 19 sub-basins. Kattegat, Great Belt, Kiel Bay and Bothnian Bay achieved moderate status and Kattegat and Great Belt showed only a very minor exceedance of the threshold values. Bay of Mecklenburg, Arkona Basin, Pomeranian Bay and the Gulf of Finland Eastern were in poor status and all other basins were in bad status, with the Gulf of Riga, Northern Baltic Proper and The Quark exceeding the DIP thresholds more than twofold.
None of the basins showed an improving trend, i.e. decreasing winter DIP concentrations, since the 1990s despite a reduction in phosphorus inputs. On the contrary, eight assessment units, Bornholm Basin, Gulf of Riga, Northern Baltic Proper, Gulf of Finland Eastern and Western, Åland Sea, Bothnian Sea and The Quark showed a significantly deteriorating trend with increasing DIP concentrations and it is possible that this could be attributed to phosphorus leaking from the sediments and phosphate transport by currents between basins.
When comparing the latest two assessments of HOLAS II and HOLAS 3 The Sound was the only assessment unit that showed an improvement in the DIP status, while eight basins showed no change and 10 basins showed a deterioration in the DIP status. Of these, a change from good to not good status was observed in the open Bothnian Bay. The basins with the deteriorating status were mainly situated in the central and Northern Baltic Sea, including the Gulf of Riga and Gulf of Finland.
Concerning the coastal waters DIP was assessed only in 19 Polish and 13 Swedish water bodies. In the Swedish coastal waters only two water bodies achieved good status, while in Polish coastal waters 14 water bodies achieved good status. There were a number of cases where a good status of coastal water bodies was assessed adjacent to open sea basins that had a moderate or worse status. This could be due to a lack of alignment of threshold values between coastal waters and open sea basins (Table 1 and Annex – Table 1) and internal load of phosphorus in the open sea areas
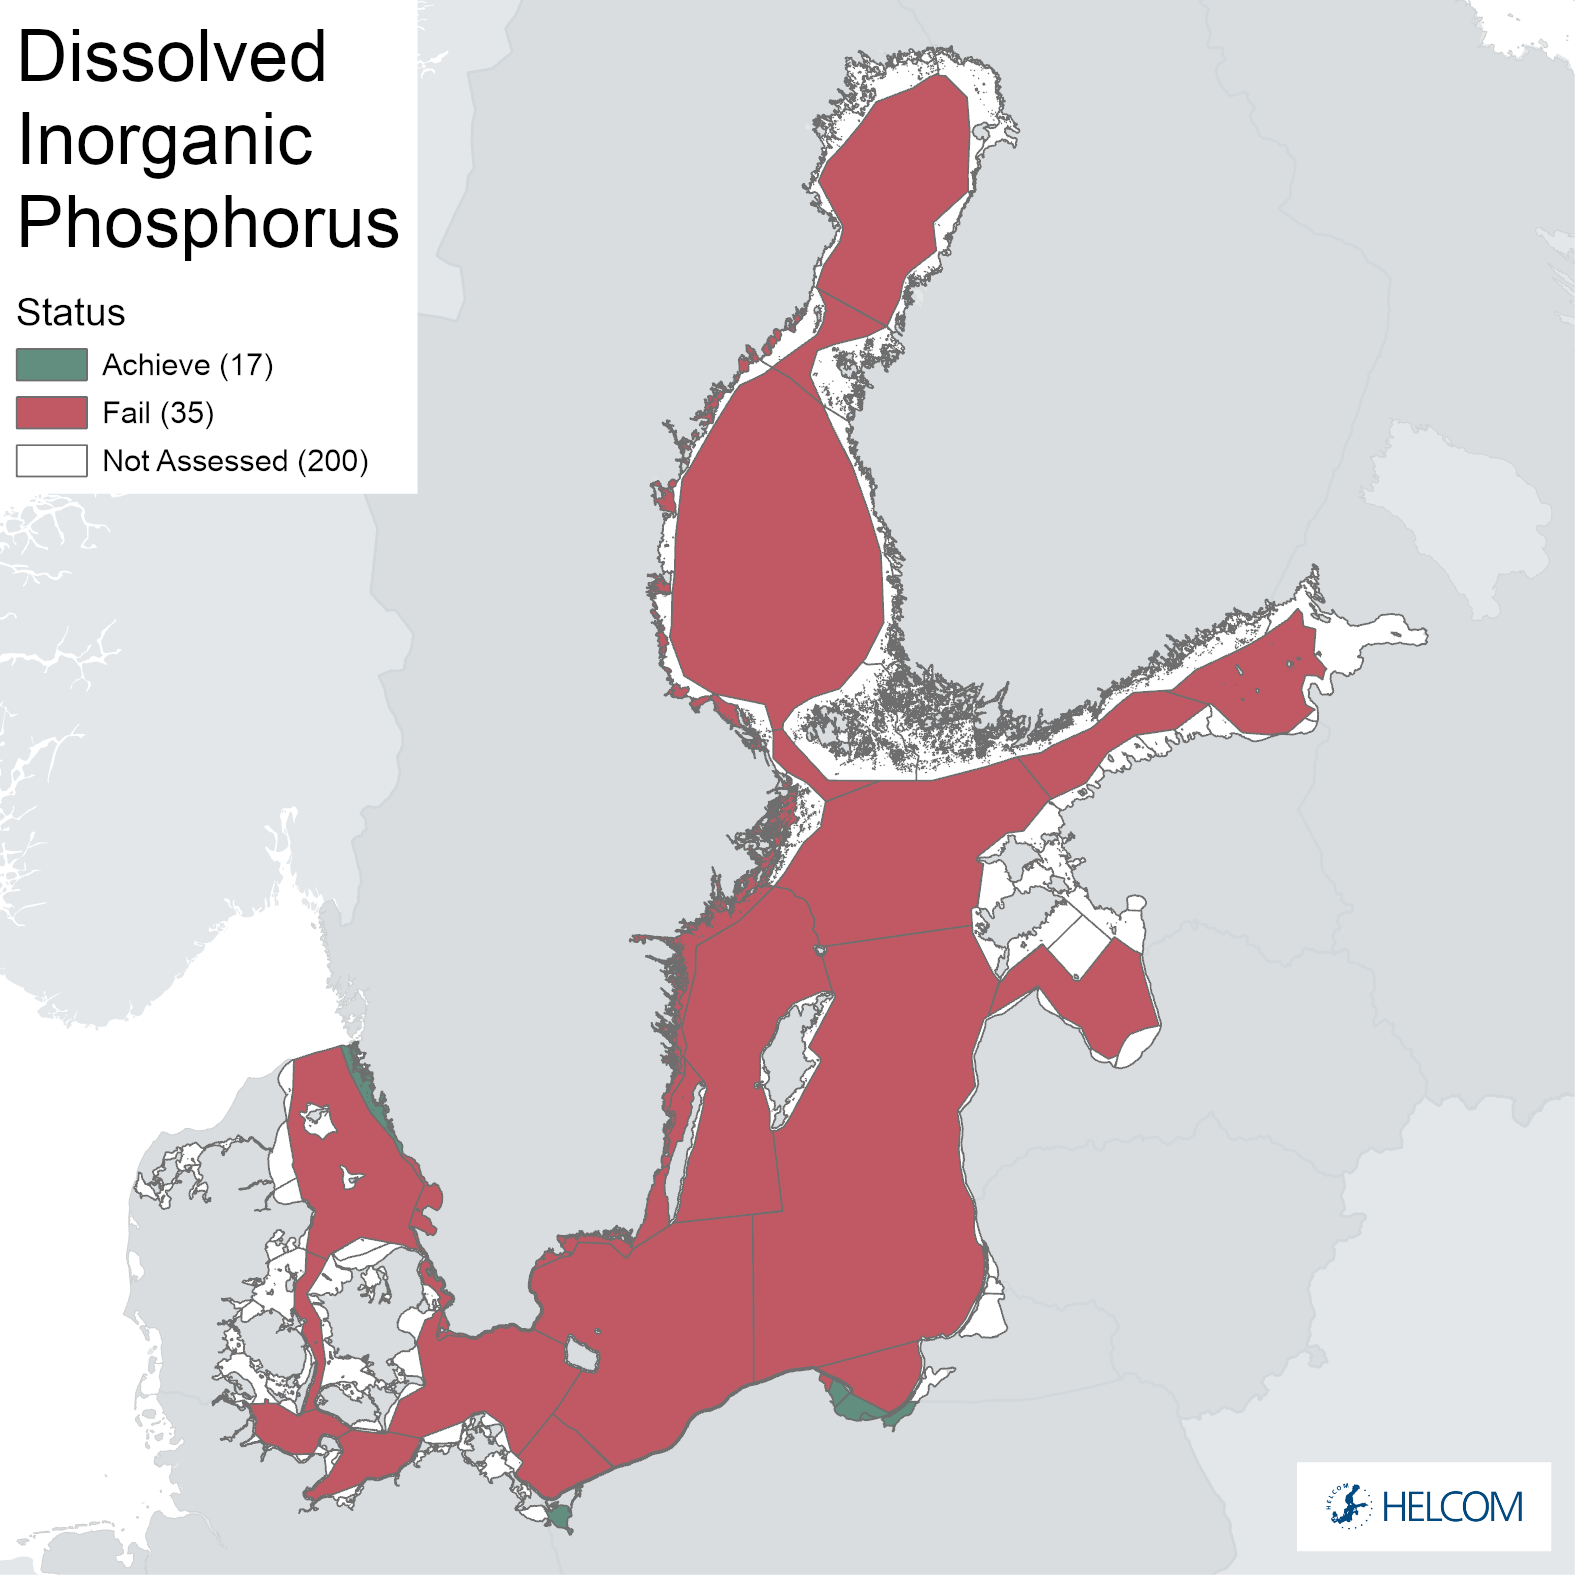
Figure 1. Status evaluation of the indicator ‘DIP’. The evaluation is carried out using Scale 4 HELCOM assessment units (defined in the HELCOM Monitoring and Assessment Strategy Annex 4). See Results section below for details. See ‘data chapter’ for interactive maps and data at the HELCOM Map and Data Service.
The confidence of the presented DIP status estimate was high in eight basins, moderate in seven basins and low in four basins (see Figure 4). Low confidence was mainly caused by insufficient spatial sampling, sometimes also by insufficient temporal sampling.
The indicator is applicable in the waters of all countries bordering the Baltic Sea. In coastal waters, many Contracting Parties assessed total phosphorus instead of DIP (see Total Phoshporus indicator report) in line with the national assessments under the Water Framework Directive.
1.1 Citation
The data and resulting data products (e.g. tables, figures and maps) available on the indicator web page can be used freely given that it is used appropriately and the source is cited. The indicator should be cited as follows:
HELCOM (2023). Dissolved inorganic phosphorus (DIP). HELCOM core indicator report. Online. [Date Viewed], [Web link].
ISSN 2343-2543.
Fishery Operations
Drivers and driver indicators for Fishery Operations
Drivers and Driver Indicators
In the HOLAS 3 work, a limited number of drivers and driver indicators were explored, focusing on early testing and development of the driver – driver indicator methodology and concept. The selected topics and reports are not all encompassing and are proof-of-concept examples.
Please note that driver indicators are clearly differentiated from other HELCOM indicators as they do not address status or pressure directly and can thus not be used other than as supporting information on relevant broader processes.
DAPSIM (Driver-Activity-Pressure-State-Impact-Measure) is a conceptual management framework utilized in HELCOM for visualizing the relationships between society and the environment (HELCOM, 2020). Each component in this framework has connections to one or more other components that allow for the effect of any given component on the other components to be either qualitatively or quantitatively addressed throughout the framework. In this framework the D stands for drivers. For HOLAS 3 purposes, drivers were considered to be ‘’societal and environmental factors that, via their effect on human behaviour or environmental conditions, may influence activities, pressures, or the state of the marine environment’’. It was also requested that for HOLAS 3 drivers of societal relevance were the focus of the pilot development work.
To make the information on drivers useful in an assessment context, they should be connected with other DAPSIM framework components through explanatory proxies. Thus, driver indicators are explanatory proxies that can be quantified or succinctly described and are linked to changes in drivers. Therefore, quantification of drivers and understanding the trends are desirable to ensure a concrete link. Analyses of these driver indicators can be used as a tool to understand societal trends, inform policy makers of environmental risks and to comprehend the interconnectedness of society and the environment, and identify efficient measures.

Grey seal abundance
1 Key message
Population trends and abundance of seals – Grey seals
This core indicator evaluates the status of the marine environment based on population trends and abundance of the grey seal in the Baltic Sea (other seal species are addressed in separate reports). Good status is achieved for each species when i) the abundance of seals in each management unit has attained a Limit Reference Level (LRL) of at least 10,000 individuals to ensure long-term viability and ii) the population trend, evaluated by species-specific growth rate, for a population either under or at Target Reference Level (TRL) is achieved indicating that growth-rates are not affected by severe anthropogenic pressures.
As a highly mobile species the grey seal population of the Baltic Sea is evaluated as a single management unit covering the whole HELCOM area. The evaluations for Population trends are based on data from 2003-2021. For reliable trend calculations this longer time-series is needed, however the most recent data from the assessment period 2016-2021 is used to assess Population abundance.
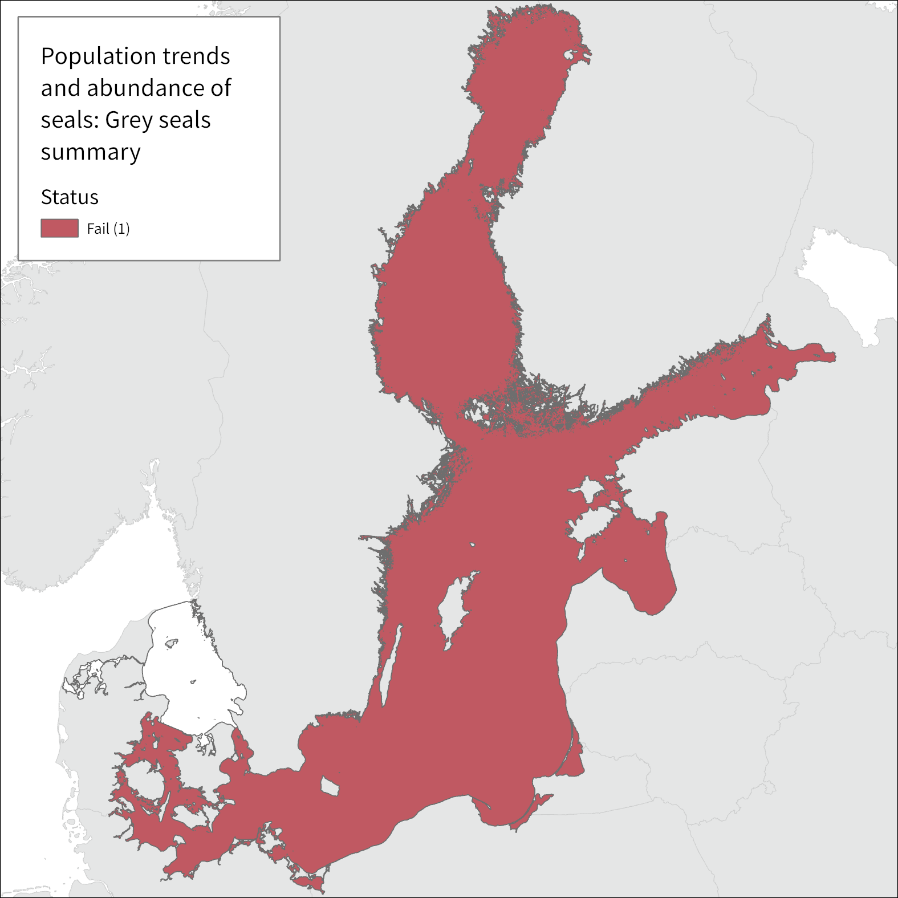
Figure 1. The overall status evaluation results based on evaluation of the indicator ‘population trends and abundance of seals’ –Grey seals. The evaluation is carried out using Scale 1 HELCOM assessment units (defined in the HELCOM Monitoring and Assessment Strategy Annex 4), using the one-out-all-out approach. Thus, if a seal management unit, in not good status, has a given HELCOM assessment unit as part of its range, the assessment unit is marked red. See ‘data chapter’ for interactive maps and data at the HELCOM Map and Data Service.
The abundance of grey seals (i.e. around 60,000 animals) is above the threshold of Limit Reference Level (LRL) of 10,000. The population is still growing, and was, as such, evaluated as being below Target reference Level (TRL) and evaluated against the threshold of 7% annual increase during exponential growth. The annual estimated growth rate during the period 2003-2021 was 5.1% and a Bayesian analysis showed 80% support for growth rate of ≥4.7%, which is under the threshold of 7% (Result Figure 2). Grey seals reach good status with regard to abundance, but they do not achieve good status with regard to population trend when evaluated as under TRL. With one-out-all-out –approach, the grey seals fail to achieve good environmental status (GES).
Confidence of the indicator evaluation is considered to be moderate. This is due to the difficulty in interpreting if the population is under or at TRL.
1.1 Citation
The data and resulting data products (e.g. tables, figures and maps) available on the indicator web page can be used freely given that it is used appropriately and the source is cited. The indicator should be cited as follows:
HELCOM (2023) Population trends and abundance of seals. HELCOM core indicator report. Online. [Date Viewed], [Web link]. ISSN 2343-2543
ISSN 2343-2543