 Beach litter
2 Relevance of the indicator
Marine litter is not only an aesthetic problem; it incurs socioeconomic costs, threatens human health and safety, and impacts on marine organisms. It is broadly documented that entanglement in, or ingestion of, marine litter can have negative consequences on the physical condition of marine animals and even lead to death. Ingestion of artificial, polymer materials is also of concern as it may provide a pathway for the transport of harmful chemicals into the food web. Additionally, marine litter is known to damage, alter or degrade habitats (e.g., by smothering). Floating plastic litter can also be a possible vector for the transfer of alien species but the risk of this happening in the Baltic Sea is considered small.
Litter on the coastline is one of the most obvious signs of marine litter. Surveys of litter on the beach allow for a detailed evaluation of litter in terms of amounts and composition. Its strength lies on the provision of information on potential harm to marine biota and ecosystems as well as social harm (aesthetic value, economic costs, hazard to human health) and, to some extent, on sources of litter and the potential effectiveness of measures applied. The indicator considers a wide range of types of marine litter, so new findings and possibly new sources of pollution can be quickly detected.
2.1 Ecological relevance
Marine litter continues to have an impact on a wide range of marine fauna, with many new records of affected species reported every year, particularly attributed to the ingestion of, and entanglement by, various forms of plastic(UNEP, 2021). The total number of marine species to be affected is also likely to be substantially underestimated. Negative effects on individuals are more obvious in cases of entanglement, where external injuries or death can often be observed. Determining the effect of litter ingestion on an individual can be more difficult, and the consequences of ingestion are still not fully understood. Sublethal effects of entanglement and ingestion that alter the biological and ecological performance of individuals have been documented. Marine and coastal species that show a high incidence of litter ingestion or entanglement may be susceptible to population-level effects. This could have negative consequences for species with small populations, particularly those that are considered endangered and/or exposed to multiple stressors. Identifying the impacts of marine litter at the ecosystem level is a critical area for attention and should include the evaluation of the loss of ecosystem services that can be attributed to this stressor. Marine litter can also affect terrestrial species (e.g., for those species spending part of their lifetime on beaches).
2.2 Policy relevance
At this moment in time, there is no doubt that marine litter is on top of the global agenda. The historic agreement at the resumed Fifth Session of the United Nations Environment Assembly (UNEA 5-2) in March 2022 to develop an international legally binding agreement to end plastic pollution by 2024 is the best exponent of such global commitment. HELCOM is committed to support the development of the global instrument, as stated in a voluntary commitment on the matter at the UN Ocean Conference held in Lisbon in June 2022.
Table 1. Policy relevance of HELCOM indicator beach litter.
In alignment with such commitment, the updated Baltic Sea Action Plan contains, for the first time, a dedicated section on marine litter including both ecological and managerial objectives to achieve. The fulfilment of these objectives will count with the revised Regional Action Plan on Marine Litter, adopted in the 2021 Ministerial Meeting as HELCOM Recommendation 42-43/3, as its instrumental tool containing almost thirty regional actions addressing sea-based and land-based sources of marine litter (HELCOM, 2021a). Moreover, in its preamble, the Action Plan states HELCOM ambitions towards development of additional core indicators and associated definition of GES and improved coordinated monitoring programmes. Such work is to be conducted considering outcomes of the related work under the EU MSFD and involving close coordination with the EU TG Litter, as well as with similar work of the Russian Federation. In that sense, beach litter is adopted as an indicator to enable EU wide monitoring of litter in the marine environment according to the MSFD requirements in Article 8, 2008/56/EC (Assessment guidance: European Commission, 2022). It is also part of the OSPAR monitoring program since 2010 (OSPAR, 2010). UNEP/IOC (2009) agrees as well on the adequacy of this indicator. Policy relevance of HELCOM indicator Beach litter is summarised in Table 1.
2.3 Relevance for other assessments
The core indicator beach litter assesses the 2021 Baltic Sea Action Plan’s (BSAP) (HELCOM 2021) Hazardous substances and litter’s segment ecological objective of no harm to marine life from litter. It also assesses the management objectives to prevent generation of waste and its input to the sea, including microplastics, and significantly reduce amounts of litter on shorelines and in the sea. The core indicator is relevant to the following specific BSAP actions:
- HL31: Improve the evidence base on the impact of marine litter on the Baltic Sea region in order to develop and agree on new measures by 2025.
- HL32 Agree on core indicators and harmonized monitoring methods to evaluate quantities, composition, distribution, and sources (including riverine input), of marine litter, including microlitter, by 2022, where applicable and for the rest no later than 2026. Work should be done in close coordination with work undertaken by Contracting Parties in other relevant fora, such as the Technical Group on marine litter under the Marine Strategy Framework Directive.
The indicator further supports the implementation of the HELCOM Recommendation 42-43/3 on the Regional Action Plan on Marine Litter, in particular action RL2 on the evaluation of top findings according to the knowledge available and recommendation of environmentally sound alternatives to phase out top plastic and rubber litter items.
The results of the indicator support an overall evaluation of pollution in the Baltic Sea.
Potential relevance for indicators for different types of hazardous substances, like flame retardants, used as plastic additives.
In addition, the core indicator addresses descriptor 10 “Properties and quantities of marine litter do not cause harm to the coastal and marine environment” of the EU MSFD for determining good environmental status (European Commission 2008), and in particular criteria 1 and 2 of the Commission Decision on GES criteria (2017), “The composition, amount and spatial distribution of litter on the coastline, in the surface layer of the water column, and on the seabed, are at levels that do not cause harm to the coastal and marine environment”, and “The composition, amount, and spatial distribution of micro-litter on the coastline, in the surface layer of the water column, and in seabed sediment, are at levels that do not cause harm to the coastal and marine environment”, respectively. The complementary link to criteria 2 is due to the fragmentation of macrolitter to microlitter.
3 Threshold values
The threshold value for beach litter is developed through cooperation at EU level so that it is possible to assess the extent to which good environmental status has been achieved or maintained that relates to the features of macro-litter in the marine environment (D10C1).
For litter on the coastline, the EU threshold value is 20 litter items per 100 m beach length (table 2) as a median value as described in the MSFD Article 8 Assessment guidance (European Commission, 2022).
HELCOM has also adopted 20 litter items per 100 m coastline (median without fragments < 2.5 cm and chemicals like paraffin, wax, oil and other pollutants) as threshold value for the whole Baltic Sea (HOD, 2021).
It has been agreed to use the assessment scale 2 for all beach types (Outcome of State and Conservation 13-2020, para. 4J.31), and that the threshold value is applied for all seventeen sub-basins (SEA-001 – SEA-017).
Table 2. Threshold value for beach litter.
| HELCOM Assessment unit name (and ID) | Threshold value (litter items per 100 m coastline) |
| HELCOM threshold value for beach litter, valid for all sub-basins (SEA-001 to SEA-017) | 20 |
In addition, HELCOM has included reduction targets on beach litter in the HELCOM area. It is part of the commitment of the 2013 HELCOM Ministerial Declaration, reiterated in the 2018 Ministerial Declaration, to achieve a significant quantitative reduction of marine litter by 2025, compared to 2015, and to prevent harm to the coastal and marine environment (HELCOM, 2013; HELCOM, 2018). Moreover, in the 2021 Baltic Sea Action Plan adopted during the 2021 Ministerial Meeting, HELCOM committed to reduce marine litter on the beaches by at least 30 percent by 2025 and by 50 percent by 2030, from the baseline total abundance of 40 litter items per one hundred meters of beach for the Baltic Sea (except for Kattegat) (2015-2016) (HELCOM, 2021b). This will start with the reduction of the most commonly found single-use plastic items and items related to fishing gear.
3.1 Setting the threshold value
The threshold value 20 litter items per 100 m beach length corresponds to the 15th percentile of the EU baseline dataset of the total amount of litter on European coastlines in 2015–2016 (van Loon et al., 2020; Hanke et al., 2019). The threshold value applies to the total amount of macro-litter on the coastline (macro-litter (all)). Threshold values cannot be defined per litter category as required by the GES Decision, where the number of items found per category is limited (e.g., metals, glass, rubber). Calculation of the 10th percentile of the EU baseline dataset resulted in a value of 13 litter items per 100 m of coastline length. Further consideration of the 95% confidence intervals of the threshold value and assessment value, respectively, led to a final threshold value of 20 litter items per 100 m beach length, which corresponds to the 15th percentile value of the EU baseline dataset. This threshold value is estimated by experts from EU TG ML to reduce harm from beach litter to a sufficiently precautionary level. The same view was shared by HELCOM EG Litter experts. The methodology acknowledges uncertainties in the underlying data which is considered in the proposal. The median assessment value is compared with this threshold value for compliance checking.
4 Results and discussion
4.1 Status evaluation
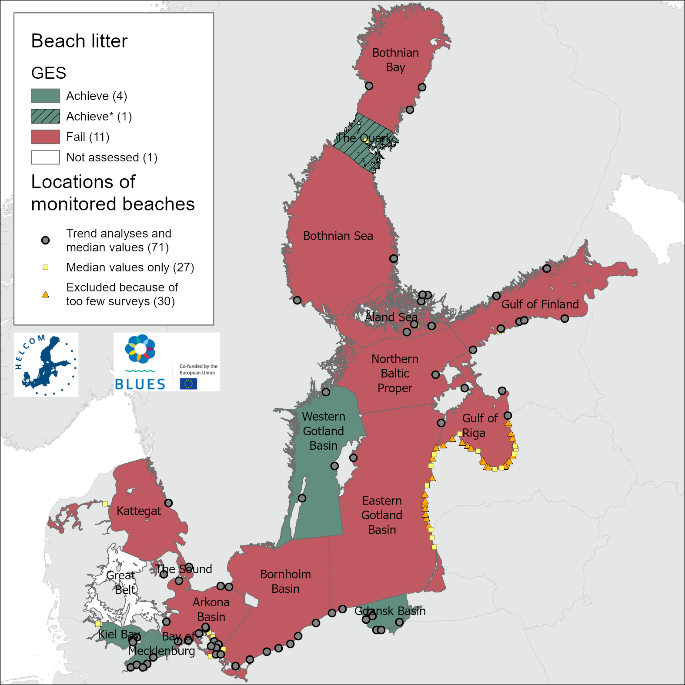
The status evaluation of marine beach litter in the Baltic Sea for 2016-2021 shows that 11 out of 16 sub-basins (HELCOM Scale 2) are above the HELCOM threshold value of 20 litter per 100 m beach. One sub-basin lacks beaches for litter monitoring and therefore cannot be assessed. The sub-basins with high median values, that stand out from the other results, are The Sound (313 litter items per 100 m), Gulf of Riga (156 litter items per 100 m), and Eastern Gotland Basin (96 litter items per 100 m). The number of litter items present in these sub-basins are all higher than the Baltic wide baseline level of 40 litter items per 100 m from 2015-2016 (Hanke et al. 2019). Such baselines have, however, not been derived for each sub-basin in the Baltic Sea.
Eight sub-basins are above but close to the threshold value, ranging between 23-33 litter items per 100 m beach.
The sub-basins below the threshold value are Kiel Bay, Bay of Mecklenburg, Gdansk Basin and the Western Gotland Basin. The Quark also has a median value below the threshold value but includes only limited data for one beach and less than 40 surveys, and consequently the results are less robust. Results are shown in the map (figure 2) and in table 3.

Figure 2. Beach litter evaluation of sub-basins of median values below (green) or above (red) the threshold value of 20 litter items per 100 m. “Achieve *” refers to The Quark which has a median value below the threshold value but includes only limited data for one beach and less than 40 surveys, and consequently the results are less robust. The evaluation has been carried out using Scale 2 HELCOM assessment unites (defined in the HELCOM Monitoring and Assessment strategy, 2013, Attachment 4). Different signatures for national monitoring beaches are shown depending on if they have sufficient data for determining robust median values, or also trend analyses or if they are excluded due to few surveys. See ‘data chapter’ for interactive maps and data at the HELCOM Map and Data Service.
Except for median values of total count (TC) for the different sub-basins, calculations have been done for single-use plastics (SUP), and fisheries related litter (FRL) (table 3). Litter items were categorised for SUP and FRL according to “A Joint List of Litter Categories for Marine Macrolitter Monitoring” (Fleet et al., 2021). The median of SUP litter items varies between 0-26 litter items, accounting for 0-28% of the total litter. However, the number of SUP litter is underestimated as described in chapter 7 Methodology. The proportion of plastic litter (including SUP items) in relation to the total number of litter ranges between 32 and 93%. The highest value was recorded for the Quark, which includes only one beach (in Finland). Median values for FRL litter categories are also generally low, ranging between 0 and 20 litter items per 100 m beach.
Table 3. Median values (2016-2021) for Total Count (TC), SUP, FRL and Plastic litter categories for each sub-basin, N=number of surveys.
| Sub-basin | N | TC | SUP | FRL | Plastic |
| SEA-001 Kattegat | 54 | 33 | 4 | 1 | 26 |
| SEA-003 The Sound | 18 | 313 | 26 | 20 | 250 |
| SEA-004 Kiel Bay | 83 | 19 | 3 | 1 | 12 |
| SEA-005 Bay of Mecklenburg | 132 | 15 | 4 | 0 | 9 |
| SEA-006 Arkona Basin | 330 | 30 | 3 | 1 | 23 |
| SEA-007 Bornholm Basin | 202 | 23 | 5 | 0 | 14 |
| SEA-008 Gdansk Basin | 143 | 13 | 2 | 1 | 8 |
| SEA-009 E Gotland Basin | 88 | 96 | 2 | 7 | 65 |
| SEA-010 W Gotland Basin | 54 | 11 | 2 | 0 | 8 |
| SEA-011 Gulf of Riga | 68 | 156 | 8 | 3 | 50 |
| SEA-012 N Baltic Proper | 31 | 27 | 2 | 0 | 16 |
| SEA-013 Gulf of Finland | 133 | 28 | 3 | 0 | 18 |
| SEA-014 Åland Sea | 107 | 23 | 2 | 1 | 15 |
| SEA-015 Bothnian Sea | 46 | 24 | 1 | 2 | 15 |
| SEA-016 The Quark | 5 | 5 | 0 | 0 | 5 |
| SEA-017 Bothnian Bay | 52 | 29 | 2 | 0 | 10 |
Results for other materials (Rubber, Metal, Glass, Paper, Textile, Wood, Sanitary and medical items, and Various materials) are found in Appendix 1, table 1.1. Overall, the median values for each individual material per sub-basin are low. No median values are above 10 litter items per 100 m beach, except from the median value of 27.5 litter items per 100 m for Paper in the Gulf of Riga. Only one sub-basin, Kattegat, has a median value for Sanitary and medical items that is above zero (1 litter per 100 m beach), despite finding a total of 1038 sanitary and medical items on Baltic Sea beaches during the 6-year monitoring period. The same pattern is shown for Various materials where the Gulf of Riga is the only sub-basin that shows a value above zero, median of 1.5 litter items per 100 m. The data gives the impression that this category, Various materials, only found in the Master List of Categories of Litter Items (JRC, 2013) and the MARLIN litter item list (MARLIN, 2013), is only used by some countries when reporting.
A list of the minimum and maximum median values per sub-basin is provided in Appendix 1, table 1.2, to increase the understanding of the results. A list of litter items/categories and their relation to materials, as well as single-use plastics (SUP) and fisheries related litter (FRL), is found in Appendix 3, table 3.1.
4.2 Trends
The evaluation includes trend analyses on marine beach litter for the 6-year period between 2016-2021 (table 4; values in Appendix 1, table 1.3). For several sub-basins, including the Bay of Mecklenburg, the Arkona Basin, the Bornholm Basin, the Eastern Gotland Basin, the Gulf of Riga, and the Gulf of Finland, the trends for total count (TC) show a significant decrease in the total count of litter, which correlates with a decrease in SUP and Plastic litter item categories. The significant decreases in TC for the different sub-basins range between 0.85 to 3.01 litter items per year. Only one sub-basin, the Gdansk Basin, shows an increase in TC, SUP, and Plastic litter items. Trends of SUP litter items for all other sub-basins, except for the Gdansk Basin, shows improving trends, with a slow decrease of litter items of below 1 litter per year. Examples of the relationship between TC and SUP are shown in figure 3.
For the FRL litter items, the Arkona Basin, and the Eastern Gotland Basin, show a significant decrease. The Gdansk Basin and the Bothnian Sea show an opposite trend, with slight increases between 0.14 to 0.27 litter items per year. The Bornholm Basin has a significant stable level.
Table 4. Significant trends (2016-2021) for Total Count (TC), SUP, FRL, and Plastic litter categories for each sub-basin, N=number of surveys. Test of significance is based on p < 0.05 for either downwards trends (arrow down), upward trend (arrow up) or no trend (arrow straight). The beaches that do not fulfil the requirements are excluded before the analyses are done. Empty cells indicate no significant trend.
| Sub-basins | N | TC | SUP | FRL | Plastic |
|---|---|---|---|---|---|
| SEA-001 Kattegat | 42 | ||||
| SEA-003 The Sound | 18 | ||||
| SEA-004 Kiel Bay | 61 | ||||
| SEA-005 Bay of Mecklenburg | 132 | ↘ | ↘ | ↘ | |
| SEA-006 Arkona Basin | 270 | ↘ | ↘ | ↘ | ↘ |
| SEA-007 Bornholm Basin | 202 | ↘ | ↘ | → | ↘ |
| SEA-008 Gdansk Basin | 143 | ↗ | ↗ | ↗ | ↗ |
| SEA-009 E Gotland Basin | 62 | ↘ | ↘ | ↘ | ↘ |
| SEA-010 W Gotland Basin | 54 | ||||
| SEA-011 Gulf of Riga | 47 | ↘ | ↘ | ↘ | |
| SEA-012 N Baltic Proper | 31 | ||||
| SEA-013 Gulf of Finland | 127 | ↘ | ↘ | ||
| SEA-014 Åland Sea | 104 | ||||
| SEA-015 Bothnian Sea | 46 | ↗ | ↗ | ||
| SEA-017 Bothnian Bay | 52 |
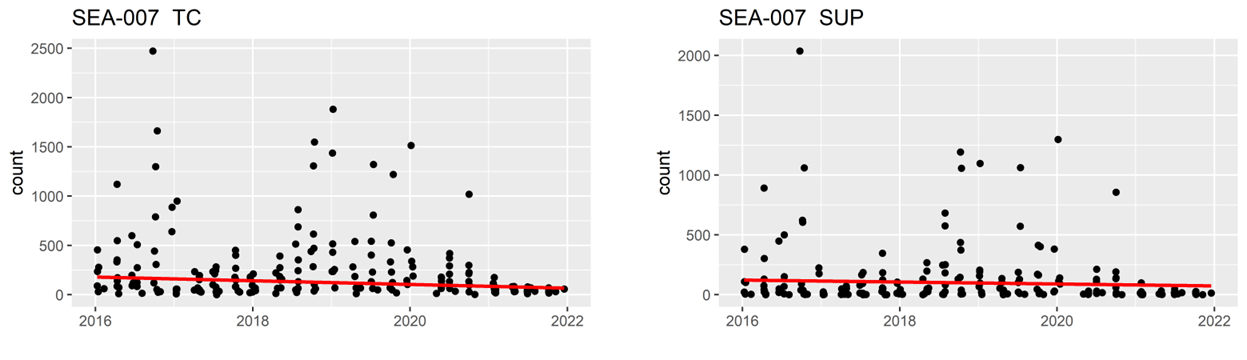
Slope=-0.82, p-value=0.0014
Slope=-1.88, p-value=0.0001
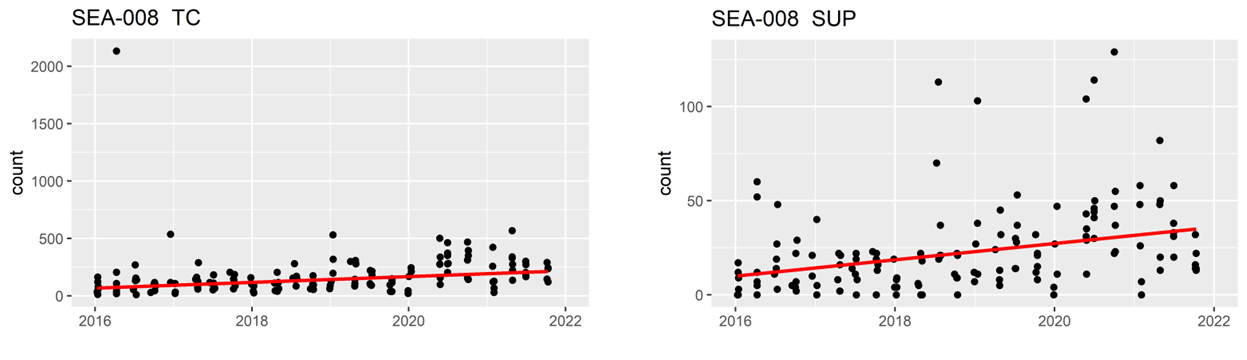
Slope=2.53, p-value < 0.001
Slope=0.43, p-value < 0.001
Figure 3. Example of significant trends for total count and SUP litter items in Bornholm Basin (SEA-007) and Gdansk Basin (SEA-008), where it is indicated that SUP is the driving force for the downward and upward trend, respectively.
For other materials or groups than Plastic, i.e., Rubber, Metal, Glass, Paper, Textile, Wood, Sanitary and medical items, and Various materials, the significant trends vary and the changes are small. Most trends indicate an improving or stable status. Rubber, Paper, Sanitary and medical items, and Various materials do not change in number for any of the basins. Metal and Textile items are slightly decreasing, less than 1 litter item per year. Only Wood increases in two of the sub-basins, the Gdansk Basin and the Northern Baltic Proper. Results are shown in Annex 1, table 1.4.
The HELCOM Regional Action Plan on Marine Litter (HELCOM, 2021a) aims to reduce common litter items and it is partly based on findings from beach litter monitoring. To meet that need, a top ten list of the most common litter items for the entire Baltic Sea has been produced, based on medians of ranks for sub-basin top-ten lists (table 5). The most common category of litter items is Various plastic items and fragments >2.5 cm. It was an expected result since many different plastic litter items (33 litter types) were aggregated in this category when the lists used by Contracting Parties around the Baltic Sea were harmonised. It is followed by several SUP litter items, Plastic packaging for food and beverage, Plastic bags and Plastic caps and lids. Plastic bottles are found on place number ten. The category Other glass and ceramics ranked number 5 is also aggregated by seven other glass or ceramic litter items and fragments ≥ 2.5 cm. The same applies for paper, where all (12) paper and cardboard litter items except for new paper and magazines are aggregated into one category. Thus, this category gathers, for example, Paper bags, Paper cigarette packages, Cardboard boxes, Paper cups and Paper fragments. Fragments should, generally, be counted as one category if they originate from the same item, but this may be difficult to distinguish when conducting the monitoring. Therefore, the number of litter items in such categories can be high. It is also possible that the substitution of plastic for other materials may increase the amount of these other categories, e.g., cardboard litter. The Single Use Plastic Directive (EU, 2019) and corresponding downward trends in SUP litter items reinforces that hypothesis.
Table 5. Top-ten litter item list (2016-2021), Baltic Sea wide, based on medians of ranks for sub-basin top-ten lists.
| Rank | Litter Code | Litter name |
| 1 | R2425 | Various plastic items and fragments >2.5 cm |
| 2 | R4 | Plastic packaging for food and beverage |
| 3 | R2 | Plastic bags |
| 4 | R6 | Plastic caps and lids |
| 5 | R50 | Other glass and ceramics |
| 6 | R1 | Plastic six-pack rings |
| 7 | R16 | Ropes, strings, and cords |
| 8 | R33 | Paper excluding newspaper and magazines |
| 9 | R10 | Plastic syringes |
| 10 | R3 | Plastic bottles |
4.3 Discussion
The overall impression is that beach litter is still common around the coast of the Baltic Sea (figure 2 and table 6). Only four (five with the Quark) out of seventeen sub-basins do have median values below the threshold value of 20 litter items per 100 m beach. However, when looking at each sub-basin, eight of them are showing median values close to the threshold value, ranging between 23 to 33 litter items per 100 m beach. The litter levels are also lower than the Baltic wide baseline level of 40 litter items per 100 m from 2015-2016 (Hanke et al. 2019). Such baseline levels have, however, not been derived for each sub-basin. The sub-basins with high median values, that stand out from the other results are the Sound (313 litter items per 100 m), the Gulf of Riga (156 litter items per 100 m), and the Eastern Gotland Basin (96 litter items per 100 m). Both the Gulf of Riga and the Eastern Gotland Basin show an improvement of the beach litter situation between 2016 and 2021, while the Sound shows no significant trend. In addition, the beaches monitored in the Gulf of Riga and the Gulf of Finland consist mostly of urban and semi-urban beaches (90%). The litter is therefore expected to originate mainly from visitors, during the summer season. It is likely that the SUP Directive and other preventive measures within HELCOM’s Action Plan (HELCOM, 2021a), e.g., around sustainable consumption and production will reduce plastic waste in general but especially for this type of beaches (Appendix 1, table 1.5).
Table 6. Status evaluations, trends, and outcomes on marine litter for Baltic Sea sub-basins.
| Sub-basin, HELCOM Scale 2 | Total count of litter items per 100 m (median values for 2016-2021) | Significant trends | Description of outcomes |
|---|---|---|---|
| SEA-001 Kattegat | 33 | No trend | Indicator evaluation failed to achieve the threshold value. No significant trend between the years of 2016-2021. |
| SEA-002 Great Belt | No data | No data | _ |
| SEA-003 The Sound | 313* | No trend | Indicator evaluation failed to achieve the threshold value. The median value is significantly above the baseline value for the entire Baltic Sea of 40 litter items per 100 m (year 2015-2016). No significant trend for the period 2016-2021. |
| SEA-004 Kiel Bay | 19 | No trend | Indicator evaluation achieved the threshold value. No significant trend for the period 2016-2021. |
| SEA-005 Bay of Mecklenburg | 15 | Improving | Indicator evaluation achieved the threshold value. The downward trend indicates an improving situation for the period 2016-2021. |
| SEA-006 Arkona Basin | 30 | Improving | Indicator evaluation failed to achieve the threshold value. The median value is below the baseline value for the entire Baltic Sea of 40 litter items per 100 m (year 2015-2016). The downward trend indicates an improving situation for the period 2016-2021. |
| SEA-007 Bornholm Basin | 23 | Improving | Indicator evaluation failed to achieve the threshold value. The median value is close to the threshold value of 20 litter items per 100 m and below the baseline value for the entire Baltic Sea of 40 litter items per 100 m (year 2015-2016). The downward trend indicates an improving situation for the period 2016-2021. |
| SEA-008 Gdansk Basin | 13 | Deteriorating | Indicator evaluation achieved the threshold value. However, there is an upward trend for the period 2016-2021 indicating that potential measures against littering have not been successful. |
| SEA-009 E Gotland Basin | 96 | Improving | Indicator evaluation failed to achieve the threshold value. The median value is significantly above the baseline value for the entire Baltic Sea of 40 litter items per 100 m (year 2015-2016). The downward trend indicates an improving situation for the period 2016-2021. |
| SEA-010 W Gotland Basin | 11 | No trend | Indicator evaluation achieved the threshold value. No significant trend for the period 2016-2021. |
| SEA-011 Gulf of Riga | 156 | Improving | Indicator evaluation failed to achieve the threshold value. The median value is significantly above the baseline value for the entire Baltic Sea of 40 litter items per 100 m (year 2015-2016). The downward trend indicates an improving situation for the period 2016-2021. |
| SEA-012 N Baltic Proper | 27* | No trend | Indicator evaluation failed to achieve the threshold value. The median value is below the baseline value for the entire Baltic Sea of 40 litter items per 100 m (year 2015-2016). No significant trend for the period 2016-2021. |
| SEA-013 Gulf of Finland | 28 | Improving | Indicator evaluation failed to achieve the threshold value. The median value is below the baseline value for the entire Baltic Sea of 40 litter items per 100 m (year 2015-2016). The downward trend indicates an improving situation for the period 2016-2021. |
| SEA-014 Åland Sea | 23 | No trend | Indicator evaluation failed to achieve the threshold value. The median value is below the baseline value for the entire Baltic Sea of 40 litter items per 100 m (year 2015-2016). No significant trend for the period 2016-2021. |
| SEA-015 Bothnian Sea | 24 | No trend | Indicator evaluation failed to achieve the threshold value. The median value is below the baseline value for the entire Baltic Sea of 40 litter items per 100 m (year 2015-2016). No significant trend for the period 2016-2021. |
| SEA-016 The Quark | 5* | N.a. | Indicator evaluation achieved the threshold value but includes only limited data for one beach and less than 40 surveys, and consequently the results are less robust. Trend analysis was not possible to calculate due too few surveys. |
| SEA-017 Bothnian Bay | 29 | No trend | Indicator evaluation failed to achieve the threshold value. The median value is below the baseline value for the entire Baltic Sea of 40 litter items per 100 m (year 2015-2016). No significant trend for the period 2016-2021. |
| GES <HELCOM threshold value 20 litter per 100 m | |||
| No GES >HELCOM threshold value 20 litter per 100 m | |||
| *=sub-basins within total <40 surveys are considered given less reliable results | |||
| N.a.=not applicable because the beach(es) is not fulfilling the required criteria for a robust trend analysis | |||
The status of Russian litter in the Gulf of Finland has been reviewed by Ershova et al. (2021). They concluded that in the period 2018-2019, beaches at the inner parts of the estuary in the Neva Bay had the highest number of litter items, for all categories. Plastic pellets, broken glass and cigarette butts were the most common litter types. The proximity to St. Petersburg with its 5.2 million inhabitants obviously affects the results. Different methodologies were applied on beaches, and thus results cannot be directly compared with results from the current evaluation. The unit used was litter pieces per square meter and included both macro-, meso- and microlitter. Beaches with both high numbers of visitors and less-visited beaches were included in the study.
5 Confidence
Further confidence information for use of median of 40 surveys for robust evaluation of beach litter compared to the beach litter threshold value is available (van Loon et al., 2020). This minimum number was optimized using the 95% confidence interval of the median and appeared to be 40 surveys per country-subregion. This is the number of surveys (N) at which a further increase of N has less added value for the robustness of the assessment value.
6 Drivers, Activities, and Pressures
Litter present on beaches comes both from land- and sea-based sources. Land-based sources are often linked to consumer behaviour, such as recreational/tourism activities (e.g., plastic bags, left-overs from beach picnics, cigarette butts). Other land-based sources are riverine inputs and inputs from storm water overflows. Important sea-based sources are professional and recreational ships (ships generated waste) as well as fishing related activities (lost/abandoned fishing gear, foamed plastic, lost cages). Thus, beach litter monitoring can reflect trends of littering of the coast/beaches including coastal waters and possibly also litter transported over long distances. Beach litter can, to a certain extent (indicator item concept), be linked to sources and pathways, which is a fundamental step for a subsequent definition of measures aimed at acting on those sources and pathways to minimize the presence of marine litter in the aquatic environment. The pressure and activities are summarised in table 7.
Table 7. Pressure and activities. Brief summary of relevant pressures and activities with relevance for the indicator.
| General | MSFD Annex III, Table 2a | |
| Strong link | Fish and shellfish harvesting (professional, recreational), aquaculture, shipping, urban and industrial uses, waste treatment and disposal, tourism and leisure | Substances, litter and energy – Input of litter (solid waste matter, including micro-sized litter) |
| Weak link | Extraction of living resources
Hunting and collecting for other purposes |
7 Climate change and other factors
In a recently published article by several researchers in the fields of climate and marine litter, strong connections between these two rapidly growing environmental problems have been established (Ford et al, 2022). The researchers highlight the importance of an integrated approach to the problems and their solutions instead of the issues surrounding plastic pollution in the ocean and the climate crisis competing for publicity and political attention. The authors also believe that a commitment against plastic littering in the sea can also increase interest in climate change and how these issues can be solved. According to the article, the four most important connections between climate change and plastic pollution in the oceans are:
1) Plastic contributes to the emission of greenhouse gases throughout its life cycle, including as litter in the sea,
2) Climate change and plastic pollution occur together everywhere in all environments,
3) Climate change will worsen the spread of plastic pollution,
4) There are already solutions today that stop both climate change and plastic pollution from reaching the environment.
Litter abundance on the coastline is depending on water currents, and prevailing wind conditions. Rivers are pathways for litter from inland littering. Climatological e.g., heavy rains and floods and oceanographic changes will alter the litter abundance and deposition of litter.
In the long term, it is conceivable that a warmer climate in the more northerly latitudes leads to increased tourism around the coasts of the Baltic Sea and thus also an increased risk of littering.
8 Conclusions
In summary, the situation for the Baltic Sea in terms of macro-litter on beaches is elevated compared to the threshold value for most of the sub-basins. Fortunately, decreasing trends in beach litter occur in several of the sub-basins and only one shows an increasing trend. Further work on actions against marine litter are though required to reach good environmental status in the Baltic Sea. The evaluation also indicated that there is a need for better geographical coverage with improving monitoring efforts to evaluate the effect of actions against marine litter. Harmonisation of beach litter protocols is key and more research on identifying sources of litter is essential. More attention is likewise needed to how the sub-basins evaluations are influenced by types of included monitoring beaches, e.g., remote vs urban/semi-urban beaches. Resources are required for expanded monitoring programmes and for research on sources and impacts.
8.1 Future work or improvements needed
Future work needs to focus on the harmonisation of protocols, preferably by implementing the EU Joint List of Litter Categories for Marine Macrolitter Monitoring (Fleet et al. 2021) by all HELCOM Contracting Parties.
There is further a need for better coverage with continuous monitoring efforts on beaches in all sub-basins, representing different types of beaches including remote ones.
9 Methodology
9.1 Scale of assessment
The temporal scale used in this assessment is the predefined time of a six-year period between 2016-2021 in accordance with the MSFD reporting period (European Commission, 2013). On a spatial scale, the HELCOM EG Marine Litter recommended using Scale 2 of the HELCOM sub-divisions of the Baltic Sea for regional monitoring and assessment purposes, i.e., Scale 2 divides the Baltic Sea into 17 sub-basins (see HELCOM Monitoring and Assessment Strategy, 2013). State and Conservation 13-2020 agreed on the use of assessment scale 2 for all beach types, however acknowledged that this can be revisited in the future if the underlying data supports a higher resolution (Outcome of State and Conservation 13-2020, para. 4J.32).
It has not been possible to compare the current evaluation with the last evaluation on data from 2015-2016. One reason is that the scale used last time was on a national sub-regional scale.
9.2 Methodology applied
As a first step, it was necessary to harmonise historical data to be able to calculate statistics on the beach litter abundance and trends. This was done by producing a separate list of litter items and categories where similar litter from the different lists has been given a new common code. In some cases, litter items/categories have been aggregated into one code due to the level of detail in the various lists. The common list, with unique reporting codes, and the relation to A Joint List of Litter Categories for Marine Macrolitter Monitoring (Fleet et al, 2021) is found in Appendix 3, table 3.1.
The different litter lists considered for the common list were:
- A Joint List of Litter Categories for Marine Macrolitter Monitoring (EU J-list) (Fleet et al. 2021),
- Guidance on Monitoring of Marine Litter in European Seas (EU Master list) (JCR, 2013),
- Guideline for Monitoring Marine Litter on the Beaches in the OSPAR Maritime Area (OSPAR Commission, 2010),
- Beach litter measurement method description (MARLIN, 2013) based on UNEP/IOC Guidance on Survey and Monitoring of Marine Litter (UNEP/IOC, 2009),
- Denmark, OSPAR/EU J-list,
- Germany, OSPAR/EU Master list, Meckl. Vorpommern/Schleswig-Holstein area.
Some individual litter items have been excluded from the statistical analysis. These are: R52 Organic food waste and R99 Other organic waste because their relatively short degradation time, R53 Chemicals because it requires other dedicated monitoring methods, R98 Micro- and mesolitter because of incomparable monitoring results, R23 Cigarette butts and R54 Snuff are excluded from Estonia and Latvia for all years, and for Sweden and Finland for the period 2016-2019. The reason is that cigarette butts and snuff have, during those years, were counted at a 10 m beach stretch, which does not provide a robust statistical basis.
All litter type abundances were normalised to 100 m.
Statistical analyses have been done by using the statistical tool LitteR for calculating methodology for median values and trends, using national MSFD data (2016-2021). The same criteria as those for the determination of the threshold value have been used (van Loon et al., 2020).
Below, there is a compilation of the most important steps in the evaluation process:
- Statistically analysing data as median values and trends for aggregated datapoints by HELCOM Scale 2 assessment units. This was done with the statistical tool, LitteR, in two ways:
a) For median values all available monitoring data was included except from beaches with less than 3 surveys during the period 2016-2021. Sub-basins with data including < 40 surveys are considered less reliable and are marked with pink in the table and with an * in supporting visuals,
b) For time trend calculations, criteria of a minimum of 5 years and 10 surveys for a beach were used. This is recommended by the LitteR statistical programme to obtain statistically robust results. Included and excluded monitoring beaches are listed in Appendix 2,
- Comparing the calculated median values of total count (TC) to the HELCOM threshold value to determine the status of beach litter in each sub-basin,
a) Median = or < threshold
=> Good environmental status achieved,
b) Median > threshold
=> Good environmental status failed,
- Providing only results with significant trends (p <0.05):
a) Improving trends ≤ 0
b) Deteriorating trends ≥ 0
c) Stable trends = 0
- Calculating median minimum and maximum values per region to get increased understanding of the statistical results, and
- Providing a top-ten litter item list, Baltic Sea wide, for beach litter based on medians of ranks for sub-basin top-ten lists.
9.3 Monitoring and reporting requirements
Monitoring methodology
Guidelines for beach litter (>2,5cm) are in place, HELCOM guidelines for monitoring beach litter. The HELCOM Revised Action Plan on Marine Litter from October 2021, recommends “improved coordinated monitoring programmes for the beach litter and seafloor litter indicators including data collection for regular evaluation of the state of marine litter in the Baltic Sea area”. However, HELCOM members still apply different methodologies and litter codes.
The OSPAR Guidelines are followed in Denmark and Germany. Denmark uses the Joint List of Litter Categories for Marine Macrolitter Monitoring with a conversion to the OSPAR list. Germany uses a modified OSPAR list. Estonia, Finland Latvia and Sweden use the MARLIN methodology (based on the UNEP/IOC Guidelines) and associated litter items list.
Poland established their own national slightly modified methodology also based on Guidance on Monitoring of Marine Litter in European Seas, using the Master list with G-codes for litter items. The Master list is also used by Lithuania.
Beach types and the location of the monitoring sites for the period 2016-2021 are displayed in Annex 1, figure 1.1, and table 1.5.
10 Data
The data and resulting data products (e.g., tables, figures and maps) available on the indicator web page can be used freely given that it is used appropriately, and the source is cited.
Result: Macro litter on beaches
Marine beach litter monitoring data from Denmark, Estonia, Finland, Germany, Latvia, Lithuania, Poland, and Sweden were extracted from the European Marine Observation and Data Network (EMODnet). Denmark and Sweden provided additional data directly for the purpose of this evaluation.
11 Contributors
Eva Blidberg (Sweden) and Jakob Strand (Denmark), co-leads for the beach litter indicator.
HELCOM Expert Group on Marine Litter (HELCOM EG Marine Litter).
HELCOM Secretariat: Marta Ruiz.
EMODnet database and additional national data providers.
Contributing projects: HELCOM Blues.
12 Archive
This version of the HELCOM core indicator report was published in April 2023:
The current version of this indicator (including as a PDF) can be found on the HELCOM indicator web page.
No earlier versions of this indicator currently exist.
13 References
Ershova, A.A., Eremina, T.R., Chubarenko, I.P., Esiukova, E.E. (2021). Marine Litter in the Russian Gulf of Finland and South-East Baltic: Application of Different Methods of Beach Sand Sampling. In: Stock, F., Reifferscheid, G., Brennholt, N., Kostianaia, E. (eds) Plastics in the Aquatic Environment – Part I. The Handbook of Environmental Chemistry, vol 111. Springer, Cham. https://doi.org/10.1007/698_2021_746
European Commission, 2022. MSFD CIS Guidance Document No. 19, Article 8 MSFD, May 2022. https://circabc.europa.eu/d/d/workspace/SpacesStore/d2292fb4-ec39-4123-9a02-2e39a9be37e7/GD19%20-%20MSFDguidance_2022_Art.8Assessment(1).pdf
EU, 2019. Directive (EU) 2019/904 of the European Parliament and of the Council of 5 June 2019 on the reduction of the impact of certain plastic products on the environment. https://eur-lex.europa.eu/eli/dir/2019/904/oj
Fleet, D., Vlachogianni, Th. and Hanke, G., 2021. A Joint List of Litter Categories for Marine Macrolitter Monitoring. EUR 30348 EN, Publications Office of the European Union, Luxembourg, 2021, ISBN 978-92-76-21445-8, doi:10.2760/127473, JRC121708 https://mcc.jrc.ec.europa.eu/main/dev.py?N=41&O=459
Ford, H.V., Jones, N.H., Davies, A.J., Godley, B.J., Jambeck, J.R., Napper, I.E., Suckling, C.C., Williams, G.J., Woodall, L.C., Koldewey, H.J. (2022). The fundamental links between climate change and marine plastic pollution. Science of the Total Environment 806:150392. https://www.sciencedirect.com/science/article/pii/S0048969721054693
Hanke G., Walvoort D., van Loon W., Addamo A.M., Brosich A., del Mar Chaves Montero M., Molina Jack M.E., Vinci M., Giorgetti A. 2019. EU Marine Beach Litter Baselines, EUR 30022 EN, Publications Office of the European Union, Luxemburg, 2019, ISBN 978-92- 76-14243-0, doi:10.2760/16903, JRC114129. https://mcc.jrc.ec.europa.eu/documents/202001160537.pdf
HELCOM, 2013. Monitoring and Assessment Strategy. Attachment 4 of the document was updated in 25.2.2022 following HOD 61-2021 meeting decision on updating HELCOM Assessment Units and 29.8.2022 following update on coastal assessment units. https://helcom.fi/wp-content/uploads/2020/02/Monitoring-and-assessment-strategy.pdf
HELCOM, 2018. Declaration of the Ministers of the Environment of the Baltic Coastal Countries and the EU Environment Commissioner, HELCOM Brussels Declaration 2018, pp. 10. https://helcom.fi/wp-content/uploads/2019/06/HELCOM-Brussels-Ministerial-Declaration.pdf
HELCOM, 2021a. HELCOM Recommendation 42-43/3 on the Regional Action Plan on Marine Litter. https://helcom.fi/wp-content/uploads/2021/10/HELCOM-Recommendation-42-43-3.pdf
HELCOM, 2021b. Baltic Sea Action Plan, 2021 update. https://helcom.fi/wp-content/uploads/2021/10/Baltic-Sea-Action-Plan-2021-update.pdf
HOD, 2021. Outcome of the 61st Meeting of the Heads of Delegation. https://portal.helcom.fi/meetings/HOD%2061-2021-896/MeetingDocuments/Outcome%20of%20HOD%2061-2021.pdf
JRC, 2013. Guidance on Monitoring of Marine Litter in European Seas. Reference Report by the Joint Research Centre of the European Commission, pp. 124. https://mcc.jrc.ec.europa.eu/documents/201702074014.pdf
MARLIN, 2013. Beach litter measurement method description. An EU-project report. https://skola-kommun.hsr.se/sites/default/files/appendix1_measurement_method_1.pdf
OSPAR, 2020. CEMP Guidelines for marine monitoring and assessment of beach litter. https://www.ospar.org/documents?v=44122
UNEP/IOC, 2009. UNEP/IOC Guidance on Survey and Monitoring of Marine Litter.
https://wedocs.unep.org/handle/20.500.11822/13604
UNEP, United Nations Environment Programme, 2021. From Pollution to Solution: A global assessment of marine litter and plastic pollution. Nairobi, pp. 148. https://www.unep.org/resources/pollution-solution-global-assessment-marine-litter-and-plastic-pollution
van Loon, W., Hanke, G., Fleet, D., Werner, S., Barry, J., Strand, J., Eriksson, J., Galgani, F., Gräwe, D., Schulz, M., Vlachogianni, T., Press, M., Blidberg, E. and Walvoort, D., 2020. A European threshold value and assessment method for macro litter on coastlines, EUR 30347 EN, Publications Office of the European Union, Luxembourg, 2020, ISBN 978-92-76-21444-1, doi:10.2760/54369, JRC121707. https://publications.jrc.ec.europa.eu/repository/handle/JRC121707
14 Other relevant resources
No additional information is required for this indicator.
Appendix 1.
Table 1.1. Median values (2016-2021) for beach litter in different materials and for the categories, Sanitary and medical items (S&M), and Various materials (VM).
| Sub-basins | N | Rubber | Metal | Glass | Paper | Textile | Wood | S&M | VM |
| SEA-001 | 54 | 1.0 | 1.0 | 0.5 | 0.0 | 0.0 | 3.0 | 1.0 | 0.0 |
| SEA-003 | 18 | 2.0 | 7.5 | 7.0 | 2.0 | 8.0 | 2.5 | 0.0 | 0.0 |
| SEA-004 | 83 | 0.5 | 1.0 | 4.0 | 0.0 | 0.0 | 0.5 | 0.0 | 0.0 |
| SEA-005 | 132 | 0.0 | 1.0 | 1.0 | 1.0 | 0.0 | 0.0 | 0.0 | 0.0 |
| SEA-006 | 330 | 1.0 | 1.0 | 0.5 | 0.0 | 0.8 | 0.0 | 0.0 | 0.0 |
| SEA-007 | 202 | 0.2 | 1.1 | 0.3 | 0.6 | 0.2 | 0.5 | 0.0 | 0.0 |
| SEA-008 | 143 | 0.2 | 0.9 | 0.5 | 0.4 | 0.3 | 0.3 | 0.0 | 0.0 |
| SEA-009 | 88 | 4.0 | 3.0 | 1.0 | 3.0 | 2.0 | 2.0 | 0.0 | 0.0 |
| SEA-010 | 54 | 0.0 | 1.5 | 0.0 | 0.0 | 0.0 | 0.2 | 0.0 | 0.0 |
| SEA-011 | 68 | 2.0 | 8.0 | 4.0 | 27.5 | 4.5 | 2.0 | 0.0 | 1.5 |
| SEA-012 | 31 | 0.5 | 2.0 | 1.0 | 0.0 | 0.3 | 3.0 | 0.0 | 0.0 |
| SEA-013 | 133 | 0.3 | 1.8 | 0.5 | 1.0 | 0.3 | 1.5 | 0.0 | 0.0 |
| SEA-014 | 107 | 0.0 | 0.3 | 0.9 | 0.0 | 0.0 | 0.5 | 0.0 | 0.0 |
| SEA-015 | 46 | 0.0 | 1.0 | 0.0 | 0.5 | 0.0 | 1.5 | 0.0 | 0.0 |
| SEA-016 | 5 | 0.0 | 0.0 | 0.0 | 0.0 | 0.0 | 0.4 | 0.0 | 0.0 |
| SEA-017 | 52 | 0.3 | 2.6 | 2.5 | 2.0 | 0.3 | 0.8 | 0.0 | 0.0 |
Table 1.2. Minimum and maximum median values for each sub-basin, N=number of beaches.
| Sub-basin | N | median min | median max |
| SEA-001 Kattegat | 3 | 8 | 481 |
| SEA-003 The Sound | 1 | N.A. | N.A. |
| SEA-004 Kiel Bay | 7 | 9 | 85 |
| SEA-005 Bay of Mecklenburg | 6 | 10 | 196 |
| SEA-006 Arkona Basin | 20 | 2 | 124 |
| SEA-007 Bornholm Basin | 9 | 7 | 63 |
| SEA-008 Gdansk Basin | 6 | 10 | 18 |
| SEA-009 E Gotland Basin | 19 | 4 | 348 |
| SEA-010 W Gotland Basin | 3 | 6 | 163 |
| SEA-011 Gulf of Riga | 30 | 14 | 428 |
| SEA-012 N Baltic Proper | 2 | 23 | 31 |
| SEA-013 Gulf of Finland | 10 | 6 | 56 |
| SEA-014 Åland Sea | 7 | 19 | 153 |
| SEA-015 Bothnian Sea | 3 | 12 | 24 |
| SEA-016 The Quark | 1 | N.A. | N.A. |
| SEA-017 Bothnian Bay | 3 | 11 | 39 |
N.A.=not applicable
Table 1.3. Significant trends (2016-2021) for Total Count (TC), SUP, FRL, and Plastic litter categories for each sub-basin, N=number of surveys.
| Sub-basin | N | TC | SUP | FRL | Plastic |
| SEA-001 Kattegat | 42 | ||||
| SEA-003 The Sound | 18 | 4.84 | |||
| SEA-004 Kiel Bay | 61 | ||||
| SEA-005 Bay of Mecklenburg | 132 | -2.59 | -0.74 | -1.41 | |
| SEA-006 Arkona Basin | 270 | -4.92 | -0.50 | -0.29 | -3.34 |
| SEA-007 Bornholm Basin | 202 | -1.88 | -0.82 | 0.00 | -1.37 |
| SEA-008 Gdansk Basin | 143 | 2.53 | 0.43 | 0.14 | 1.37 |
| SEA-009 E Gotland Basin | 62 | -0.85 | -0.32 | -0.12 | -1.26 |
| SEA-010 W Gotland Basin | 54 | ||||
| SEA-011 Gulf of Riga | 47 | -3.01 | -0.92 | -1.34 | |
| SEA-012 N Baltic Proper | 31 | ||||
| SEA-013 Gulf of Finland | 127 | -2.27 | -1.86 | ||
| SEA-014 Åland Sea | 104 | ||||
| SEA-015 Bothnian Sea | 46 | 0.27 | 1.89 | ||
| SEA-017 Bothnian Bay | 52 |
Table 1.4. Significant trends (2016-2021) for beach litter in different materials and for the categories, Sanitary and medical items (S&M), and Various materials (VM). Decreasing or increasing trends, i.e., if the litter situation in the different sub-basins is improving or deteriorating. N=number of surveys.
| Sub-basins | N | Rubber | Metal | Glass | Paper | Textile | Wood | S&M | VM |
| SEA-001 | 42 | ||||||||
| SEA-003 | 18 | ||||||||
| SEA-004 | 61 | ||||||||
| SEA-005 | 132 | 0.00 | -0.37 | ||||||
| SEA-006 | 270 | 0.00 | -0.29 | 0.00 | 0.00 | 0.00 | 0.00 | ||
| SEA-007 | 202 | -0.21 | -0.06 | 0.00 | 0.06 | 0.00 | |||
| SEA-008 | 143 | 0.02 | 0.04 | 0.65 | |||||
| SEA-009 | 62 | -0.09 | -0.10 | -0.08 | -0.10 | 0.00 | |||
| SEA-010 | 54 | -0.07 | |||||||
| SEA-011 | 47 | -1.75 | 0.00 | ||||||
| SEA-012 | 31 | 0.00 | 0.47 | ||||||
| SEA-013 | 127 | -0.21 | 0.00 | ||||||
| SEA-014 | 104 | 0.00 | -0.11 | -0.36 | |||||
| SEA-015 | 46 | 0.00 | |||||||
| SEA-017 | 52 |
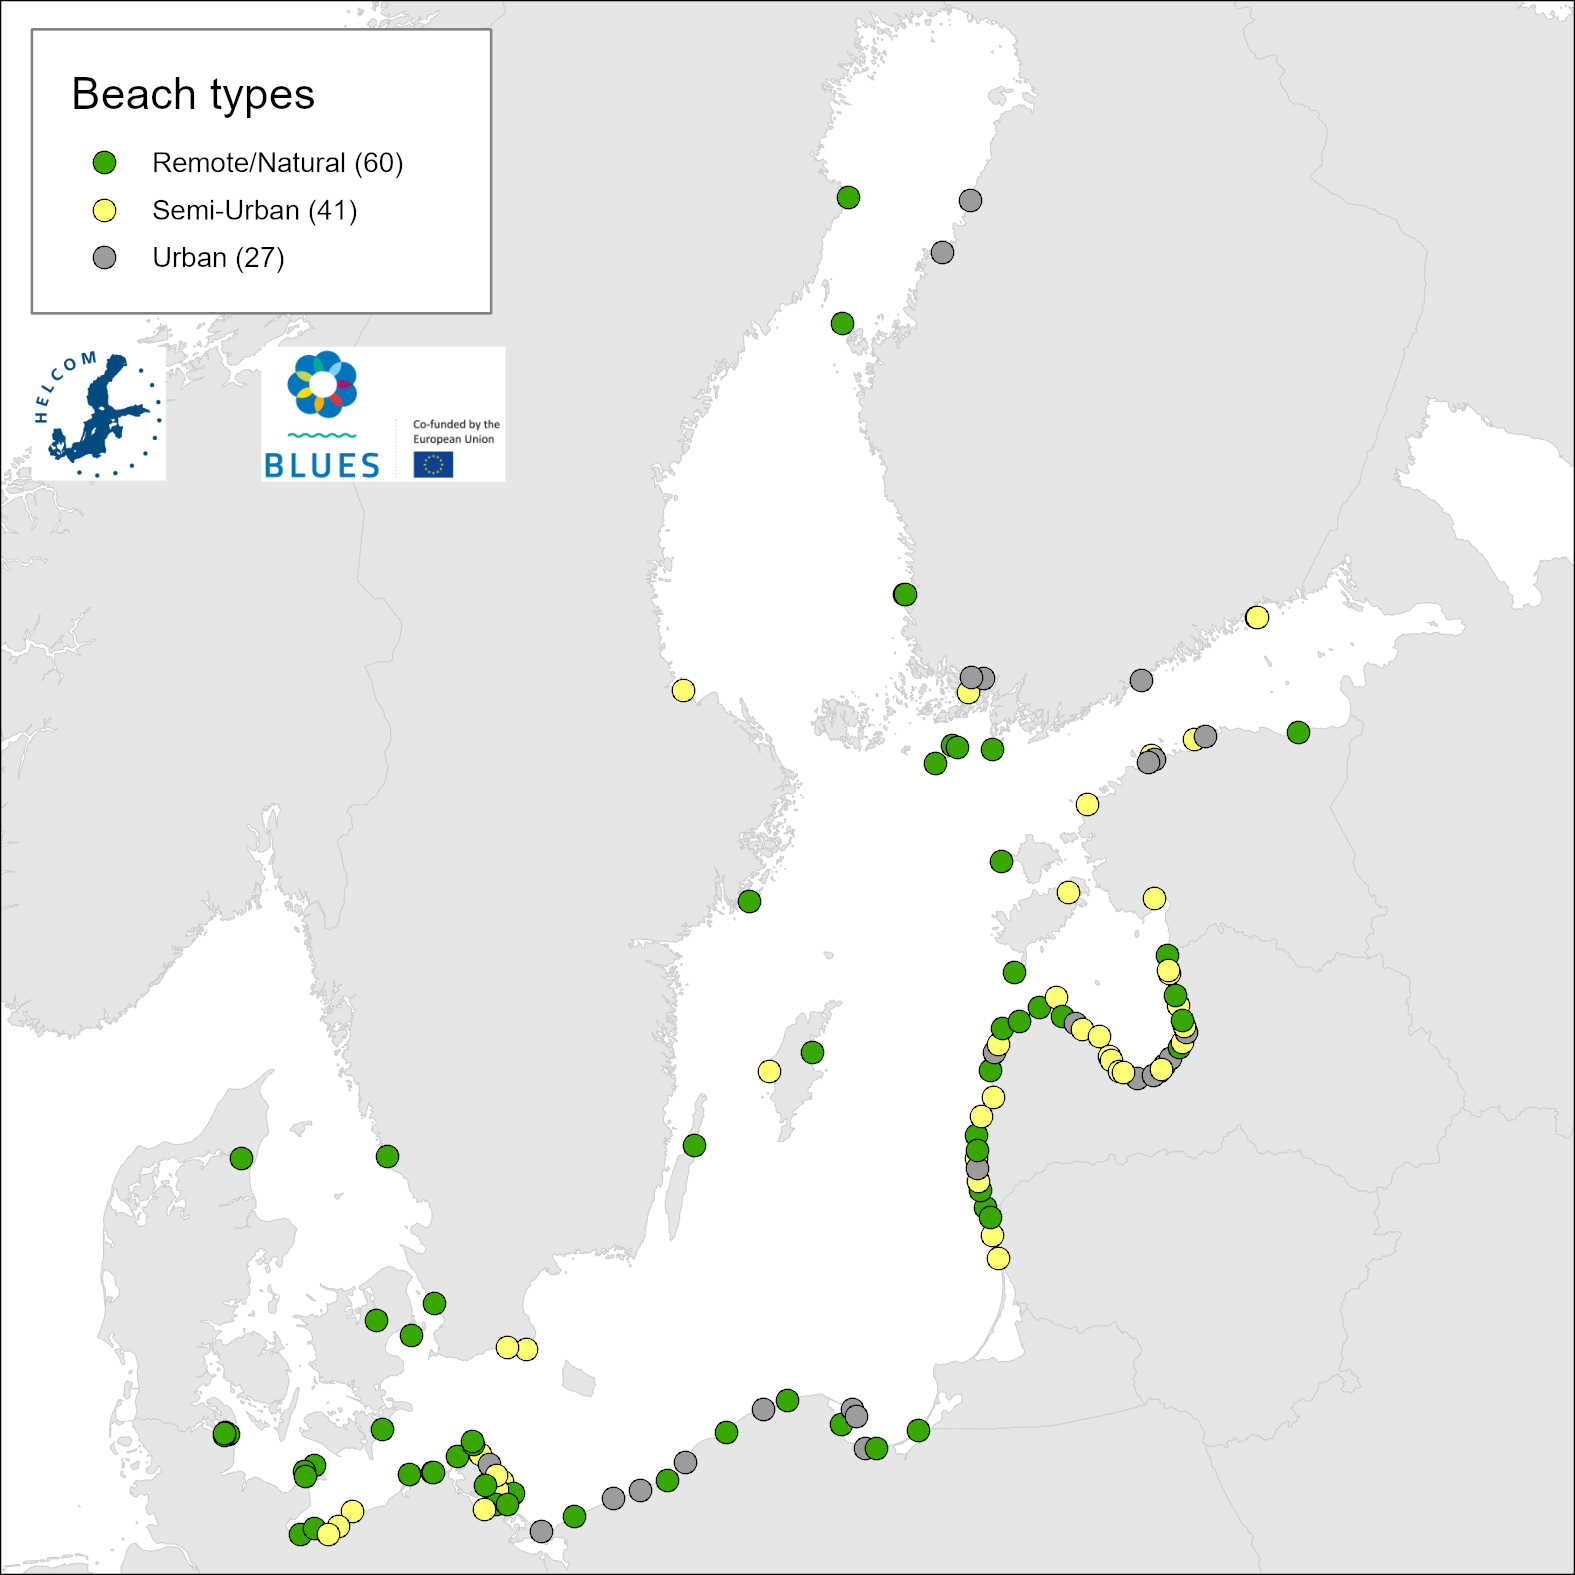
Figure 1.1. Map of beach types (Remote/Natural, Semi-Urban, and Urban) for the entire Baltic Sea for the period 2016-2021.
Table 1.5. Percentage of beach type for each sub-basin, based on beaches included in the calculations of median values, N=number of beaches.
| Sub-basins | N | Remote/Natural | Semi-Urban | Urban |
| SEA-001 Kattegat | 3 | 100 | 0 | 0 |
| SEA-003 The Sound | 1 | 100 | 0 | 0 |
| SEA-004 Kiel Bay | 7 | 100 | 0 | 0 |
| SEA-005 Bay of Mecklenburg | 6 | 50 | 50 | 0 |
| SEA-006 Arkona Basin | 18 | 56 | 39 | 6 |
| SEA-007 Bornholm Basin | 9 | 44 | 11 | 44 |
| SEA-008 Gdansk Basin | 6 | 50 | 0 | 50 |
| SEA-009 E Gotland Basin | 9 | 47 | 37 | 16 |
| SEA-010 W Gotland Basin | 3 | 67 | 33 | 0 |
| SEA-011 Gulf of Riga | 10 | 10 | 60 | 30 |
| SEA-012 N Baltic Proper | 2 | 100 | 0 | 0 |
| SEA-013 Gulf of Finland | 10 | 10 | 50 | 40 |
| SEA-014 Åland Sea | 7 | 57 | 14 | 29 |
| SEA-015 Bothnian Sea | 3 | 67 | 33 | 0 |
| SEA-016 The Quark | 1 | 100 | 0 | 0 |
| SEA-017 Bothnian Bay | 3 | 33 | 0 | 67 |
Appendix 2.
Table 2.1. Beaches included in the median assessment. Criteria: all available monitoring data was included except from beaches with less than 3 surveys. Total number of beaches=98, total number of surveys=1546.
| Sub-basins | Beach codes | Number of years | Number of surveys |
|---|---|---|---|
| SEA-001 | 501 | 6 | 18 |
| SEA-001 | DK006 | 4 | 12 |
| SEA-001 | DK007 | 6 | 24 |
| SEA-003 | 521 | 6 | 18 |
| SEA-004 | FEHM_GRU_01 | 6 | 21 |
| SEA-004 | FEHM_KRU_01 | 6 | 20 |
| SEA-004 | FEHM_WAL_01 | 6 | 20 |
| SEA-004 | Gelting_Birk_001 | 2 | 4 |
| SEA-004 | Gelting_Birk_002 | 3 | 6 |
| SEA-004 | Gelting_Birk_003 | 3 | 7 |
| SEA-004 | Gelting_Birk_004 | 2 | 5 |
| SEA-005 | DARSS_MUL_01 | 6 | 23 |
| SEA-005 | KAGSDF_RS_01 | 6 | 19 |
| SEA-005 | POEL_GOL_01 | 6 | 21 |
| SEA-005 | ROSENHGN_HBA_01 | 6 | 23 |
| SEA-005 | STEINBECK_KLH_01 | 6 | 23 |
| SEA-005 | WIESCHNDF_HUK_02 | 6 | 23 |
| SEA-006 | 531 | 6 | 18 |
| SEA-006 | BINZ_SO_01 | 6 | 23 |
| SEA-006 | BUG_SW_01 | 6 | 21 |
| SEA-006 | DK008 | 6 | 18 |
| SEA-006 | DK009 | 6 | 18 |
| SEA-006 | GLOWE_KH_01 | 4 | 13 |
| SEA-006 | GOHREN_NP_01 | 6 | 23 |
| SEA-006 | GWOIE_HF_01 | 4 | 13 |
| SEA-006 | KLZICKER_OL_01 | 6 | 22 |
| SEA-006 | LUBMIN_FRS_01 | 5 | 18 |
| SEA-006 | LUDWBRG_LA_01 | 3 | 9 |
| SEA-006 | MUKRAN_FH_01 | 4 | 13 |
| SEA-006 | NOBBIN_HG_01 | 6 | 22 |
| SEA-006 | SELLIN_GR_01 | 4 | 12 |
| SEA-006 | VARNKEVZ_HL_01 | 6 | 23 |
| SEA-006 | VILM_WS_01 | 6 | 20 |
| SEA-006 | ZINGST_KIR_01 | 6 | 21 |
| SEA-006 | ZINGST_WAS_01 | 6 | 23 |
| SEA-007 | 41 | 6 | 18 |
| SEA-007 | PL0002 | 6 | 24 |
| SEA-007 | PL0003 | 6 | 24 |
| SEA-007 | PL0008 | 6 | 24 |
| SEA-007 | PL0010 | 6 | 24 |
| SEA-007 | PL0013 | 6 | 23 |
| SEA-007 | PL0014 | 6 | 24 |
| SEA-007 | PL0015 | 6 | 23 |
| SEA-007 | USEDOM_PE_01 | 5 | 18 |
| SEA-008 | PL0004 | 6 | 24 |
| SEA-008 | PL0005 | 6 | 24 |
| SEA-008 | PL0006 | 6 | 24 |
| SEA-008 | PL0007 | 6 | 24 |
| SEA-008 | PL0009 | 6 | 24 |
| SEA-008 | PL0012 | 6 | 23 |
| SEA-009 | 61 | 6 | 18 |
| SEA-009 | LT0003 | 2 | 7 |
| SEA-009 | LT0004 | 2 | 7 |
| SEA-009 | LV0006 | 3 | 3 |
| SEA-009 | LV0008 | 3 | 3 |
| SEA-009 | LV0010 | 3 | 3 |
| SEA-009 | LV0036 | 3 | 3 |
| SEA-009 | PL0001 | 6 | 22 |
| SEA-009 | PL0011 | 6 | 22 |
| SEA-010 | 51 | 6 | 18 |
| SEA-010 | 541 | 6 | 18 |
| SEA-010 | 81 | 6 | 18 |
| SEA-011 | EST002 | 6 | 15 |
| SEA-011 | EST005 | 6 | 16 |
| SEA-011 | EST008 | 6 | 16 |
| SEA-011 | LV0015 | 3 | 3 |
| SEA-011 | LV0019 | 3 | 3 |
| SEA-011 | LV0024 | 3 | 3 |
| SEA-011 | LV0030 | 3 | 3 |
| SEA-011 | LV0031 | 3 | 3 |
| SEA-011 | LV0032 | 3 | 3 |
| SEA-011 | LV0041 | 3 | 3 |
| SEA-012 | EST007 | 6 | 15 |
| SEA-012 | EST010 | 6 | 16 |
| SEA-013 | EST001 | 6 | 16 |
| SEA-013 | EST003 | 6 | 16 |
| SEA-013 | EST004 | 6 | 16 |
| SEA-013 | EST006 | 6 | 16 |
| SEA-013 | EST009 | 6 | 16 |
| SEA-013 | EST011 | 1 | 3 |
| SEA-013 | EST012 | 1 | 3 |
| SEA-013 | FI0002 | 6 | 13 |
| SEA-013 | FI0003 | 6 | 13 |
| SEA-013 | FI0010 | 6 | 21 |
| SEA-014 | FI0001 | 6 | 17 |
| SEA-014 | FI0004 | 6 | 18 |
| SEA-014 | FI0005 | 6 | 18 |
| SEA-014 | FI0006 | 5 | 16 |
| SEA-014 | FI0011 | 6 | 15 |
| SEA-014 | FI0014 | 6 | 20 |
| SEA-014 | FI0015 | 2 | 3 |
| SEA-015 | 11 | 6 | 18 |
| SEA-015 | FI0008 | 6 | 14 |
| SEA-015 | FI0009 | 6 | 14 |
| SEA-016 | FI0016 | 2 | 5 |
| SEA-017 | 511 | 6 | 18 |
| SEA-017 | FI0012 | 6 | 17 |
| SEA-017 | FI0013 | 6 | 17 |
Table 2.2. Beaches included in the trend assessment. Criteria: a minimum of 5 years and 10 surveys for a beach is used. This is recommended by the LitteR programme to give robust statistically results. Total number of beaches=71, total number of surveys=1391.
| Sub-basin | Beach code | Number of years | Number of surveys |
|---|---|---|---|
| SEA-015 | 11 | 6 | 18 |
| SEA-007 | 41 | 6 | 18 |
| SEA-010 | 51 | 6 | 18 |
| SEA-009 | 61 | 6 | 18 |
| SEA-010 | 81 | 6 | 18 |
| SEA-001 | 501 | 6 | 18 |
| SEA-017 | 511 | 6 | 18 |
| SEA-003 | 521 | 6 | 18 |
| SEA-006 | 531 | 6 | 18 |
| SEA-010 | 541 | 6 | 18 |
| SEA-006 | BINZ_SO_01 | 6 | 23 |
| SEA-006 | BUG_SW_01 | 6 | 21 |
| SEA-005 | DARSS_MUL_01 | 6 | 23 |
| SEA-001 | DK007 | 6 | 24 |
| SEA-006 | DK008 | 6 | 18 |
| SEA-006 | DK009 | 6 | 18 |
| SEA-013 | EST001 | 6 | 16 |
| SEA-011 | EST002 | 6 | 15 |
| SEA-013 | EST003 | 6 | 16 |
| SEA-013 | EST004 | 6 | 16 |
| SEA-011 | EST005 | 6 | 16 |
| SEA-013 | EST006 | 6 | 16 |
| SEA-012 | EST007 | 6 | 15 |
| SEA-011 | EST008 | 6 | 16 |
| SEA-013 | EST009 | 6 | 16 |
| SEA-012 | EST010 | 6 | 16 |
| SEA-004 | FEHM_GRU_01 | 6 | 21 |
| SEA-004 | FEHM_KRU_01 | 6 | 20 |
| SEA-004 | FEHM_WAL_01 | 6 | 20 |
| SEA-014 | FI0001 | 6 | 17 |
| SEA-013 | FI0002 | 6 | 13 |
| SEA-013 | FI0003 | 6 | 13 |
| SEA-014 | FI0004 | 6 | 18 |
| SEA-014 | FI0005 | 6 | 18 |
| SEA-014 | FI0006 | 5 | 16 |
| SEA-015 | FI0008 | 6 | 14 |
| SEA-015 | FI0009 | 6 | 14 |
| SEA-013 | FI0010 | 6 | 21 |
| SEA-014 | FI0011 | 6 | 15 |
| SEA-017 | FI0012 | 6 | 17 |
| SEA-017 | FI0013 | 6 | 17 |
| SEA-014 | FI0014 | 6 | 20 |
| SEA-006 | GOHREN_NP_01 | 6 | 23 |
| SEA-005 | KAGSDF_RS_01 | 6 | 19 |
| SEA-006 | KLZICKER_OL_01 | 6 | 22 |
| SEA-006 | LUBMIN_FRS_01 | 5 | 18 |
| SEA-006 | NOBBIN_HG_01 | 6 | 22 |
| SEA-009 | PL0001 | 6 | 22 |
| SEA-007 | PL0002 | 6 | 24 |
| SEA-007 | PL0003 | 6 | 24 |
| SEA-008 | PL0004 | 6 | 24 |
| SEA-008 | PL0005 | 6 | 24 |
| SEA-008 | PL0006 | 6 | 24 |
| SEA-008 | PL0007 | 6 | 24 |
| SEA-007 | PL0008 | 6 | 24 |
| SEA-008 | PL0009 | 6 | 24 |
| SEA-007 | PL0010 | 6 | 24 |
| SEA-009 | PL0011 | 6 | 22 |
| SEA-008 | PL0012 | 6 | 23 |
| SEA-007 | PL0013 | 6 | 23 |
| SEA-007 | PL0014 | 6 | 24 |
| SEA-007 | PL0015 | 6 | 23 |
| SEA-005 | POEL_GOL_01 | 6 | 21 |
| SEA-005 | ROSENHGN_HBA_01 | 6 | 23 |
| SEA-005 | STEINBECK_KLH_01 | 6 | 23 |
| SEA-007 | USEDOM_PE_01 | 5 | 18 |
| SEA-006 | VARNKEVZ_HL_01 | 6 | 23 |
| SEA-006 | VILM_WS_01 | 6 | 20 |
| SEA-005 | WIESCHNDF_HUK_02 | 6 | 23 |
| SEA-006 | ZINGST_KIR_01 | 6 | 21 |
| SEA-006 | ZINGST_WAS_01 | 6 | 23 |
R52 Organic food waste, R53 Chemicals, R54 Snuff, R98 Micro- and mesolitter, R99 Other organic waste. R23 Cigarette butts are excluded from the analysis from Estonia and Latvia for all years, and for Sweden and Finland for the period 2016-2019 (see also 9.2 Methodology applied). The litter included in the SUP and FRL groups respectively are those where all aggregated litter items are considered to belong to the respective group in the Joint list, e.g., R4 is included because all litter within R4 is considered SUP items. R2 is not included as plastic dog/cat faeces bags are not a SUP item according to the Joint list.
Figure 2.3. Beaches considered but not included in the trend assessment due to not meeting the criteria. Total number of beaches=30, total number of surveys=58.
| Sub-basin | Beach code | Number of years | Number of surveys | |
|---|---|---|---|---|
| SEA-009 | LV0001 | 2 | 2 | |
| SEA-009 | LV0002 | 2 | 2 | |
| SEA-009 | LV0003 | 2 | 2 | |
| SEA-009 | LV0004 | 2 | 2 | |
| SEA-009 | LV0005 | 2 | 2 | |
| SEA-009 | LV0007 | 2 | 2 | |
| SEA-009 | LV0009 | 2 | 2 | |
| SEA-009 | LV0012 | 2 | 2 | |
| SEA-011 | LV0014 | 2 | 2 | |
| SEA-011 | LV0016 | 2 | 2 | |
| SEA-011 | LV0017 | 2 | 2 | |
| SEA-011 | LV0018 | 2 | 2 | |
| SEA-011 | LV0020 | 2 | 2 | |
| SEA-011 | LV0021 | 2 | 2 | |
| SEA-011 | LV0022 | 2 | 2 | |
| SEA-011 | LV0025 | 2 | 2 | |
| SEA-011 | LV0026 | 2 | 2 | |
| SEA-011 | LV0027 | 2 | 2 | |
| SEA-011 | LV0028 | 2 | 2 | |
| SEA-011 | LV0029 | 2 | 2 | |
| SEA-011 | LV0033 | 2 | 2 | |
| SEA-011 | LV0034 | 2 | 2 | |
| SEA-011 | LV0035 | 2 | 2 | |
| SEA-011 | LV0037 | 2 | 2 | |
| SEA-011 | LV0038 | 2 | 2 | |
| SEA-009 | LV0039 | 2 | 2 | |
| SEA-011 | LV0040 | 2 | 2 | |
| SEA-009 | LV0042 | 1 | 1 | |
| SEA-011 | LV0043 | 2 | 2 | |
| SEA-011 | LV0044 | 1 | 1 |
Appendix 3
Table 3.1. The table shows the aggregations of J-codes (Fleet et al, 2021) into common litter categories, which was necessary to be able to carry out the status assessment on this level of details. HELCOM Reporting codes included as single-use plastic (SUP) or fisheries related litter (FRL) – is also displayed.
| Materials | Common name | HELCOM Reporting ID | Aggregated litter codes from the ”Joint list” | SUP | FRL |
|---|---|---|---|---|---|
| Plastic | Plastic six-pack rings | R1 | J1 | X | |
| Plastic bags | R2 | J3, J5, J101 | |||
| Plastic bottles | R3 | J7, J8, J9, J11, J12, J13 | |||
| Plastic packaging for food and bevarage | R4 | J30, J31, J224, J225, J226, J227 | X | ||
| Larger plastic containers | R5 | J14, J15, J16, J18, J65 | |||
| Plastic caps and lids | R6 | J21, J22, J23, J24 | |||
| Plastic toys and party poppers | R7 | J32 | |||
| Plastic plastes, cutlery, straws and stirrers | R8 | J228, J229, J230, J231 | X | ||
| Mesh bags | R9 | J238 | |||
| Plastic syringes | R10 | J99 | |||
| Plastic gloves (household/gardning) | R11 | J40 | |||
| Plastic gloves (professional use) | R12 | J41 | |||
| Plastic tags | R13 | J43 | |||
| Plastic pieces of nets | R14 | J53, J54, J234 | X | ||
| Various fishing gear | R15 | J42, J44, J45, J46, J47, J57, J58, J60, J61 | X | ||
| Rope, string and cords | R16 | J49, J232, J233, J235, J242 | X | ||
| Plastic fishing line | R17 | J59 | X | ||
| Floats and buoys | R18 | J62, J63 | |||
| Plastic strapping bands | R19 | J66 | |||
| Plastic sheets | R20 | J67, J220 | |||
| Fibre glass items | R21 | J68 | |||
| Plastic cigarette lighters | R22 | J26 | |||
| Cigarett butts with filters | R23 | J27 | X | ||
| Various plastic fragments >2,5 cm | R24 | J79, J80, J82, J83, J239, J256, J257 | |||
| Other identifiable plastic litter items | R25 | J17, J19, J25, J28, J29, J36, J64, J69, J70, J72, J84, J85, J86, J87, J88, J89, J90, J91, J92, J93, J100, J102, J136, J166, J211, J221, J222, J223, J240, J241, J243, J252, J253 | |||
| Rubber | Rubber tyres and belts | R26 | J249, J251 | ||
| Rubber condoms | R27 | J133 | |||
| Other rubber items | R28 | J125, J126, J127, J131, J134, J248, J250 | |||
| Textile | Personal clothing items, mixed materials | R29 | J137, J138 | ||
| Cloth textile carpet & furnishing | R30 | J141 | |||
| Hessian sacks/packaging | R31 | J140 | |||
| Other textiles | R32 | J139, J143, J145 | |||
| Paper | Paper excluding newspaper and magazines | R33 | J147, J148, J150, J151, J152, J155, J156, J158, J244, J245, J247 | ||
| Newspapers & magazines | R34 | J154 | |||
| Wood | Wooden corks | R35 | J159 | ||
| Wooden pallets/boxes | R36 | J160, J162, J164 | |||
| Wooden crab/lobster pots | R37 | J163 | |||
| Wooden ice-cream sticks, chip forks, chopsticks, toothpicks | R38 | J165 | |||
| Other wooden items | R39 | J167, J171, J172 | |||
| Metal | Metal bottle caps, lids & pull tabs from cans | R40 | J178 | ||
| Metal foil wrappers, aluminium foil | R41 | J177 | |||
| Wire, wire mesh, barbed wire | R42 | J191 | |||
| Metal drinks cans | R43 | J175 | |||
| Metal drums, barrels, and paint tins | R44 | J187, J190 | |||
| Metal fisheries accessories and lobster/crab pots | R45 | J182, J184 | |||
| Metal disposable BBQs | R46 | J179 | |||
| Other metal items and pieces | R47 | J130, J174, J176, J180, J181, J186, J188, J193, J194, J195, J198, J199 | |||
| Glass | Glass light bulbs and tubes | R48 | J202, J205 | ||
| Glass ceramic construction materials (bricks, tiles, cement) | R49 | J204 | |||
| Other glass and ceramics | R50 | J200, J201, J203, J207, J208, J210, J219 | |||
| Sanitary and medical items | Sanitary and medical items, mixed materials | R51 | J95, J96, J97, J98, J144, J236, J237, J246 | ||
| Organics | Organics | R52 | J215 | ||
| Snuff | R54 | ||||
| Chemicals | Chemicals | R53 | J216, J217, J218 | ||
| Various materials | Various litter, mixed materials | R55 | |||
| Excluded | Micro- and mesolitter | R98 | |||
| Organic waste not food or snuff | R99 |
R52 Organic food waste, R53 Chemicals, R54 Snuff, R98 Micro- and mesolitter, R99 Other organic waste, are excluded from the analyses. R23 Cigarette butts are excluded from Estonia and Latvia for all years, and for Sweden and Finland for the period 2016-2019 (see also 9.2 Methodology applied). The litter included in the SUP and FRL groups respectively are those where all aggregated litter items are considered to belong to the respective group in the Joint list, e.g., R4 is included because all litter within R4 is considered SUP items. R2 is not included as plastic dog/cat faeces bags are not a SUP item according to the Joint list.