 Breeding success of waterbirds
2 Relevance of the indicator
2.1 Ecological relevance
Waterbirds are an integral part of the Baltic marine ecosystem. They are predators of fish and macroinvertebrates, scavengers of carcasses and fishery discards and herbivores of littoral vegetation. They can be assigned to functional species groups, meaning that they take (feed on) different prey types from different compartments of the marine environment. Most species are specialized on certain species and / or size classes of prey.
As waterbirds are long-lived species with delayed maturity, changes in their breeding success are expected to reflect changes in environmental conditions long before environmental changes are evident in population size. Breeding success is one of the demographic determinants of population growth rate. Therefore, results of this evaluation should be viewed as an early warning of changes in population status, and thus complement the evaluation of waterbird abundance. At the same time, annual breeding success of marine birds is a sensitive indicator of the ability of marine ecosystems to support higher trophic levels that feed on key lower trophic level production.
Further, the indicator could also provide evidence of other impacts, from climate change, human disturbance, or predation by invasive species, as well as natural factors such as prey-fish availability (though this is also often influenced by human activities) and predation / disturbance from native predators (e.g. white-tailed eagle and red fox). Distinguishing between natural and anthropogenic effects on breeding performance is challenging and not always possible, however key trends in this parameter are vital in building a broad picture and evaluation of waterbird status as a whole.
As they are predators at, or close to, the top of the food web, some waterbirds accumulate contaminants and their numbers, and more clearly their breeding success, may indicate the degree of contamination which the species are exposed to. Moreover, several waterbird species are predated by white-tailed eagles, transferring the loads of contaminants to a higher level in the food web. Therefore, low breeding success may also indicate that contaminant loads are too high and information on this topic provides critical understanding at the ecosystem level.
2.2 Policy relevance
Policy relevance is a critical component of the HELCOM indicators, for example: the Baltic Sea Action Plan (BSAP), the EU Marine Strategy Framework Directive (MSFD) and the UN Sustainable Development Goals (SDGs). The table below (Table 1) provides a simplified interlinkage between key policies and their relevance to this indicator.
Table 1. Policy relevance of this specific HELCOM indicator.
| Baltic Sea Action Plan (BSAP) | Marine Strategy Framework Directive (MSFD) | |
| Fundamental link | Segment: Biodiversity
Goal: “Baltic Sea ecosystem is healthy and resilient”
|
Descriptor 1 Species groups of birds, mammals, reptiles, fish and cephalopods
|
| Complementary link | Segment: Eutrophication
Goal: “Baltic Sea unaffected by eutrophication”
Segment: Hazardous substances and litter Goal: “Baltic Sea unaffected by hazardous substances and litter”
Segment: Sea-based activities Goal: “Environmentally sustainable sea-based activities”
|
Descriptor 1 Species groups of birds, mammals, reptiles, fish and cephalopods
Descriptor 4 Ecosystems, including food webs
|
| Other relevant legislation: | EU Birds Directive (migrating species Article 4 (2); barnacle goose, pied avocet, Mediterranean gull, Caspian tern, sandwich tern, common tern, Arctic tern, little tern listed in Annex I)
Birds Directive Article 12 report, parameter “Population trend”; Agreement on the Conservation of African-Eurasian Migratory Waterbirds (AEWA); UN Sustainable Development Goal 14. |
|
The indicator on breeding success of waterbirds addresses the Baltic Sea Action Plan (BSAP) Biodiversity and nature conservation segment’s ecological objectives ‘Thriving and balanced communities of plants and animals’ and ‘Viable populations of species’ as well as the eutrophication segment’s ecological objective ‘Natural distribution and occurrence of plants and animals’.
The candidate indicator is relevant to the following action of the 2013 HELCOM Ministerial Declaration:
- 4 (B). WE DECIDE to protect seabirds in the Baltic Sea, taking into consideration migratory species and need for co-operation with other regions through conventions and institutions such as the Agreement on Conservation of African Eurasian Migratory Waterbirds (AEWA) under the Convention on Migratory Species (CMS), and particularly in the North Sea (OSPAR) and Arctic (Arctic Council) areas.
And the following action from the 2018 HELCOM Ministerial Declaration:
- 43. WE COMMIT to increasing the protection and restoration of biodiversity, to intensifying regional, subregional and cross-sectoral cooperation, and to preserving and promoting the ecological balance of the Baltic Sea area with strengthened resilience, also as streamlined response to adaptation needs stemming from human-induced climate change;
The indicator also directly or indirectly addresses the following qualitative descriptors of the MSFD for determining good environmental status (European Commission 2008):
Descriptor 1: ‘Biological diversity is maintained. The quality and occurrence of habitats and the distribution and abundance of species are in line with prevailing physiographic, geographic and climatic conditions’;
Descriptor 4: ‘All elements of the marine food webs, to the extent that they are known, occur at normal abundance and diversity and levels capable of ensuring the long-term abundance of the species and the retention of their full reproductive capacity’.
and the following criteria of the Commission Decision (European Commission 2017):
- Criterion D1C2 (population abundance)
- Criterion D1C3 (population demographic characteristics)
- Criterion D1C4 (species distribution)
- Criterion D1C5 (habitat for the species)
- Criterion D4C1 (diversity of trophic guild)
- Criterion D4C2 (balance of total abundance between trophic guilds)
- Criterion D4C4 (productivity of trophic guild)
The EU Birds Directive (a) lists in Annex 1 barnacle goose, pied avocet, dunlin (Baltic subspecies Calidris alpina schinzii), Caspian tern, sandwich tern, common tern, Arctic tern and little tern as subject of special conservation measures and (b) generally covers all migratory species and they have to be reported (European Commission 2010). Thus, all species included in the concept of the indicator are also covered by the EU Birds Directive, which requires conservation of habitats in a way that allows birds to breed, moult, stage during migration and spend the winter.
Furthermore, the Baltic Sea is located in the agreement area of the Agreement on the Conservation of African-Eurasian Migratory Waterbirds (AEWA). Contracting Parties (all HELCOM member countries are signatories except Poland and Russia) are obliged to undertake measures warranting the conservation of migratory waterbirds and their habitats.
The goals of the BSAP, EU MSFD, AEWA and EU Birds Directive are closely aligned and the data needed for the indicator are partly the same as needed for reporting within the framework of the EU Birds Directive.
In order to protect migrating birds in the Baltic Sea region, HELCOM has adopted the Recommendation 34/E-1 ‘Safeguarding important bird habitats and migration routes in the Baltic Sea from negative effects of wind and wave energy production at sea’. Since some species included in the concept of the indicator are vulnerable to habitat loss caused by wind farms and access to feeding areas of breeding birds may be blocked by wind farms, while others are prone to collisions (e.g., Masden et al. 2010, Furness et al. 2013, Bradbury et al. 2014), the indicator is linked to the intentions of the recommendation.
The indicator supports the UN Sustainable Development Goal 14: Conserve and sustainably use the oceans, sea and marine resources for sustainable development.
2.3 Relevance for other assessments
In general, the results of this indicator can be used for HELCOM integrated assessments (i.e. the BEAT integrated assessment tool), for example once the indicator has been further developed to include a larger spatial spread and potentially other relevant species. For HOLAS 3, only one assessment could be conducted, the breeding success of the common guillemot at Stora Karlsö in the Baltic Sea subdivision Gotland Group.
In future integrated assessment, because of its high informative value concerning the state of the marine environment it is recommended to weight this indicator equally with the two MSFD primary criteria for birds – abundance and by-catch (Dierschke et al. 2021, European Commission 2022).
3 Threshold values
3.1 Setting the threshold value(s)
Breeding success is a measure of how successful reproduction of marine birds is in a given breeding season. It is used in this indicator for investigating how observed levels of breeding success may affect the rate of future population growth (increase or decline). Population growth rate is defined as the factor by which the population grows per year (the ratio of population size in one year to population size in the previous year t). This is also known as the finite growth rate and often denoted using the Greek letter λ (lambda). A stable population has a growth rate of 1, a growing or increasing population has a growth rate of greater than 1 and a declining population has a growth rate of less than 1.
A threshold is set uniquely for each species to define the growth rate which, if sustained, would lead to a decline in population size of ≥ 30% over three generations, which is consistent with the IUCN red-listing criteria for species that are ‘Vulnerable’ (IUCN 2012). A species classified as Vulnerable can be regarded as not being in good status, because it can be considered facing a high risk of extinction in the wild (IUCN 2012).
Generation time is calculated for each species using the population models used to calculate population growth rate. Generation time is then used in a simple equation to calculate the threshold population growth rate equivalent to a 30% decline in population size over three generations.
![]()
where GT = generation time and 𝑇𝐼𝑈𝐶𝑁 = IUCN threshold value for Vulnerable species (i.e. 0.3). The threshold for population growth rate will vary between species and potentially between regions because of differences in generation time.
The logic behind this threshold setting is that a species cannot be in good status if the observed rate of breeding success threatens the population (Figure 2). Problems in the environment acting on the breeding success can be detected immediately, therefore this indicator can serve as an early-warning system. It can be predicted whether a species is threatened or not under the given conditions and the respective breeding success.
There is a clear link between the method to set threshold values for this indicator and the policy relevance of the indicator:
The Baltic Sea Action Plan aspires to ensure viable populations of the species as well as thriving and balanced communities of plants and animals. Both objectives can only be achieved if species are not declining to a degree leading to being threatened. Sufficient breeding success is a crucial component for a viable population.
Furthermore, the threshold is strongly linked to the MSFD, because the biodiversity criterion D1C3 states that the population demographic characteristics of the species are indicative of a healthy population which is not adversely affected due to anthropogenic pressures (Commission Decision 2017/848). Breeding success is a crucial population demographic characteristic, and as breeding success is often linked to anthropogenic pressures such as extraction of species (i.e., influencing the food supply of waterbirds) and disturbance, it is well suited to assess the status of a species.
The threshold value for the example species included in this evaluation conducted for HOLAS 3 is an annual population growth rate (λT) of 0.995 for the common guillemot in Gotland Group.
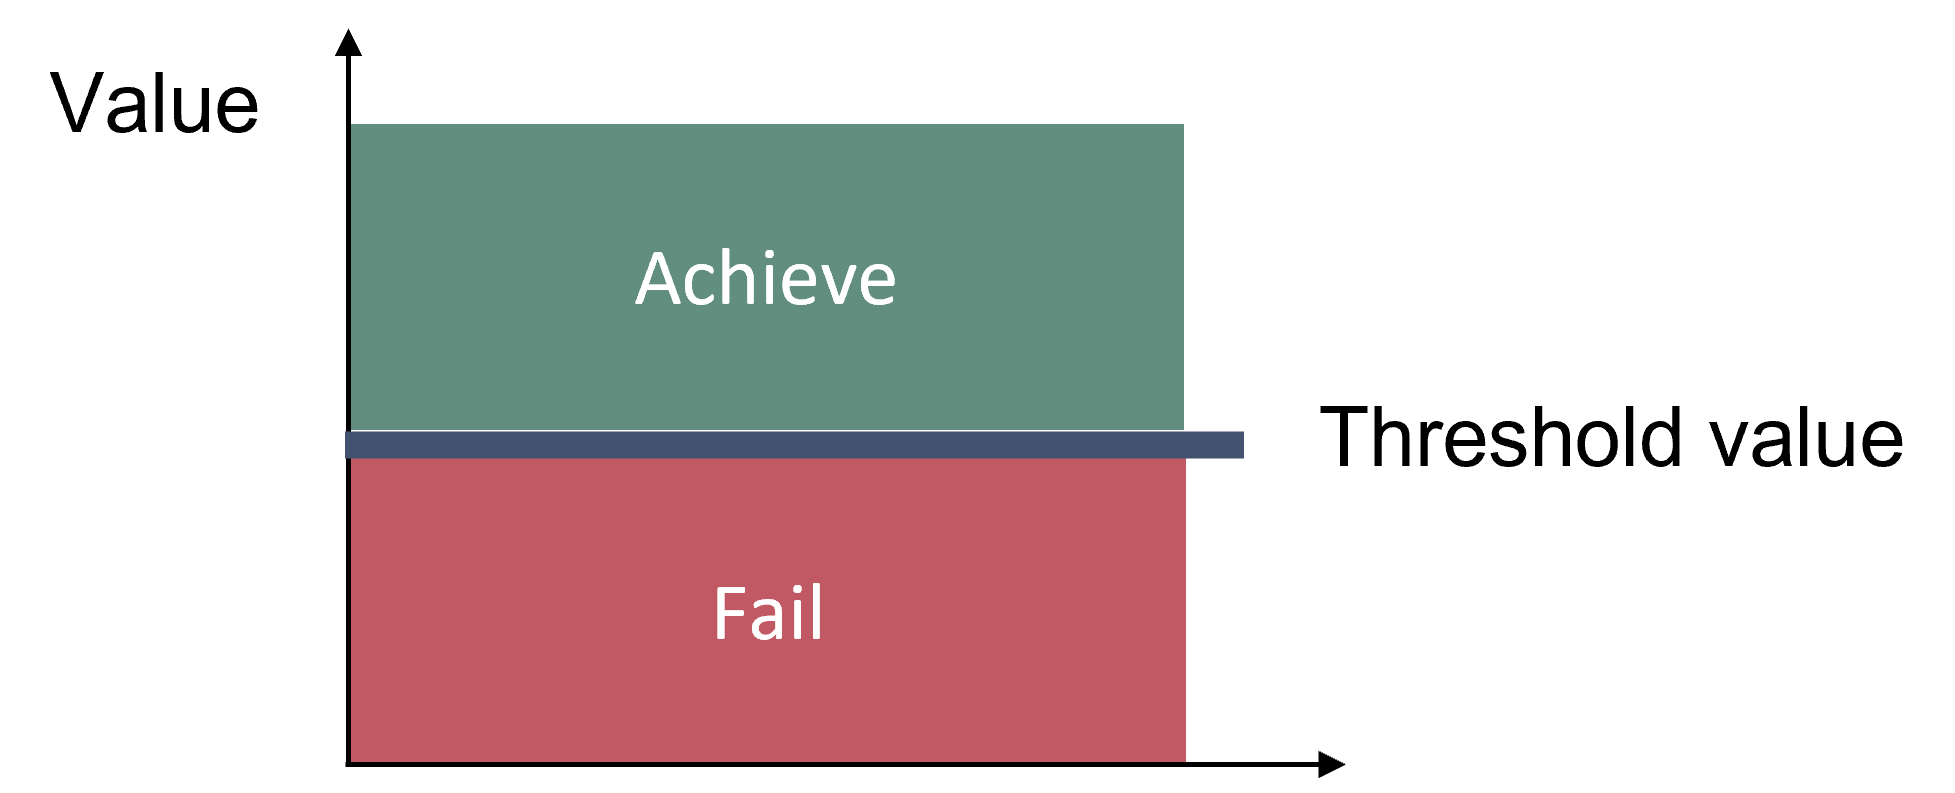
Figure 2. Schematic representation of the threshold value applied in the ‘Breeding success of waterbirds’ candidate indicator. The threshold value is species-specific. In the only species evaluation of this indicator, the threshold value is an annual population growth rate (λT) of 0.995 for the common guillemot in Gotland Group.
4 Results and discussion
4.1 Status evaluation
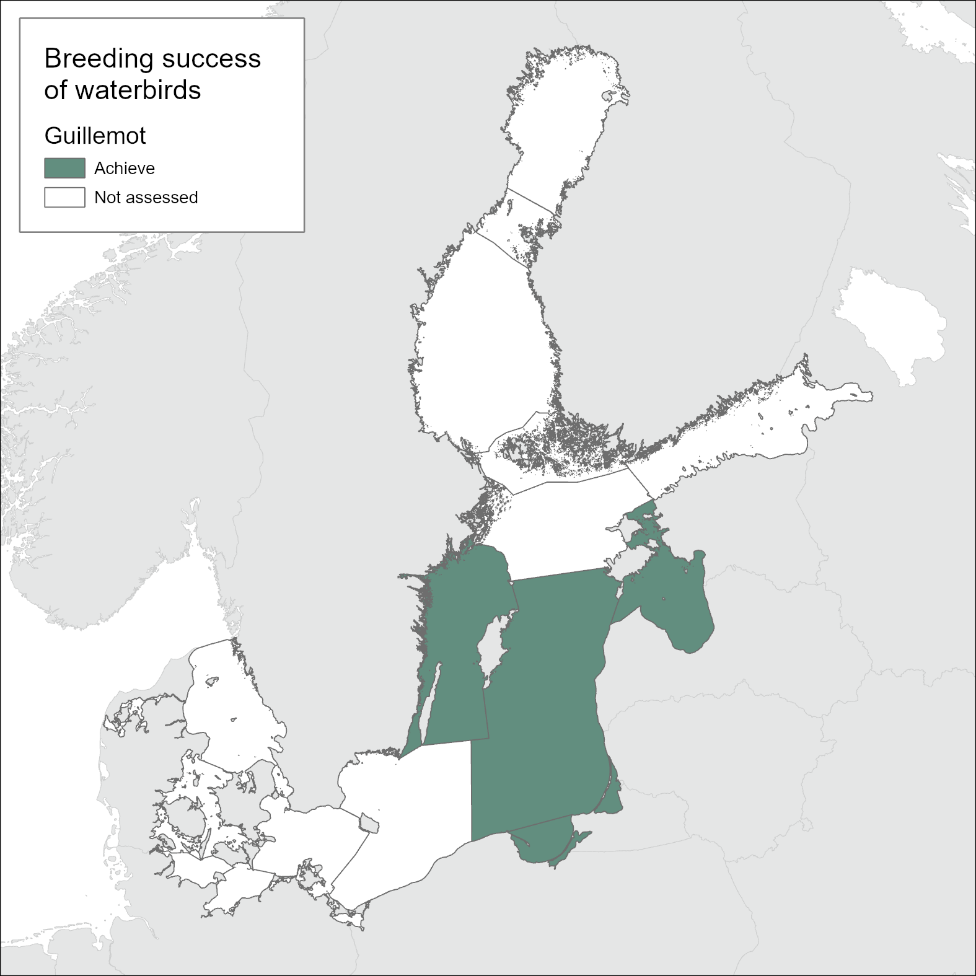
In this assessment, the indicator is applied to one species, the common guillemot, in one subdivision of the Baltic Sea, the Gotland Group. Data were used only from the breeding colony at Stora Karlsö, SW of Gotland, which is the largest colony of this species in the Baltic Sea.
The population model for common guillemots breeding at Stora Karlsö gave a generation time of 24.8 years, i.e. three generations are equal to 74.4 years. Further, the annual population growth rate leading to a decline of 30% in population size over three generations (λT) is 0.995.
The six-year mean of breeding success across the assessment period 2016-2021 was 0.705 fledged chicks per breeding pair. Introducing this observed value into the population model, the expected annual population growth rate is 1.072 (Figure 3). Therefore, the threshold value is achieved, indicating that the common guillemot population at Stora Karlsö is in good status.
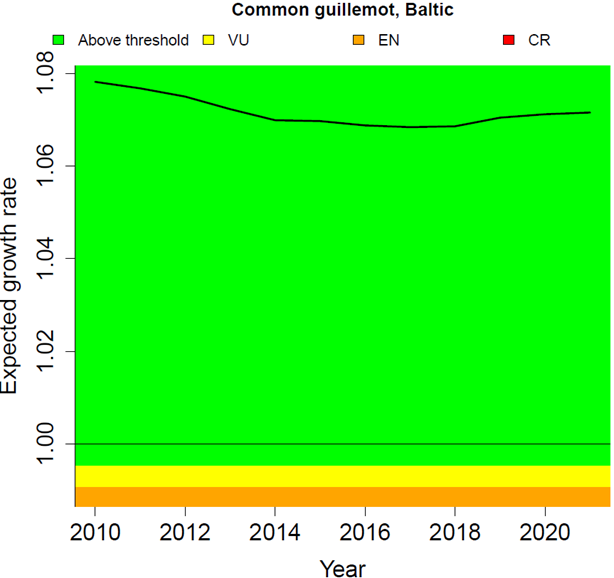
Figure 3. Expected annual population growth rate of common guillemot at Stora Karlsö in the Baltic Sea subdivision Gotland Group, 2010-2021 (black line). The colour-coded background shows the threshold values; values in the green zone indicate the threshold is achieved, whereas values in the other zones are below and indicate the threshold has been failed. For illustration, the figure also shows a breakdown for the corresponding IUCN red list categories of Vulnerable (VU, 30% decline over three generation, λ = 0.995), Endangered (EN, 50% decline, λ = 0.991) and Critically Endangered (CR, 80% decline, λ = 0.979, not shown because out of range). The indicator value (the value for 2021 on the black line) is 1.072, which is well above the threshold value of 0.995.
4.2 Trends
Data for annual breeding success of common guillemots at Stora Karlsö were made available for the years 2005 to 2021. From 2005 to 2016, breeding success slightly declined, but then increased again (Figure 4). This pattern is also visible in the expected population growth rates calculated from 2010 onwards based on six-year running means of breeding success: A slight decline was followed by an increase (Figure 3). During the entire period the expected growth rate kept well above the threshold value (λT = 0.995) and also above the value of 1 which indicates a stable population.
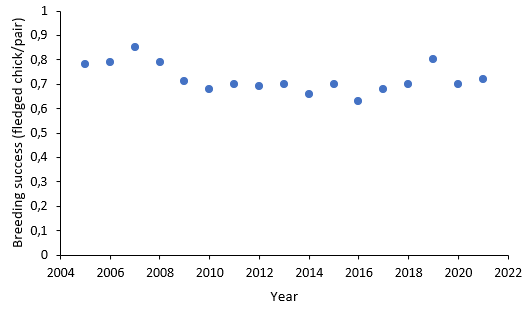
Figure 4. Annual breeding success of common guillemot at Stora Karlsö in the Baltic Sea subdivision Gotland Group, 2010-2021.
No prior evaluation has been applied for this indicator therefore it is not possible to directly compare status between separate assessment periods. Based on the trend evaluation presented above it would be expected that no change in status category has occurred between HOLAS II (2011-2016) and HOLAS 3 (2016-2021), i.e. both periods would achieve the threshold value and be in GES.
4.3 Discussion text
Using the long-term data available from common guillemots breeding at Stora Karlsö, the breeding success indicator developed by the OSPAR/HELCOM/ICES Joint Working Group on Marine Birds (ICES 2020) was applied to waterbirds in the Baltic Sea for the first time. The indicator shows whether or not the marine environment surrounding breeding colonies of waterbirds supports provisioning of offspring in a quantity that allows for a viable population
The indicator value, i.e. the annual population growth rate of common guillemots derived from the breeding success in the years 2016-2021 is 1.072, which is well above the threshold value of 0.995 and corresponds to an expected population size increase of 7.2% per year, i.e. the population doubles in size every 10 years. Current levels of breeding success in common guillemots are thus sufficient to prevent the population from declining towards extinction. Model output indicates that with the mean levels of survival inferred for the study period, a breeding success of only 0.21 fledged chicks/pair would be required to hold the population stable, while actually an average of 0.71 fledged chicks/pair were observed in the assessment period. This population benefits from very high survival rates of young and adult birds due to reduced bycatch in fishing gear, the ban on hunting, fewer oil spills, and decreasing concentrations of contaminants (Olsson & Hentati-Sundberg 2017). Therefore, the population can be expected to continue increasing until density effects come into play or mortality increases. Changes in the food web, for example improved species composition and size structuring of fish communities, though beneficial for ecosystem function on a broader level and beneficial for achieving GES for fish evaluations, may also reduce or influence the currently observed population growth.
There is no doubt that the common guillemot population at Stora Karlsö, which comprised 25,000 breeding pairs in 2021, is in good status. However, regarding the status of the environment, to be more precise the marine area used for foraging during the breeding period (waters between southern Gotland and Öland, median distance from the colony of foraging sites is 36.3 km according to at-sea observations by Hentati-Sundberg et al. 2018, but mean distance according to telemetry is only 7.8 km, Evans et al. 2013), the results need to be interpreted with caution. The performance of the common guillemot in the Baltic Sea is closely linked to abundance and body mass of its main prey, the sprat (Österblom et al. 2006). In turn, sprat quantity and quality (in terms of energy content) are dependent on fishing management, i.e. the controlling of stocks of sprat itself and of the cod as the main predator of sprat. Overfishing of cod in the 1980s caused increasing sprat stocks, but also lower sprat body mass (leading to lower fledgling body mass in common guillemots, Österblom et al. 2001). Later on, sprat stocks declined due to fishing, but then increased body mass of sprat allowed common guillemots to fledge with higher body mass and thus in better condition, increasing survival (Österblom et al. 2006). As a consequence, the observed high breeding success of common guillemots reflects the state of the marine environment, which is strongly influenced by fishing management and not necessarily close to a natural state.
5 Confidence
The confidence for the breeding success evaluation of common guillemot in the Baltic Sea subdivision Gotland Group is high.
The population modelling approach including the threshold value is tailored to predict population growth from observed breeding success and other demographic data from literature. This concept was developed and reviewed by an international expert group, the JWGBIRD. Further, the same concept was used for about 50 cases (marine bird populations in four regions of the North-East Atlantic) in the OSPAR Quality Status Report 2023 (indicator B3 Marine Bird Breeding Productivity). In this respect, the evaluation is regarded to be of high confidence.
The confidence of spatial coverage is moderate. Common guillemots (the only species assessed) range widely for food provisioning of their offspring (see section 4.3), but they do not spread over the entire subdivision.
Regarding the temporal coverage of the evaluation the confidence is high, because the entire assessment period of HOLAS 3 (2016-2021) is covered.
6 Drivers, Activities, and Pressures
The breeding success of waterbirds in the Baltic Sea is influenced by a variety of human activities, both directly and indirectly (Table 2). The effects are cumulative, because in addition to pressures existing in the breeding season also pressure during the non-breeding season may be relevant due to carry-over effects.
Table 2. Pressures with relevance to this indicator.
| General | MSFD Annex III, Table 2a | |
| Strong link |
The most important human threats to the breeding success of waterbirds are predation by indigenous and non-indigenous mammals, contamination by hazardous substances, prey depletion and habitat loss, but also by-catch in fishing gear. There is also a strong link to the food web structure and the food quality, which are indirectly influenced by human activities. | Biological pressures:
Physical pressures:
Pressures by substances, litter and energy
|
There is a strong link between waterbird breeding success and food availability. Therefore, human activities influencing the food supply and quality for waterbirds are reflected in breeding success. For fish-eating birds, direct human pressure is posed by the extraction of fish, while physical damage of the seafloor directly affects benthic feeders. On the other hand, overfishing of large predatory fish species increases the abundance of smaller species and thereby improves the food supply for birds. Further, as their reproduction takes place on land, even waterbirds that live at sea during all other times are prone to predation by non-indigenous mammals such as American mink and raccoon dog, which have been introduced by humans and therefore have to be treated as a human pressure. Indirectly, disturbance for example from tourism and recreational boating may increase nest and egg predation when waterbirds are on alert in the air or even leave the breeding site temporarily. Habitat loss due to changes in land use and agriculture may complement to lower breeding success.
Negative impacts on body condition obtained year-round from the accumulation of contaminants ingested via the food web can affect adult birds as well as eggs and chicks.
Breeding success can also be deteriorated if adults during the period chick provisioning during the breeding season, or offspring after fledging (but before recruitment into the breeding population) are by-caught in fishing gear.
7 Climate change and other factors
Global warming has many effects also in the Baltic region (HELCOM & Baltic Earth 2021, Meier et al. 2022). In the case of waterbirds in the Baltic, wintering further north and an earlier return in spring were observed in particular (Vähätalo et al., 2004, Pavón-Jordán et al. 2019). While shorter migration distances could have a favourable effect on body condition and thus possibly also on breeding success, an earlier start of breeding (van der Jeugd et al. 2009) may not be advantageous. Shifting phenology could lead to a mismatch in the timing of food requirement (when offspring provisioning is needed) and food availability, which has been demonstrated for landbirds (Both 2010, Reed et al. 2013).
Earlier loss of sea ice was found to improve pre-breeding body condition of female common eiders, leading to increasing fledging success in offspring (Lehikoinen et al., 2006). On the other hand, algal blooms promoted by higher seawater temperature has in some cases caused low quality in bivalve prey for common eiders, leading more birds to skip breeding (Larsson et al., 2014). Warmer seawater in winter also increases the energy expenditure of mussels, thus directly reducing their quality as prey for eiders (Waldeck & Larsson, 2013).
Most Baltic breeding waterbird species are migratory and affected by climate change also outside the Baltic region when wintering in southern Europe and western Africa (Fox et al. 2015). This is important, given that climate warming is above average also in southern Europe and northern Africa (Allen et al., 2018).
Future scenarios for the Baltic Sea (summarised by Meier et al. 2022) include decreasing salinity. Invertebrate species serving as prey for waterbirds (e.g. blue mussels for common eiders) would change distribution, body size and quality, with consequences for the distribution, reproduction and survival of the respective predatory waterbirds (Fox et al., 2015).
The consequences for piscivorous seabirds are complex, because effects of climate change are not uniform among Baltic Sea fish species. For example, expected increase of recruitment and abundance in an important prey species (sprat; (MacKenzie et al., 2012; Lindegren et al., 2012) as well as declining numbers of large predatory fish (cod) may provide support for fish-eating birds, although management efforts to improve cod stocks may counteract the expected increase in sprat and lead to population declines of their main bird predator, the common guillemot (Kadin et al., 2019). On the other hand, from the bird’s perspective another important prey species (herring) is negatively affected by decreasing salinity (declining energy content; Rajasilta et al., 2018).
In combination with storms, sea level rise would also affect the breeding success of coastal waterbirds due to flooding of their breeding sites (Clausen & Clausen 2014).
Climate change induced changes in the pattern of occurrence of diseases and parasites can be expected to affect waterbirds in the Baltic (Fox et al., 2015).
8 Conclusions
The indicator used to assess the breeding success of waterbirds has proven applicable to the Baltic Sea. For the only constellation that could be considered in HOLAS 3, it has been shown that the breeding success of the common guillemot on Stora Karlsö near Gotland is sufficient to ensure a stable population size. This indicates that the feeding conditions are favourable for this species, accompanied by a favourable situation with regard to predation and other pressures. However, with regard to the state of the Baltic Sea as a whole, the result should be interpreted with caution and in the context of other relevant indicators or assessments, as the current beneficial nutritional conditions are strongly due to overfishing of cod and a resulting good supply of sprat.
8.1 Future work or improvements needed.
It is highly recommended to establish or expand monitoring for the breeding success of waterbirds in the HELCOM region. Better monitoring and data from HELCOM Contract Parties (more species, and temporal and spatial data) would accordingly increase the scope (e.g. include representative species covering other functional groups), quality and effectiveness of the indicator in order to use the potential of such assessments for further species and further subdivisions of the Baltic Sea.
9 Methodology
9.1 Scale of assessment
The indicator relates foraging conditions (for provisioning of offspring) to breeding success. In the Baltic Sea Region, breeding waterbirds have relatively small foraging ranges. On the other hand, the HELCOM sub-basins are relatively small and do not correspond to the exchange of individuals between colonies and thus the connectivity of the different breeding colonies (Evans 2017). Therefore, it appears appropriate to apply the indicator on the level of HELCOM sub-divisions also used in the two bird abundance indicators (the 17 HELCOM sub-basins are aggregated to seven sub-divisions):
- A: Kattegat (Kattegat),
- B: Belt Group (Great Belt, The Sound),
- C: Bornholm Group (Kiel Bay, Bay of Mecklenburg, Arkona Basin, Bornholm Basin),
- D: Gotland Group (Gdansk Basin, Eastern Gotland Basin, Western Gotland Basin, Gulf of Riga),
- E: Åland Group (Northern Baltic Proper, Åland Sea),
- F: Gulf of Finland (Gulf of Finland),
- G: Bothnian Group (Bothnian Sea, The Quark, Bothnian Bay).
This evaluation is only addressing breeding success of common guillemot in the breeding colony at Stora Karlsö, which is located in the HELCOM subbasin Western Gotland Basin. The foraging range of Stora Karlsö common guillemots during the breeding season entirely falls into the marine area between Gotland and Öland, i.e. the HELCOM sub-basin Western Gotland Basin (Evans 2017, Hentati-Sundberg et al. 2018) and consequently into the sub-division Gotland Group.
The HELCOM assessment units applied within the 7 aggregations are HELCOM Scale 2 assessment units, as set out in the HELCOM Monitoring and Assessment Strategy Annex 4.
9.2 Methodology applied
The indicator predicts how observed levels of breeding success may affect the long-term population growth rate of a species. Thresholds are set to indicate when breeding success is low enough to lead to population declines, using IUCN red list criteria to provide context to the magnitude of the predicted declines (see below). The approach uses simple population models for each species that are validated using the trends in breeding abundance from the HELCOM Core Indicator Abundance of waterbirds in the breeding season.
The data requirements are as follows:
Breeding seabird colonies (incl. gulls and terns) and breeding waterbirds (incl. waders) nesting close to the coast and using marine environment (e.g. for food) – counts of breeding pairs (preferably, or failing that – adults) per species per colony per year; and counts of young fledged from a specified number of monitored pairs or nests (preferably or failing that counts of young hatched), per species per colony per year.
These data are used to produce for each species in each sub-division, trends in annual average breeding success from estimates of annual breeding success at each colony that is monitored:
Breeding success per colony = number of young fledged / number of nests (or breeding pairs) monitored
A six-year retrospective running mean of breeding success is used to smooth the trend. These smoothed values are used to calculate the new indicator metric – population growth rate. This metric is defined as the factor by which the population grows per year (the ratio of population size in one year compared to population size in the previous year t). This is also known as the finite growth rate and often denoted using the Greek letter λ (lambda). A stable population has a growth rate of 1, a growing or increasing population has a growth rate of greater than 1 and a declining population has a growth rate of less than 1.
Calculation of the metric: The indicator, for each species, consists of estimates of population growth rate calculated from each six-year running mean of annual mean breeding success in each assessment unit. Below are the steps required to assess the indicator for each species and in each assessment unit:
- Estimate annual mean breeding success (number of chicks fledged per pair), and its standard error. The method takes account of missing data in individual colonies and generates a reproducible time series.
- Calculate a six-year retrospective running mean breeding success (e.g. the value for 2021 is based on the years 2016-2021).
- Construct a simplified baseline demographic matrix model (female-based) for the species. The number of age classes in the model, and the starting values for survival of the different age classes, are based on expert knowledge and/or literature reviews (e.g. Horswill & Robinson 2015). The model assumes that all individuals start to breed at a given age, that breeding success and survival are unchanged after this age (i.e. no senescence), that 90% of all adults attempt to breed each year and thus are included in the estimates of breeding success, and that sex ratio is 1:1.
- Tune the baseline model to the observed abundance trend (D1C2 abundance indicator), for the period with available data. This involves:
- Estimate the mean observed population growth rate for the period by regressing the log-transformed abundance indicator against year, and back-transforming the estimated regression slope.
- Construct a stochastic version of the matrix model (10,000 simulations), by substituting values drawn from normal distributions defined by annual mean breeding success and its standard error into the baseline model, and run it for the period with available data. For each simulation, estimate the stochastic population growth rate.
- Compare observed population growth rate to the simulated mean stochastic growth rate, and adjust values of survival for the different age classes until the two measures of population growth rate are the same. There is no unique solution, and some trial and error is necessary.
- Further tune the baseline model by adjusting breeding success to obtain a stable population (i.e. growth rate = 1). Use matrix algebra to calculate the generation time (i.e. mean age of reproducing females) of the population based on this version.
- Calculate the growth rate corresponding to the IUCN red list thresholds of 30% decline over three generations (using the generation time calculated in the previous step) or 10 years, which indicates a species is Vulnerable (IUCN 2012).
- For seabirds, three generations is always more than 10 years. To derive threshold values of λ (the annual asymptotic growth rate) for a specific species or population, we use the baseline demographic model to assess generation time (Caswell 2001). We then calculate λT as , where GT = generation time and TIUCN = IUCN threshold value for Vulnerable species = 0.3).
- Substitute the values of running mean breeding success into the baseline model, and run it for the period with available data. Calculate for each year the expected (asymptotic) growth rate using matrix algebra. These values represent the expected long-term annual growth rate of the population, if breeding success was maintained at the mean level observed in the most recent six-year period.
- Plot this time series against year, and compare against the threshold as calculated in step 6.
- For species that have a predicted growth rate below the threshold, it can be compared against other thresholds that correspond to other IUCN red-list categories:
EN (endangered): ≥ 50 % decline
CR (critically endangered): ≥ 80 % decline (IUCN 2012)
The thresholds for Endangered and Critically Endangered are calculated as in Step 6 above, by changing values of TIUCN to 0.5 or 0.8, respectively.
9.3 Monitoring and reporting requirements
The basis for assessing the status of waterbirds with this indicator is monitoring of breeding success. Such monitoring can be conducted in breeding colonies or in areas where a sufficient numbers of breeding pairs can be observed. The standard method is to record the number of breeding pairs and the number of fledged offspring, either by observation of individual nests or by recording the total number of fledged offspring per colony or area. There are no HELCOM Monitoring and Assessment Guidelines in place yet, but a detailed description of methods was compiled by Walsh et al. (1995).
The indicator does not need long time series of breeding success (though such data additionally provided context and the possibility to evaluate the topic more clearly). Trends in population size can be derived from the monitoring of breeding populations under the HELCOM core indicator “Abundance of waterbirds in the breeding season”. Demographic data required for the population modelling can be taken from literature or from ongoing projects such as bird ringing. Thus, implementation of suitable monitoring and the potential to expand this indicator are considered viable.
10 Data
The data and resulting data products (e.g. tables, figures and maps) available on the indicator web page can be used freely given that it is used appropriately and the source is cited.
Result: Breeding success of waterbirds
Data: Breeding success of waterbirds
The indicator builds on the following data:
Abundance (breeding population size) data of common guillemot from Stora Karlsö (Sweden).
Breeding success data of common guillemot from Stora Karlsö (Sweden).
Basic demographic data (survival per age class, breeding success, age of first breeding) are taken from literature (Horswill & Robinson 2015).
11 Contributors
Volker Dierschke, Morten Frederiksen, Jonas Hentati-Sundberg, Olaf Olsson
The indicator “Breeding Success of Waterbirds” is led by Germany (responsible expert: Volker Dierschke). It is based on a concept developed by the OSPAR/HELCOM/ICES Joint Working Group on Marine Birds (ICES 2020). The analyses were conducted by Morten Frederiksen (Aarhus University) on behalf of the Swedish Agency for Marine and Water Management. Abundance data from Stora Karlsö were supplied by Jonas Hentati-Sundberg (Swedish University of Agricultural Sciences). Breeding success data were supplied by Olof Olsson (Stockholm University).
HELCOM Secretariat: Jannica Haldin, Owen Rowe
12 Archive
This version of the HELCOM core indicator report was published in April 2023:
The current version of this indicator (including as a PDF) can be found on the HELCOM indicator web page.
This indicator is applied in its first iteration in HOLAS 3, thus no previous version is currently available.
13 References
Allen, M.R., Dube, O.P., Solecki, W., Aragón-Durand, F., Cramer, W., Humphreys, S., Kainuma, M., Kala, J., Mahowald, N., Mulugetta, Y., Perez, R., Wairiu, M., & Zickfeld, K. 2018: Framing and Context. In: Masson-Delmotte, V., Zhai, P., Pörtner, H.-O., Roberts, D., Skea, J., Shukla, P. R., Pirani, A., Moufouma-Okia, W., Péan, C., Pidcock, R., Connors, S., Matthews, J. B. R., Chen, Y., Zhou, X., Gomis, M. I., Lonnoy, E., Maycock, T., Tignor, M., & Waterfield, T. (eds), Global Warming of 1.5°C. An IPCC Special Report on the impacts of global warming of 1.5°C above pre-industrial levels and related global greenhouse gas emission pathways, in the context of strengthening the global response to the threat of climate change, sustainable development, and efforts to eradicate poverty. https://www.ipcc.ch/sr15/chapter/chapter-1/
Both, C. (2010). Food availability, mistiming, and climatic change. In: A.P. Moller, W. Fiedler & P. Berthold (ed), Effects of Climate Change on Birds: pp. 129-147. Oxford University Press, Oxford.
Bradbury, G., Trinder, M., Furness, B., Banks, A.N., Caldow, R.W.G. & Hume, D. (2014). Mapping seabird sensitivity to offshore wind farms. PLOS ONE 9 (9): e106366.
Caswell, H. (2001). Matrix population models: construction, analysis and interpretation. Sunderland, MA: Sinauer.
Clausen, K. K., & Clausen, P. (2014). Forecasting future drowning of coastal waterbird habitats reveals a major conservation concern, Biol. Conserv., 171, 177-185, https://doi.org/10.1016/j.biocon.2014.01.033
Dierschke, V., Kreutle, A., Häubner, N., Magliozzi, C., Bennecke, S., Bergström, L., Borja, A., Boschetti, S.T., Cheilari, A., Connor, D., Haas, F., Hauswirth, M., Koschinski, S., Liquete, C., Olsson, J., Schönberg-Alm, D., Somma, F., Wennhage, H. & Palialexis, A. (2021). Integration methods for Marine Strategy Framework Directive’s biodiversity assessments. – EUR 30656 EN, Publications Office of the European Union, Luxembourg.
European Commission (2008). Directive 2008/56/EC of the European Parliament and the Council establishing a framework for community action in the field of marine environmental policy (Marine Strategy Framework Directive). Off. J. Eur. Union L 164: 19-40.
European Commission (2017). Commission Decision of (EU) 2017/848 of 17 May 2017 laying down criteria and methodological standards on good environmental status of marine waters and specifications and standardized methods for monitoring and assessment, and repealing Decision 2010/477/EU.
European Commission (2022). MSFD CIS Guidance Document No. 19, Article 8 MSFD, May 2022.
Evans, T.J. (2017). Across landscapes and seascapes. The movement ecology of diving and flying guillemots and gulls during breeding. PhD Thesis, Lund University.
Evans, T.J., Kadin, M., Olsson, O. & Åkesson, S. (2013). Foraging behaviour of common murres in the Baltic Sea, recorded by simultaneous attachment of GPS and time-depth recorder devices. Marine Ecology Progress Series 475: 277-289.
Fox, A.D., Jónsson, J. E., Aarvak, T., Bregnballe, T., Christensen, T. K., Clausen, K.K., Clausen, P., Dalby, L., Holm, T.E., Pavón-Jordan, D., Laursen, K., Lehikoinen, A., Lorentsen, S.-H., Møller, A.P., Nordström, M., Öst, M., Söderquist, P., & Roland Therkildsen, O. (2015). Current and Potential Threats to Nordic Duck Populations – A Horizon Scanning Exercise, Annal. Zool., 52, 193-220.
Furness, R.W., Wade, H.M., & Masden, E.A. (2013). Assessing vulnerability of marine bird populations to offshore wind farms. Journal of Environmental Management 119: 56-66.
HELCOM & Baltic Earth 2021. Climate Change in the Baltic Sea (2021). Fact Sheet. Baltic Sea Environment Proceedings 180. https://helcom.fi/baltic-sea-climate-change-fact-sheet-new-publication-shows-latest-scientific-knowledge-on-climate-change-in-the-baltic-sea/
Hentati-Sundberg, J., Evans, T., Österblom, H., Hjelm, J., Larson, N., Bakken, V., Svenson, A. & Olsson, O. (2018). Fish and seabird spatial distribution and abundance at the largest seabird colony in the Baltic Sea. Marine Ornithology 46: 61–68.
Horswill C & Robinson RA (2015). Review of seabird demographic rates and density dependence. JNCC Report 552.
ICES (2020). Joint OSPAR/HELCOM/ICES Working Group on Seabirds (JWGBIRD; outputs from 2019 meeting). ICES Scientific Reports. 2:80. 101 pp. http://doi.org/10.17895/ices.pub.7466
IUCN (2012). IUCN Red List Categories and Criteria: Version 3.1. Second edition. Gland, Switzerland and Cambridge, UK: IUCN. iv + 32 pp.
Kadin, M., Frederiksen, M., Niiranen, S., & Converse, S. J. (2019). Linking demographic and food-web models to understand management trade-offs, Ecology and Evolution 9: 8587-8600. https://doi.org/10.1002/ece3.5385
Larsson, K., Hajdu, S., Kilpi, M., Larsson, R., Leito, A., & Lyngs, P. (2014). Effects of an extensive Prymnesium polylepis bloom on breeding eiders in the Baltic Sea. Journal of Sea Research 88: 21-28.
Lehikoinen, A., Kilpi, M., & Öst, M. (2006). Winter climate affects subsequent breeding success of common eiders. Global Change Biology 12: 1355-1365. https://doi.org/10.1111/j.1365-2486.2006.01162.x
Lindegren, M., Blenckner, T., & Stenseth, N. C. (2012). Nutrient reduction and climate change cause a potential shift from pelagic to benthic pathways in a eutrophic marine ecosystem, Global Change Biol., 18, 3491-3503, https://doi.org/10.1111/j.1365-2486.2012.02799.x
MacKenzie, B. R., Meier, H. E. M., Lindegren, M., Neuenfeldt, S., Eero, M., Blenckner, T., Tomczak, M. T., & Niiranen, S. (2012). Impact of Climate Change on Fish Population Dynamics in the Baltic Sea: A Dynamical Downscaling Investigation. Ambio 41: 626-636. https://doi.org/10.1007/s13280-012-0325-y
Masden, E.A., Haydon, D.T., Fox, A.D. & Furness, R.W. (2010). Barriers to movement: Modelling energetic costs of avoiding marine wind farms among breeding seabirds. Marine Pollution Bulletin 60: 1085-1091.
Meier, H.E.M., Kniebusch, M., Dieterich, C., Gröger, M., Zorita, E., Elmgren, R., Myrberg, K., Ahola, M.P., Bartosova, A., Bonsdorff, E., Börgel, F., Capell, R., Carlén, I., Carlund, T., Carstensen, J., Christensen, O.B., Dierschke, V., Frauen, C., Frederiksen, M., Gaget, E., Galatius, A., Haapala, J.J., Halkka, A., Hugelius, G., Hünicke, B., Jaagus, J., Jüssi, M., Käyhkö, J., Kirchner, N., Kjellström, E., Kulinski, K., Lehmann, A., Lindström, G., May, W., Miller, P.A., Mohrholz, V., Müller-Karulis, B., Pavón-Jordán, D., Quante, M., Reckermann, M., Rutgersson, A., Savchuk, O.P., Stendel, M., Tuomi, L., Viitasalo, M., Weisse R., & Zhang, W. (2022). Climate change in the Baltic Sea region: a summary. Earth System Dynamics 13: 457-593. https://esd.copernicus.org/articles/13/457/2022/
Olsson, O. & Hentati-Sundberg, J. (2017). Population trends and status of four seabird species (Uria aalge, Alca torda, Larus fuscus, Larus argentatus) at Stora Karlsö in the Baltic Sea. Ornis Svecica 27: 64-93.
Österblom, H., Bignert, A., Fransson, T., Olsson, O. (2001). A decrease in fledging body mass in common guillemot Uria aalge chicks in the Baltic Sea. Marine Ecology Progress Series 224: 305–309.
Österblom, H., Casini, M., Olsson, O. & Bignert, A. (2006). Fish, seabirds and trophic cascades in the Baltic Sea. Marine Ecology Progress Series 323: 233-238.
Pavón-Jordán, D., Clausen, P., Dagys, M., Devos, K., Encarnaçao, V., Fox, A. D., Frost, T., Gaudard, C., Hornman, M., Keller, V., Langendoen, T., Ławicki, Ł., Lewis, L. J., Lorentsen, S.-H., Luigujoe, L., Meissner, W., Molina, B., Musil, P., Musilova, Z., Nilsson, L., Paquet, J.-Y., Ridzon, J., Stipniece, A., Teufelbauer, N., Wahl, J., Zenatello, M., & Lehikoinen, A. (2019). Habitat- and species-mediated short- and long-term distributional changes in waterbird abundance linked to variation in European winter weather. Diversity and Distribution 25: 225-239. https://doi.org/10.1111/ddi.12855
Rajasilta, M., Hänninen, J., Laaksonen, L., Laine, P., Suomela, J.-P., Vuorinen, I., & Mäkinen, K. (2018). Influence of environmental conditions, population density, and prey type on the lipid content in Baltic herring (Clupea harengus membras) from the northern Baltic Sea. Canadian Journal of Fisheries and Aquatic Sciences 76: 576-585. https://cdnsciencepub.com/doi/abs/10.1139/cjfas-2017-0504
Reed, T.E., Jenouvrier, S. & Visser, M.E. (2013). Phenological mismatch strongly affects individual fitness but not population demography in a woodland passerine. Journal of Animal Ecology 82: 131-144.
Vähätalo, A. V., Rainio, K., Lehikoinen, A., & Lehikoinen, E. (2004). Spring arrival of birds depends on the North Atlantic Oscillation. Journal of Avian Biology 35: 210-216. https://doi.org/10.1111/j.0908-8857.2004.03199.x, 2004.
van der Jeugd, H. P., Eichhorn, G., Litvin, K. E., Stahl, J., Larsson, K., van der Graaf, A. J., & Drent, R. H. (2009). Keeping up with early springs: rapid range expansion in an avian herbivore incurs a mismatch between reproductive timing and food supply. Global Change Biology 15: 1057-1071. https://doi.org/10.1111/j.1365-2486.2008.01804.x
Waldeck, P., & Larsson, K. (2013). Effects of winter water temperature on mass loss in Baltic blue mussels: Implications for foraging sea ducks. J. Exp. Mar. Biol. Ecol. 444: 24-30. https://doi.org/10.1016/j.jembe.2013.03.007
Walsh, P. M., Halley, D.J., Harris, M.P., del Nevo, A., Sim, I.M.W. & Tasker, M.L. (1995). Seabird monitoring handbook for Britain and Ireland. JNCC / RSPB / ITE / Seabird Group, Peterborough. https://data.jncc.gov.uk/data/bf4516ad-ecde-4831-a2cb-d10d89128497/seabird-monitoring-handbook.pdf
14 Other relevant resources
No additional information or resources are included at this stage.