 Chlorophyll
2. Relevance of the indicator
In the process of eutrophication, algal production and biomass increase as a direct effect of excess nutrient supply. Chlorophyll-a concentration is used as a proxy of phytoplankton biomass.
2.1 Ecological relevance
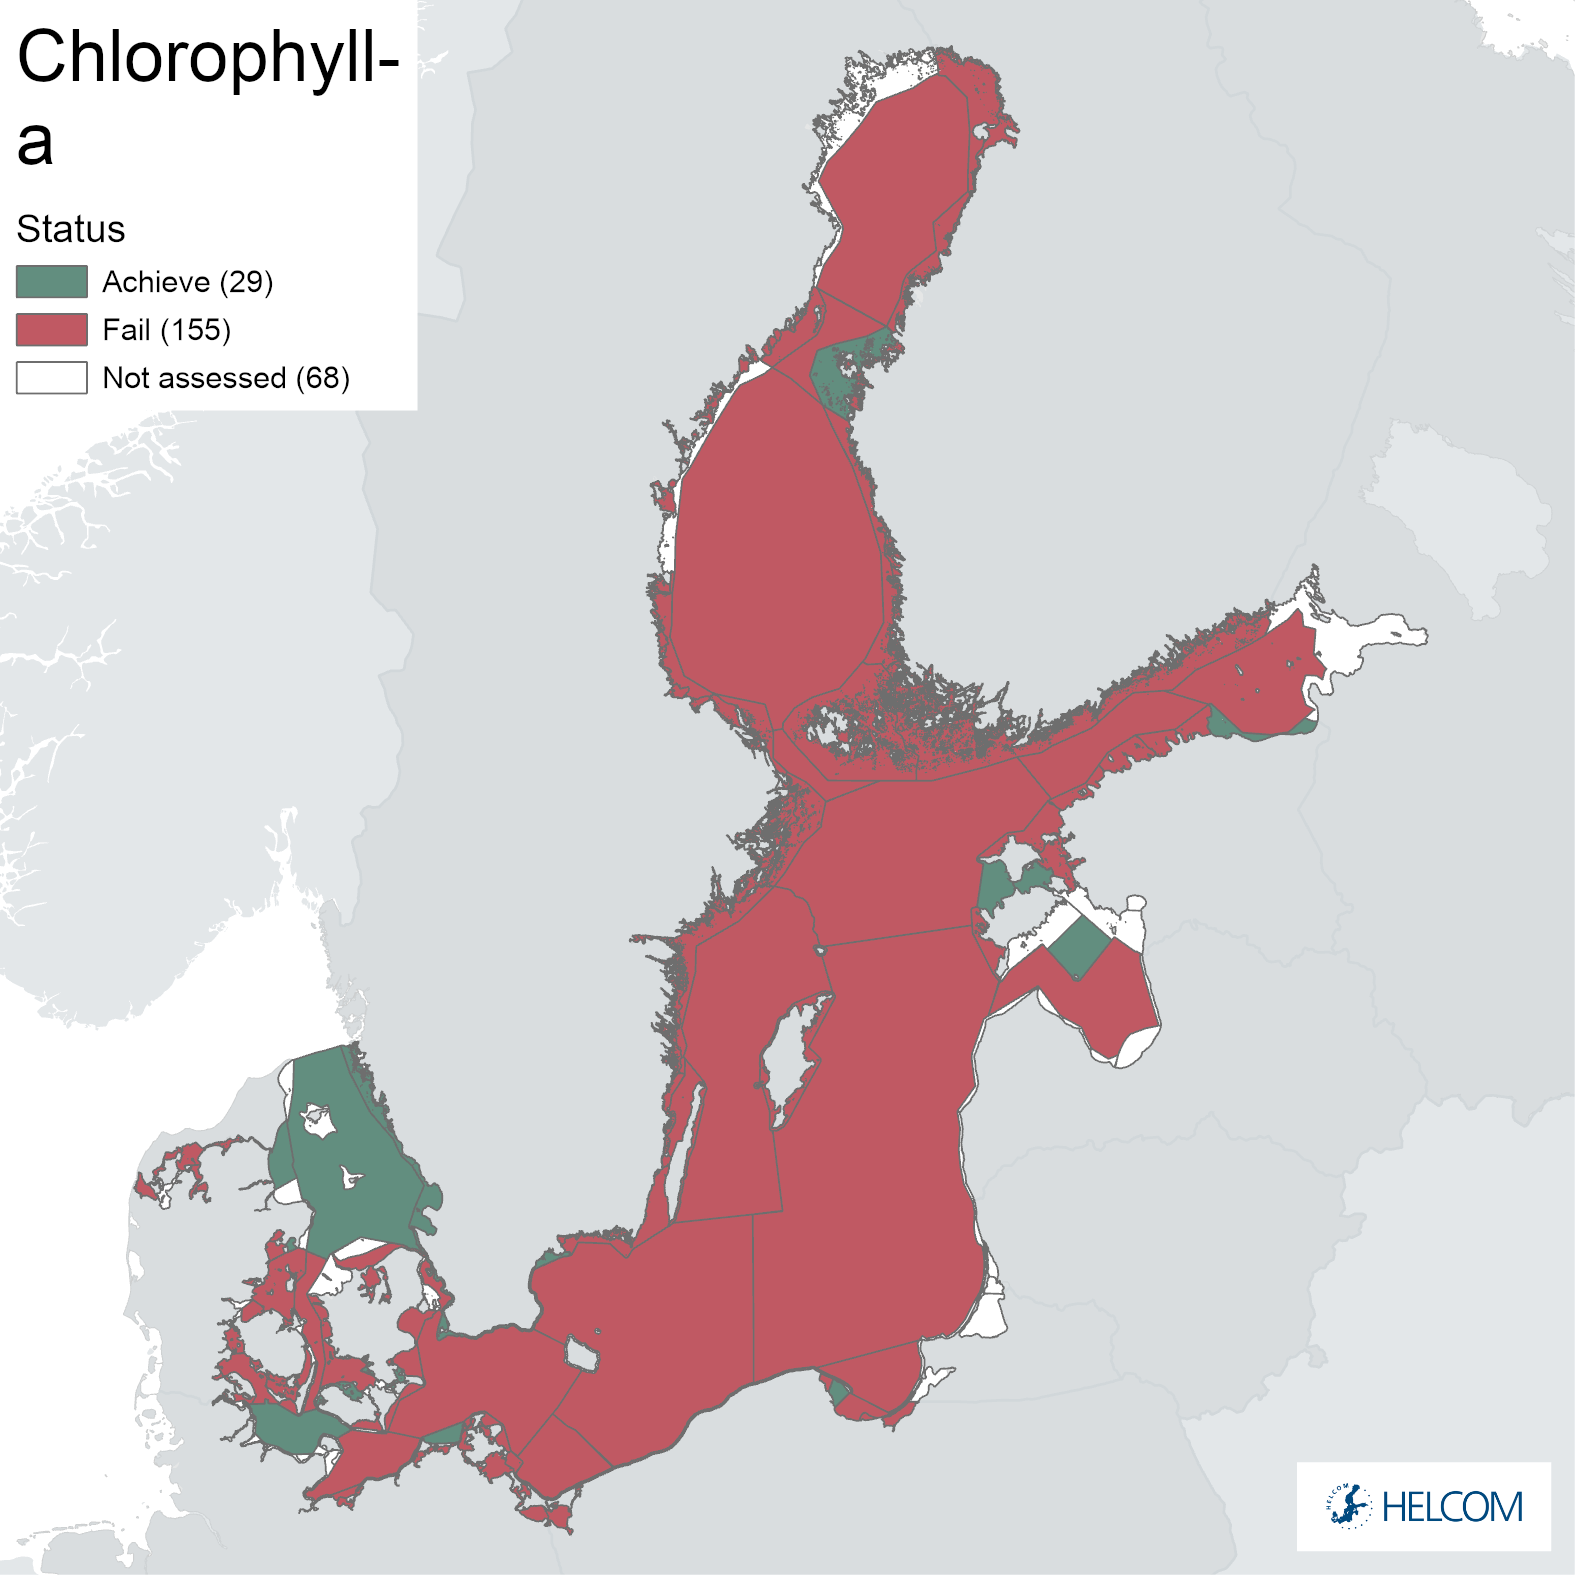
Phytoplankton forms the base of pelagic foodwebs, providing nutrition to higher trophic levels. It naturally blooms in spring and summer as response to elevated light and temperature when nutrients are available. Excess nutrient loads lead to higher phytoplankton growth rates and biomass, which in turn increase the settling of organic matter to the bottom, adding to the oxygen depletion (Figure 2). Transition to hypoxic conditions releases previously accumulated phosphorus from the sediments, supplementing the external nutrient loading (Conley et al. 2002, 2009, Vahtera et al. 2007).
Biotic and abiotic changes, such as climate change and changes in grazing, also affect the phytoplankton biomass.
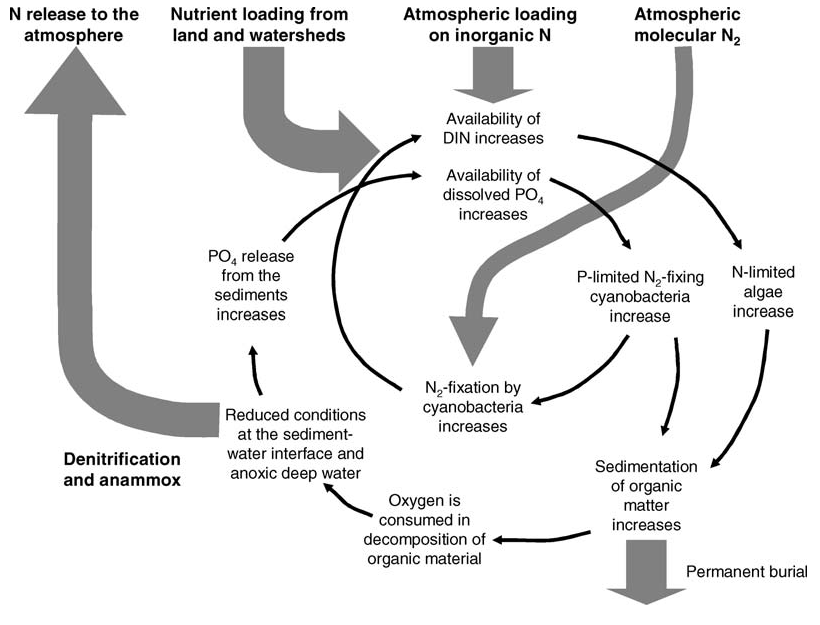
Figure 2. Simplified conceptual model of the vicious circle of eutrophication (from Vahtera et al. 2007).
2.2 Policy relevance
Eutrophication is one of the four thematic segments of the HELCOM Baltic Sea Action Plan (BSAP) with the specific goal of having a Baltic Sea unaffected by eutrophication (HELCOM 2021). The BSAP goal for eutrophication is defined in the BSAP as a condition in an aquatic ecosystem where excessive inputs of nutrients stimulate the growth of algae, which leads to imbalanced functioning of the system. The goal for eutrophication is broken down into five ecological objectives, of which one is “natural level of algal blooms”. Increases in phytoplankton abundance and biomass can be assessed using chlorophyll-a as a proxy.
The EU Marine Strategy Framework Directive (2008/56/EU)) requires that “human-induced eutrophication is minimized, especially adverse effects thereof, such as losses in biodiversity, ecosystem degradation, harmful algal blooms and oxygen deficiency in bottom waters” (Descriptor 5). “Chlorophyll-a in the water column” is listed as a criteria element in MSFD GES Decision ((EU) 2017/848) for assessing the criterion for D5C2 ‘Chlorophyll-a concentrations are not at levels that indicate adverse effects of nutrient enrichment’.
The EU Water Framework Directive (2000/60/EC) requires good ecological status in the European coastal waters. Good ecological status is defined in Annex V of the Water Framework Directive, in terms of the quality of the biological community, the hydromorphological characteristics and the chemical characteristics. Chlorophyll-a is used as a proxy for phytoplankton biomass and as such, it was used in the WFD intercalibration exercise.
Table 1. Eutrophication links to policy.
| Baltic Sea Action Plan (BSAP) | Marine Strategy Framework Directive (MSFD) | |
| Fundamental link | Segment: Eutrophication
Goal: “Baltic Sea unaffected by eutrophication”
|
Descriptor 5 Human-induced eutrophication is minimised, especially adverse effects thereof, such as losses in biodiversity, ecosystem degradation, harmful algae blooms and oxygen deficiency in bottom waters – Macrofaunal communities of benthic habitats.
(a) in coastal waters, the values set in accordance with Directive 2000/60/EC; (b) beyond coastal waters, values consistent with those for coastal waters under Directive 2000/60/EC. Member States shall establish those values through regional or subregional cooperation.
|
| Complementary link | Segment: Sea-based activities
Goal: “Environmentally sustainable sea-based activities”
|
|
| Other relevant legislation: |
|
|
2.3 Relevance for other assessments
The indicator is utilised in the integrated assessment of eutrophication (HELCOM HEAT tool).
Eutrophication assessment
The status of eutrophication is assessed using several core indicators. Each indicator focuses on one important aspect of the complex process. In addition to providing an indicator-based evaluation of chlorophyll-a, this indicator also contributes to the overall eutrophication assessment along with the other eutrophication core indicators.
3. Threshold values
Status evaluation is carried out against scientifically based and commonly agreed sub-basin specific threshold values, i.e., the concentration that should not be exceeded (Figure 3).
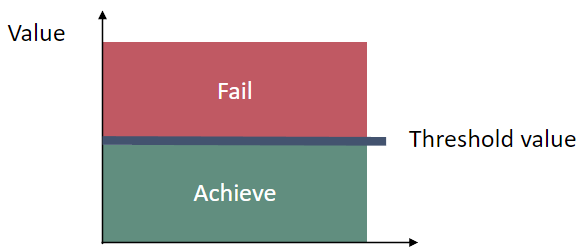
Figure 3. Schematic representation of the threshold value applied in the chlorophyll-a core indicator, the threshold values are assessment unit specific (see Thresholds and Status evaluation table 1).
3.1 Setting the threshold value(s)
For chlorophyll-a there is no data from the pre-eutrophic period. The threshold values for chlorophyll-a were set considering the results obtained in the TARGREV project accounting for the earliest available data and model simulations (HELCOM 2013), the work carried out during the EUTRO PRO process (HELCOM 2009) and national work for EU WFD implementation. The final threshold values were set through an expert evaluation process done during an intersessional activity to develop the core eutrophication indicators (HELCOM CORE EUTRO), and the threshold values were adopted by the 39th meeting of the HELCOM Heads of Delegations 2012. For the two new units in Gulf of Finland (SEA-013A and SEA-013B), threshold values were rescaled from the assessment unit (SEA-013) value used in HOLAS II (HOD 61-2021 document 5-1-Rev.1 Workspace ATT.13 Rev.1) and adopted by the 61st meeting of the HELCOM Heads of Delegations 2021. The threshold value for Pomeranian Bay is based on the rescaled threshold value for Bornholm Basin from the TARGREV project.
Table 4. Assessment unit specific threshold values for the chlorophyll-a core indicator.
| HELCOM_ID | Assessment unit (open sea) | Threshold value (μg l−1) |
| SEA-001 | Kattegat | 1.5 |
| SEA-002 | Great Belt | 1.7 |
| SEA-003 | The Sound | 1.2 |
| SEA-004 | Kiel Bay | 2.0 |
| SEA-005 | Bay of Mecklenburg | 1.8 |
| SEA-006 | Arkona Basin | 1.8 |
| SEA-007 | Bornholm Basin | 1.6 |
| SEA-007B | Pomeranian Bay | 2.9 |
| SEA-008 | Gdansk Basin | 2.2 |
| SEA-009 | Eastern Gotland Basin | 1.9 |
| SEA-010 | Western Gotland Basin | 1.2 |
| SEA-011 | Gulf of Riga | 2.7 |
| SEA-012 | Northern Baltic Proper | 1.7 |
| SEA-013A | Gulf of Finland Western | 1.9 |
| SEA-013B | Gulf of Finland Eastern | 2.3 |
| SEA-014 | Åland Sea | 1.5 |
| SEA-015 | Bothnian Sea | 1.5 |
| SEA-016 | The Quark | 2.0 |
| SEA-017 | Bothnian Bay | 2.0 |
4. Results and discussion
The results of the indicator evaluation underlying the key message map and information are provided below.
4.1 Status evaluation
Current status of the Baltic Sea chlorophyll-a in open-sea areas
In open sea areas, good status has been achieved in the Kattegat and in the Kiel Bay. In the remaining 17 sub-basins the threshold value was exceeded, thus the status was not good. The open sea assessment units causing greatest concern regarding chlorophyll-a status (EQRS < 0.2) are the Gulf of Finland Western, Northern Baltic Proper, Gulf of Finland Eastern and Western Gotland Basin. The Sound, Bornholm Basin, Pomeranian Bay, Gdansk Basin, Eastern Gotland Basin, Gulf of Riga, Åland Sea, Bothnian Sea, The Quark and Bothnian Bay (EQRS values between 0.2 and <0.4), and the Great Belt, Bay of Mecklenburg, and Arkona Basin (EQRS values between 0.4 and <0.6), exceeded their threshold values to lesser extent and thus also failed to reach good status (Figure 4 and Table 5). Chlorophyll-a concentrations have in general remained relatively constant during the assessment period (Figure 5). Largest annual variation occurred in the Pomeranian Bay and Gdansk Basin.
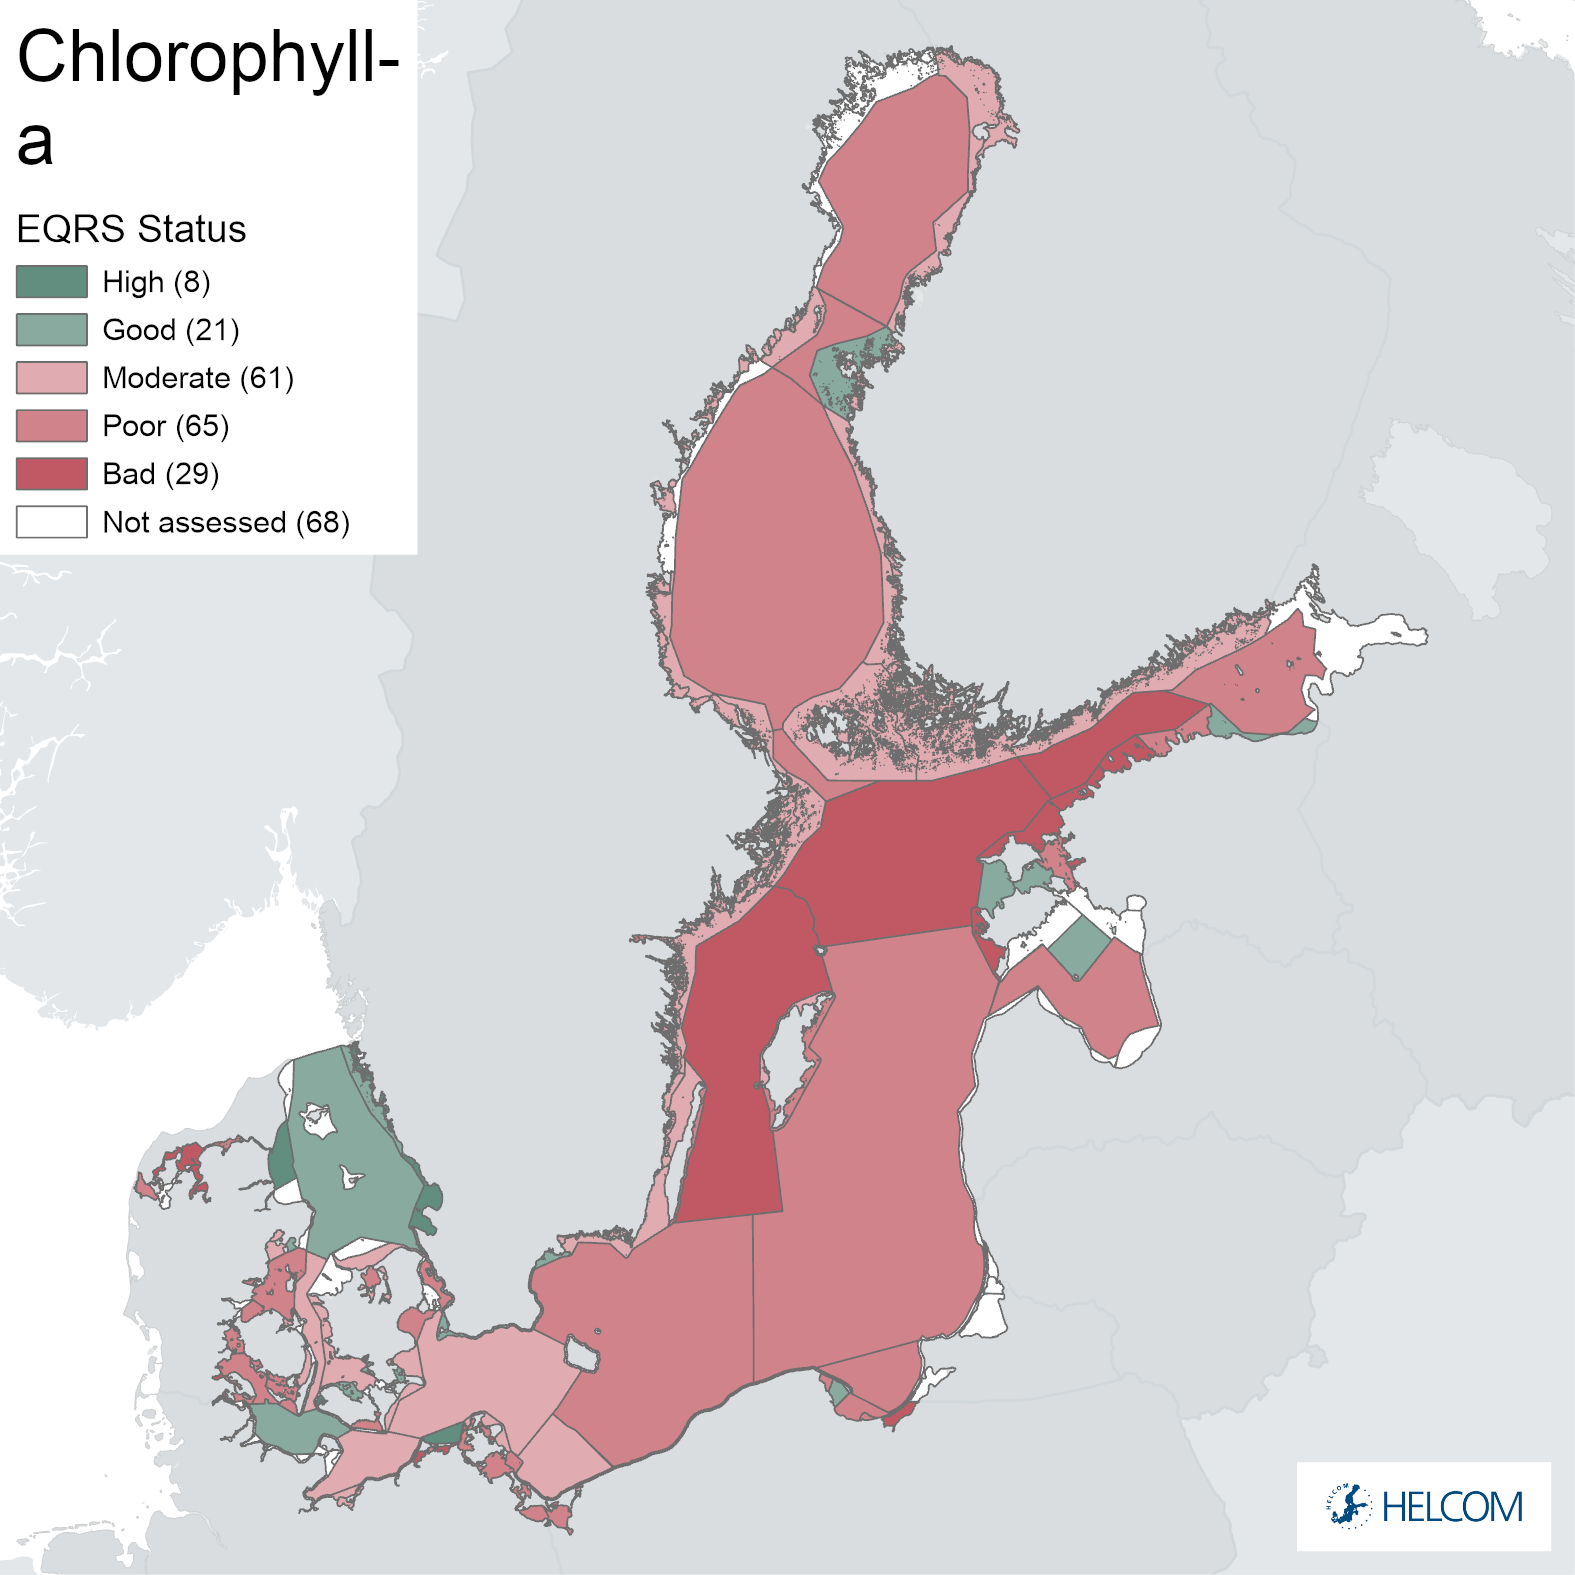
Figure 4. Status of the Chlorophyll-a indicator in 2016-2021, presented as Ecological Quality Ratio Scaled (EQRS). EQRS shows the present concentration in relation to the reference value, decreasing along with increasing eutrophication. The threshold value has been reached when EQRS = 0.6, with values above this threshold achieving good status.
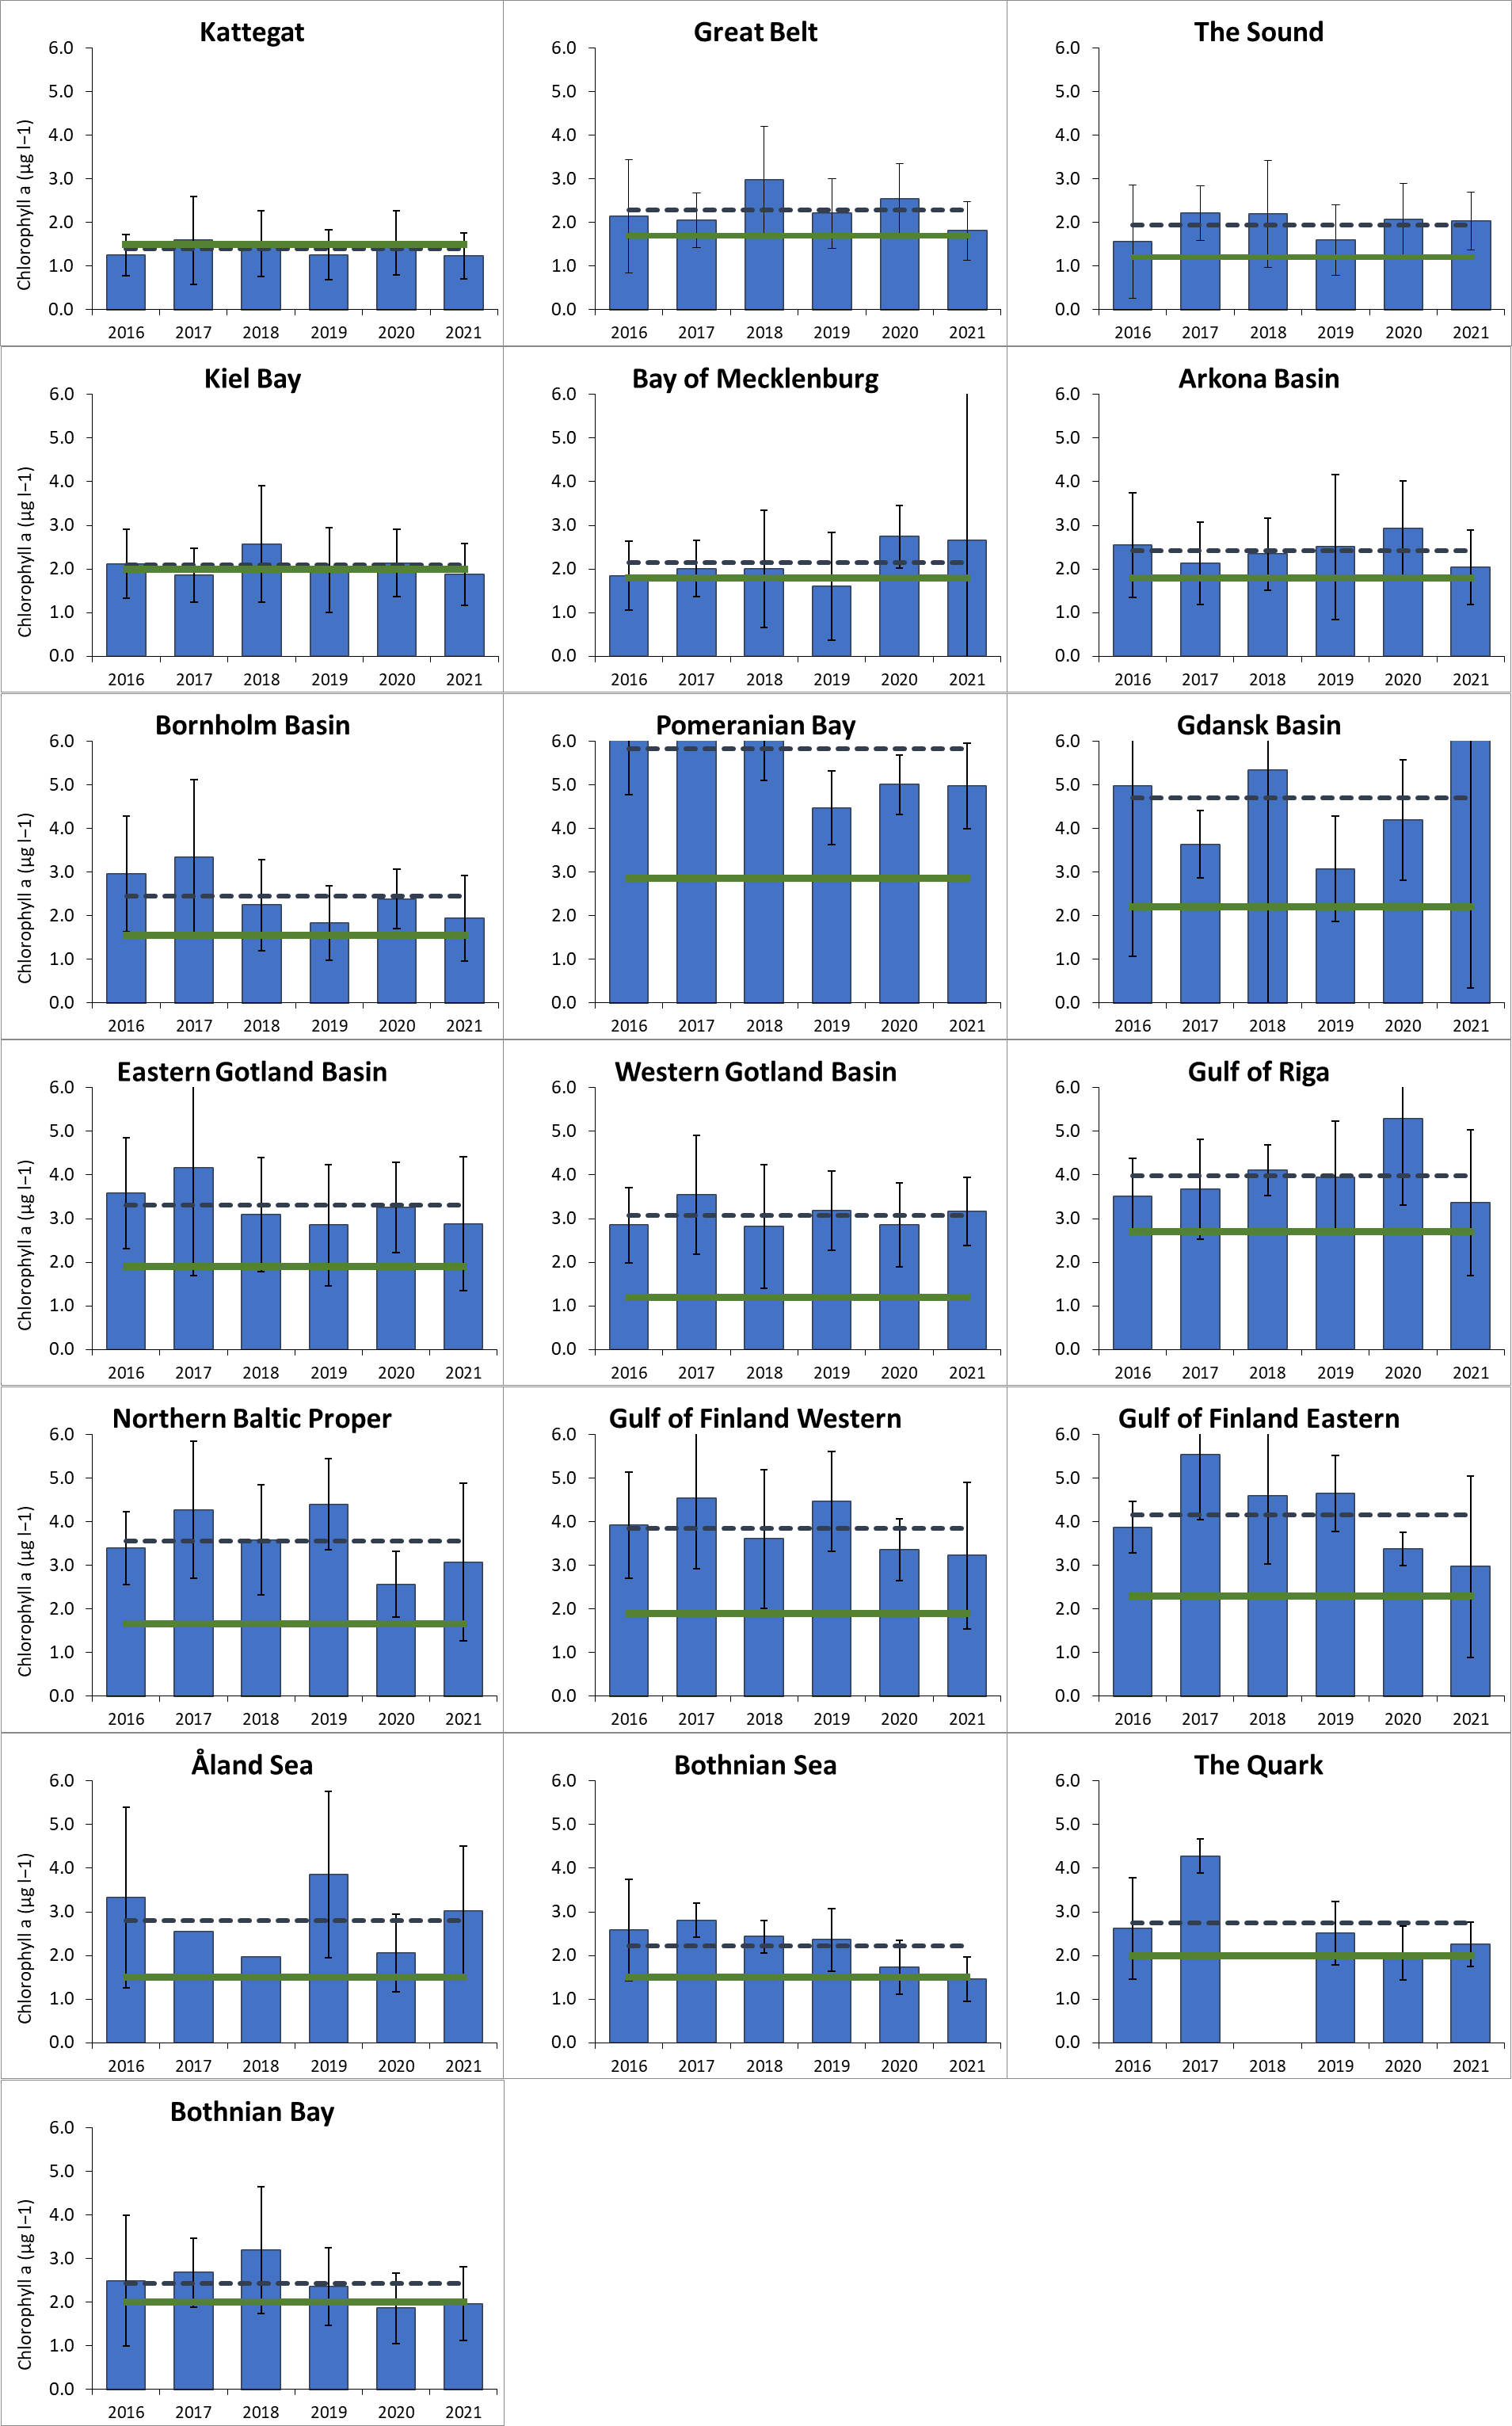
Figure 5. Summer (June-September) chlorophyll-a concentrations in µg L-1 with assessment period average shown as dashed dark blue line, and threshold value as agreed by HELCOM HOD 39/2012 (green line).
Table 5. Threshold values, present concentration (as average 2016-2021), Ecological Quality Ratio Scaled (EQRS) and status of Chlorophyll-a in the open-sea basins. EQRS is a quantitative value for the level of eutrophication, calculated from the ratio between the reference value and present concentration. When EQRS < 0.6, good status has not been reached.
| Assessment unit (open sea) | Threshold value (µg l-1) | Average 2016-2021 (µg l-1) | Ecological quality ratio (scaled) (EQRS) | STATUS
(fail/achieve threshold value) |
| Kattegat | 1.50 | 1.39 | 0.69 | Achieve |
| Great Belt | 1.70 | 2.01 | 0.47 | Fail |
| The Sound | 1.20 | 1.94 | 0.26 | Fail |
| Kiel Bay | 2.00 | 1.91 | 0.66 | Achieve |
| Bay of Mecklenburg | 1.80 | 1.94 | 0.55 | Fail |
| Arkona Basin | 1.80 | 2.29 | 0.40 | Fail |
| Bornholm Basin | 1.55 | 2.37 | 0.29 | Fail |
| Pomeranian Bay | 2.86 | 4.21 | 0.33 | Fail |
| Gdansk Basin | 2.20 | 3.73 | 0.26 | Fail |
| Eastern Gotland Basin | 1.90 | 2.99 | 0.27 | Fail |
| Western Gotland Basin | 1.20 | 2.89 | 0.15 | Fail |
| Gulf of Riga | 2.70 | 3.92 | 0.32 | Fail |
| Northern Baltic Proper* | 1.65 | 3.78 | 0.16 | Fail |
| Gulf of Finland Western | 1.90 | 4.20 | 0.16 | Fail |
| Gulf of Finland Eastern | 2.30 | 4.37 | 0.20 | Fail |
| Åland Sea* | 1.50 | 2.74 | 0.21 | Fail |
| Bothnian Sea* | 1.50 | 2.47 | 0.25 | Fail |
| The Quark* | 2.00 | 3.17 | 0.28 | Fail |
| Bothnian Bay* | 2.00 | 3.25 | 0.26 | Fail |
* In coastal waters, good status is found in some areas for Sweden, Denmark, Finland, Germany, Poland and Estonia (Annex 14.2).
Chlorophyll-a estimates measured on different platforms
The chlorophyll-a indicator is a multiparametric indicator and is based on combined data from in situ measurements, FerryBox flow-through measurements and remote sensing data (Earth Observation satellite (EO) data). In situ measurements and EO data are available for all open-sea areas, whereas FerryBox data is applied only in agreed open sea areas, the Northern Baltic Proper and Gulf of Finland Western.
Generally, the parameters provide a similar evaluation. Differences in relation to the threshold for good status are found in the most western assessment units. In the Kattegat, the in situ parameter reflects good status and EO-parameter reflects a level below GES, whereas the opposite is found in the Kiel Bay, Bay of Mecklenburg, Great Belt and Pomeranian Bay. For all these assessment units, except for Pomeranian Bay, the difference in the eutrophication status was equal or less than 0,6 µg L-1, which is an understandable difference considering their very different spatial and temporal representativeness. The results were near class boundary and fell in adjacent classes above and below GES for Kiel Bay and Bay of Mecklenburg. For Kattegat and the Great Belt the difference in chlorophyll-a concentrations between data types resulted in a difference of two classes.
For Pomeranian Bay, the difference of the data type specific results was 4.6 µg L-1. In this case it is likely that EO samples represent different areas in the whole assessment area than the station samples. Station samples often represent more coastal samples than EO.
Satellite observations typically cover the assessment area in spatially and temporally comprehensive way. The number of observations is huge; thus it is understandable that the summary results of EO and station sampling from the whole period over assessment area does not end up in same concentration. It is quite typical, that the summary of satellite observations fall to lower concentrations as EO samples cover also periods when the chl-a concentrations are not high, which is typical for the four month period in summer (1.6.-30.9.).
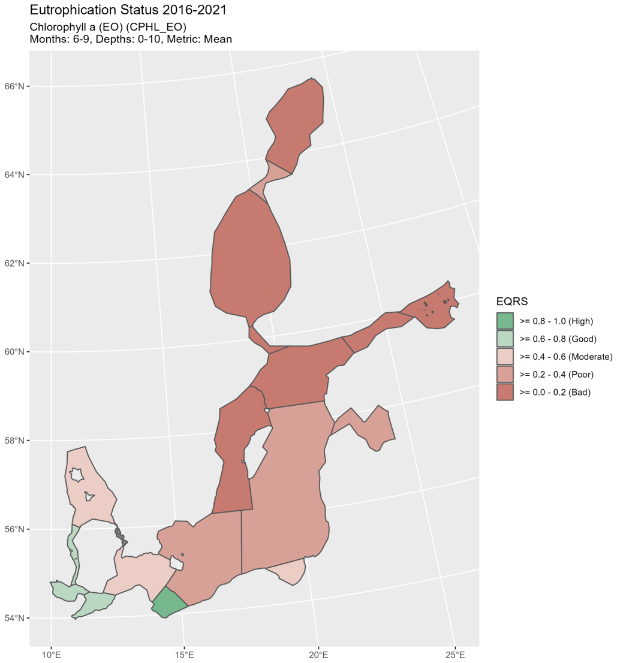
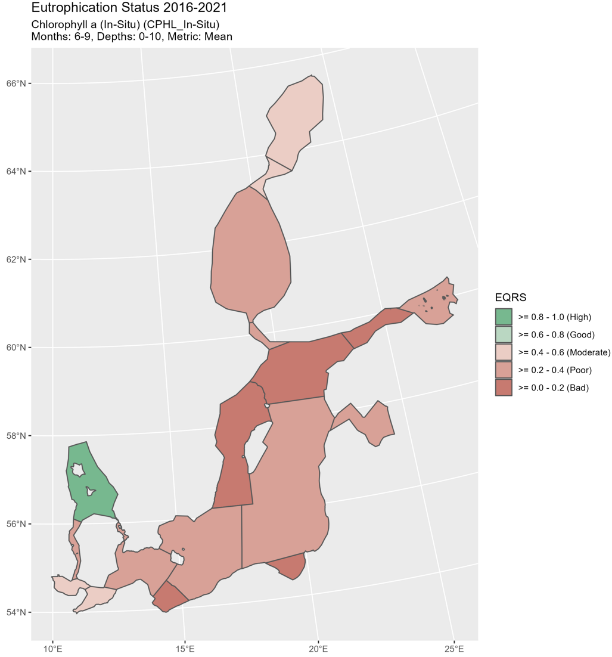
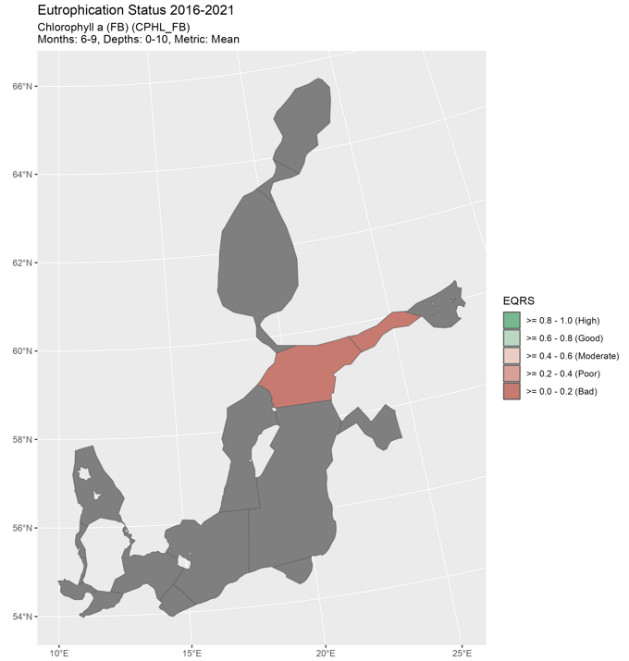
Figure 6. Status of the chlorophyll-a -indicator shown based on each individual methodology: measured in situ (left), FerryBox (right) and remote sensing satellite (bottom), presented as ecological quality ratio scaled (EQRS). EQRS shows the present concentration in relation to the threshold value, decreasing along with increasing eutrophication. The threshold value has been reached when EQRS ≥ 0.6. The overall chlorophyll-a status evaluation is based on combined annual information of the three parameters. Grey areas indicate that the parameter is not available in the assessment unit.
Current status of chlorophyll-a in the coastal areas
Most of the coastal assessment units throughout the Baltic Sea fail to achieve good status for chlorophyll-a. In coastal waters, good status is found in some areas for Sweden, Denmark, Finland, Germany, Poland and Estonia (Annex table 1). Such assessment units are found in Kattegat, The Sound, Great Belt, Kiel Bay, Bay of Mecklenburg, Arkona Basin, Pomeranian Basin, Bornholm Basin, Gdansk Basin, Western Gotland Basin, Northern Baltic Proper and The Quark.
4.2 Trends
Long-term trends
The long-term trends are provided as additional information and do not influence the status assessment for the current assessment period (2016-2021).
An increase in summer chlorophyll-a concentration was evident in most of the Baltic Sea sub-basins from the 1970/80s to the late 1990s/early 2000s. Only in some southwestern areas, the Kattegat and Arkona Basin, were these increases not observed. In the Bornholm Basin a decrease in summer chlorophyll-a concentration could even be observed during this period. (Fleming-Lehtinen et al. 2008)
Based on chlorophyll-a concentration trends in collated in situ data, there has been little change during the 1990-2021 period. There are some exceptions, for example in the most southwestern parts of the Baltic Sea, where significant decreasing trends are observed (Results Figure 4). These decreasing trends correspond well with decreases in nitrogen inputs and concentrations in the southwestern parts, where nitrogen is considered the most limiting nutrient for phytoplankton growth. However, since about 2012, the concentrations have increased in Kattegat, The Sound and Great Belt (Results Figure. 4 and Results Table 2). The same is observed for the adjacent estuaries. This increase also corresponds with the nitrogen loadings, which have been increasing since about 2010. In the northern and eastern parts of the Baltic Sea, where summer chlorophyll-a concentration is more related to phosphorus concentrations the indicator shows no changes or an increasing trend (significant in Bothnian Bay an Eastern and Western Gotland Basins).
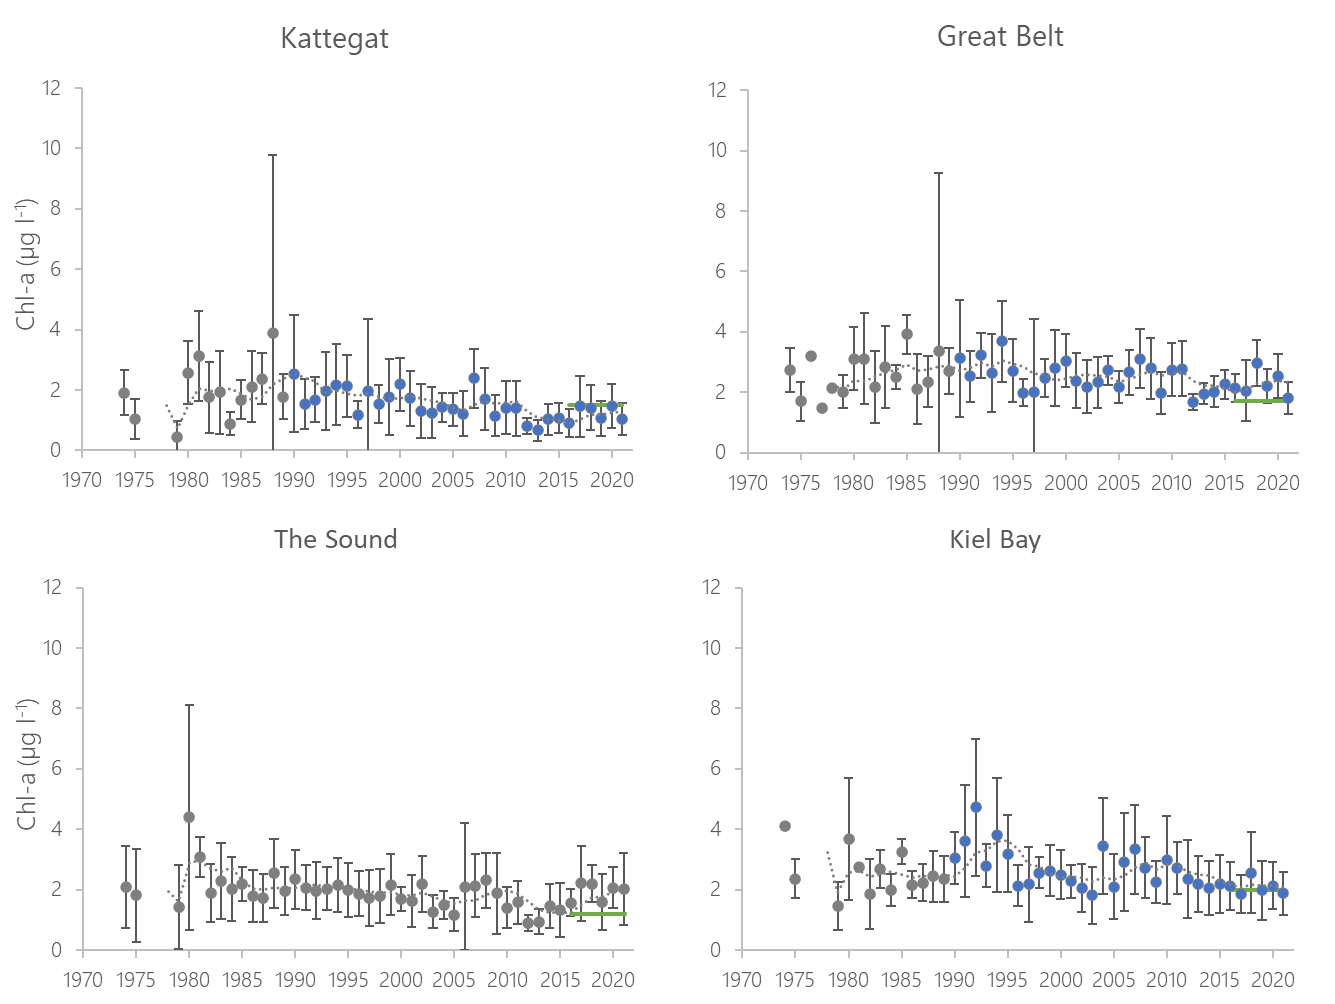
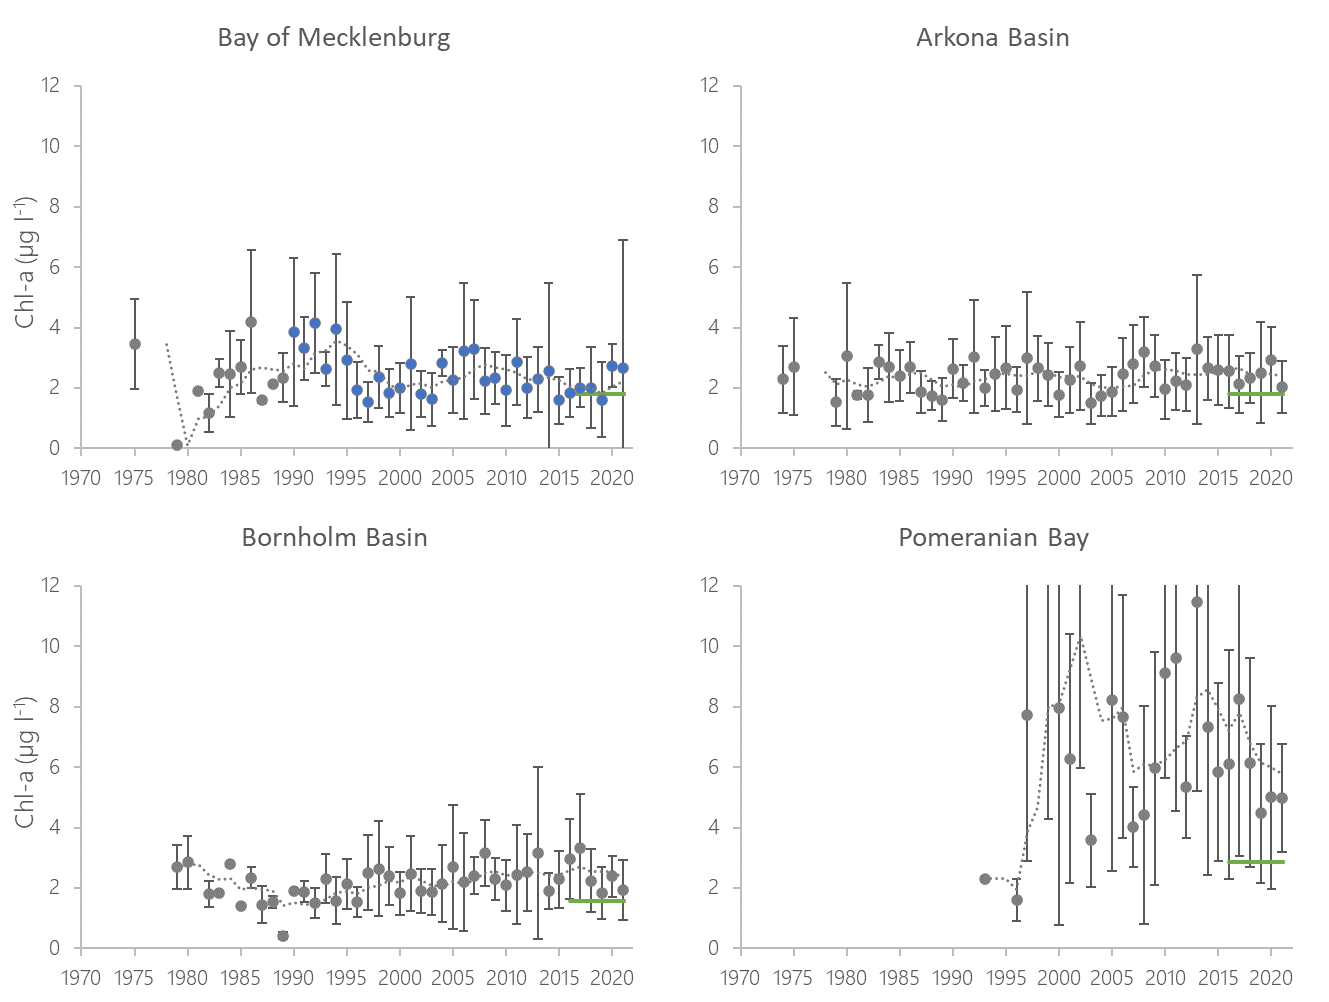
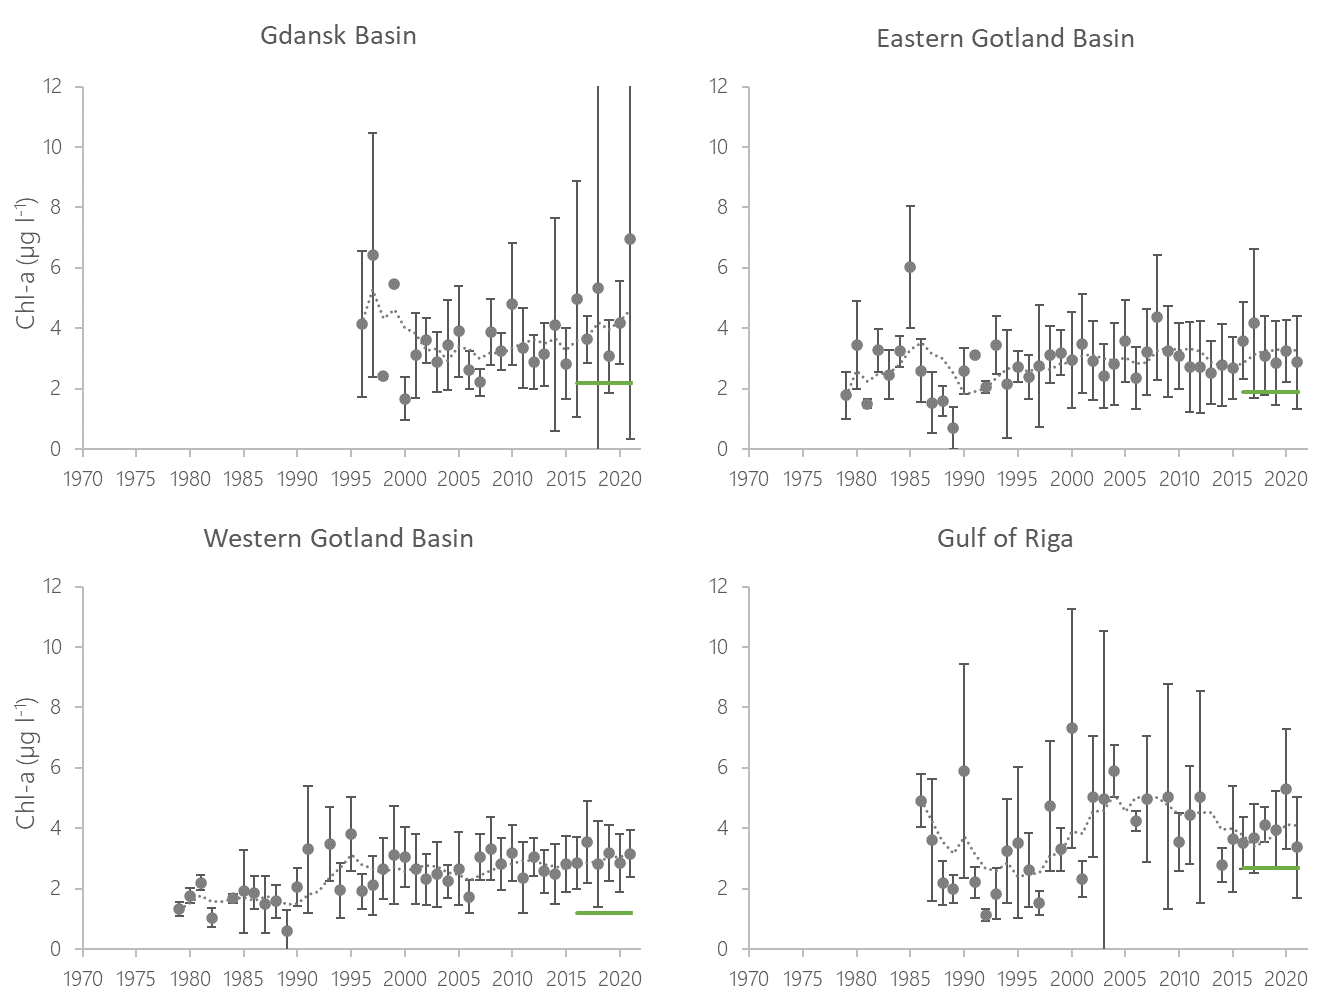
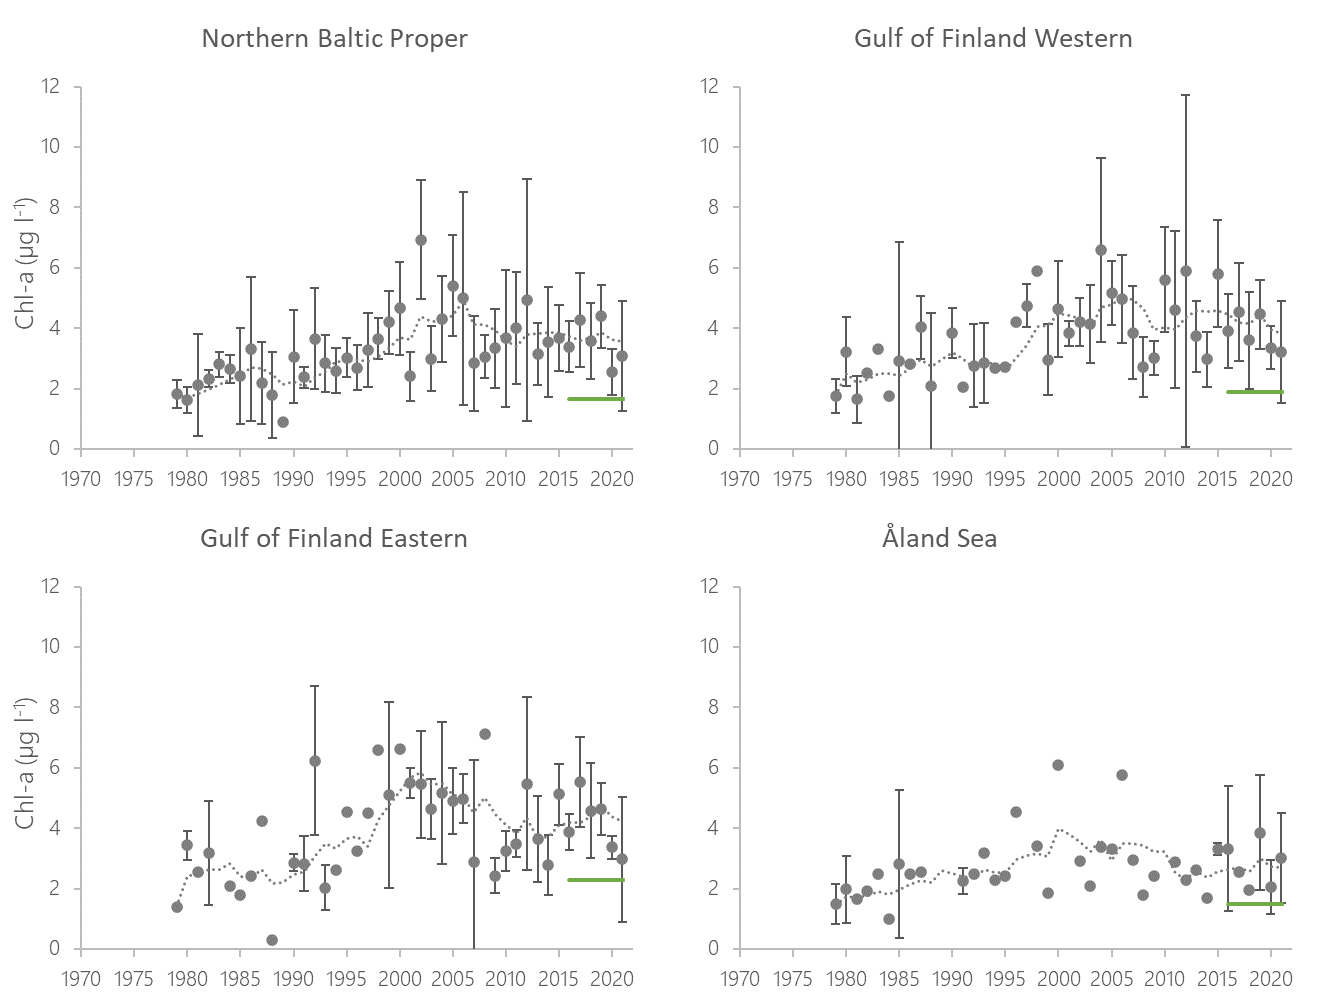
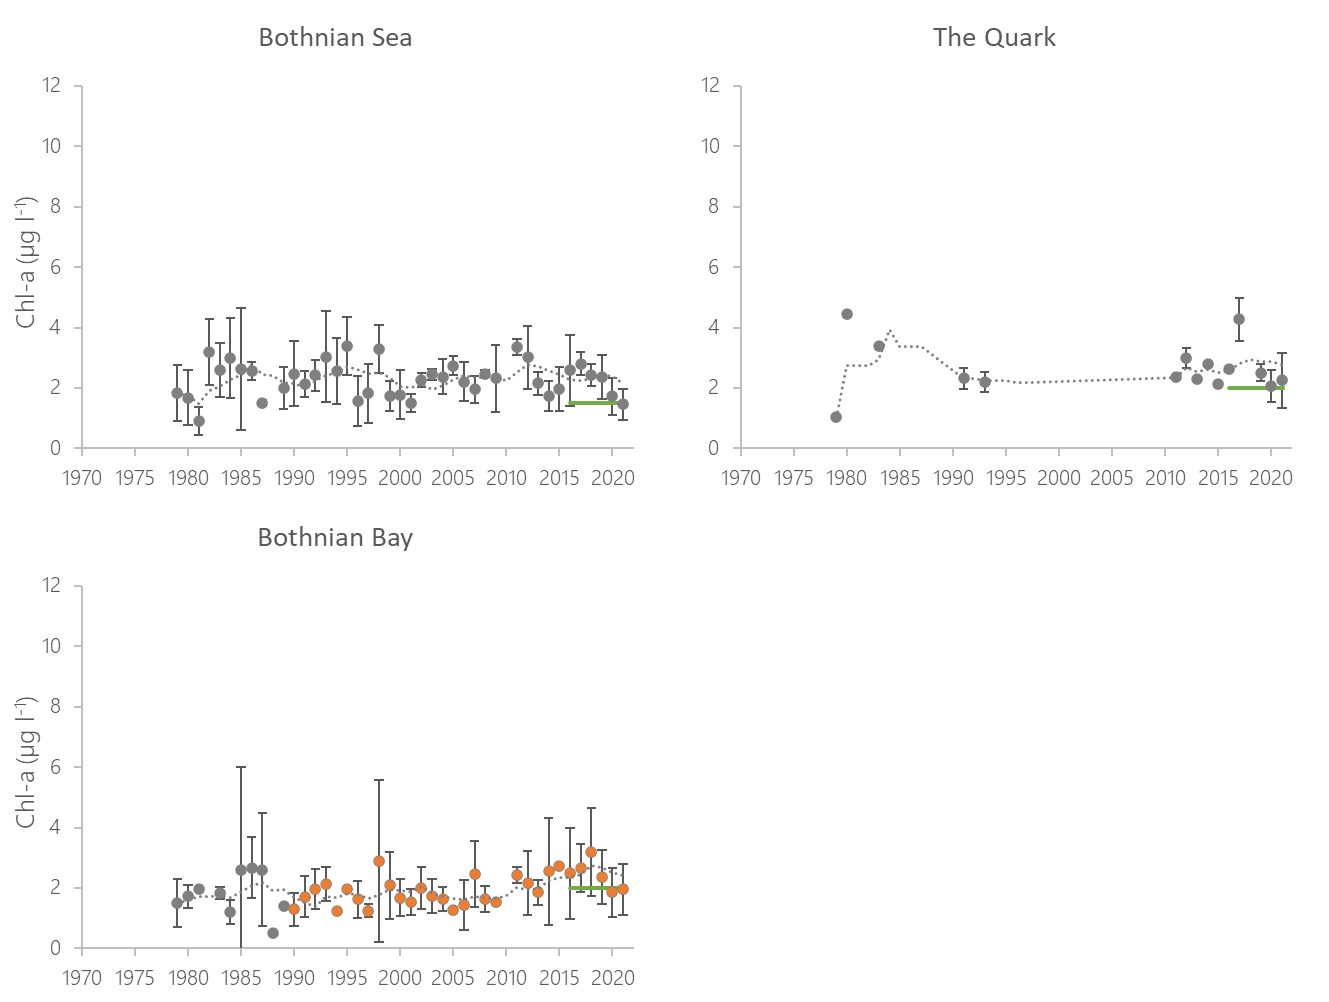
Figure 7. Temporal development of chlorophyll-a (chl-a) concentrations in the open-sea assessment units from 1970s to 2021. Dashed lines show the five-year moving averages and error bars the standard deviation. Green lines denote the indicator threshold value. Significance of trends was assessed with a Mann-Kendall non-parametric tests for the period from 1990-2021. Significant (p<0.05) improving trends are indicated with blue and deteriorating trends with orange colour.
4.3 Discussion text
Assessment results for chlorophyll-a were compared between the latest two assessments of HOLAS II and HOLAS 3. Status in Kattegat deteriorated but remained in good status. Kiel Bay changed its status from failing good status to achieving good status (Results table 2). The rest of the assessment units remained below good status. Status deteriorated in the Sound and in the most northern assessment units (Bothnian Bay, The Quark, Åland Sea), improved in Bay of Mecklenburg, Arkona Basin and Bornholm Basin, and remained stable in the rest of the assessment units. In the Bornholm Basin, the improvement in status was likely due to splitting off Pomeranian Bay, which is highly influenced by river Odra, from the Bornholm Basin into separate assessment unit for HOLAS 3. The Gulf of Finland assessment unit, which was used in HOLAS II (SEA-013), was split to two new assessment units (SEA-013A and SEA-013B) for HOLAS 3. Therefore, the two latest assessments cannot be directly compared. However, comparing the HOLAS II result for SEA-013 to average of the HOLAS 3 results for SEA-013A and SEA-013B suggests that the chlorophyll status in the gulf has remained relatively stable.
Table 6. Evaluations of the chlorophyll-a indicator during the HOLAS II and HOLAS 3 periods, coloured red or green depending on whether the assessment unit fails or achieves the threshold, respectively. The trend from the previous to present assessment period is addressed alongside a description of outcome (a change of 15 % is deemed significant).
*) Gulf of Finland was assessed as one assessment unit (SEA-013) in HOLAS II
5. Confidence
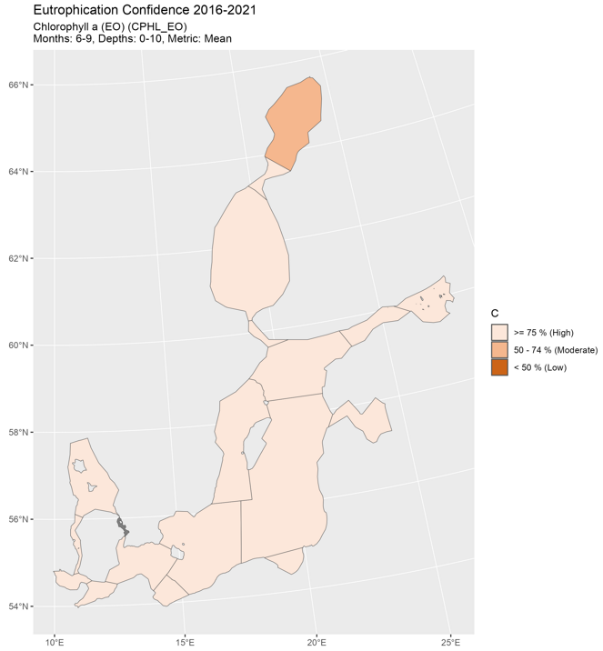
The overall confidence of the indicator status evaluation, based on the spatial and temporal coverage of data and accuracy of the classification result, was high for the Bothnian Sea, Gulf of Finland Western, Northern Baltic Proper, Western Gotland Basin, Eastern Gotland Basin, Gulf of Riga, Gdansk Basin, Bornholm Basin, Pomeranian Bay, Arkona Basin, Bay of Mecklenburg, Kiel Bay and Kattegat, and it was moderate in the remaining assessment units.
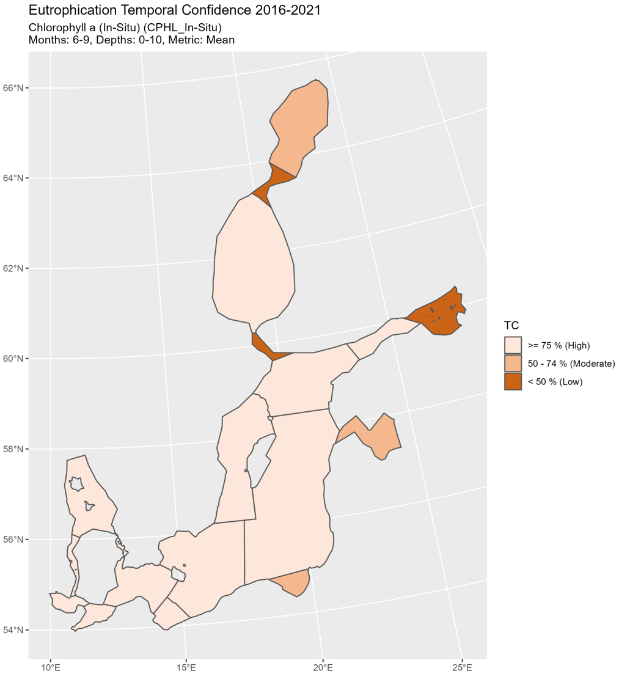
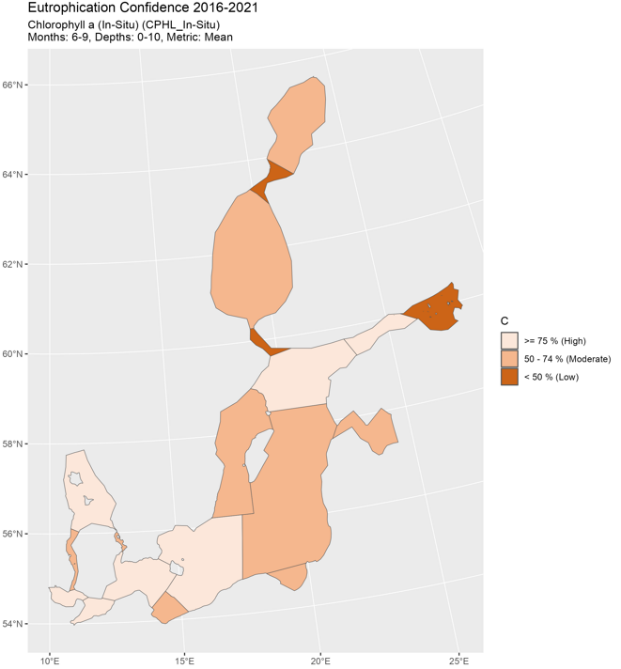
The temporal confidence was high in all assessment units, except for the Quark, Eastern Gulf of Finland, Gulf of Riga and Gdansk Basin where it was moderate and Åland Sea where it was low (Figure 8). Temporal confidence for in situ data was low in the Gulf of Finland Eastern, Åland Sea and the Quark and moderate in the Gdansk Basin, Gulf of Riga and the Bothnian Bay (Annex figure 1). Temporal confidences of EO-parameter and FB-parameter were high in all assessment units, where assessed (Annex figures 2-3).
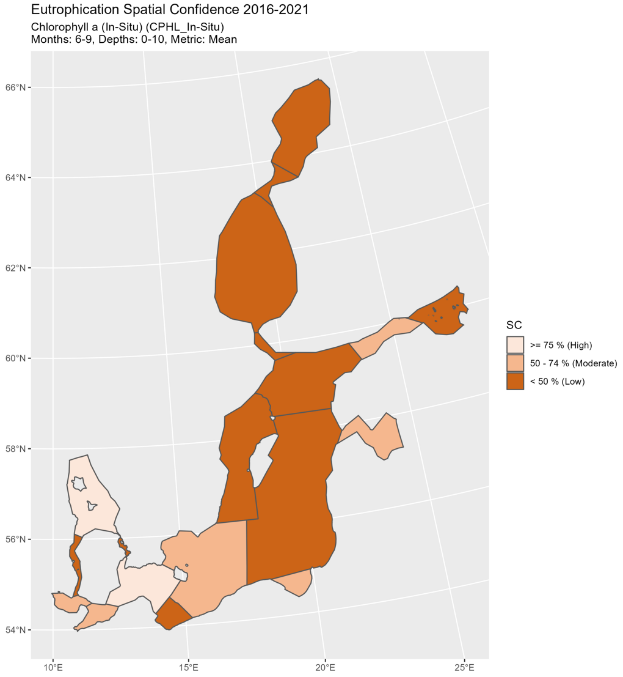
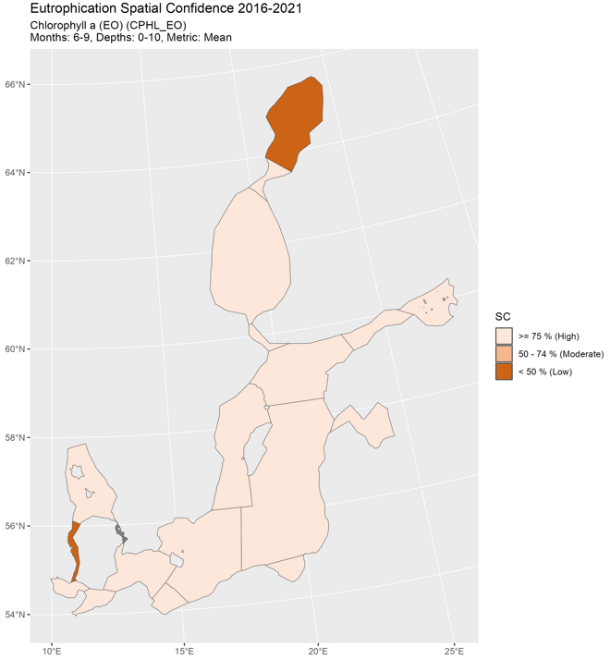
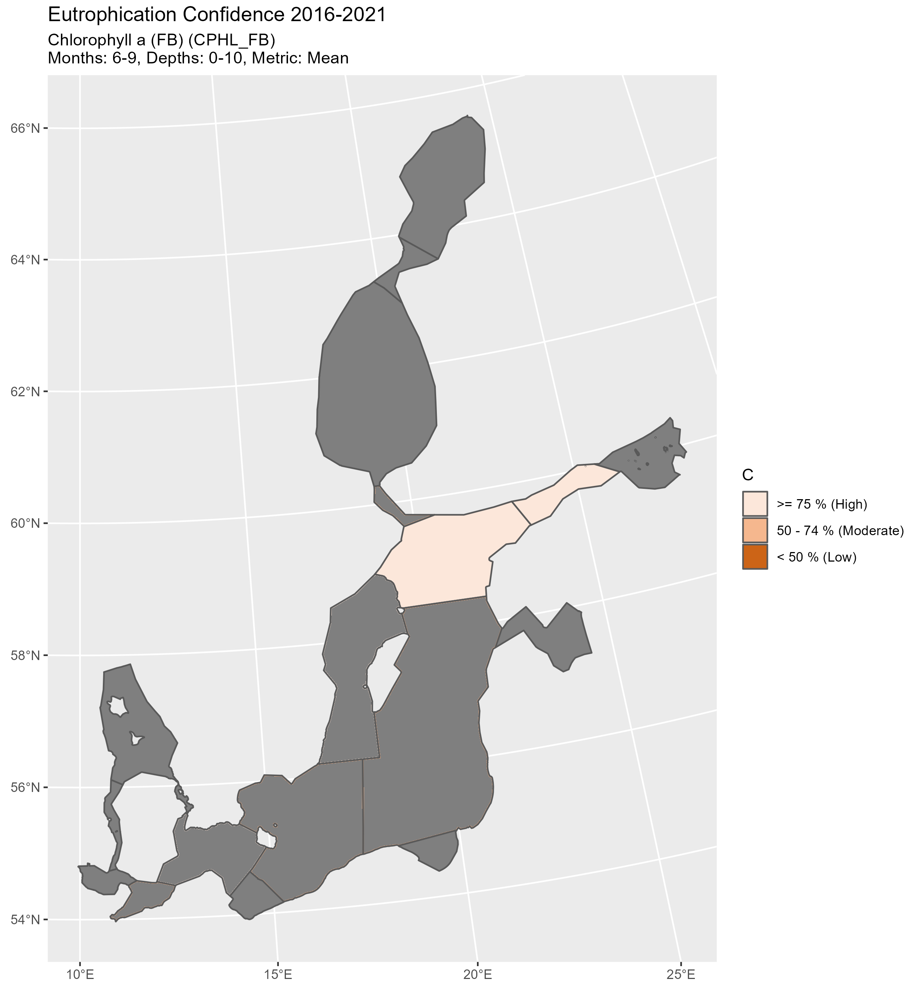
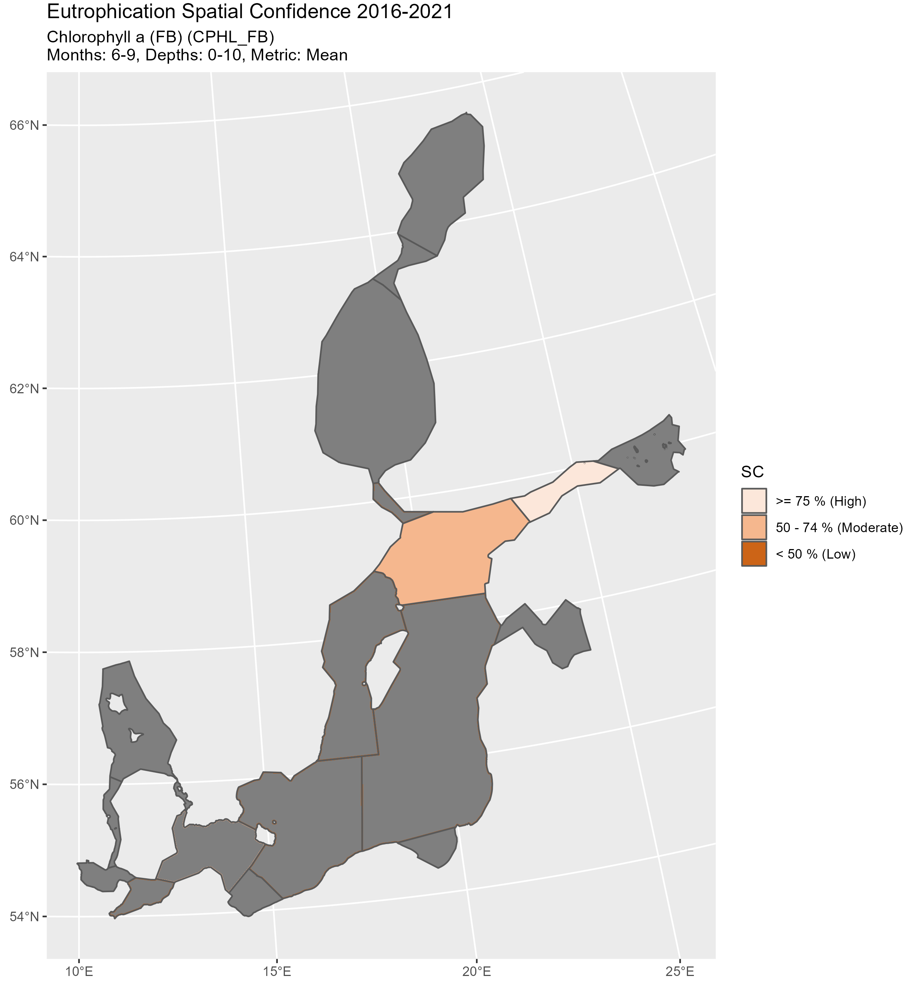
Spatial confidence was low in the Bothnian Bay, Åland Sea, Eastern Gulf of Finland, Western Gotland Basin, Eastern Gotland Basin, Pomeranian Bay, the Great Belt and the Sound, high in the Western Gulf of Finland, Arkona Basin, Kiel Bay, Bay of Mecklenburg and Kattegat and moderate in the rest of the sub-basins. The spatial confidence was high for the in situ parameter only in the Kattegat and Arkona Basin. For the EO-parameter it was high for all assessment units except the Bothnian Bay and Great Belt, where included results covered only 45%-47% and 52%-61% of the assessment unit area, respectively. For the FB-parameter, the spatial confidence varies based on how well the Ferrybox route represents the entire assessment unit; it was high only in the Gulf of Finland Western (Annex figures 1-3).
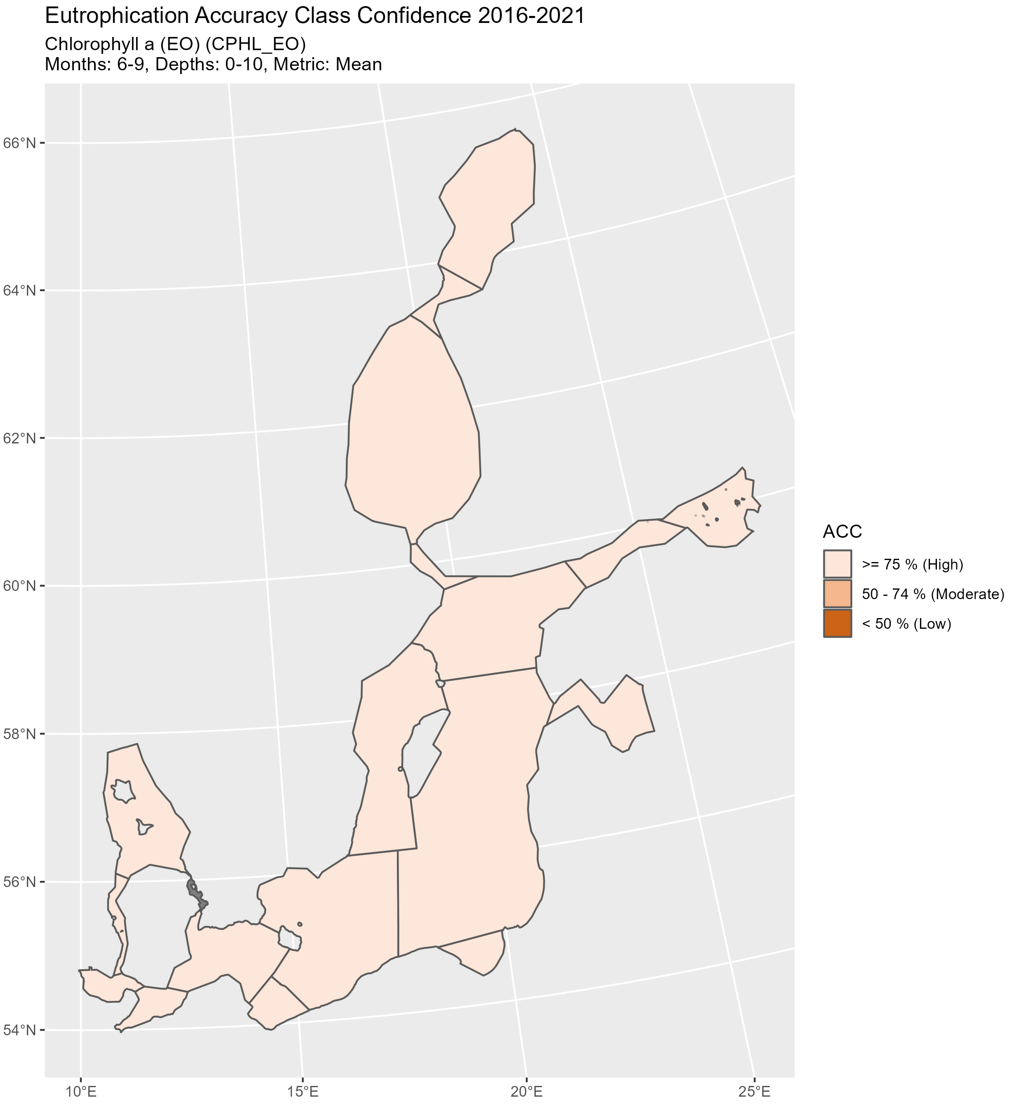
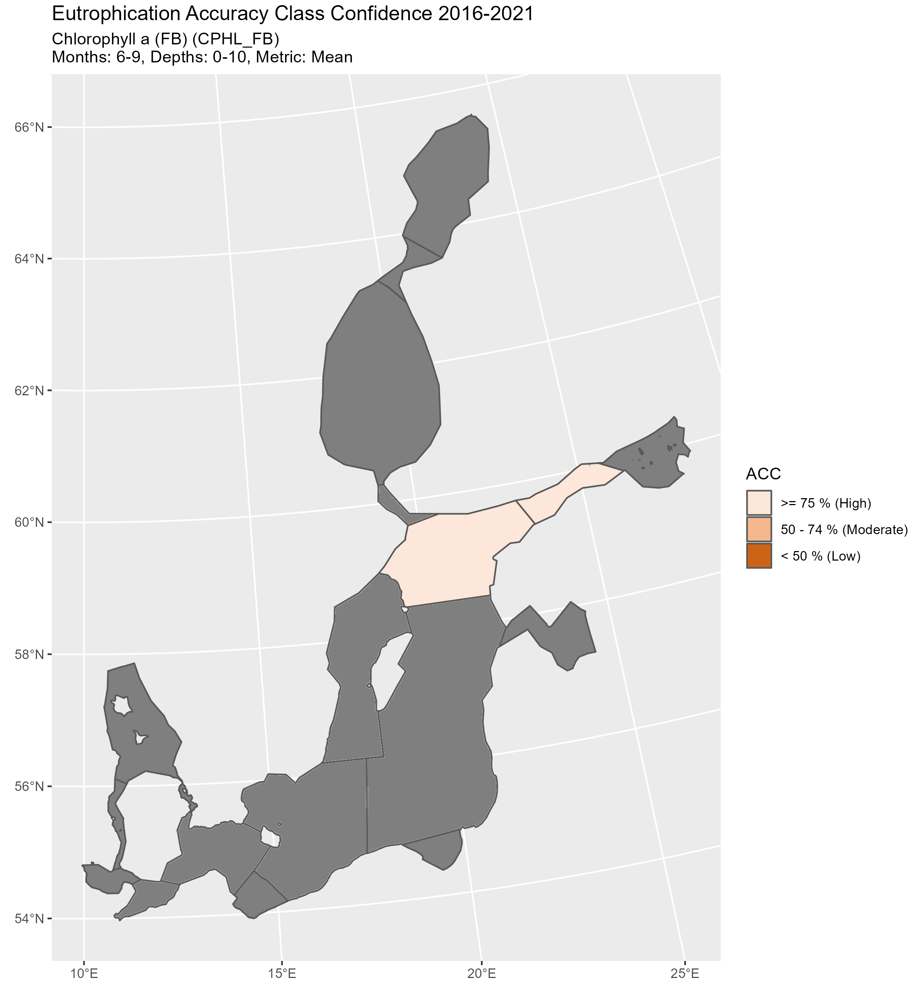
The accuracy confidence was high in all open-sea assessment units (Figure 8). It was also high separately for each data type (Annex figures 1-3).
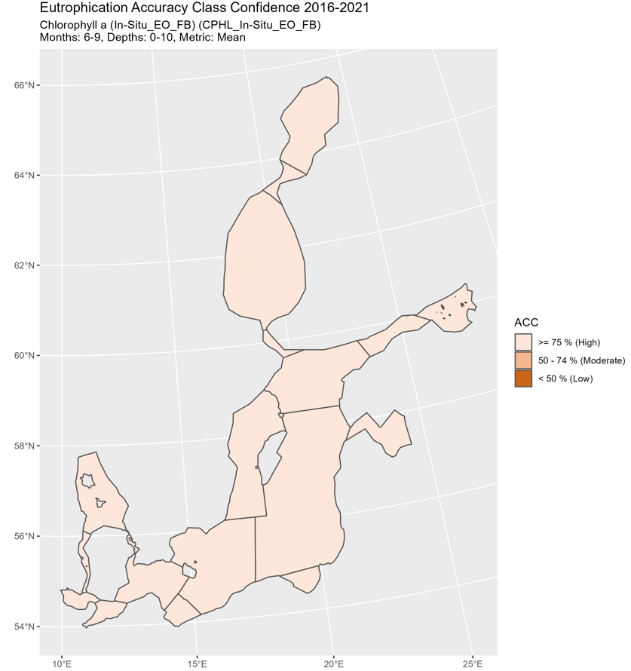
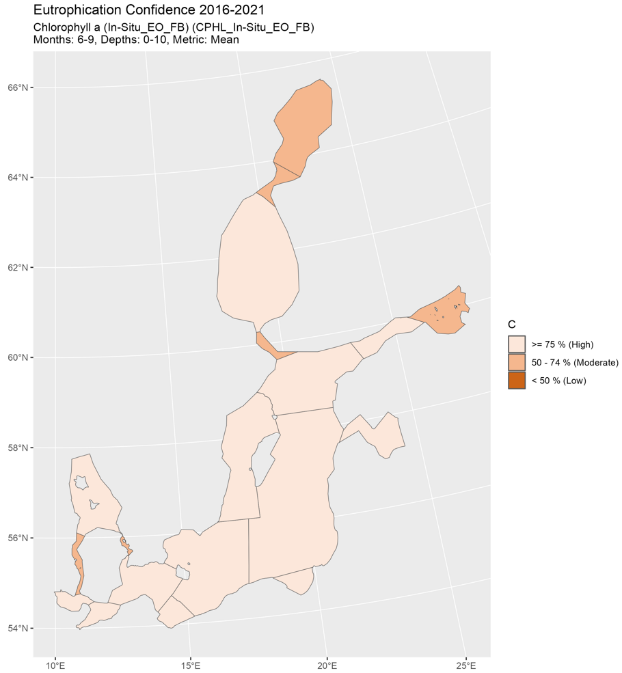
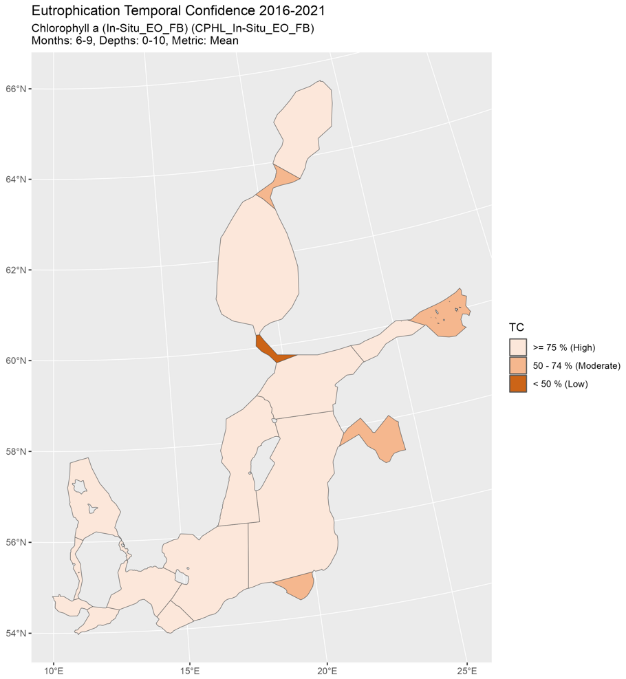
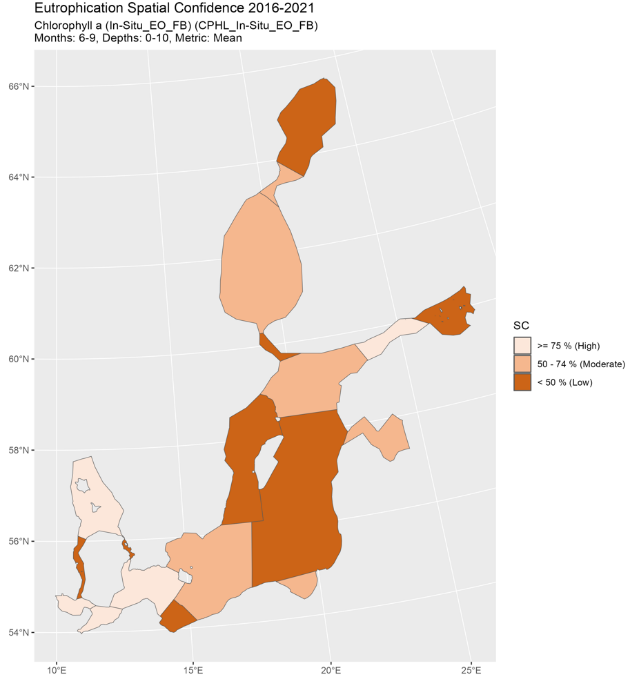
Figure 8. Indicator confidence determined by combining information from In Situ, Earth observations (EO) and Ferrybox (FB) data. Overall confidence (c), accuracy (ACC), spatial confidence (SC) and temporal confidence (TC) of the GES evaluation. Low indicator confidence calls for increase in monitoring.
6. Drivers, Activities, and Pressures
The increase of chlorophyll-a, a proxy of phytoplankton biomass, in the water column is dependent on nutrient inputs, and thus linked strongly to anthropogenic nutrient loads from land and air. The amount of phytoplankton in the water depends on the balance between phytoplankton growth and loss factors, such as grazing. As phytoplankton growth is stimulated by nutrients, the chlorophyll-a concentration tends to increase with nutrient inputs. However, a simultaneous increase in zooplankton biomass or other grazers, due to the higher food availability might to some degree counteract this effect.
For HOLAS 3 initial work has been carried out to explore Drivers (and driver indicators) to evaluate how such information can be utilised within such management frameworks as DAPSIM. Although it is recognised as only addressing a small portion of the drivers (via proxies) of relevance for eutrophication wastewater treatment (Drivers and driver indicators for Wastewater Treatment) and agriculture (Drivers and driver indicators for Agricultural Nutrient Balance) have been explored in these pilot studies for HOLAS 3.
Diffuse sources constitute the highest proportion of total nitrogen (nearly 50%) and total phosphorus (about 56%) inputs to the Baltic Sea (HELCOM 2022). For total nitrogen, atmospheric deposition on the sea has the second highest share (24%) followed by natural background loads (20%) and point sources (9%). Natural background loads have the second highest share of total phosphorus inputs to the Baltic Sea (20%), followed by point sources (17%) and atmospheric deposition (7%). Point sources include activities such as municipal wastewater treatment plants, industrial plants and aquacultural plants and diffuse sources consist of anthropogenic sources such as agriculture, managed forestry, scattered dwellings, storm water etc.
A significant reduction of nutrient inputs has been achieved for the whole Baltic Sea. The normalized total input of nitrogen was reduced by 12% and phosphorus by 28 % between the reference period (1997-2003) and 2020 (HELCOM 2023). The maximum allowable input (MAI) of nitrogen in this period was fulfilled in the Bothnian Bay, Bothnian Sea, Danish Straits and Kattegat and the maximum allowable input of phosphorus in the Bothnian Bay, Bothnian Sea, Danish Straits and Kattegat.
Further developing an overview of such components and the relevant data to be able to better quantify the linkages within a causal framework provide the opportunity for more informed management decisions, for example targeting of measures, and can thereby support the achievement of Good Environmental Status.
Table 7. Brief summary of relevant pressures and activities with relevance to the indicator.
| | General | Activities MSFD Annex III, Table 2b | Pressures: MSFD Annex III, Table 2a |
| Strong link | Cultivation of living resources; Transport; Urban and industrial uses; Physical restructuring of rivers, coastline or seabed (water management) | Input of nutrients; input of organic matter | |
| Weak link |
7. Climate change and other factors
The current knowledge of the effects of climate change to eutrophication is summarized in the HELCOM climate change fact sheet (HELCOM and Baltic Earth 2021). The effect of climate change to the nutrient pools is not yet separable from the other pressures, and the future nutrient pools will dominantly be affected by the development of nutrient loading. The phytoplankton growth season has already prolonged due to changes in cloud cover and stratification. Climate change is, with medium confidence, considered to increase the stratification, further deteriorate near-bottom oxygen conditions, and increase the internal nutrient loading.
8. Conclusions
The status evaluation fails to achieve good environmental status in all assessed sub-basins except for the Kattegat and the Kiel Bay. A better harmonization of the thresholds for Chlorophyll-a between coastal waters and the open Baltic Sea Basins might be necessary in the future, in particular in areas where coastal waters are already assessed as achieving good status while the open basins still fail to achieve good status, since such a gradient would not be expected to occur assuming that high nutrient concentrations are mainly caused by riverine nutrient inputs.
8.1 Future work or improvements needed
The use of Ferrybox data in all assessment units should be investigated.
9. Methodology
9.1 Scale of assessment
The core indicator is applicable in all the 19 open sea assessment units (exceeding one nautical mile seawards from the baseline).
In the coastal units the indicator is assessed using comparable indicators developed nationally for the purposes of assessments under the EU Water Framework Directive.
The assessment units are defined in the HELCOM Monitoring and Assessment Strategy Annex 4.
9.2 Methodology applied
The average chlorophyll-a concentration in open sea assessment units is a combined estimate of three types of data (depending on availability, applicability, and regional agreement): 1) in situ measurements 2) Earth Observation (EO) remote sensing satellite data, and 3) FerryBox data. These data are combined as annual averages, applying weighting based on data availability and confidence. The indicator specifics are presented in Table 8.
More information is found in the eutrophication assessment manual.
Table 8. Specifications of the core indicator chlorophyll-a.
| Indicator | Chlorophyll-a | ||||||||||||||||||||||||||||||||||||||||||||||||||||||||||||||||||||||||||||||||
| Response to eutrophication | positive | ||||||||||||||||||||||||||||||||||||||||||||||||||||||||||||||||||||||||||||||||
| Parameters | Chlorophyll-a concentration (µg l-1) | ||||||||||||||||||||||||||||||||||||||||||||||||||||||||||||||||||||||||||||||||
| Assessment period | 2016 – 2021 | ||||||||||||||||||||||||||||||||||||||||||||||||||||||||||||||||||||||||||||||||
| Assessment season | Summer = June + July + August + September | ||||||||||||||||||||||||||||||||||||||||||||||||||||||||||||||||||||||||||||||||
| Depth | Surface:
in situ data: average in the 0 – 10 m layer FerryBox data: 3-5 m depth |
||||||||||||||||||||||||||||||||||||||||||||||||||||||||||||||||||||||||||||||||
| Removing outliers | On responsibility of data submitter | ||||||||||||||||||||||||||||||||||||||||||||||||||||||||||||||||||||||||||||||||
| Removing close observations | No close observations removed | ||||||||||||||||||||||||||||||||||||||||||||||||||||||||||||||||||||||||||||||||
| Indicator level (ES) | Defined using the following datatypes: 1) water sample measurements from HELCOM COMBINE (in situ), 2) daily earth observation on 20K grid (EO) and in part of the assessment units additionally 3) FerryBox observations (fb).
The final ES is defined as an average of the annual estimates, which are defined as weighted averages of the data type specific ES estimates, M = datatype weight, agreed by the eutrophication network and State & Conservation 17-2022. weights are given in table below, and M(in situ) + M(eo) + M(fb) = 1
ES(in situ) = arithmetic average of in situ observations in assessment unit during assessment season during year y ES(eo) and ES(fb) = geometric average of EO/fb grid cell data in assessment unit during assessment season during year y |
||||||||||||||||||||||||||||||||||||||||||||||||||||||||||||||||||||||||||||||||
| Eutrophication quality ratio (EQR) | EQR = BEST/ ES,
where BEST= ET / (1 + ACDEV / 100) ET= threshold (table 1) ACDEV= acceptable deviation: 50 % for chlorophyll-a The final EQR values are scaled after normalisation to five classes of 0.2 width. |
||||||||||||||||||||||||||||||||||||||||||||||||||||||||||||||||||||||||||||||||
| Indicator confidence | The confidence assessment for eutrophication indicators is included in HEAT, and includes aspects of temporal, spatial and accuracy confidence. The general methodology of the confidence assessment is described in Document 4.2 of IN-Eutrophication 16-2020 and updates are described in documents 4J-80 of State & Conservation 14-2021 and 4-2 of EG-EUTRO 20-2021. The R-code is available via https://github.com/ices-tools-prod/HEAT.
Confidence is calculated separately for each data type. The overall indicator confidence is calculated using the weighted average of the data type specific values. The datatype weights (M) presented above are used in the weighing. The same criteria are used for all data types, based on their n, as described below. ny(in situ) = number of observations ny(EO), ny(fb) = the number of 20K grid cells containing data, multiplied with the number of observation days during year y For each datatype, confidence is calculated as the average of the aspects of temporal, spatial, accuracy and methodological confidence. The evaluation criteria for temporal confidence are given in the table below.
If the specific temporal confidence is high (100) for at least half of the assessed years, it is set as high (100) for the assessment period. The total temporal confidence is the average of the general and specific temporal confidence aspects. The evaluation criteria for spatial confidence are given in the table below.
The accuracy aspect assesses the probability of correct classification (the classification being below or above the threshold for good status). The evaluation criteria for accuracy aspect are given in table below.
|
The in situ chlorophyll-a data (1) is collected in the ship-based monitoring and the samples are handled and analyzed, as explained in the HELCOM Guidelines for monitoring of chlorophyll-a. Measurements made at the depth of 0 – 10 m from the surface are used in the assessment.
The satellite-based EO-dataset (2) was calculated at SYKE using the Copernicus programme Sentinel-satellite series instrument data. The EO chl-a values for the surface layer depends on the transparency of the water. Cloudy areas have been removed from the dataset. The data was reported as daily statistics of 20K grid cells (Figure 9).
Information based on flow-through system onboard ferrylines (FerryBox data, 3) was collected and validated by SYKE, and was reported to ICES. As selected ferries operating on the Baltic Sea are the platform for FerryBox flow-through systems and only specific routes are followed (https://www.ferrybox.com/routes_data/routes/baltic_sea/index.php.en) then data availability is not evenly distributed across all HELCOM sub-basins. To remove possible spatial bias, which might be considerable in areas with spatial sampling gradients, the Ferrybox-based chl-a estimate is corrected to represent the entire area. This correction is done separately for each HELCOM sub-basin, based on a longer-term reference data, which was achieved using long term statistics on chl-a concentrations derived from satellite instrument MERIS (years 2002-2011). The correction is done separately for each year within the assessment period, according to the following formula:
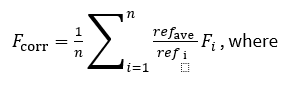
Fcorr is the corrected Ferrybox chla estimate in a HELCOM sub-basin,
n is the number of grid cells in the HELCOM sub-basin,
refi is the grid cell (geometrical) average for the reference data (MERIS 2002-2011),
refave is the sub-basin average of the reference data and
Fi is the (geometrical) average Ferrybox chla estimate for grid cell ‘i’.
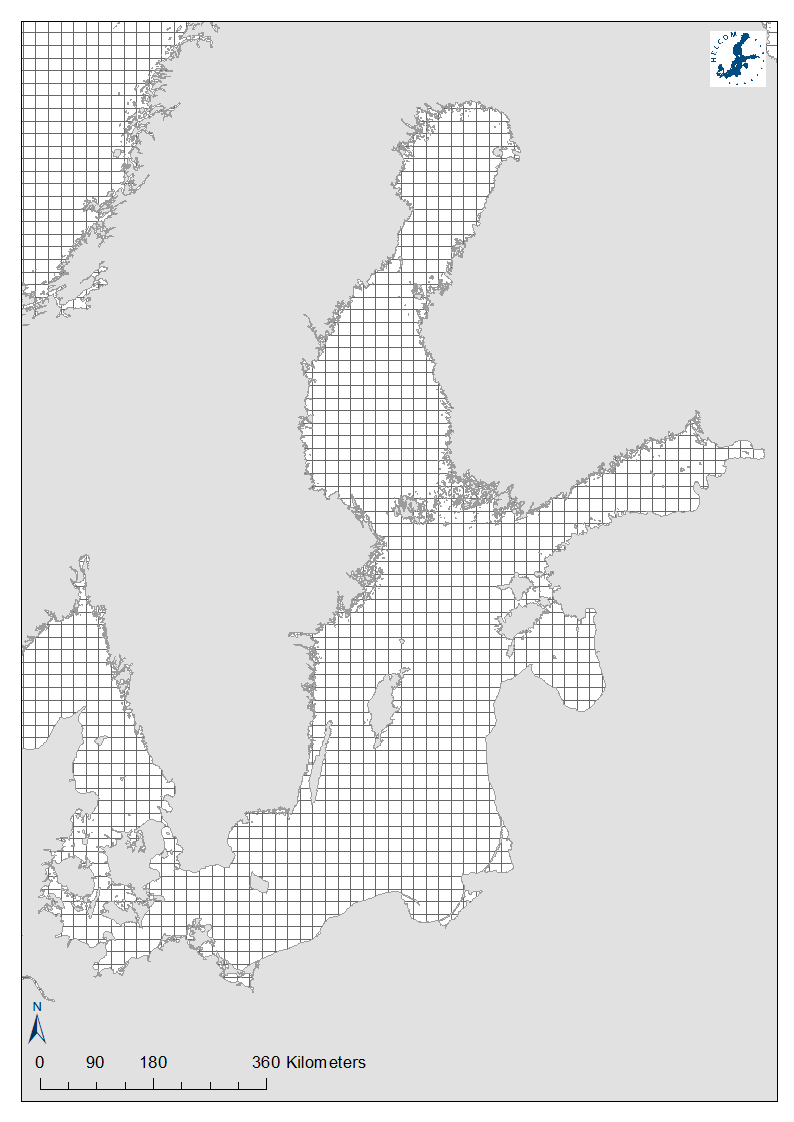
Figure 9. Earth observation data are reported as 20K grid cells.
In coastal areas the indicator is assessed using comparable indicators developed nationally for the purposes of assessments under the EU Water Framework Directive and data can be derived from different seasons (see Results table 2).
9.3 Monitoring and reporting requirements
Monitoring methodology
Monitoring of chlorophyll-a in the Contracting Parties of HELCOM is described on a general level in the HELCOM Monitoring Manual in the sub-programme Pigments. The sampling strategy is described in more detail in the Monitoring guidelines, which are adopted and published.
Data is reported annually to the COMBINE database hosted by ICES.
Current monitoring
The monitoring activities relevant to the indicator that are currently carried out by HELCOM Contracting Parties as described in the HELCOM Monitoring Manual in the sub-programme: Pigments.
Description of optimal monitoring
Regional monitoring of chlorophyll-a concentration is considered sufficient to support the indicator evaluation.
10. Data
The data and resulting data products (e.g., tables, figures and maps) available on the indicator web page can be used freely given that it is used appropriately, and the source is cited.
Data: Chlorophyll-a – Ferry Box
Data: Chlorophyll-a – Earth Observation
Data source: The average chlorophyll-a is a combined estimate of three types of data:
1) In situ monitoring data provided by the HELCOM Contracting Parties, and kept in the HELCOM COMBINE database, hosted by ICES (www.ices.dk), added with data from the Gulf of Finland year database, hosted by the Finnish Environment Institute.
2) The original source of the satellite-based EO-chl-a dataset is calculated at SYKE. It has been validated by SYKE and kept at the eutrophication assessment database hosted by ICES.
3) FerryBox flow-through data is reported to ICES by Contracting Parties, to be included into the eutrophication assessment database. It is reported according to the QA/QC guidance for FerryBox Flow-through information, providing adequate metadata and quality information, including the following:
- (arithmetic and) geometric mean
- mode (most frequently occurring value in dataset)
- standard deviation
- percentiles (5,25, 50, 75, 95)
- N of observations that were used to derive statistics
Geographical coverage: The observations are distributed in the sub-basins according to the HELCOM monitoring programme, added occasionally with data from research cruises. In situ and EO data were used in all open-sea assessment units, whereas FB data was used in the Northern Baltic Proper and Gulf of Finland Western assessment units.
Temporal coverage: The estimates are based on observations made between June–September. Estimates include observations made during 2016–2021.
Data aggregation: The 2016–2021 value for each assessment unit was estimated as an inter-annual summer (June-September) average.
11. Contributors
Vivi Fleming-Lehtinen, Laura Hoikkala and Jenni Attila of the Finnish Environment Institute, SYKE, Finland
HELCOM Expert Group on Eutrophication (EG EUTRO)
HELCOM Secretariat: Joni Kaitaranta, Laura Kaikkonen, Theodor Hüttel.
12. Archive
This version of the HELCOM core indicator report was published in April 2023:
The current version of this indicator (including as a PDF) can be found on the HELCOM indicator web page.
Earlier versions of the core indicator report include:
Chlorophyll a HELCOM core indicator 2018 (pdf)
HOLAS II component – Core indicator report – web-based version July 2017 (pdf)
13. References
Conley, D. J., Humborg, C., Rahm, L., Savchuk, O. P., Wulff, F. (2002) Hypoxia in the Baltic Sea and basin-scale changes in phosphorus biogeochemistry. Environ. Sci. Technol. 36, 5315–5320.
Conley, D. J., Björck, S., Bonsdorff, E., Carstensen, J., Destouni, G., Gustafsson, B. G., Hietanen, S., Kortekaas, M., Kuosa, H., Meier, M., Müller-Karulis, B., Nordberg, K., Nürnberg, G., Norkko, A., Pitkänen, H.; Rabalais, N. N., Rosenberg, R., Savchuk, O. P., Slomp, C. P., Voss, M., Wulff, F., Zillén, L. (2009) Hypoxia-related processes in the Baltic Sea. Environ. Sci. Technol. 43, 3412–3420.
Directive 2000/60/EC of the European Parliament and of the Council of 23 October 2000 establishing a framework for community action in the field of water policy. Official Journal of the European Communities L 327/1.
Directive 2008/56/EC of the European Parliament and of the Council. 17 June 2008. Establishing a Framework for Community Action in the Field of Marine Environmental Policy. Marine Strategy Framework Directive. 22p.
Fleming-Lehtinen V., M. Laamanen, H. Kuosa, H. Hahti, R. Olsonen (2008) Long-term development of inorganic nutrients and chlorophyll a in the open Northern Baltic Sea area. Ambio 37:86-92.
HELCOM (2009) Eutrophication in the Baltic Sea – An Integrated Thematic Assessment of the Effects of Nutrient Enrichment and Eutrophication in the Baltic Sea Region. Balt. Sea Environ. Proc. No. 115B, 148.
HELCOM (2013) Approaches and methods for eutrophication target setting in the Baltic Sea region. Balt. Sea Environ. Proc. No. 133
HELCOM (2021) HELCOM Baltic Sea Action Plan– 2021update. https://helcom.fi/baltic-sea-action-plan/
HELCOM and Baltic Earth (2021) Climate Change in the Baltic Sea. 2021 Fact Sheet. Baltic Sea Environment Proceedings n°180. HELCOM/Baltic Earth 2021.: https://helcom.fi/wp-content/uploads/2021/09/Baltic-Sea-Climate-Change-Fact-Sheet-2021.pdf
Vahtera E., Conley D.J., Gustafsson B.G., Kuosa H., Pitkänen H., Savchuk O.P., Tamminen T., Viitasalo M., Voss M., Wasmund N., Wulff F. (2007). Internal ecosystem feedbacks enhance nitrogen-fixing cyanobacteria blooms and complicate management in the Baltic Sea. Ambio 36:186-194.
14. Other relevant resources
Eutrophication status of the Baltic Sea 2007-2011 – A concise thematic assessment (2014)
Approaches and methods for eutrophication target setting in the Baltic Sea region (2013)
HELCOM core indicators. Final report of the HELCOM CORESET project (2013)
Development of tools for assessment of eutrophication in the Baltic Sea (2006)
Annex providing data type specific overall, accuracy, spatial and temporal confidence

Annex figure 1. Data type specific confidence for In situ data regarding Overall Confidence (C), Accuracy Class (ACC), Spatial Confidence (SC) and Temporal Confidence (TC). Low indicator confidence calls for increase in monitoring.
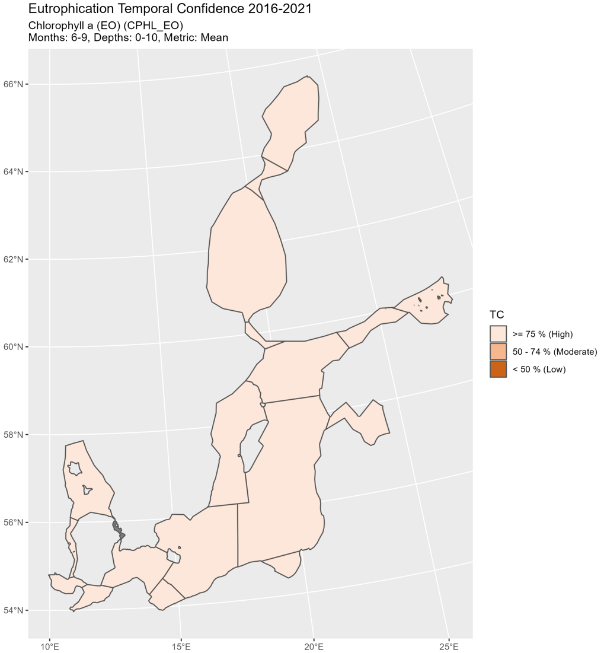
Annex figure 2. Data type specific confidence for Earth observations (EO) regarding Overall Confidence (C), Accuracy Class (ACC), Spatial Confidence (SC) and Temporal Confidence (TC).

Annex figure 3. Data type specific confidence for Ferrybox (FB) regarding Overall Confidence (C), Accuracy Class (ACC), Spatial Confidence (SC) and Temporal Confidence (TC). Low indicator confidence calls for increase in monitoring.
Annex providing overview of additional coastal evaluations reported by certain Contracting Parties.
Annex table 1. Results for national coastal chlorophyll-a indicators by coastal WFD water type/water body. The table includes information on the assessment unit (CODE, defined in the HELCOM Monitoring and Assessment Strategy Annex 4), assessment period (start year and end year), average concentration (µg l-1) during assessment period (ES) with standard deviation (SD), threshold values (ET) measured in µg l-1, units, Ecological Quality Ratio (EQR) and Ecological Quality Ratio Scaled (EQRS). EQRS shows the present concentration in relation to the threshold value, decreasing along with increasing eutrophication. EQRS_class estimates the ecological status based on the EQRS value.
| Indicator ID | Data name | UnitID | HELCOMAU | Unit Code/ Information | Assessment Unit | Period | ES | EQR | EQRS | EQRS_Class |
| 1010 | Phytoplankton biovolume | 1001 | GER-001 | mesohaline inner coastal waters, Wismarbucht, Suedteil | Bay of Mecklenburg | 20182018 | 0.57 | Moderate | ||
| 1010 | Phytoplankton biovolume | 1002 | GER-002 | mesohaline inner coastal waters, Wismarbucht, Nordteil | Bay of Mecklenburg | 20182018 | 0.57 | Moderate | ||
| 1010 | Phytoplankton biovolume | 1003 | GER-003 | mesohaline inner coastal waters, Wismarbucht, Salzhaff | Bay of Mecklenburg | 20182018 | 0.52 | Moderate | ||
| 1010 | Phytoplankton biovolume | 1004 | GER-004 | mesohaline open coastal waters, Suedliche Mecklenburger Bucht/ Travemuende bis Warnemünde | Bay of Mecklenburg | 20182018 | 0.50 | Moderate | ||
| 1010 | Phytoplankton biovolume | 1005 | GER-005 | mesohaline inner coastal waters, Unterwarnow | Bay of Mecklenburg | 20182018 | 0.52 | Moderate | ||
| 1010 | Phytoplankton biovolume | 1006 | GER-006 | mesohaline open coastal waters, Suedliche Mecklenburger Bucht/ Warnemünde bis Darss | Bay of Mecklenburg | 20182018 | 0.43 | Moderate | ||
| 1010 | Phytoplankton biovolume | 1007 | GER-007 | oligohaline inner coastal waters, Ribnitzer See / Saaler Bodden | Arkona Basin | 20182018 | 0.18 | Bad | ||
| 1010 | Phytoplankton biovolume | 1008 | GER-008 | oligohaline inner coastal waters, Koppelstrom / Bodstedter Bodden | Arkona Basin | 20182018 | 0.26 | Poor | ||
| 1010 | Phytoplankton biovolume | 1009 | GER-009 | mesohaline inner coastal waters, Barther Bodden, Grabow | Arkona Basin | 20182018 | 0.18 | Bad | ||
| 1010 | Phytoplankton biovolume | 1010 | GER-010 | mesohaline open coastal waters, Prerowbucht/ Darsser Ort bis Dornbusch | Arkona Basin | 20182018 | 0.87 | High | ||
| 1010 | Phytoplankton biovolume | 1011 | GER-011 | mesohaline inner coastal waters, Westruegensche Bodden | Arkona Basin | 20182018 | 0.38 | Poor | ||
| 1010 | Phytoplankton biovolume | 1012 | GER-012 | mesohaline inner coastal waters, Strelasund | Arkona Basin | 20182018 | 0.37 | Poor | ||
| 1010 | Phytoplankton biovolume | 1013 | GER-013 | mesohaline inner coastal waters, Greifswalder Bodden | Arkona Basin | 20182018 | 0.38 | Poor | ||
| 1010 | Phytoplankton biovolume | 1014 | GER-014 | mesohaline inner coastal waters, Kleiner Jasmunder Bodden | Arkona Basin | 20182018 | 0.18 | Bad | ||
| 1010 | Phytoplankton biovolume | 1015 | GER-015 | mesohaline open coastal waters, Nord- und Ostruegensche Gewaesser | Arkona Basin | 20182018 | 0.51 | Moderate | ||
| 1010 | Phytoplankton biovolume | 1016 | GER-016 | oligohaline inner coastal waters, Peenestrom | Bornholm Basin | 20182018 | 0.27 | Poor | ||
| 1010 | Phytoplankton biovolume | 1017 | GER-017 | oligohaline inner coastal waters, Achterwasser | Bornholm Basin | 20182018 | 0.24 | Poor | ||
| 1010 | Phytoplankton biovolume | 1018 | GER-018 | mesohaline open coastal waters, Pommersche Bucht, Nordteil | Arkona Basin | 20182018 | 0.35 | Poor | ||
| 1010 | Phytoplankton biovolume | 1019 | GER-019 | mesohaline open coastal waters, Pommersche Bucht, Südteil | Bornholm Basin | 20182018 | 0.28 | Poor | ||
| 1010 | Phytoplankton biovolume | 1020 | GER-020 | oligohaline inner coastal waters, Kleines Haff | Bornholm Basin | 20182018 | 0.28 | Poor | ||
| 1005 | Chlorophyll a (In-Situ) | 1021 | GER-021 | mesohaline inner coastal waters, Flensburg Innenfoerde | Kiel Bay | 20182018 | 5.09 | 0.26 | 0.13 | Bad |
| 1005 | Chlorophyll a (In-Situ) | 1022 | GER-022 | mesohaline open coastal waters, Geltinger Bucht | Kiel Bay | 20182018 | 2.04 | 0.64 | 0.56 | Moderate |
| 1005 | Chlorophyll a (In-Situ) | 1023 | GER-023 | meso- to polyhaline open coastal waters, seasonally stratified, Flensburger Aussenfoerde | Kiel Bay | 20182018 | 2.04 | 0.64 | 0.56 | Moderate |
| 1005 | Chlorophyll a (In-Situ) | 1024 | GER-024 | mesohaline open coastal waters, Aussenschlei | Kiel Bay | 20182018 | 2.06 | 0.63 | 0.55 | Moderate |
| 1005 | Chlorophyll a (In-Situ) | 1025 | GER-025 | mesohaline inner coastal waters, Schleimuende | Kiel Bay | 20182018 | 21.68 | 0.06 | 0.03 | Bad |
| 1005 | Chlorophyll a (In-Situ) | 1026 | GER-026A | A.mesohaline inner coastal waters, Mittlere Schlei | Kiel Bay | 20182018 | 53.31 | 0.03 | 0.02 | Bad |
| 1005 | Chlorophyll a (In-Situ) | 1027 | GER-026B | B.mesohaline inner coastal waters, Mittlere Schlei | Kiel Bay | 20182018 | 68.37 | 0.02 | 0.01 | Bad |
| 1005 | Chlorophyll a (In-Situ) | 1028 | GER-027 | mesohaline inner coastal waters, Innere Schlei | Kiel Bay | 20182018 | 68.37 | 0.02 | 0.01 | Bad |
| 1005 | Chlorophyll a (In-Situ) | 1029 | GER-028 | mesohaline open coastal waters, Eckerfoerder Bucht, Rand | Kiel Bay | 20182018 | 1.73 | 0.75 | 0.72 | Good |
| 1005 | Chlorophyll a (In-Situ) | 1030 | GER-029 | meso- to polyhaline open coastal waters, seasonally stratified, Eckerfoerderbucht, Tiefe | Kiel Bay | 20182018 | 1.97 | 0.66 | 0.59 | Moderate |
| 1005 | Chlorophyll a (In-Situ) | 1031 | GER-030 | mesohaline open coastal waters, Buelk | Kiel Bay | 20182018 | 1.97 | 0.66 | 0.59 | Moderate |
| 1005 | Chlorophyll a (In-Situ) | 1032 | GER-031 | meso- to polyhaline open coastal waters, seasonally stratified, Kieler Aussenfoerde | Kiel Bay | 20182018 | 2.04 | 0.64 | 0.56 | Moderate |
| 1005 | Chlorophyll a (In-Situ) | 1033 | GER-032 | mesohaline inner coastal waters, Kieler Innenfoerde | Kiel Bay | 20182018 | 4.53 | 0.29 | 0.15 | Bad |
| 1005 | Chlorophyll a (In-Situ) | 1034 | GER-033 | mesohaline open coastal waters, Probstei | Kiel Bay | 20182018 | 1.80 | 0.72 | 0.68 | Good |
| 1005 | Chlorophyll a (In-Situ) | 1035 | GER-034 | mesohaline open coastal waters, Putlos | Kiel Bay | 20182018 | 1.80 | 0.72 | 0.68 | Good |
| 1005 | Chlorophyll a (In-Situ) | 1036 | GER-035 | meso- to polyhaline open coastal waters, seasonally stratified, Hohwachter Bucht | Kiel Bay | 20182018 | 1.65 | 0.79 | 0.77 | Good |
| 1005 | Chlorophyll a (In-Situ) | 1037 | GER-036A | A.mesohaline open coastal waters, Fehmarnsund | Kiel Bay | 20182018 | 1.77 | 0.74 | 0.70 | Good |
| 1005 | Chlorophyll a (In-Situ) | 1038 | GER-036B | B.mesohaline open coastal waters, Fehmarnsund | Bay of Mecklenburg | 20182018 | 1.79 | 0.73 | 0.69 | Good |
| 1005 | Chlorophyll a (In-Situ) | 1039 | GER-037 | mesohaline inner coastal waters, Orther Bucht | Kiel Bay | 20182018 | 1.86 | 0.70 | 0.64 | Good |
| 1005 | Chlorophyll a (In-Situ) | 1040 | GER-038A | A.mesohaline open coastal waters, Fehmarnbelt | Kiel Bay | 20182018 | 1.47 | 0.88 | 0.88 | High |
| 1005 | Chlorophyll a (In-Situ) | 1041 | GER-038B | B.mesohaline open coastal waters, Fehmarnbelt | Bay of Mecklenburg | 20182018 | 1.47 | 0.88 | 0.88 | High |
| 1005 | Chlorophyll a (In-Situ) | 1042 | GER-039 | meso- to polyhaline open coastal waters, seasonally stratified, Fehmarn Sund Ost | Bay of Mecklenburg | 20182018 | 1.59 | 0.82 | 0.81 | High |
| 1005 | Chlorophyll a (In-Situ) | 1043 | GER-040 | mesohaline open coastal waters, Groemitz | Bay of Mecklenburg | 20182018 | 2.13 | 0.61 | 0.52 | Moderate |
| 1005 | Chlorophyll a (In-Situ) | 1044 | GER-041 | mesohaline open coastal waters, Neustaedter Bucht | Bay of Mecklenburg | 20182018 | 2.20 | 0.59 | 0.49 | Moderate |
| 1005 | Chlorophyll a (In-Situ) | 1045 | GER-042 | mesohaline inner coastal waters, Travemuende | Bay of Mecklenburg | 20182018 | 19.77 | 0.07 | 0.03 | Bad |
| 1005 | Chlorophyll a (In-Situ) | 1046 | GER-043 | mesohaline inner coastal waters, Poetenitzer Wiek | Bay of Mecklenburg | 20182018 | 19.77 | 0.08 | 0.04 | Bad |
| 1005 | Chlorophyll a (In-Situ) | 1047 | GER-044 | mesohaline inner coastal waters, Untere Trave | Bay of Mecklenburg | 20182018 | 20.19 | 0.08 | 0.04 | Bad |
| 1010 | Phytoplankton biovolume | 1048 | GER-111 | mesohaline inner coastal waters, Nordruegensche Bodden | Arkona Basin | 20182018 | 0.22 | Poor | ||
| 2005 | Chlorophyll a (In-Situ_EO_FB) | 2001 | DEN-001 | Roskilde Fjord, ydre | Kattegat | 20162021 | 0.43 | 0.41 | Moderate | |
| 2005 | Chlorophyll a (In-Situ_EO_FB) | 2002 | DEN-002 | Roskilde Fjord, indre | Kattegat | 20162021 | 0.60 | 0.56 | Moderate | |
| 2005 | Chlorophyll a (In-Situ_EO_FB) | 2016 | DEN-016 | Korsør Nor | Great Belt | 20162021 | 0.67 | 0.64 | Good | |
| 2005 | Chlorophyll a (In-Situ_EO_FB) | 2017 | DEN-017 | Basnæs Nor | Great Belt | 20162021 | 0.95 | 0.95 | High | |
| 2005 | Chlorophyll a (In-Situ_EO_FB) | 2018 | DEN-018 | Holsteinborg Nor | Great Belt | 20162021 | 1.09 | 1.09 | High | |
| 2005 | Chlorophyll a (In-Situ_EO_FB) | 2024 | DEN-024 | Isefjord, ydre | Kattegat | 20162021 | 0.42 | 0.39 | Poor | |
| 2005 | Chlorophyll a (In-Situ_EO_FB) | 2025 | DEN-025 | Skælskør Fjord og Nor | Great Belt | 20162021 | 0.37 | 0.35 | Poor | |
| 2005 | Chlorophyll a (In-Situ_EO_FB) | 2029 | DEN-029 | Kalundborg Fjord | Great Belt | 20162021 | 0.47 | 0.44 | Moderate | |
| 2005 | Chlorophyll a (In-Situ_EO_FB) | 2034 | DEN-034 | Smålandsfarvandet, syd | Great Belt | 20162021 | 0.68 | 0.68 | Good | |
| 2005 | Chlorophyll a (In-Situ_EO_FB) | 2035 | DEN-035 | Karrebæk Fjord | Great Belt | 20162021 | 0.68 | 0.68 | Good | |
| 2005 | Chlorophyll a (In-Situ_EO_FB) | 2036 | DEN-036 | Dybsø Fjord | Great Belt | 20162021 | 0.71 | 0.71 | Good | |
| 2005 | Chlorophyll a (In-Situ_EO_FB) | 2037 | DEN-037 | Avnø Fjord | Great Belt | 20162021 | 0.77 | 0.77 | Good | |
| 2005 | Chlorophyll a (In-Situ_EO_FB) | 2044 | DEN-044 | Hjelm Bugt | Arkona Basin | 20162021 | 0.43 | 0.41 | Moderate | |
| 2005 | Chlorophyll a (In-Situ_EO_FB) | 2046 | DEN-046 | Fakse Bugt | Arkona Basin | 20162021 | 0.44 | 0.43 | Moderate | |
| 2005 | Chlorophyll a (In-Situ_EO_FB) | 2047 | DEN-047 | Præstø Fjord | Arkona Basin | 20162021 | 0.42 | 0.41 | Moderate | |
| 2005 | Chlorophyll a (In-Situ_EO_FB) | 2048 | DEN-048 | Stege Bugt | Arkona Basin | 20162021 | 0.74 | 0.75 | Good | |
| 2005 | Chlorophyll a (In-Situ_EO_FB) | 2049 | DEN-049 | Stege Nor | Arkona Basin | 20162021 | 0.30 | 0.29 | Poor | |
| 2005 | Chlorophyll a (In-Situ_EO_FB) | 2059 | DEN-059 | Nærå Strand | Great Belt | 20162021 | 0.31 | 0.29 | Poor | |
| 2005 | Chlorophyll a (In-Situ_EO_FB) | 2062 | DEN-062 | Lillestrand | Great Belt | 20162021 | 0.47 | 0.44 | Moderate | |
| 2005 | Chlorophyll a (In-Situ_EO_FB) | 2068 | DEN-068 | Lindelse Nor | Great Belt | 20162021 | 1.13 | 1.13 | High | |
| 2005 | Chlorophyll a (In-Situ_EO_FB) | 2072 | DEN-072 | Kløven | Great Belt | 20162021 | 0.60 | 0.60 | Moderate | |
| 2005 | Chlorophyll a (In-Situ_EO_FB) | 2074 | DEN-074 | Bredningen | Great Belt | 20162021 | 0.22 | 0.22 | Poor | |
| 2005 | Chlorophyll a (In-Situ_EO_FB) | 2080 | DEN-080 | Gamborg Fjord | Great Belt | 20162021 | 0.40 | 0.40 | Moderate | |
| 2005 | Chlorophyll a (In-Situ_EO_FB) | 2082 | DEN-082 | Aborg Minde Nor | Great Belt | 20162021 | 0.20 | 0.20 | Poor | |
| 2005 | Chlorophyll a (In-Situ_EO_FB) | 2083 | DEN-083 | Holckenhavn Fjord | Great Belt | 20162021 | 0.23 | 0.22 | Poor | |
| 2005 | Chlorophyll a (In-Situ_EO_FB) | 2084 | DEN-084 | Kerteminde Fjord | Great Belt | 20162021 | 0.37 | 0.35 | Poor | |
| 2005 | Chlorophyll a (In-Situ_EO_FB) | 2085 | DEN-085 | Kertinge Nor | Great Belt | 20162021 | 0.41 | 0.38 | Poor | |
| 2005 | Chlorophyll a (In-Situ_EO_FB) | 2086 | DEN-086 | Nyborg Fjord | Great Belt | 20162021 | 0.40 | 0.38 | Poor | |
| 2005 | Chlorophyll a (In-Situ_EO_FB) | 2087 | DEN-087 | Helnæs Bugt | Great Belt | 20162021 | 0.24 | 0.24 | Poor | |
| 2005 | Chlorophyll a (In-Situ_EO_FB) | 2089 | DEN-089 | Lunkebugten | Great Belt | 20162021 | 0.35 | 0.35 | Poor | |
| 2005 | Chlorophyll a (In-Situ_EO_FB) | 2090 | DEN-090 | Langelandssund | Great Belt | 20162021 | 0.44 | 0.44 | Moderate | |
| 2005 | Chlorophyll a (In-Situ_EO_FB) | 2092 | DEN-092 | Odense Fjord, ydre | Great Belt | 20162021 | 0.48 | 0.45 | Moderate | |
| 2005 | Chlorophyll a (In-Situ_EO_FB) | 2093 | DEN-093 | Odense Fjord, Seden Strand | Great Belt | 20162021 | 0.74 | 0.70 | Good | |
| 2005 | Chlorophyll a (In-Situ_EO_FB) | 2101 | DEN-101 | Genner Bugt | Great Belt | 20162021 | 0.23 | 0.23 | Poor | |
| 2005 | Chlorophyll a (In-Situ_EO_FB) | 2102 | DEN-102 | Åbenrå Fjord | Great Belt | 20162021 | 0.18 | 0.18 | Bad | |
| 2005 | Chlorophyll a (In-Situ_EO_FB) | 2103 | DEN-103 | Als Fjord | Great Belt | 20162021 | 0.26 | 0.26 | Poor | |
| 2005 | Chlorophyll a (In-Situ_EO_FB) | 2105 | DEN-105 | Augustenborg Fjord | Great Belt | 20162021 | 0.37 | 0.37 | Poor | |
| 2005 | Chlorophyll a (In-Situ_EO_FB) | 2106 | DEN-106 | Haderslev Fjord | Great Belt | 20162021 | 0.13 | 0.13 | Bad | |
| 2005 | Chlorophyll a (In-Situ_EO_FB) | 2108 | DEN-108 | Avnø Vig | Great Belt | 20162021 | 0.28 | 0.28 | Poor | |
| 2005 | Chlorophyll a (In-Situ_EO_FB) | 2109 | DEN-109 | Hejlsminde Nor | Great Belt | 20162021 | 0.38 | 0.38 | Poor | |
| 2005 | Chlorophyll a (In-Situ_EO_FB) | 2110 | DEN-110 | Nybøl Nor | Great Belt | 20162021 | 0.38 | 0.38 | Poor | |
| 2005 | Chlorophyll a (In-Situ_EO_FB) | 2113 | DEN-113 | Flensborg Fjord, indre | Great Belt | 20162021 | 0.19 | 0.19 | Bad | |
| 2005 | Chlorophyll a (In-Situ_EO_FB) | 2114 | DEN-114 | Flensborg Fjord, ydre | Great Belt | 20162021 | 0.38 | 0.38 | Poor | |
| 2005 | Chlorophyll a (In-Situ_EO_FB) | 2123 | DEN-123 | Vejle Fjord, indre | Great Belt | 20162021 | 0.50 | 0.47 | Moderate | |
| 2005 | Chlorophyll a (In-Situ_EO_FB) | 2124 | DEN-124 | Kolding Fjord, indre | Great Belt | 20162021 | 0.24 | 0.23 | Poor | |
| 2005 | Chlorophyll a (In-Situ_EO_FB) | 2125 | DEN-125 | Kolding Fjord, ydre | Great Belt | 20162021 | 0.18 | 0.17 | Bad | |
| 2005 | Chlorophyll a (In-Situ_EO_FB) | 2128 | DEN-128 | Horsens Fjord, indre | Great Belt | 20162021 | 0.24 | 0.23 | Poor | |
| 2005 | Chlorophyll a (In-Situ_EO_FB) | 2136 | DEN-136 | Randers Fjord, indre | Kattegat | 20162021 | 0.53 | 0.50 | Moderate | |
| 2005 | Chlorophyll a (In-Situ_EO_FB) | 2137 | DEN-137 | Randers Fjord, ydre | Kattegat | 20162021 | 0.77 | 0.73 | Good | |
| 2005 | Chlorophyll a (In-Situ_EO_FB) | 2141 | DEN-141 | Ebeltoft Vig | Great Belt | 20162021 | 0.78 | 0.75 | Good | |
| 2005 | Chlorophyll a (In-Situ_EO_FB) | 2142 | DEN-142 | Stavns Fjord | Great Belt | 20162021 | 0.75 | 0.72 | Good | |
| 2005 | Chlorophyll a (In-Situ_EO_FB) | 2144 | DEN-144 | Knebel Vig | Great Belt | 20162021 | 0.45 | 0.42 | Moderate | |
| 2005 | Chlorophyll a (In-Situ_EO_FB) | 2145 | DEN-145 | Kalø Vig | Great Belt | 20162021 | 0.51 | 0.48 | Moderate | |
| 2005 | Chlorophyll a (In-Situ_EO_FB) | 2146 | DEN-146 | Norsminde Fjord | Great Belt | 20162021 | 0.58 | 0.54 | Moderate | |
| 2005 | Chlorophyll a (In-Situ_EO_FB) | 2147 | DEN-147 | Århus Bugt og Begtrup Vig | Great Belt | 20162021 | 0.51 | 0.48 | Moderate | |
| 2005 | Chlorophyll a (In-Situ_EO_FB) | 2157 | DEN-157 | Bjørnholms Bugt, Riisgårde Bredning, Skive Fjord og Lovns Bredning | Kattegat | 20162021 | 0.11 | 0.10 | Bad | |
| 2005 | Chlorophyll a (In-Situ_EO_FB) | 2158 | DEN-158 | Hjarbæk Fjord | Kattegat | 20162021 | 0.12 | 0.11 | Bad | |
| 2005 | Chlorophyll a (In-Situ_EO_FB) | 2159 | DEN-159 | Mariager Fjord, indre | Kattegat | 20162021 | 0.06 | 0.06 | Bad | |
| 2005 | Chlorophyll a (In-Situ_EO_FB) | 2160 | DEN-160 | Mariager Fjord, ydre | Kattegat | 20162021 | 0.36 | 0.33 | Poor | |
| 2005 | Chlorophyll a (In-Situ_EO_FB) | 2165 | DEN-165 | Isefjord, indre | Kattegat | 20162021 | 0.43 | 0.40 | Moderate | |
| 2005 | Chlorophyll a (In-Situ_EO_FB) | 2200 | DEN-200 | Kattegat, Nordsjælland | Kattegat | 20162021 | 0.57 | 0.53 | Moderate | |
| 2005 | Chlorophyll a (In-Situ_EO_FB) | 2201 | DEN-201 | Køge Bugt | Arkona Basin | 20162021 | 0.32 | 0.31 | Poor | |
| 2005 | Chlorophyll a (In-Situ_EO_FB) | 2204 | DEN-204 | Jammerland Bugt og Musholm Bugt | Great Belt | 20162021 | 0.53 | 0.49 | Moderate | |
| 2005 | Chlorophyll a (In-Situ_EO_FB) | 2206 | DEN-206 | Smålandsfarvandet, åbne del | Great Belt | 20162021 | 0.44 | 0.44 | Moderate | |
| 2005 | Chlorophyll a (In-Situ_EO_FB) | 2207 | DEN-207 | Nakskov Fjord | Great Belt | 20162021 | 0.89 | 0.89 | High | |
| 2005 | Chlorophyll a (In-Situ_EO_FB) | 2209 | DEN-209 | Rødsand og Bredningen | Great BeltandBay of Mecklenburg | 20162021 | 0.28 | 0.28 | Poor | |
| 2005 | Chlorophyll a (In-Situ_EO_FB) | 2212 | DEN-212 | Faaborg Fjord | Great Belt | 20162021 | 0.36 | 0.36 | Poor | |
| 2005 | Chlorophyll a (In-Situ_EO_FB) | 2214 | DEN-214 | Det Sydfynske Øhav | Great Belt | 20162021 | 0.28 | 0.28 | Poor | |
| 2005 | Chlorophyll a (In-Situ_EO_FB) | 2216 | DEN-216 | Lillebælt, syd | Great Belt | 20162021 | 0.28 | 0.28 | Poor | |
| 2005 | Chlorophyll a (In-Situ_EO_FB) | 2217 | DEN-217 | Lillebælt, Bredningen | Great Belt | 20162021 | 0.32 | 0.32 | Poor | |
| 2005 | Chlorophyll a (In-Situ_EO_FB) | 2219 | DEN-219 | Århus Bugt syd, Samsø og Nordlige Bælthav | Great Belt | 20162021 | 0.42 | 0.40 | Poor | |
| 2005 | Chlorophyll a (In-Situ_EO_FB) | 2222 | DEN-222 | Kattegat, Aalborg Bugt | Kattegat | 20162021 | 1.06 | 1.07 | High | |
| 2005 | Chlorophyll a (In-Situ_EO_FB) | 2224 | DEN-224 | Nordlige Lillebælt | Great Belt | 20162021 | 0.37 | 0.34 | Poor | |
| 2005 | Chlorophyll a (In-Situ_EO_FB) | 2232 | DEN-232 | Nissum Bredning | Kattegat | 20162021 | 0.32 | 0.30 | Poor | |
| 2005 | Chlorophyll a (In-Situ_EO_FB) | 2234 | DEN-234 | Løgstør Bredning | Kattegat | 20162021 | 0.20 | 0.19 | Bad | |
| 2005 | Chlorophyll a (In-Situ_EO_FB) | 2235 | DEN-235 | Nibe Bredning og Langerak | Kattegat | 20162021 | 0.27 | 0.26 | Poor | |
| 2005 | Chlorophyll a (In-Situ_EO_FB) | 2236 | DEN-236 | Thisted Bredning | Kattegat | 20162021 | 0.14 | 0.13 | Bad | |
| 2005 | Chlorophyll a (In-Situ_EO_FB) | 2238 | DEN-238 | Halkær Bredning | Kattegat | 20162021 | 0.12 | 0.11 | Bad | |
| 3004 | Chlorophyll a | 3001 | EST-001 | Narva-Kunda Bay CWB | Gulf of Finland | 20162021 | 0.52 | 0.51 | Moderate | |
| 3005 | Phytoplankton biomass | 3001 | EST-001 | Narva-Kunda Bay CWB | Gulf of Finland | 20162021 | 0.76 | 0.71 | Good | |
| 3004 | Chlorophyll a | 3002 | EST-002 | Eru-Käsmu Bay CWB | Gulf of Finland | 20162020 | 0.71 | 0.68 | Good | |
| 3005 | Phytoplankton biomass | 3002 | EST-002 | Eru-Käsmu Bay CWB | Gulf of Finland | 20162020 | 0.29 | 0.32 | Poor | |
| 3004 | Chlorophyll a | 3003 | EST-003 | Hara and Kolga Bay CWB | Gulf of Finland | 20212021 | 0.31 | 0.36 | Poor | |
| 3005 | Phytoplankton biomass | 3003 | EST-003 | Hara and Kolga Bay CWB | Gulf of Finland | 20212021 | 0.31 | 0.36 | Poor | |
| 3004 | Chlorophyll a | 3004 | EST-005 | Muuga-Tallinna-Kakumäe Bay CWB | Gulf of Finland | 20162021 | 0.48 | 0.47 | Moderate | |
| 3005 | Phytoplankton biomass | 3004 | EST-005 | Muuga-Tallinna-Kakumäe Bay CWB | Gulf of Finland | 20162021 | 0.20 | 0.19 | Bad | |
| 3004 | Chlorophyll a | 3005 | EST-006 | Pakri Bay CWB | Gulf of Finland | 20212021 | 0.39 | 0.43 | Moderate | |
| 3005 | Phytoplankton biomass | 3005 | EST-006 | Pakri Bay CWB | Gulf of Finland | 20212021 | 0.20 | 0.18 | Bad | |
| 3004 | Chlorophyll a | 3006 | EST-007 | Hiiu Shallow CWB | Gulf of Riga | 20212021 | 0.63 | 0.58 | Moderate | |
| 3005 | Phytoplankton biomass | 3006 | EST-007 | Hiiu Shallow CWB | Gulf of Riga | 20212021 | 0.17 | 0.16 | Bad | |
| 3004 | Chlorophyll a | 3007 | EST-008 | Haapsalu Bay CWB | Gulf of Riga | 20182021 | 0.26 | 0.27 | Poor | |
| 3005 | Phytoplankton biomass | 3007 | EST-008 | Haapsalu Bay CWB | Gulf of Riga | 20182021 | 0.19 | 0.17 | Bad | |
| 3004 | Chlorophyll a | 3008 | EST-009 | Matsalu Bay CWB | Gulf of Riga | 20212021 | 0.31 | 0.36 | Poor | |
| 3005 | Phytoplankton biomass | 3008 | EST-009 | Matsalu Bay CWB | Gulf of Riga | 20212021 | 0.20 | 0.18 | Bad | |
| 3004 | Chlorophyll a | 3009 | EST-010 | Soela Strait CWB | Northern Baltic Proper | 20212021 | 0.32 | 0.39 | Poor | |
| 3005 | Phytoplankton biomass | 3009 | EST-010 | Soela Strait CWB | Northern Baltic Proper | 20212021 | 0.79 | 0.75 | Good | |
| 3004 | Chlorophyll a | 3010 | EST-011 | Kihelkonna Bay CWB | Eastern Gotland Basin | 20212021 | 1.00 | 1.00 | High | |
| 3005 | Phytoplankton biomass | 3010 | EST-011 | Kihelkonna Bay CWB | Eastern Gotland Basin | 20212021 | 0.21 | 0.19 | Bad | |
| 3004 | Chlorophyll a | 3011 | EST-013 | Pärnu Bay CWB | Gulf of Riga | 20162021 | 0.50 | 0.50 | Moderate | |
| 3004 | Chlorophyll a | 3012 | EST-014 | Kassari-Õunaku Bay CWB | Gulf of Riga | 20162018 | 0.88 | 0.86 | High | |
| 3005 | Phytoplankton biomass | 3012 | EST-014 | Kassari-Õunaku Bay CWB | Gulf of Riga | 20162018 | 0.66 | 0.64 | Good | |
| 3004 | Chlorophyll a | 3013 | EST-016 | Väinameri CWB | Gulf of Riga | 20212021 | 0.61 | 0.57 | Moderate | |
| 3005 | Phytoplankton biomass | 3013 | EST-016 | Väinameri CWB | Gulf of Riga | 20212021 | 0.22 | 0.20 | Poor | |
| 3004 | Chlorophyll a | 3014 | EST-017 | NW part of the Gulf of Riga CWB | Gulf of Riga | 20212021 | ||||
| 3005 | Phytoplankton biomass | 3014 | EST-017 | NW part of the Gulf of Riga CWB | Gulf of Riga | 20212021 | ||||
| 3004 | Chlorophyll a | 3015 | EST-018 | NE part of the Gulf of Riga CWB | Gulf of Riga | 20212021 | ||||
| 3005 | Phytoplankton biomass | 3015 | EST-018 | NE part of the Gulf of Riga CWB | Gulf of Riga | 20212021 | ||||
| 3004 | Chlorophyll a | 3016 | EST-019 | Central part of the Gulf of Riga CWB | Gulf of Riga | 20212021 | 0.53 | 0.52 | Moderate | |
| 3005 | Phytoplankton biomass | 3016 | EST-019 | Central part of the Gulf of Riga CWB | Gulf of Riga | 20212021 | 0.80 | 0.76 | Good | |
| 4003 | Chlorophyll a (summer) | 4001 | FIN-001 | Lounainen sisäsaaristo | Åland Sea | 20112016 | 0.40 | Moderate | ||
| 4003 | Chlorophyll a (summer) | 4002 | FIN-002 | Lounainen ulkosaaristo | Åland Sea | 20112016 | 0.48 | Moderate | ||
| 4004 | Phytoplankton biomass | 4002 | FIN-002 | Lounainen ulkosaaristo | Åland Sea | 20112016 | 0.43 | Moderate | ||
| 4003 | Chlorophyll a (summer) | 4003 | FIN-003 | Suomenlahden sisäsaaristo | Gulf of Finland | 20112016 | 0.45 | Moderate | ||
| 4003 | Chlorophyll a (summer) | 4004 | FIN-004 | Suomenlahden ulkosaaristo | Gulf of Finland | 20112016 | 0.41 | Moderate | ||
| 4004 | Phytoplankton biomass | 4004 | FIN-004 | Suomenlahden ulkosaaristo | Gulf of Finland | 20112016 | 0.44 | Moderate | ||
| 4003 | Chlorophyll a (summer) | 4005 | FIN-005 | Lounainen välisaaristo | Åland Sea | 20112016 | 0.49 | Moderate | ||
| 4004 | Phytoplankton biomass | 4005 | FIN-005 | Lounainen välisaaristo | Åland Sea | 20112016 | 0.55 | Moderate | ||
| 4003 | Chlorophyll a (summer) | 4006 | FIN-006 | Merenkurkun sisäsaaristo | The Quark | 20112016 | 0.55 | Moderate | ||
| 4003 | Chlorophyll a (summer) | 4007 | FIN-007 | Merenkurkun ulkosaaristo | The Quark | 20112016 | 0.66 | Good | ||
| 4004 | Phytoplankton biomass | 4007 | FIN-007 | Merenkurkun ulkosaaristo | The Quark | 20112016 | 0.60 | Good | ||
| 4003 | Chlorophyll a (summer) | 4008 | FIN-008 | Selkämeren sisemmät rannikkovedet | Bothnian Sea | 20112016 | 0.53 | Moderate | ||
| 4003 | Chlorophyll a (summer) | 4009 | FIN-009 | Selkämeren ulommat rannikkovedet | Bothnian Sea | 20112016 | 0.59 | Moderate | ||
| 4004 | Phytoplankton biomass | 4009 | FIN-009 | Selkämeren ulommat rannikkovedet | Bothnian Sea | 20112016 | 0.56 | Moderate | ||
| 4003 | Chlorophyll a (summer) | 4010 | FIN-010 | Perämeren sisemmät rannikkovedet | Bothnian Bay | 20112016 | 0.54 | Moderate | ||
| 4003 | Chlorophyll a (summer) | 4011 | FIN-011 | Perämeren ulommat rannikkovedet | Bothnian Bay | 20112016 | 0.60 | Moderate | ||
| 4004 | Phytoplankton biomass | 4011 | FIN-011 | Perämeren ulommat rannikkovedet | Bothnian Bay | 20112016 | 0.72 | Good | ||
| 4003 | Chlorophyll a (summer) | 4012 | FIN-012 | Åland innerskärgård | Åland Sea | 20112016 | 0.46 | 0.47 | Moderate | |
| 4003 | Chlorophyll a (summer) | 4013 | FIN-013 | Åland mellanskärgård | Åland Sea | 20112016 | 0.54 | 0.52 | Moderate | |
| 4003 | Chlorophyll a (summer) | 4014 | FIN-014 | Åland ytterskärgård | Åland Sea | 20112016 | 0.52 | 0.50 | Moderate | |
| 7009 | Chlorophyll a (In-Situ_EO_FB) | 7001 | POL-001 | PL TW I WB 9 very sheltered, fully mixed, substratum: silt/sandy silt/silty sand; ice cover >90 days, water residence time 52 days | Bornholm Basin | 20162021 | 23.64 | 0.62 | 0.52 | Moderate |
| 7009 | Chlorophyll a (In-Situ_EO_FB) | 7002 | POL-002 | PL TW I WB 8 very sheltered, fully mixed, substratum: silt/sandy silt/silty sand; ice cover >90 days, water residence time 52 days | Bornholm Basin | 20162021 | 29.04 | 0.49 | 0.36 | Poor |
| 7009 | Chlorophyll a (In-Situ_EO_FB) | 7003 | POL-003 | PL TW I WB 1 very sheltered, fully mixed, substratum: silt/sandy silt/silty sand; ice cover >90 days, water residence time 52 days | Gdansk Basin | 20162021 | 69.57 | 0.23 | 0.12 | Bad |
| 7009 | Chlorophyll a (In-Situ_EO_FB) | 7004 | POL-004 | PL TW II WB 2 very sheltered, fully mixed, substratum: lagoonal fine snd medium grained sand/silty sand; residence time 138 day, ice cover >90 days | Gdansk Basin | 20162021 | 4.24 | 0.35 | 0.22 | Poor |
| 7010 | Chlorophyll a (In-Situ_EO_FB) | 7005 | POL-005 | PL TW III WB 3 partly protected, partly stratified, substratum: medium grained sand/pebbles/marine silty sand; ice-incidental | Gdansk Basin | 20162021 | 3.83 | 0.67 | 0.60 | Good |
| 7010 | Chlorophyll a (In-Situ_EO_FB) | 7006 | POL-006 | PL TW IV WB 4 partly stratified, moderately exposed, substratum: sand/silt; ice – incidental | Gdansk Basin | 20162021 | 4.96 | 0.51 | 0.37 | Poor |
| 7010 | Chlorophyll a (In-Situ_EO_FB) | 7007 | POL-007 | PL TW V WB 6 river mouth, partly stratified, partly sheltered, substratum: medium grained sand/silty sand | Bornholm Basin | 20162021 | 6.88 | 0.40 | 0.27 | Poor |
| 7010 | Chlorophyll a (In-Situ_EO_FB) | 7008 | POL-008 | PL TW V WB 5 river mouth, partly stratified, partly sheltered, substratum: medium grained sand/silty sand | Gdansk Basin | 20162021 | 9.65 | 0.41 | 0.27 | Poor |
| 7010 | Chlorophyll a (In-Situ_EO_FB) | 7009 | POL-009 | PL TW V WB 7 river mouth, partly stratified, partly sheltered, substratum: medium grained sand/silty sand | Bornholm Basin | 20162021 | 9.80 | 0.53 | 0.41 | Moderate |
| 7010 | Chlorophyll a (In-Situ_EO_FB) | 7010 | POL-010 | PL CWI WB2 coastal waters, moderately exposed, fully mixed, substratum:sand/fine sand | Gdansk Basin | 20162021 | 3.24 | 0.43 | 0.29 | Poor |
| 7010 | Chlorophyll a (In-Situ_EO_FB) | 7011 | POL-011 | PL CWI WB1 coastal waters, moderately exposed, fully mixed, substratum:sand/fine sand | Gdansk Basin | 20162021 | 11.03 | 0.26 | 0.15 | Bad |
| 7010 | Chlorophyll a (In-Situ_EO_FB) | 7012 | POL-012 | PL CWI WB3 coastal waters, moderately exposed, fully mixed, substratum:sand/fine sand | Gdansk Basin | 20162021 | 7.24 | 0.19 | 0.10 | Bad |
| 7010 | Chlorophyll a (In-Situ_EO_FB) | 7013 | POL-013 | PL CW II WB 8 central Polish coast, coastal waters, exposed, fully mixed, substratum: sand/pebbles/gravel | Bornholm Basin | 20162021 | 4.65 | 0.31 | 0.18 | Bad |
| 7010 | Chlorophyll a (In-Situ_EO_FB) | 7014 | POL-014 | PL CW II WB 6W central Polish coast, coastal waters, exposed, fully mixed, substratum: sand/pebbles/gravel | Bornholm Basin | 20162021 | 5.39 | 0.27 | 0.15 | Bad |
| 7010 | Chlorophyll a (In-Situ_EO_FB) | 7015 | POL-015 | PL CW II WB 6E central Polish coast, coastal waters, exposed, fully mixed, substratum: sand/pebbles/gravel | Bornholm Basin | 20162021 | 5.05 | 0.28 | 0.16 | Bad |
| 7010 | Chlorophyll a (In-Situ_EO_FB) | 7016 | POL-016 | PL CWII WB5 central Polish coast, coastal waters, exposed, fully mixed, substratum: sand/pebbles/gravel | Eastern Gotland Basin | 20162021 | 6.56 | 0.26 | 0.16 | Bad |
| 7010 | Chlorophyll a (In-Situ_EO_FB) | 7017 | POL-017 | PL CWII WB4 central Polish coast, coastal waters, exposed, fully mixed, substratum: sand/pebbles/gravel | Gdansk Basin | 20162021 | 2.71 | 0.54 | 0.43 | Moderate |
| 7010 | Chlorophyll a (In-Situ_EO_FB) | 7018 | POL-018 | PL CW III WB 9 central Polish coast, coastal waters, exposed, fully mixed, substratum: sand/pebbles/gravel | Bornholm Basin | 20162021 | 5.10 | 0.44 | 0.30 | Poor |
| 7010 | Chlorophyll a (In-Situ_EO_FB) | 7019 | POL-019 | PL CW III WB 7 central Polish coast, coastal waters, exposed, fully mixed, substratum: sand/pebbles/gravel | Bornholm Basin | 20162021 | 3.88 | 0.37 | 0.24 | Poor |
| 80051 | Chlorophyll a | 8001 | SWE-001 | 1s West Coast inner coastal water | Kattegat | 20182018 | 1.70 | 0.94 | 0.95 | High |
| 80051 | Chlorophyll a | 8002 | SWE-003 | 4 West Coast outer coastal water, Kattegat | Kattegat | 20182018 | 1.22 | 0.82 | 0.79 | Good |
| 80052 | Total phytoplankton biomass | 8002 | SWE-003 | 4 West Coast outer coastal water, Kattegat | Kattegat | 20182018 | 0.68 | 0.73 | 0.84 | High |
| 80051 | Chlorophyll a | 8003 | SWE-004 | 5 South Halland and north Öresund coastal water | Kattegat | 20182018 | 1.20 | 0.83 | 0.80 | High |
| 80052 | Total phytoplankton biomass | 8003 | SWE-004 | 5 South Halland and north Öresund coastal water | Kattegat | 20182018 | 0.89 | 0.79 | 0.90 | High |
| 80051 | Chlorophyll a | 8004 | SWE-005 | 6 Öresund inner coastal water | The Sound | 20172017 | 1.26 | 0.71 | 0.71 | Good |
| 80052 | Total phytoplankton biomass | 8004 | SWE-005 | 6 Öresund inner coastal water | The Sound | 20172017 | 0.28 | 0.90 | 0.95 | High |
| 80051 | Chlorophyll a | 8005 | SWE-006 | 7 Skåne coastal water | Arkona Basin | 20182018 | 1.74 | 0.69 | 0.64 | Good |
| 80052 | Total phytoplankton biomass | 8005 | SWE-006 | 7 Skåne coastal water | Arkona Basin | 20172017 | 0.19 | 0.96 | 0.97 | High |
| 80051 | Chlorophyll a | 8006 | SWE-007 | 8 Blekinge archipelago and Kalmarsund, inner | Western Gotland Basin | 20182018 | 2.75 | 0.53 | 0.51 | Moderate |
| 80051 | Chlorophyll a | 8007 | SWE-008 | 9 Blekinge archipelago and Kalmarsund, outer | Western Gotland Basin | 20182018 | 3.46 | 0.71 | 0.60 | Moderate |
| 80051 | Chlorophyll a | 8008 | SWE-009 | 10 Öland and Gotland coastal water | Eastern Gotland Basin | 20182018 | 4.11 | 0.34 | 0.39 | Poor |
| 80051 | Chlorophyll a | 8009 | SWE-010 | 11 Gotland north-west coastal water | Western Gotland Basin | 20182018 | 3.77 | 0.37 | 0.41 | Moderate |
| 80051 | Chlorophyll a | 8010 | SWE-011 | 12n Östergötland and Stockholm archipelago | Northern Baltic Proper | 20182018 | 3.41 | 0.46 | 0.47 | Moderate |
| 80051 | Chlorophyll a | 8011 | SWE-012 | 12s Östergötland and Stockholm archipelago | Western Gotland Basin | 20182018 | 3.28 | 0.46 | 0.47 | Moderate |
| 80051 | Chlorophyll a | 8012 | SWE-013 | 13 Östergötland inner coastal water | Western Gotland Basin | 20172017 | 6.01 | 0.32 | 0.37 | Poor |
| 80051 | Chlorophyll a | 8013 | SWE-014 | 14 Östergötland outer coastal water | Western Gotland Basin | 20172017 | 2.34 | 0.60 | 0.56 | Moderate |
| 80051 | Chlorophyll a | 8014 | SWE-015 | 15 Stockholm archipelago, outer coastal water | Northern Baltic Proper | 20182018 | 2.95 | 0.47 | 0.48 | Moderate |
| 80051 | Chlorophyll a | 8015 | SWE-016 | 16 South Bothnian Sea,inner coastal water | Bothnian Sea | 20182018 | 4.04 | 0.35 | 0.41 | Moderate |
| 80051 | Chlorophyll a | 8016 | SWE-017 | 17 South Bothnian Sea, outer coastal water | Bothnian Sea | 20182018 | 2.74 | 0.44 | 0.48 | Moderate |
| 80051 | Chlorophyll a | 8017 | SWE-018 | 18 North Bothnian Sea, Höga kusten, inner | Bothnian Sea | 20182018 | 2.73 | 0.51 | 0.53 | Moderate |
| 80052 | Total phytoplankton biomass | 8017 | SWE-018 | 18 North Bothnian Sea, Höga kusten, inner | Bothnian Sea | 20172017 | 0.38 | 0.54 | 0.68 | Good |
| 80051 | Chlorophyll a | 8019 | SWE-020 | 20 North Quark inner coastal water | The Quark | 20182018 | 3.67 | 0.35 | 0.45 | Moderate |
| 80051 | Chlorophyll a | 8019 | SWE-020 | 20 North Quark inner coastal water | The Quark | 20182018 | 3.67 | 0.35 | 0.45 | Moderate |
| 80052 | Total phytoplankton biomass | 8019 | SWE-020 | 20 North Quark inner coastal water | The Quark | 20172017 | 0.77 | 0.21 | 0.36 | Poor |
| 80051 | Chlorophyll a | 8020 | SWE-021 | 21 North Quark outer coastal water | The Quark | 20182018 | 2.24 | 0.54 | 0.57 | Moderate |
| 80051 | Chlorophyll a | 8020 | SWE-021 | 21 North Quark outer coastal water | The Quark | 20182018 | 2.24 | 0.54 | 0.57 | Moderate |
| 80052 | Total phytoplankton biomass | 8020 | SWE-021 | 21 North Quark outer coastal water | The Quark | 20172017 | 0.32 | 0.47 | 0.70 | Good |
| 80051 | Chlorophyll a | 8023 | SWE-024 | 24 Stockholm inner archipelago | Northern Baltic Proper | 20182018 | 5.56 | 0.36 | 0.41 | Moderate |
| 80051 | Chlorophyll a | 8023 | SWE-024 | 24 Stockholm inner archipelago | Northern Baltic Proper | 20182018 | 5.56 | 0.36 | 0.41 | Moderate |
| IndicatorID | Name | Period | Unit ID | HELCOMID | HELCOM ID description | Assessment Unit | ET | ES | SD | EQR | EQRS | EQRS Class |
| 1005 | Chlorophyll a (In-Situ) | 20132018 | 1021 | GER-021 | mesohaline inner coastal waters, Flensburg Innenfoerde | Kiel Bay | 1.95 | 5.09 | NA | 0.26 | 0.13 | Bad |
| 1005 | Chlorophyll a (In-Situ) | 20132018 | 1022 | GER-022 | mesohaline open coastal waters, Geltinger Bucht | Kiel Bay | 1.95 | 2.04 | NA | 0.64 | 0.56 | Moderate |
| 1005 | Chlorophyll a (In-Situ) | 20132018 | 1023 | GER-023 | meso- to polyhaline open coastal waters, seasonally stratified, Flensburger Aussenfoerde | Kiel Bay | 1.95 | 2.04 | NA | 0.64 | 0.56 | Moderate |
| 1005 | Chlorophyll a (In-Situ) | 20132018 | 1024 | GER-024 | mesohaline open coastal waters, Aussenschlei | Kiel Bay | 1.95 | 2.06 | NA | 0.63 | 0.55 | Moderate |
| 1005 | Chlorophyll a (In-Situ) | 20132018 | 1025 | GER-025 | mesohaline inner coastal waters, Schleimuende | Kiel Bay | 1.95 | 21.68 | NA | 0.06 | 0.03 | Bad |
| 1005 | Chlorophyll a (In-Situ) | 20132018 | 1026 | GER-026A | A.mesohaline inner coastal waters, Mittlere Schlei | Kiel Bay | 2.40 | 53.31 | NA | 0.03 | 0.02 | Bad |
| 1005 | Chlorophyll a (In-Situ) | 20132018 | 1027 | GER-026B | B.mesohaline inner coastal waters, Mittlere Schlei | Kiel Bay | 2.40 | 68.37 | NA | 0.02 | 0.01 | Bad |
| 1005 | Chlorophyll a (In-Situ) | 20132018 | 1028 | GER-027 | mesohaline inner coastal waters, Innere Schlei | Kiel Bay | 2.40 | 68.37 | NA | 0.02 | 0.01 | Bad |
| 1005 | Chlorophyll a (In-Situ) | 20132018 | 1029 | GER-028 | mesohaline open coastal waters, Eckerfoerder Bucht, Rand | Kiel Bay | 1.95 | 1.73 | NA | 0.75 | 0.72 | Good |
| 1005 | Chlorophyll a (In-Situ) | 20132018 | 1030 | GER-029 | meso- to polyhaline open coastal waters, seasonally stratified, Eckerfoerderbucht, Tiefe | Kiel Bay | 1.95 | 1.97 | NA | 0.66 | 0.59 | Moderate |
| 1005 | Chlorophyll a (In-Situ) | 20132018 | 1031 | GER-030 | mesohaline open coastal waters, Buelk | Kiel Bay | 1.95 | 1.97 | NA | 0.66 | 0.59 | Moderate |
| 1005 | Chlorophyll a (In-Situ) | 20132018 | 1032 | GER-031 | meso- to polyhaline open coastal waters, seasonally stratified, Kieler Aussenfoerde | Kiel Bay | 1.95 | 2.04 | NA | 0.64 | 0.56 | Moderate |
| 1005 | Chlorophyll a (In-Situ) | 20132018 | 1033 | GER-032 | mesohaline inner coastal waters, Kieler Innenfoerde | Kiel Bay | 1.95 | 4.53 | NA | 0.29 | 0.15 | Bad |
| 1005 | Chlorophyll a (In-Situ) | 20132018 | 1034 | GER-033 | mesohaline open coastal waters, Probstei | Kiel Bay | 1.95 | 1.80 | NA | 0.72 | 0.68 | Good |
| 1005 | Chlorophyll a (In-Situ) | 20132018 | 1035 | GER-034 | mesohaline open coastal waters, Putlos | Kiel Bay | 1.95 | 1.80 | NA | 0.72 | 0.68 | Good |
| 1005 | Chlorophyll a (In-Situ) | 20132018 | 1036 | GER-035 | meso- to polyhaline open coastal waters, seasonally stratified, Hohwachter Bucht | Kiel Bay | 1.95 | 1.65 | NA | 0.79 | 0.77 | Good |
| 1005 | Chlorophyll a (In-Situ) | 20132018 | 1037 | GER-036A | A.mesohaline open coastal waters, Fehmarnsund | Kiel Bay | 1.95 | 1.77 | NA | 0.74 | 0.70 | Good |
| 1005 | Chlorophyll a (In-Situ) | 20132018 | 1038 | GER-036B | B.mesohaline open coastal waters, Fehmarnsund | Bay of Mecklenburg | 1.95 | 1.79 | NA | 0.73 | 0.69 | Good |
| 1005 | Chlorophyll a (In-Situ) | 20132018 | 1039 | GER-037 | mesohaline inner coastal waters, Orther Bucht | Kiel Bay | 1.95 | 1.86 | NA | 0.70 | 0.64 | Good |
| 1005 | Chlorophyll a (In-Situ) | 20132018 | 1040 | GER-038A | A.mesohaline open coastal waters, Fehmarnbelt | Kiel Bay | 1.95 | 1.47 | NA | 0.88 | 0.88 | High |
| 1005 | Chlorophyll a (In-Situ) | 20132018 | 1041 | GER-038B | B.mesohaline open coastal waters, Fehmarnbelt | Bay of Mecklenburg | 1.95 | 1.47 | NA | 0.88 | 0.88 | High |
| 1005 | Chlorophyll a (In-Situ) | 20132018 | 1042 | GER-039 | meso- to polyhaline open coastal waters, seasonally stratified, Fehmarn Sund Ost | Bay of Mecklenburg | 1.95 | 1.59 | NA | 0.82 | 0.81 | High |
| 1005 | Chlorophyll a (In-Situ) | 20132018 | 1043 | GER-040 | mesohaline open coastal waters, Groemitz | Bay of Mecklenburg | 1.95 | 2.13 | NA | 0.61 | 0.52 | Moderate |
| 1005 | Chlorophyll a (In-Situ) | 20132018 | 1044 | GER-041 | mesohaline open coastal waters, Neustaedter Bucht | Bay of Mecklenburg | 1.95 | 2.20 | NA | 0.59 | 0.49 | Moderate |
| 1005 | Chlorophyll a (In-Situ) | 20132018 | 1045 | GER-042 | mesohaline inner coastal waters, Travemuende | Bay of Mecklenburg | 1.95 | 19.77 | NA | 0.07 | 0.03 | Bad |
| 1005 | Chlorophyll a (In-Situ) | 20132018 | 1046 | GER-043 | mesohaline inner coastal waters, Poetenitzer Wiek | Bay of Mecklenburg | 2.40 | 19.77 | NA | 0.08 | 0.04 | Bad |
| 1005 | Chlorophyll a (In-Situ) | 20132018 | 1047 | GER-044 | mesohaline inner coastal waters, Untere Trave | Bay of Mecklenburg | 2.40 | 20.19 | NA | 0.08 | 0.04 | Bad |
| 1010 | Phytoplankton biovolume | 20132018 | 1001 | GER-001 | mesohaline inner coastal waters, Wismarbucht, Suedteil | Bay of Mecklenburg | NA | NA | NA | NA | 0.57 | Moderate |
| 1010 | Phytoplankton biovolume | 20132018 | 1002 | GER-002 | mesohaline inner coastal waters, Wismarbucht, Nordteil | Bay of Mecklenburg | NA | NA | NA | NA | 0.57 | Moderate |
| 1010 | Phytoplankton biovolume | 20132018 | 1003 | GER-003 | mesohaline inner coastal waters, Wismarbucht, Salzhaff | Bay of Mecklenburg | NA | NA | NA | NA | 0.52 | Moderate |
| 1010 | Phytoplankton biovolume | 20132018 | 1004 | GER-004 | mesohaline open coastal waters, Suedliche Mecklenburger Bucht/ Travemuende bis Warnemünde | Bay of Mecklenburg | NA | NA | NA | NA | 0.50 | Moderate |
| 1010 | Phytoplankton biovolume | 20132018 | 1005 | GER-005 | mesohaline inner coastal waters, Unterwarnow | Bay of Mecklenburg | NA | NA | NA | NA | 0.52 | Moderate |
| 1010 | Phytoplankton biovolume | 20132018 | 1006 | GER-006 | mesohaline open coastal waters, Suedliche Mecklenburger Bucht/ Warnemünde bis Darss | Bay of Mecklenburg | NA | NA | NA | NA | 0.43 | Moderate |
| 1010 | Phytoplankton biovolume | 20132018 | 1007 | GER-007 | oligohaline inner coastal waters, Ribnitzer See / Saaler Bodden | Arkona Basin | NA | NA | NA | NA | 0.18 | Bad |
| 1010 | Phytoplankton biovolume | 20132018 | 1008 | GER-008 | oligohaline inner coastal waters, Koppelstrom / Bodstedter Bodden | Arkona Basin | NA | NA | NA | NA | 0.26 | Poor |
| 1010 | Phytoplankton biovolume | 20132018 | 1009 | GER-009 | mesohaline inner coastal waters, Barther Bodden, Grabow | Arkona Basin | NA | NA | NA | NA | 0.18 | Bad |
| 1010 | Phytoplankton biovolume | 20132018 | 1010 | GER-010 | mesohaline open coastal waters, Prerowbucht/ Darsser Ort bis Dornbusch | Arkona Basin | NA | NA | NA | NA | 0.87 | High |
| 1010 | Phytoplankton biovolume | 20132018 | 1011 | GER-011 | mesohaline inner coastal waters, Westruegensche Bodden | Arkona Basin | NA | NA | NA | NA | 0.38 | Poor |
| 1010 | Phytoplankton biovolume | 20132018 | 1012 | GER-012 | mesohaline inner coastal waters, Strelasund | Arkona Basin | NA | NA | NA | NA | 0.37 | Poor |
| 1010 | Phytoplankton biovolume | 20132018 | 1013 | GER-013 | mesohaline inner coastal waters, Greifswalder Bodden | Arkona Basin | NA | NA | NA | NA | 0.38 | Poor |
| 1010 | Phytoplankton biovolume | 20132018 | 1014 | GER-014 | mesohaline inner coastal waters, Kleiner Jasmunder Bodden | Arkona Basin | NA | NA | NA | NA | 0.18 | Bad |
| 1010 | Phytoplankton biovolume | 20132018 | 1015 | GER-015 | mesohaline open coastal waters, Nord- und Ostruegensche Gewaesser | Arkona Basin | NA | NA | NA | NA | 0.51 | Moderate |
| 1010 | Phytoplankton biovolume | 20132018 | 1016 | GER-016 | oligohaline inner coastal waters, Peenestrom | Bornholm Basin | NA | NA | NA | NA | 0.27 | Poor |
| 1010 | Phytoplankton biovolume | 20132018 | 1017 | GER-017 | oligohaline inner coastal waters, Achterwasser | Bornholm Basin | NA | NA | NA | NA | 0.24 | Poor |
| 1010 | Phytoplankton biovolume | 20132018 | 1018 | GER-018 | mesohaline open coastal waters, Pommersche Bucht, Nordteil | Arkona Basin | NA | NA | NA | NA | 0.35 | Poor |
| 1010 | Phytoplankton biovolume | 20132018 | 1019 | GER-019 | mesohaline open coastal waters, Pommersche Bucht, Südteil | Bornholm Basin | NA | NA | NA | NA | 0.28 | Poor |
| 1010 | Phytoplankton biovolume | 20132018 | 1020 | GER-020 | oligohaline inner coastal waters, Kleines Haff | Bornholm Basin | NA | NA | NA | NA | 0.28 | Poor |
| 1010 | Phytoplankton biovolume | 20132018 | 1048 | GER-111 | mesohaline inner coastal waters, Nordruegensche Bodden | Arkona Basin | NA | NA | NA | NA | 0.22 | Poor |
| 2005 | Chlorophyll a (In-Situ_EO_FB) | 20162021 | 2001 | DEN-001 | Roskilde Fjord, ydre | Kattegat | NA | NA | NA | 0.43 | 0.41 | Moderate |
| 2005 | Chlorophyll a (In-Situ_EO_FB) | 20162021 | 2002 | DEN-002 | Roskilde Fjord, indre | Kattegat | NA | NA | NA | 0.60 | 0.56 | Moderate |
| 2005 | Chlorophyll a (In-Situ_EO_FB) | 20162021 | 2016 | DEN-016 | Korsør Nor | Great Belt | NA | NA | NA | 0.67 | 0.64 | Good |
| 2005 | Chlorophyll a (In-Situ_EO_FB) | 20162021 | 2017 | DEN-017 | Basnæs Nor | Great Belt | NA | NA | NA | 0.95 | 0.95 | High |
| 2005 | Chlorophyll a (In-Situ_EO_FB) | 20162021 | 2018 | DEN-018 | Holsteinborg Nor | Great Belt | NA | NA | NA | 1.09 | 1.09 | High |
| 2005 | Chlorophyll a (In-Situ_EO_FB) | 20162021 | 2024 | DEN-024 | Isefjord, ydre | Kattegat | NA | NA | NA | 0.42 | 0.39 | Poor |
| 2005 | Chlorophyll a (In-Situ_EO_FB) | 20162021 | 2025 | DEN-025 | Skælskør Fjord og Nor | Great Belt | NA | NA | NA | 0.37 | 0.35 | Poor |
| 2005 | Chlorophyll a (In-Situ_EO_FB) | 20162021 | 2029 | DEN-029 | Kalundborg Fjord | Great Belt | NA | NA | NA | 0.47 | 0.44 | Moderate |
| 2005 | Chlorophyll a (In-Situ_EO_FB) | 20162021 | 2034 | DEN-034 | Smålandsfarvandet, syd | Great Belt | NA | NA | NA | 0.68 | 0.68 | Good |
| 2005 | Chlorophyll a (In-Situ_EO_FB) | 20162021 | 2035 | DEN-035 | Karrebæk Fjord | Great Belt | NA | NA | NA | 0.68 | 0.68 | Good |
| 2005 | Chlorophyll a (In-Situ_EO_FB) | 20162021 | 2036 | DEN-036 | Dybsø Fjord | Great Belt | NA | NA | NA | 0.71 | 0.71 | Good |
| 2005 | Chlorophyll a (In-Situ_EO_FB) | 20162021 | 2037 | DEN-037 | Avnø Fjord | Great Belt | NA | NA | NA | 0.77 | 0.77 | Good |
| 2005 | Chlorophyll a (In-Situ_EO_FB) | 20162021 | 2044 | DEN-044 | Hjelm Bugt | Arkona Basin | NA | NA | NA | 0.43 | 0.41 | Moderate |
| 2005 | Chlorophyll a (In-Situ_EO_FB) | 20162021 | 2046 | DEN-046 | Fakse Bugt | Arkona Basin | NA | NA | NA | 0.44 | 0.43 | Moderate |
| 2005 | Chlorophyll a (In-Situ_EO_FB) | 20162021 | 2047 | DEN-047 | Præstø Fjord | Arkona Basin | NA | NA | NA | 0.42 | 0.41 | Moderate |
| 2005 | Chlorophyll a (In-Situ_EO_FB) | 20162021 | 2048 | DEN-048 | Stege Bugt | Arkona Basin | NA | NA | NA | 0.74 | 0.75 | Good |
| 2005 | Chlorophyll a (In-Situ_EO_FB) | 20162021 | 2049 | DEN-049 | Stege Nor | Arkona Basin | NA | NA | NA | 0.30 | 0.29 | Poor |
| 2005 | Chlorophyll a (In-Situ_EO_FB) | 20162021 | 2059 | DEN-059 | Nærå Strand | Great Belt | NA | NA | NA | 0.31 | 0.29 | Poor |
| 2005 | Chlorophyll a (In-Situ_EO_FB) | 20162021 | 2062 | DEN-062 | Lillestrand | Great Belt | NA | NA | NA | 0.47 | 0.44 | Moderate |
| 2005 | Chlorophyll a (In-Situ_EO_FB) | 20162021 | 2068 | DEN-068 | Lindelse Nor | Great Belt | NA | NA | NA | 1.13 | 1.13 | High |
| 2005 | Chlorophyll a (In-Situ_EO_FB) | 20162021 | 2072 | DEN-072 | Kløven | Great Belt | NA | NA | NA | 0.60 | 0.60 | Moderate |
| 2005 | Chlorophyll a (In-Situ_EO_FB) | 20162021 | 2074 | DEN-074 | Bredningen | Great Belt | NA | NA | NA | 0.22 | 0.22 | Poor |
| 2005 | Chlorophyll a (In-Situ_EO_FB) | 20162021 | 2080 | DEN-080 | Gamborg Fjord | Great Belt | NA | NA | NA | 0.40 | 0.40 | Moderate |
| 2005 | Chlorophyll a (In-Situ_EO_FB) | 20162021 | 2082 | DEN-082 | Aborg Minde Nor | Great Belt | NA | NA | NA | 0.20 | 0.20 | Poor |
| 2005 | Chlorophyll a (In-Situ_EO_FB) | 20162021 | 2083 | DEN-083 | Holckenhavn Fjord | Great Belt | NA | NA | NA | 0.23 | 0.22 | Poor |
| 2005 | Chlorophyll a (In-Situ_EO_FB) | 20162021 | 2084 | DEN-084 | Kerteminde Fjord | Great Belt | NA | NA | NA | 0.37 | 0.35 | Poor |
| 2005 | Chlorophyll a (In-Situ_EO_FB) | 20162021 | 2085 | DEN-085 | Kertinge Nor | Great Belt | NA | NA | NA | 0.41 | 0.38 | Poor |
| 2005 | Chlorophyll a (In-Situ_EO_FB) | 20162021 | 2086 | DEN-086 | Nyborg Fjord | Great Belt | NA | NA | NA | 0.40 | 0.38 | Poor |
| 2005 | Chlorophyll a (In-Situ_EO_FB) | 20162021 | 2087 | DEN-087 | Helnæs Bugt | Great Belt | NA | NA | NA | 0.24 | 0.24 | Poor |
| 2005 | Chlorophyll a (In-Situ_EO_FB) | 20162021 | 2089 | DEN-089 | Lunkebugten | Great Belt | NA | NA | NA | 0.35 | 0.35 | Poor |
| 2005 | Chlorophyll a (In-Situ_EO_FB) | 20162021 | 2090 | DEN-090 | Langelandssund | Great Belt | NA | NA | NA | 0.44 | 0.44 | Moderate |
| 2005 | Chlorophyll a (In-Situ_EO_FB) | 20162021 | 2092 | DEN-092 | Odense Fjord, ydre | Great Belt | NA | NA | NA | 0.48 | 0.45 | Moderate |
| 2005 | Chlorophyll a (In-Situ_EO_FB) | 20162021 | 2093 | DEN-093 | Odense Fjord, Seden Strand | Great Belt | NA | NA | NA | 0.74 | 0.70 | Good |
| 2005 | Chlorophyll a (In-Situ_EO_FB) | 20162021 | 2101 | DEN-101 | Genner Bugt | Great Belt | NA | NA | NA | 0.23 | 0.23 | Poor |
| 2005 | Chlorophyll a (In-Situ_EO_FB) | 20162021 | 2102 | DEN-102 | Åbenrå Fjord | Great Belt | NA | NA | NA | 0.18 | 0.18 | Bad |
| 2005 | Chlorophyll a (In-Situ_EO_FB) | 20162021 | 2103 | DEN-103 | Als Fjord | Great Belt | NA | NA | NA | 0.26 | 0.26 | Poor |
| 2005 | Chlorophyll a (In-Situ_EO_FB) | 20162021 | 2105 | DEN-105 | Augustenborg Fjord | Great Belt | NA | NA | NA | 0.37 | 0.37 | Poor |
| 2005 | Chlorophyll a (In-Situ_EO_FB) | 20162021 | 2106 | DEN-106 | Haderslev Fjord | Great Belt | NA | NA | NA | 0.13 | 0.13 | Bad |
| 2005 | Chlorophyll a (In-Situ_EO_FB) | 20162021 | 2108 | DEN-108 | Avnø Vig | Great Belt | NA | NA | NA | 0.28 | 0.28 | Poor |
| 2005 | Chlorophyll a (In-Situ_EO_FB) | 20162021 | 2109 | DEN-109 | Hejlsminde Nor | Great Belt | NA | NA | NA | 0.38 | 0.38 | Poor |
| 2005 | Chlorophyll a (In-Situ_EO_FB) | 20162021 | 2110 | DEN-110 | Nybøl Nor | Great Belt | NA | NA | NA | 0.38 | 0.38 | Poor |
| 2005 | Chlorophyll a (In-Situ_EO_FB) | 20162021 | 2113 | DEN-113 | Flensborg Fjord, indre | Great Belt | NA | NA | NA | 0.19 | 0.19 | Bad |
| 2005 | Chlorophyll a (In-Situ_EO_FB) | 20162021 | 2114 | DEN-114 | Flensborg Fjord, ydre | Great Belt | NA | NA | NA | 0.38 | 0.38 | Poor |
| 2005 | Chlorophyll a (In-Situ_EO_FB) | 20162021 | 2123 | DEN-123 | Vejle Fjord, indre | Great Belt | NA | NA | NA | 0.50 | 0.47 | Moderate |
| 2005 | Chlorophyll a (In-Situ_EO_FB) | 20162021 | 2124 | DEN-124 | Kolding Fjord, indre | Great Belt | NA | NA | NA | 0.24 | 0.23 | Poor |
| 2005 | Chlorophyll a (In-Situ_EO_FB) | 20162021 | 2125 | DEN-125 | Kolding Fjord, ydre | Great Belt | NA | NA | NA | 0.18 | 0.17 | Bad |
| 2005 | Chlorophyll a (In-Situ_EO_FB) | 20162021 | 2128 | DEN-128 | Horsens Fjord, indre | Great Belt | NA | NA | NA | 0.24 | 0.23 | Poor |
| 2005 | Chlorophyll a (In-Situ_EO_FB) | 20162021 | 2136 | DEN-136 | Randers Fjord, indre | Kattegat | NA | NA | NA | 0.53 | 0.50 | Moderate |
| 2005 | Chlorophyll a (In-Situ_EO_FB) | 20162021 | 2137 | DEN-137 | Randers Fjord, ydre | Kattegat | NA | NA | NA | 0.77 | 0.73 | Good |
| 2005 | Chlorophyll a (In-Situ_EO_FB) | 20162021 | 2141 | DEN-141 | Ebeltoft Vig | Great Belt | NA | NA | NA | 0.78 | 0.75 | Good |
| 2005 | Chlorophyll a (In-Situ_EO_FB) | 20162021 | 2142 | DEN-142 | Stavns Fjord | Great Belt | NA | NA | NA | 0.75 | 0.72 | Good |
| 2005 | Chlorophyll a (In-Situ_EO_FB) | 20162021 | 2144 | DEN-144 | Knebel Vig | Great Belt | NA | NA | NA | 0.45 | 0.42 | Moderate |
| 2005 | Chlorophyll a (In-Situ_EO_FB) | 20162021 | 2145 | DEN-145 | Kalø Vig | Great Belt | NA | NA | NA | 0.51 | 0.48 | Moderate |
| 2005 | Chlorophyll a (In-Situ_EO_FB) | 20162021 | 2146 | DEN-146 | Norsminde Fjord | Great Belt | NA | NA | NA | 0.58 | 0.54 | Moderate |
| 2005 | Chlorophyll a (In-Situ_EO_FB) | 20162021 | 2147 | DEN-147 | Århus Bugt og Begtrup Vig | Great Belt | NA | NA | NA | 0.51 | 0.48 | Moderate |
| 2005 | Chlorophyll a (In-Situ_EO_FB) | 20162021 | 2157 | DEN-157 | Bjørnholms Bugt, Riisgårde Bredning, Skive Fjord og Lovns Bredning | Kattegat | NA | NA | NA | 0.11 | 0.10 | Bad |
| 2005 | Chlorophyll a (In-Situ_EO_FB) | 20162021 | 2158 | DEN-158 | Hjarbæk Fjord | Kattegat | NA | NA | NA | 0.12 | 0.11 | Bad |
| 2005 | Chlorophyll a (In-Situ_EO_FB) | 20162021 | 2159 | DEN-159 | Mariager Fjord, indre | Kattegat | NA | NA | NA | 0.06 | 0.06 | Bad |
| 2005 | Chlorophyll a (In-Situ_EO_FB) | 20162021 | 2160 | DEN-160 | Mariager Fjord, ydre | Kattegat | NA | NA | NA | 0.36 | 0.33 | Poor |
| 2005 | Chlorophyll a (In-Situ_EO_FB) | 20162021 | 2165 | DEN-165 | Isefjord, indre | Kattegat | NA | NA | NA | 0.43 | 0.40 | Moderate |
| 2005 | Chlorophyll a (In-Situ_EO_FB) | 20162021 | 2200 | DEN-200 | Kattegat, Nordsjælland | Kattegat | NA | NA | NA | 0.57 | 0.53 | Moderate |
| 2005 | Chlorophyll a (In-Situ_EO_FB) | 20162021 | 2201 | DEN-201 | Køge Bugt | Arkona Basin | NA | NA | NA | 0.32 | 0.31 | Poor |
| 2005 | Chlorophyll a (In-Situ_EO_FB) | 20162021 | 2204 | DEN-204 | Jammerland Bugt og Musholm Bugt | Great Belt | NA | NA | NA | 0.53 | 0.49 | Moderate |
| 2005 | Chlorophyll a (In-Situ_EO_FB) | 20162021 | 2206 | DEN-206 | Smålandsfarvandet, åbne del | Great Belt | NA | NA | NA | 0.44 | 0.44 | Moderate |
| 2005 | Chlorophyll a (In-Situ_EO_FB) | 20162021 | 2207 | DEN-207 | Nakskov Fjord | Great Belt | NA | NA | NA | 0.89 | 0.89 | High |
| 2005 | Chlorophyll a (In-Situ_EO_FB) | 20162021 | 2209 | DEN-209 | Rødsand og Bredningen | Great BeltandBay of Mecklenburg | NA | NA | NA | 0.28 | 0.28 | Poor |
| 2005 | Chlorophyll a (In-Situ_EO_FB) | 20162021 | 2212 | DEN-212 | Faaborg Fjord | Great Belt | NA | NA | NA | 0.36 | 0.36 | Poor |
| 2005 | Chlorophyll a (In-Situ_EO_FB) | 20162021 | 2214 | DEN-214 | Det Sydfynske Øhav | Great Belt | NA | NA | NA | 0.28 | 0.28 | Poor |
| 2005 | Chlorophyll a (In-Situ_EO_FB) | 20162021 | 2216 | DEN-216 | Lillebælt, syd | Great Belt | NA | NA | NA | 0.28 | 0.28 | Poor |
| 2005 | Chlorophyll a (In-Situ_EO_FB) | 20162021 | 2217 | DEN-217 | Lillebælt, Bredningen | Great Belt | NA | NA | NA | 0.32 | 0.32 | Poor |
| 2005 | Chlorophyll a (In-Situ_EO_FB) | 20162021 | 2219 | DEN-219 | Århus Bugt syd, Samsø og Nordlige Bælthav | Great Belt | NA | NA | NA | 0.42 | 0.40 | Poor |
| 2005 | Chlorophyll a (In-Situ_EO_FB) | 20162021 | 2222 | DEN-222 | Kattegat, Aalborg Bugt | Kattegat | NA | NA | NA | 1.06 | 1.07 | High |
| 2005 | Chlorophyll a (In-Situ_EO_FB) | 20162021 | 2224 | DEN-224 | Nordlige Lillebælt | Great Belt | NA | NA | NA | 0.37 | 0.34 | Poor |
| 2005 | Chlorophyll a (In-Situ_EO_FB) | 20162021 | 2232 | DEN-232 | Nissum Bredning | Kattegat | NA | NA | NA | 0.32 | 0.30 | Poor |
| 2005 | Chlorophyll a (In-Situ_EO_FB) | 20162021 | 2234 | DEN-234 | Løgstør Bredning | Kattegat | NA | NA | NA | 0.20 | 0.19 | Bad |
| 2005 | Chlorophyll a (In-Situ_EO_FB) | 20162021 | 2235 | DEN-235 | Nibe Bredning og Langerak | Kattegat | NA | NA | NA | 0.27 | 0.26 | Poor |
| 2005 | Chlorophyll a (In-Situ_EO_FB) | 20162021 | 2236 | DEN-236 | Thisted Bredning | Kattegat | NA | NA | NA | 0.14 | 0.13 | Bad |
| 2005 | Chlorophyll a (In-Situ_EO_FB) | 20162021 | 2238 | DEN-238 | Halkær Bredning | Kattegat | NA | NA | NA | 0.12 | 0.11 | Bad |
| 3004 | Chlorophyll a | 20162021 | 3001 | EST-001 | Narva-Kunda Bay CWB | Gulf of Finland | NA | NA | NA | 0.52 | 0.51 | Moderate |
| 3004 | Chlorophyll a | 20162020 | 3002 | EST-002 | Eru-Käsmu Bay CWB | Gulf of Finland | NA | NA | NA | 0.71 | 0.68 | Good |
| 3004 | Chlorophyll a | 20212021 | 3003 | EST-003 | Hara and Kolga Bay CWB | Gulf of Finland | NA | NA | NA | 0.31 | 0.36 | Poor |
| 3004 | Chlorophyll a | 20162021 | 3004 | EST-005 | Muuga-Tallinna-Kakumäe Bay CWB | Gulf of Finland | NA | NA | NA | 0.48 | 0.47 | Moderate |
| 3004 | Chlorophyll a | 20212021 | 3005 | EST-006 | Pakri Bay CWB | Gulf of Finland | NA | NA | NA | 0.39 | 0.43 | Moderate |
| 3004 | Chlorophyll a | 20212021 | 3006 | EST-007 | Hiiu Shallow CWB | Gulf of Riga | NA | NA | NA | 0.63 | 0.58 | Moderate |
| 3004 | Chlorophyll a | 20182021 | 3007 | EST-008 | Haapsalu Bay CWB | Gulf of Riga | NA | NA | NA | 0.26 | 0.27 | Poor |
| 3004 | Chlorophyll a | 20212021 | 3008 | EST-009 | Matsalu Bay CWB | Gulf of Riga | NA | NA | NA | 0.31 | 0.36 | Poor |
| 3004 | Chlorophyll a | 20212021 | 3009 | EST-010 | Soela Strait CWB | Northern Baltic Proper | NA | NA | NA | 0.32 | 0.39 | Poor |
| 3004 | Chlorophyll a | 20212021 | 3010 | EST-011 | Kihelkonna Bay CWB | Eastern Gotland Basin | NA | NA | NA | 1.00 | 1.00 | High |
| 3004 | Chlorophyll a | 20162021 | 3011 | EST-013 | Pärnu Bay CWB | Gulf of Riga | NA | NA | NA | 0.50 | 0.50 | Moderate |
| 3004 | Chlorophyll a | 20162018 | 3012 | EST-014 | Kassari-Õunaku Bay CWB | Gulf of Riga | NA | NA | NA | 0.88 | 0.86 | High |
| 3004 | Chlorophyll a | 20212021 | 3013 | EST-016 | Väinameri CWB | Gulf of Riga | NA | NA | NA | 0.61 | 0.57 | Moderate |
| 3004 | Chlorophyll a | 20212021 | 3014 | EST-017 | NW part of the Gulf of Riga CWB | Gulf of Riga | NA | NA | NA | NA | NA | NA |
| 3004 | Chlorophyll a | 20212021 | 3015 | EST-018 | NE part of the Gulf of Riga CWB | Gulf of Riga | NA | NA | NA | NA | NA | NA |
| 3004 | Chlorophyll a | 20212021 | 3016 | EST-019 | Central part of the Gulf of Riga CWB | Gulf of Riga | NA | NA | NA | 0.53 | 0.52 | Moderate |
| 3005 | Phytoplankton biomass | 20162021 | 3001 | EST-001 | Narva-Kunda Bay CWB | Gulf of Finland | NA | NA | NA | 0.76 | 0.71 | Good |
| 3005 | Phytoplankton biomass | 20162020 | 3002 | EST-002 | Eru-Käsmu Bay CWB | Gulf of Finland | NA | NA | NA | 0.29 | 0.32 | Poor |
| 3005 | Phytoplankton biomass | 20212021 | 3003 | EST-003 | Hara and Kolga Bay CWB | Gulf of Finland | NA | NA | NA | 0.31 | 0.36 | Poor |
| 3005 | Phytoplankton biomass | 20162021 | 3004 | EST-005 | Muuga-Tallinna-Kakumäe Bay CWB | Gulf of Finland | NA | NA | NA | 0.20 | 0.19 | Bad |
| 3005 | Phytoplankton biomass | 20212021 | 3005 | EST-006 | Pakri Bay CWB | Gulf of Finland | NA | NA | NA | 0.20 | 0.18 | Bad |
| 3005 | Phytoplankton biomass | 20212021 | 3006 | EST-007 | Hiiu Shallow CWB | Gulf of Riga | NA | NA | NA | 0.17 | 0.16 | Bad |
| 3005 | Phytoplankton biomass | 20182021 | 3007 | EST-008 | Haapsalu Bay CWB | Gulf of Riga | NA | NA | NA | 0.19 | 0.17 | Bad |
| 3005 | Phytoplankton biomass | 20212021 | 3008 | EST-009 | Matsalu Bay CWB | Gulf of Riga | NA | NA | NA | 0.20 | 0.18 | Bad |
| 3005 | Phytoplankton biomass | 20212021 | 3009 | EST-010 | Soela Strait CWB | Northern Baltic Proper | NA | NA | NA | 0.79 | 0.75 | Good |
| 3005 | Phytoplankton biomass | 20212021 | 3010 | EST-011 | Kihelkonna Bay CWB | Eastern Gotland Basin | NA | NA | NA | 0.21 | 0.19 | Bad |
| 3005 | Phytoplankton biomass | 20162018 | 3012 | EST-014 | Kassari-Õunaku Bay CWB | Gulf of Riga | NA | NA | NA | 0.66 | 0.64 | Good |
| 3005 | Phytoplankton biomass | 20212021 | 3013 | EST-016 | Väinameri CWB | Gulf of Riga | NA | NA | NA | 0.22 | 0.20 | Poor |
| 3005 | Phytoplankton biomass | 20212021 | 3014 | EST-017 | NW part of the Gulf of Riga CWB | Gulf of Riga | NA | NA | NA | NA | NA | NA |
| 3005 | Phytoplankton biomass | 20212021 | 3015 | EST-018 | NE part of the Gulf of Riga CWB | Gulf of Riga | NA | NA | NA | NA | NA | NA |
| 3005 | Phytoplankton biomass | 20212021 | 3016 | EST-019 | Central part of the Gulf of Riga CWB | Gulf of Riga | NA | NA | NA | 0.80 | 0.76 | Good |
| 4003 | Chlorophyll a (summer) | 20162021 | 4001 | FIN-001 | Lounainen sisäsaaristo | Åland Sea | NA | NA | NA | NA | 0.40 | Moderate |
| 4003 | Chlorophyll a (summer) | 20162021 | 4002 | FIN-002 | Lounainen ulkosaaristo | Åland Sea | NA | NA | NA | NA | 0.48 | Moderate |
| 4003 | Chlorophyll a (summer) | 20162021 | 4003 | FIN-003 | Suomenlahden sisäsaaristo | Gulf of Finland | NA | NA | NA | NA | 0.45 | Moderate |
| 4003 | Chlorophyll a (summer) | 20162021 | 4004 | FIN-004 | Suomenlahden ulkosaaristo | Gulf of Finland | NA | NA | NA | NA | 0.41 | Moderate |
| 4003 | Chlorophyll a (summer) | 20162021 | 4005 | FIN-005 | Lounainen välisaaristo | Åland Sea | NA | NA | NA | NA | 0.49 | Moderate |
| 4003 | Chlorophyll a (summer) | 20162021 | 4006 | FIN-006 | Merenkurkun sisäsaaristo | The Quark | NA | NA | NA | NA | 0.55 | Moderate |
| 4003 | Chlorophyll a (summer) | 20162021 | 4007 | FIN-007 | Merenkurkun ulkosaaristo | The Quark | NA | NA | NA | NA | 0.66 | Good |
| 4003 | Chlorophyll a (summer) | 20162021 | 4008 | FIN-008 | Selkämeren sisemmät rannikkovedet | Bothnian Sea | NA | NA | NA | NA | 0.53 | Moderate |
| 4003 | Chlorophyll a (summer) | 20162021 | 4009 | FIN-009 | Selkämeren ulommat rannikkovedet | Bothnian Sea | NA | NA | NA | NA | 0.59 | Moderate |
| 4003 | Chlorophyll a (summer) | 20162021 | 4010 | FIN-010 | Perämeren sisemmät rannikkovedet | Bothnian Bay | NA | NA | NA | NA | 0.54 | Moderate |
| 4003 | Chlorophyll a (summer) | 20162021 | 4011 | FIN-011 | Perämeren ulommat rannikkovedet | Bothnian Bay | NA | NA | NA | NA | 0.60 | Moderate |
| 4003 | Chlorophyll a (summer) | 20162021 | 4012 | FIN-012 | Åland innerskärgård | Åland Sea | NA | NA | NA | 0.46 | 0.47 | Moderate |
| 4003 | Chlorophyll a (summer) | 20162021 | 4013 | FIN-013 | Åland mellanskärgård | Åland Sea | NA | NA | NA | 0.54 | 0.52 | Moderate |
| 4003 | Chlorophyll a (summer) | 20162021 | 4014 | FIN-014 | Åland ytterskärgård | Åland Sea | NA | NA | NA | 0.52 | 0.50 | Moderate |
| 4004 | Phytoplankton biomass | 20162021 | 4002 | FIN-002 | Lounainen ulkosaaristo | Åland Sea | NA | NA | NA | NA | 0.43 | Moderate |
| 4004 | Phytoplankton biomass | 20162021 | 4004 | FIN-004 | Suomenlahden ulkosaaristo | Gulf of Finland | NA | NA | NA | NA | 0.44 | Moderate |
| 4004 | Phytoplankton biomass | 20162021 | 4005 | FIN-005 | Lounainen välisaaristo | Åland Sea | NA | NA | NA | NA | 0.55 | Moderate |
| 4004 | Phytoplankton biomass | 20162021 | 4007 | FIN-007 | Merenkurkun ulkosaaristo | The Quark | NA | NA | NA | NA | 0.60 | Good |
| 4004 | Phytoplankton biomass | 20162021 | 4009 | FIN-009 | Selkämeren ulommat rannikkovedet | Bothnian Sea | NA | NA | NA | NA | 0.56 | Moderate |
| 4004 | Phytoplankton biomass | 20162021 | 4011 | FIN-011 | Perämeren ulommat rannikkovedet | Bothnian Bay | NA | NA | NA | NA | 0.72 | Good |
| 7009 | Chlorophyll a (In-Situ_EO_FB) | 20162021 | 7001 | POL-001 | PL TW I WB 9 very sheltered, fully mixed, substratum: silt/sandy silt/silty sand; ice cover >90 days, water residence time 52 days | Bornholm Basin | ### | 23.64 | 7.54 | 0.62 | 0.52 | Moderate |
| 7009 | Chlorophyll a (In-Situ_EO_FB) | 20162021 | 7002 | POL-002 | PL TW I WB 8 very sheltered, fully mixed, substratum: silt/sandy silt/silty sand; ice cover >90 days, water residence time 52 days | Bornholm Basin | ### | 29.04 | 8.12 | 0.49 | 0.36 | Poor |
| 7009 | Chlorophyll a (In-Situ_EO_FB) | 20162021 | 7003 | POL-003 | PL TW I WB 1 very sheltered, fully mixed, substratum: silt/sandy silt/silty sand; ice cover >90 days, water residence time 52 days | Gdansk Basin | ### | 69.57 | 10.35 | 0.23 | 0.12 | Bad |
| 7009 | Chlorophyll a (In-Situ_EO_FB) | 20162021 | 7004 | POL-004 | PL TW II WB 2 very sheltered, fully mixed, substratum: lagoonal fine snd medium grained sand/silty sand; residence time 138 day, ice cover >90 days | Gdansk Basin | 2.00 | 4.24 | 1.43 | 0.35 | 0.22 | Poor |
| 7010 | Chlorophyll a (In-Situ_EO_FB) | 20162021 | 7005 | POL-005 | PL TW III WB 3 partly protected, partly stratified, substratum: medium grained sand/pebbles/marine silty sand; ice-incidental | Gdansk Basin | 3.76 | 3.83 | 0.63 | 0.67 | 0.60 | Good |
| 7010 | Chlorophyll a (In-Situ_EO_FB) | 20162021 | 7006 | POL-006 | PL TW IV WB 4 partly stratified, moderately exposed, substratum: sand/silt; ice – incidental | Gdansk Basin | 3.76 | 4.96 | 0.21 | 0.51 | 0.37 | Poor |
| 7010 | Chlorophyll a (In-Situ_EO_FB) | 20162021 | 7007 | POL-007 | PL TW V WB 6 river mouth, partly stratified, partly sheltered, substratum: medium grained sand/silty sand | Bornholm Basin | 3.80 | 6.88 | 2.08 | 0.40 | 0.27 | Poor |
| 7010 | Chlorophyll a (In-Situ_EO_FB) | 20162021 | 7008 | POL-008 | PL TW V WB 5 river mouth, partly stratified, partly sheltered, substratum: medium grained sand/silty sand | Gdansk Basin | 5.50 | 9.65 | 3.32 | 0.41 | 0.27 | Poor |
| 7010 | Chlorophyll a (In-Situ_EO_FB) | 20162021 | 7009 | POL-009 | PL TW V WB 7 river mouth, partly stratified, partly sheltered, substratum: medium grained sand/silty sand | Bornholm Basin | 7.50 | 9.80 | 2.34 | 0.53 | 0.41 | Moderate |
| 7010 | Chlorophyll a (In-Situ_EO_FB) | 20162021 | 7010 | POL-010 | PL CWI WB2 coastal waters, moderately exposed, fully mixed, substratum:sand/fine sand | Gdansk Basin | 1.90 | 3.24 | 1.05 | 0.43 | 0.29 | Poor |
| 7010 | Chlorophyll a (In-Situ_EO_FB) | 20162021 | 7011 | POL-011 | PL CWI WB1 coastal waters, moderately exposed, fully mixed, substratum:sand/fine sand | Gdansk Basin | 3.15 | 11.03 | 6.18 | 0.26 | 0.15 | Bad |
| 7010 | Chlorophyll a (In-Situ_EO_FB) | 20162021 | 7012 | POL-012 | PL CWI WB3 coastal waters, moderately exposed, fully mixed, substratum:sand/fine sand | Gdansk Basin | 1.90 | 7.24 | 2.20 | 0.19 | 0.10 | Bad |
| 7010 | Chlorophyll a (In-Situ_EO_FB) | 20162021 | 7013 | POL-013 | PL CW II WB 8 central Polish coast, coastal waters, exposed, fully mixed, substratum: sand/pebbles/gravel | Bornholm Basin | 1.90 | 4.65 | 1.74 | 0.31 | 0.18 | Bad |
| 7010 | Chlorophyll a (In-Situ_EO_FB) | 20162021 | 7014 | POL-014 | PL CW II WB 6W central Polish coast, coastal waters, exposed, fully mixed, substratum: sand/pebbles/gravel | Bornholm Basin | 1.90 | 5.39 | 2.44 | 0.27 | 0.15 | Bad |
| 7010 | Chlorophyll a (In-Situ_EO_FB) | 20162021 | 7015 | POL-015 | PL CW II WB 6E central Polish coast, coastal waters, exposed, fully mixed, substratum: sand/pebbles/gravel | Bornholm Basin | 1.90 | 5.05 | 2.12 | 0.28 | 0.16 | Bad |
| 7010 | Chlorophyll a (In-Situ_EO_FB) | 20162021 | 7016 | POL-016 | PL CWII WB5 central Polish coast, coastal waters, exposed, fully mixed, substratum: sand/pebbles/gravel | Eastern Gotland Basin | 1.90 | 6.56 | 3.95 | 0.26 | 0.16 | Bad |
| 7010 | Chlorophyll a (In-Situ_EO_FB) | 20162021 | 7017 | POL-017 | PL CWII WB4 central Polish coast, coastal waters, exposed, fully mixed, substratum: sand/pebbles/gravel | Gdansk Basin | 1.90 | 2.71 | 1.19 | 0.54 | 0.43 | Moderate |
| 7010 | Chlorophyll a (In-Situ_EO_FB) | 20162021 | 7018 | POL-018 | PL CW III WB 9 central Polish coast, coastal waters, exposed, fully mixed, substratum: sand/pebbles/gravel | Bornholm Basin | 3.15 | 5.10 | 1.48 | 0.44 | 0.30 | Poor |
| 7010 | Chlorophyll a (In-Situ_EO_FB) | 20162021 | 7019 | POL-019 | PL CW III WB 7 central Polish coast, coastal waters, exposed, fully mixed, substratum: sand/pebbles/gravel | Bornholm Basin | 1.90 | 3.88 | 1.30 | 0.37 | 0.24 | Poor |
| 80051 | Chlorophyll a (In-Situ_EO_FB) | 20182018 | 8001 | SWE-001 | 1s West Coast inner coastal water | Kattegat | 2.81 | 1.70 | NA | 0.94 | 0.95 | High |
| 80051 | Chlorophyll a (In-Situ_EO_FB) | 20182018 | 8002 | SWE-003 | 4 West Coast outer coastal water, Kattegat | Kattegat | 1.49 | 1.22 | NA | 0.82 | 0.79 | Good |
| 80051 | Chlorophyll a (In-Situ_EO_FB) | 20182018 | 8003 | SWE-004 | 5 South Halland and north Öresund coastal water | Kattegat | 1.49 | 1.20 | NA | 0.83 | 0.80 | High |
| 80051 | Chlorophyll a (In-Situ_EO_FB) | 20172017 | 8004 | SWE-005 | 6 Öresund inner coastal water | The Sound | 1.53 | 1.26 | NA | 0.71 | 0.71 | Good |
| 80051 | Chlorophyll a (In-Situ_EO_FB) | 20182018 | 8005 | SWE-006 | 7 Skåne coastal water | Arkona Basin | 1.80 | 1.74 | NA | 0.69 | 0.64 | Good |
| 80051 | Chlorophyll a (In-Situ_EO_FB) | 20182018 | 8006 | SWE-007 | 8 Blekinge archipelago and Kalmarsund, inner | Western Gotland Basin | 2.17 | 2.75 | NA | 0.53 | 0.51 | Moderate |
| 80051 | Chlorophyll a (In-Situ_EO_FB) | 20182018 | 8007 | SWE-008 | 9 Blekinge archipelago and Kalmarsund, outer | Western Gotland Basin | 1.94 | 3.46 | 2.00 | 0.71 | 0.60 | Moderate |
| 80051 | Chlorophyll a (In-Situ_EO_FB) | 20182018 | 8008 | SWE-009 | 10 Öland and Gotland coastal water | Eastern Gotland Basin | 2.09 | 4.11 | NA | 0.34 | 0.39 | Poor |
| 80051 | Chlorophyll a (In-Situ_EO_FB) | 20182018 | 8009 | SWE-010 | 11 Gotland north-west coastal water | Western Gotland Basin | 2.09 | 3.77 | NA | 0.37 | 0.41 | Moderate |
| 80051 | Chlorophyll a (In-Situ_EO_FB) | 20182018 | 8010 | SWE-011 | 12n Östergötland and Stockholm archipelago | Northern Baltic Proper | 2.33 | 3.41 | NA | 0.46 | 0.47 | Moderate |
| 80051 | Chlorophyll a (In-Situ_EO_FB) | 20182018 | 8011 | SWE-012 | 12s Östergötland and Stockholm archipelago | Western Gotland Basin | 2.24 | 3.28 | NA | 0.46 | 0.47 | Moderate |
| 80051 | Chlorophyll a (In-Situ_EO_FB) | 20172017 | 8012 | SWE-013 | 13 Östergötland inner coastal water | Western Gotland Basin | 2.91 | 6.01 | NA | 0.32 | 0.37 | Poor |
| 80051 | Chlorophyll a (In-Situ_EO_FB) | 20172017 | 8013 | SWE-014 | 14 Östergötland outer coastal water | Western Gotland Basin | 2.09 | 2.34 | NA | 0.60 | 0.56 | Moderate |
| 80051 | Chlorophyll a (In-Situ_EO_FB) | 20182018 | 8014 | SWE-015 | 15 Stockholm archipelago, outer coastal water | Northern Baltic Proper | 2.09 | 2.95 | NA | 0.47 | 0.48 | Moderate |
| 80051 | Chlorophyll a (In-Situ_EO_FB) | 20182018 | 8015 | SWE-016 | 16 South Bothnian Sea,inner coastal water | Bothnian Sea | 2.30 | 4.04 | NA | 0.35 | 0.41 | Moderate |
| 80051 | Chlorophyll a (In-Situ_EO_FB) | 20182018 | 8016 | SWE-017 | 17 South Bothnian Sea, outer coastal water | Bothnian Sea | 2.00 | 2.74 | NA | 0.44 | 0.48 | Moderate |
| 80051 | Chlorophyll a (In-Situ_EO_FB) | 20182018 | 8017 | SWE-018 | 18 North Bothnian Sea, Höga kusten, inner | Bothnian Sea | 2.27 | 2.73 | NA | 0.51 | 0.53 | Moderate |
| 80051 | Chlorophyll a (In-Situ_EO_FB) | 20182018 | 8019 | SWE-020 | 20 North Quark inner coastal water | The Quark | 2.28 | 3.67 | 0.00 | 0.35 | 0.45 | Moderate |
| 80051 | Chlorophyll a (In-Situ_EO_FB) | 20182018 | 8019 | SWE-020 | 20 North Quark inner coastal water | The Quark | 1.26 | 3.67 | 0.00 | 0.35 | 0.45 | Moderate |
| 80051 | Chlorophyll a (In-Situ_EO_FB) | 20182018 | 8020 | SWE-021 | 21 North Quark outer coastal water | The Quark | 2.07 | 2.24 | 0.00 | 0.54 | 0.57 | Moderate |
| 80051 | Chlorophyll a (In-Situ_EO_FB) | 20182018 | 8020 | SWE-021 | 21 North Quark outer coastal water | The Quark | 1.29 | 2.24 | 0.00 | 0.54 | 0.57 | Moderate |
| 80051 | Chlorophyll a (In-Situ_EO_FB) | 20182018 | 8023 | SWE-024 | 24 Stockholm inner archipelago | Northern Baltic Proper | 3.00 | 5.56 | 0.00 | 0.36 | 0.41 | Moderate |
| 80051 | Chlorophyll a (In-Situ_EO_FB) | 20182018 | 8023 | SWE-024 | 24 Stockholm inner archipelago | Northern Baltic Proper | 1.19 | 5.56 | 0.00 | 0.36 | 0.41 | Moderate |
| 80052 | Total phytoplankton biomass | 20182018 | 8002 | SWE-003 | 4 West Coast outer coastal water, Kattegat | Kattegat | 1.11 | 0.68 | NA | 0.73 | 0.84 | High |
| 80052 | Total phytoplankton biomass | 20182018 | 8003 | SWE-004 | 5 South Halland and north Öresund coastal water | Kattegat | 2.12 | 0.89 | NA | 0.79 | 0.90 | High |
| 80052 | Total phytoplankton biomass | 20172017 | 8004 | SWE-005 | 6 Öresund inner coastal water | The Sound | 0.76 | 0.28 | NA | 0.90 | 0.95 | High |
| 80052 | Total phytoplankton biomass | 20172017 | 8005 | SWE-006 | 7 Skåne coastal water | Arkona Basin | 0.32 | 0.19 | NA | 0.96 | 0.97 | High |
| 80052 | Total phytoplankton biomass | 20172017 | 8017 | SWE-018 | 18 North Bothnian Sea, Höga kusten, inner | Bothnian Sea | 0.46 | 0.38 | NA | 0.54 | 0.68 | Good |
| 80052 | Total phytoplankton biomass | 20172017 | 8019 | SWE-020 | 20 North Quark inner coastal water | The Quark | 0.37 | 0.77 | NA | 0.21 | 0.36 | Poor |
| 80052 | Total phytoplankton biomass | 20172017 | 8020 | SWE-021 | 21 North Quark outer coastal water | The Quark | 0.39 | 0.32 | NA | 0.47 | 0.70 | Good |