 Coastal fish size
2 Relevance of the indicator
Coastal fish communities are of high ecological and socio-economic importance in the Baltic Sea, both for ecosystem functioning and for recreational and small-scale coastal commercial fishery activities. As such, the state of coastal fish communities generally reflects the ecological state in the coastal ecosystems.
Changes in the long-term development of the size structure of coastal fish species mainly reflects effects of changes in the level of human exploitation (fishing), natural predation pressure, eutrophication, and growth rates which in turn are influenced by temperature and food web structure.
2.1 Ecological relevance
Coastal fish, especially piscivorous species, are recognized as being important components of coastal food webs and ecosystem functioning (Eriksson et al. 2009; Baden et al. 2012; Olsson et al. 2012; Östman et al. 2016; Olsson 2019). Moreover, since many coastal fish species are rather local (Saulamo & Neuman 2005; Laikre et al. 2005; Olsson et al. 2011; Östman et al. 2017a), the temporal development of coastal fish communities might reflect the general environmental state in the monitoring locations (Bergström et al. 2016b; Östman et al. 2017b).
Large piscivores in coastal ecosystems, such as perch and pikeperch, generally have a structuring role in the ecosystem, mainly via top-down control on lower trophic levels (reviewed in Olsson 2019). Also, viable populations of key coastal fish species are generally considered to reflect an environmental status with few eutrophication symptoms and balanced food webs (Eriksson et al. 2011; Baden et al. 2012; Östman et al. 2016; Eklöf et al. 2020). In perch, the size distribution tends to decrease with increasing levels of eutrophication along the coast (Östman et al. in prep).
Large individuals of a population often contribute disproportionally to reproduction and are thus highly important for the sustainability of fish populations (Birkeland & Dayton 2005, Olin et al. 2012). Large piscivores such as perch and pikeperch, are targeted by both the small-scale coastal commercial fishery and by recreational fishing (Olsson et al. 2015; Bergström et al. 2016b), and the share of large perch in a population is affected by the fishing pressure in an area (Bergström et al. 2016a, Östman et al. in prep). In general, fishing can have a stronger effect on fish size structure than changes in temperature (Blanchard et al. 2005). Thus, the size distribution of a population gives an indication both regarding the fishing pressure in the area as well as the state of the coastal ecosystem.
2.2 Policy relevance
The core indicator is relevant to the following specific 2021 Baltic Sea Action Plan actions:
- B15: Develop and coordinate monitoring and assessment methods, where ecologically relevant, for specified representative coastal fish species, populations and communities, by 2023. Based on these assessment methods, to regularly assess the state of the coastal fish community through selected coastal fish species and groups, including threatened species, by at latest 2023. Based on the results of the assessment, develop and implement management measures with the ambition to maintain or improve the status of coastal fish species, including migratory species by 2027. Cross-reference to actions in other segments.
- B35: By 2024 operationalize a set of indicators for the assessment of fish population health, including size and age distribution, where applicable, and, by 2029, for any remaining relevant species.
The core indicator also addresses the following qualitative descriptors of the MSFD for determining good environmental status:
Descriptor 1: ‘Biological diversity is maintained. The quality and occurrence of habitats and the distribution and abundance of species are in line with prevailing physiographic, geographic and climatic conditions’
Descriptor 3: ‘Populations of commercially exploited fish and shellfish are within safe biological limits, exhibiting a population age and size distribution that is indicative of a healthy stock’
and the following criteria of the Commission Decision:
- Criterion D1C3 (population demographic characteristics of the species),
- Criterion D3C3 (the age and size distribution of individuals in the population).
In some Contracting Parties the indicator also has potential relevance for implementation of the EU Habitats Directive.
The indicator supports the UN Sustainable Development Goal 14: Conserve and sustainably use the oceans, sea and marine resources for sustainable development.
An overview is provided in Table 1.
Table 1. Policy relevance of this specific HELCOM indicator.
| Baltic Sea Action Plan (BSAP) | Marine Strategy Framework Directive (MSFD) | |
| Fundamental link | Segment: Biodiversity
Goal: “Baltic Sea ecosystem is healthy and resilient”
|
Descriptor 1 ‘Biological diversity is maintained. The quality and occurrence of habitats and the distribution and abundance of species are in line with prevailing physiographic, geographic and climatic conditions’
Descriptor 3 ‘Populations of commercially exploited fish and shellfish are within safe biological limits, exhibiting a population age and size distribution that is indicative of a healthy stock’
Element of the feature assessed – Coastal fish species. |
| Complementary link | Segment: Eutrophication
Goal: “Baltic Sea unaffected by eutrophication”
Segment: Sea-based activities Goal: “Environmentally sustainable sea-based activities”
|
Descriptor 1 ‘Biological diversity is maintained. The quality and occurrence of habitats and the distribution and abundance of species are in line with prevailing physiographic, geographic and climatic conditions’
Descriptor 4 Ecosystems, including food webs
|
| Other relevant legislation: | EU Birds Directive (migrating species Article 4 (2); barnacle goose, pied avocet, Mediterranean gull, Caspian tern, sandwich tern, common tern, Arctic tern, little tern listed in Annex I)
Birds Directive Article 12 report, parameter “Population trend”; Agreement on the Conservation of African-Eurasian Migratory Waterbirds (AEWA); UN Sustainable Development Goal 14. |
|
2.3 Relevance for other assessments
The status of biodiversity is assessed using several core indicators. Each indicator focuses on one important aspect of the complex issue. In addition to providing an indicator-based evaluation of the size structure of key coastal fish species, this indicator also contributes to the overall biodiversity assessment along with the other biodiversity core indicators. The results on perch are utilised in the integrated assessments via the BEAT tool.
3 Threshold values
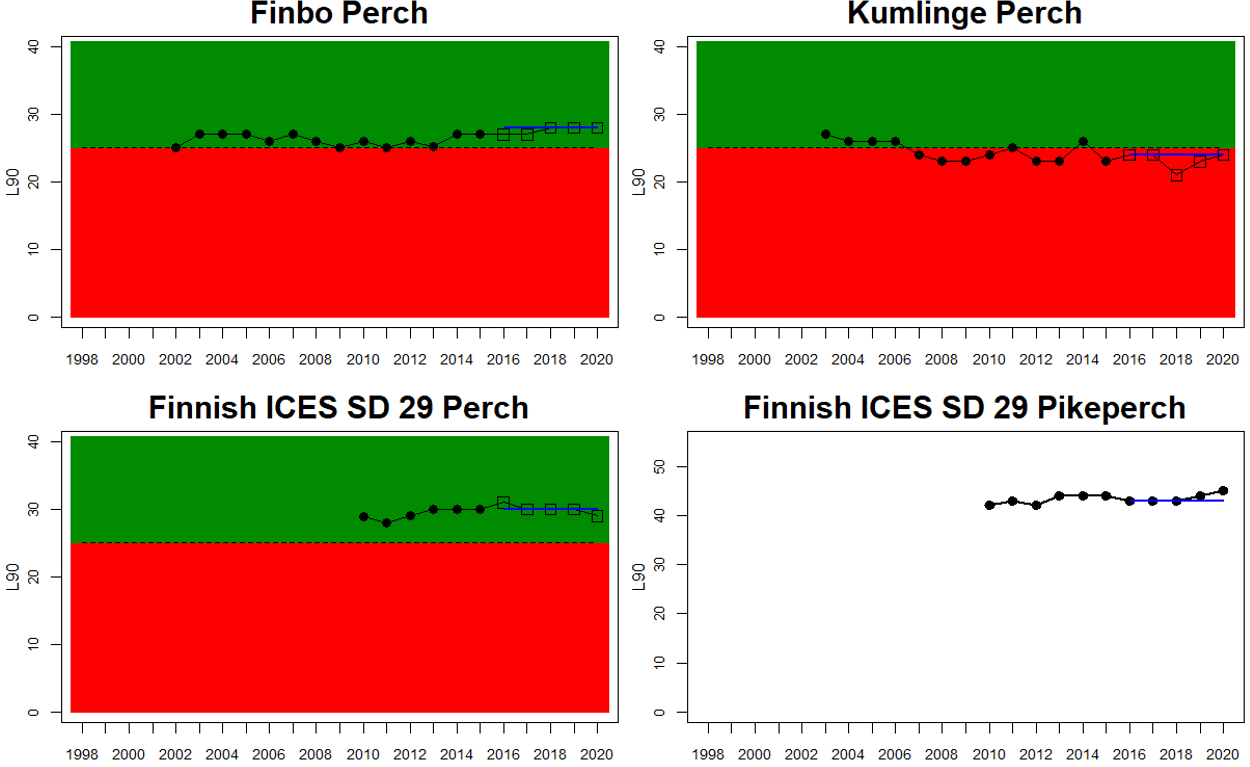
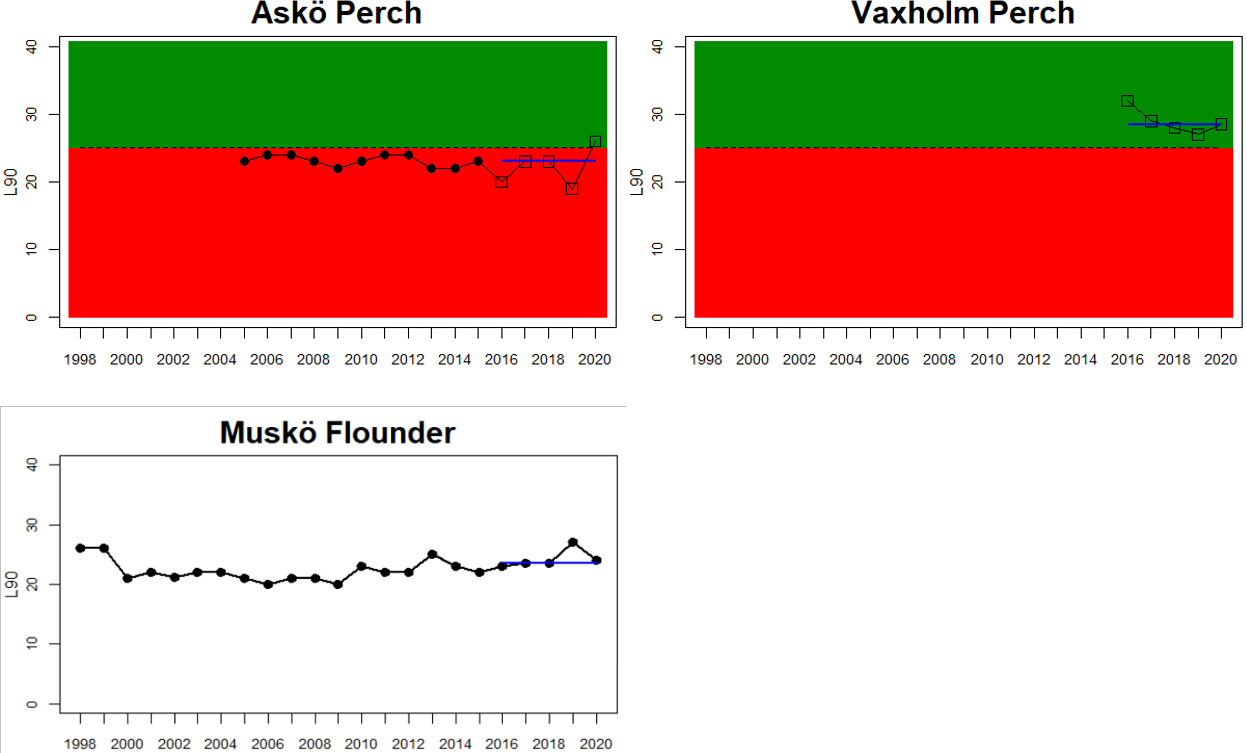
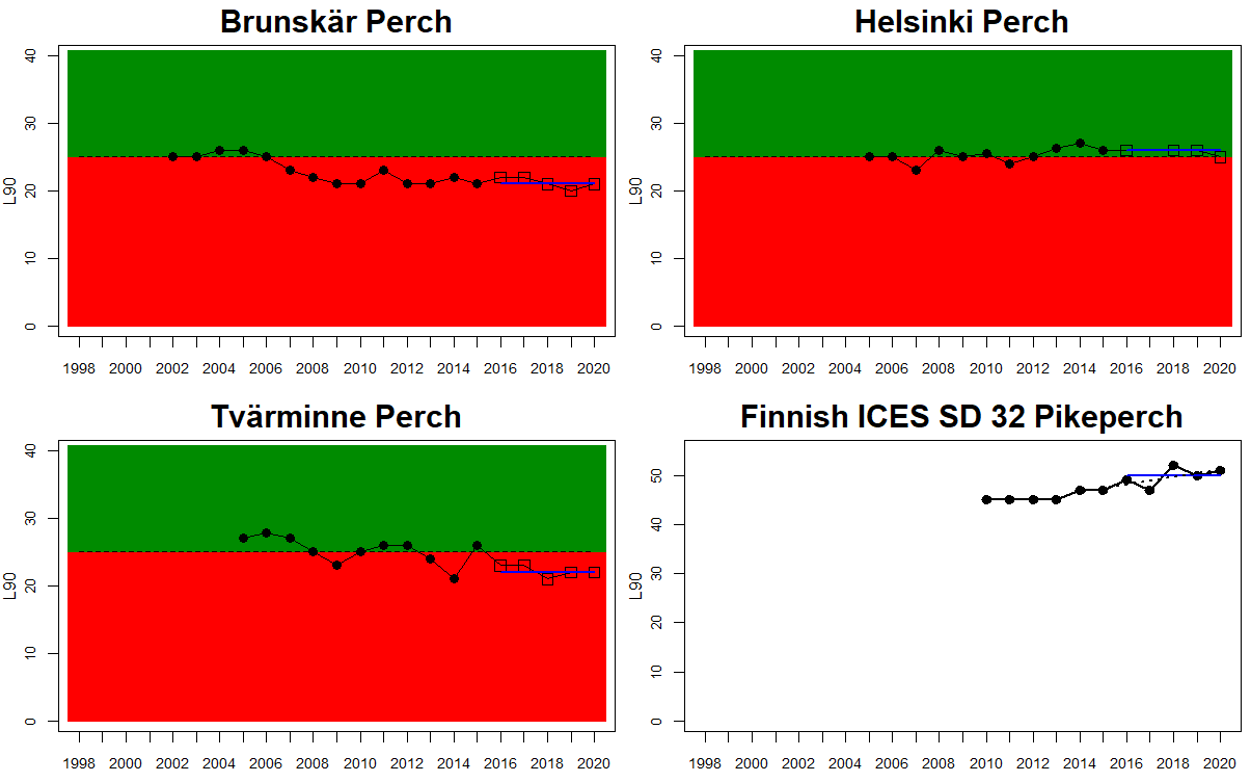
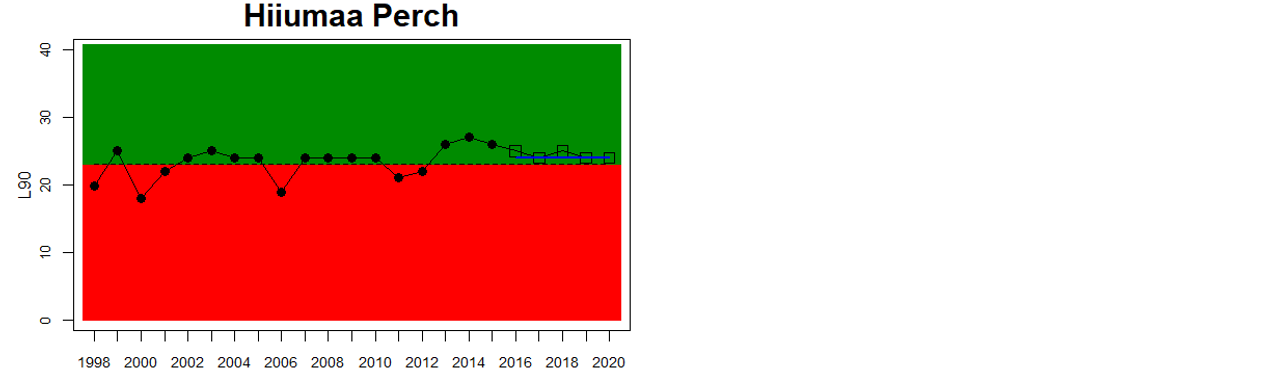
Good Status is achieved when key species size distribution (in this case represented by the indicator L90) is above a specified threshold value (Figure 2). The threshold approach is implemented for perch. For flounder and pikeperch, trends over time for L90 are visualised.
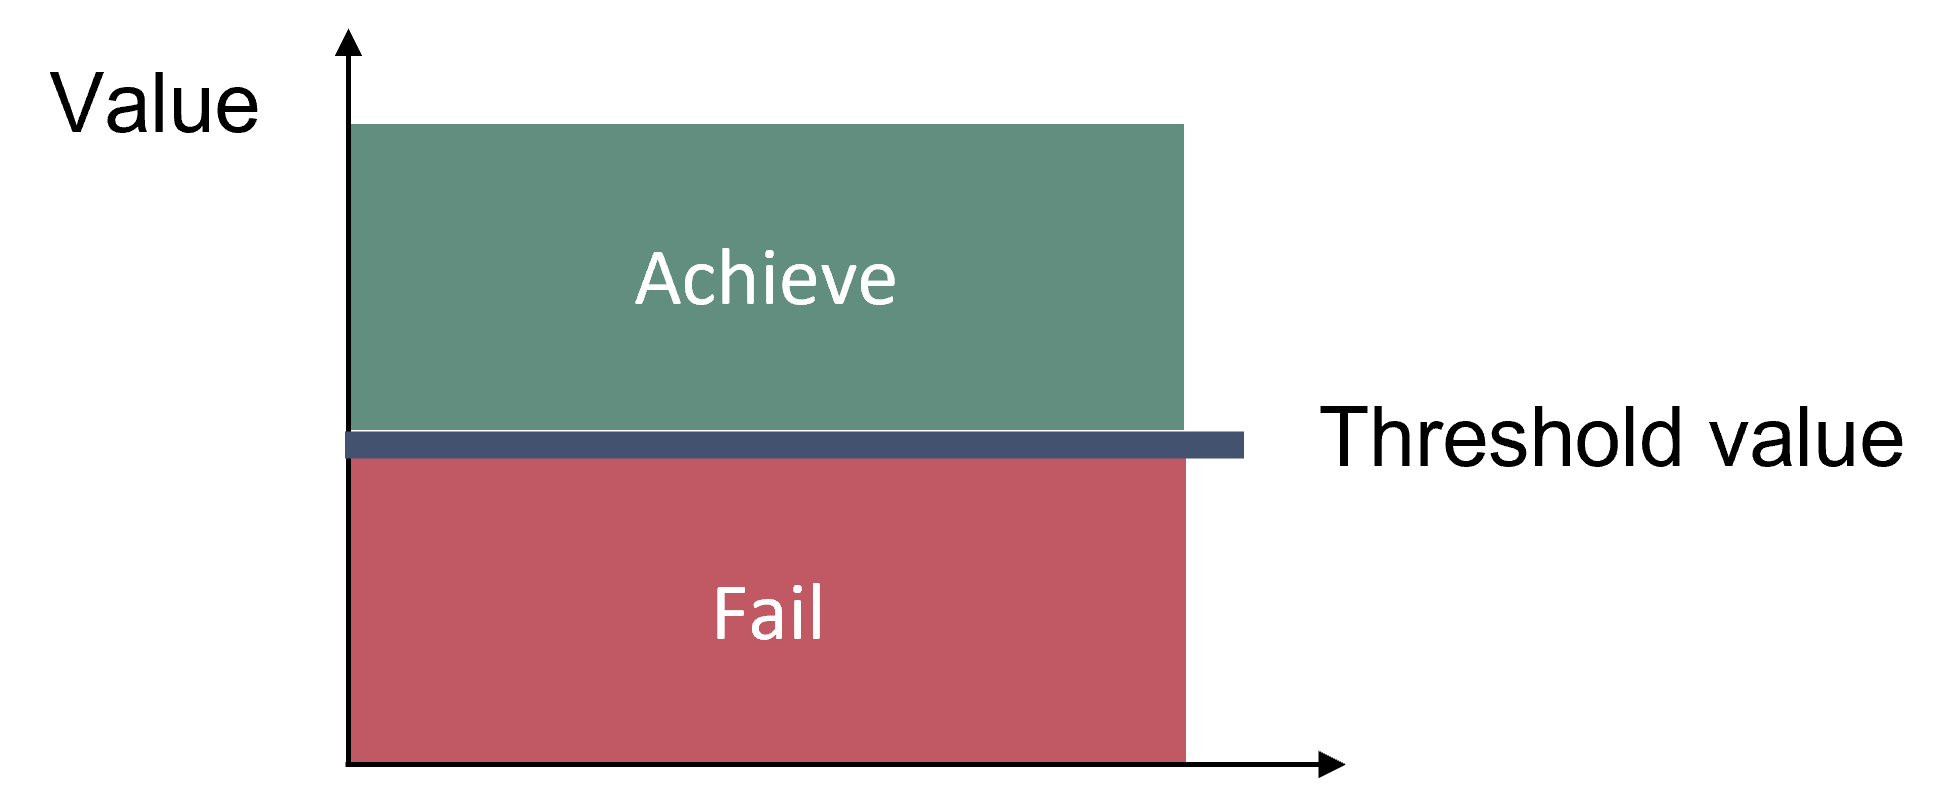
Figure 2: Schematic representation of the threshold value applied in the ‘coastal fish size distribution core indicator.
The 90th percentile of the size distribution (L90) is used as an indicator of the size structure of large fish in the stock. Before calculating L90, a lower cut-off of 15 cm is applied to lower the influence on the indicator value from yearly fluctuations in recruitment. For perch, the fish in each monitoring location are evaluated in relation to a gear-specific threshold of 25 cm for Nordic multimesh nets and fyke nets, and 23 cm for net series. The median of the L90-values during the assessment period is evaluated in relation to this threshold to determine whether the stock is in good status or not. Perch is evaluated along the coasts of the central and northern parts of the Baltic Sea down to its more southern and western areas. Flounder and pikeperch are not evaluated in relation to a threshold, and therefore no quantitative status evaluation is made. Changes in L90 over time in flounder and pikeperch are instead evaluated according to a trend-based approach, with a linear regression for year 2014-2020 and the significance threshold set to p<0.1. Flounder is evaluated in the southern and central parts of the Baltic Sea and pikeperch is assess in Finnish waters.
3.1 Setting the threshold value(s)
Gear specific threshold values for good status are implemented for perch. The thresholds were arrived at by analysing data on perch size distributions from 33 monitoring locations throughout the Baltic Sea coasts, using time series data of varying length from each location, ending at the year 2020 and with the longest time series starting in 1978 (Bolund et al. in prep). The data was composed of annual survey data from Sweden, Estonia, Latvia, Lithuania, and Poland, and a combination of annual monitoring data and commercially collected data from Finland that fulfilled minimum data criteria (namely, a minimum of 50 measured individuals per year per location, and a minimum of six years of data from each location). After accounting for the effects of gears, seasons, regions, and time on L90 in a linear mixed-effects model framework, the mean L90 value was set as the threshold (Bolund et al. in prep). There was relatively low amount of variation in L90 across regions and seasons, and also over time, but significant differences in the size distribution due to gears used necessitated gear-specific thresholds of 23 cm for net series and 25 cm for Nordic multimesh nets and fyke nets. The data used to map size structure of perch likely reflects a situation where the populations are not overfished (i.e. we see no strong negative trends over time), but still exploited at a level that the size structure is impacted.
It is challenging setting a regional threshold value for L90 in flounder. This is because of substantial differences in L90 among regions, gears, seasons and ecotypes, and often there is a combination of these factors in different areas (Bolund et al. in prep). Therefore, trends over time in L90 for flounder are addressed in the different monitoring areas during the past 12 years (i.e. two MSFD management cycles). For pikeperch, data from commercial fisheries in Finland provide sample sizes that allow estimation of L90 and evaluation of trends over time. The limited data on pikeperch however does not allow a formal analysis of threshold values.
4 Results and discussion
4.1 Status evaluation
The current evaluation of environmental status using coastal fish covers the period 2016-2020. The evaluation is based on time-series data of varying length depending on the temporal coverage of data collection in each monitoring location. Time-series starts between the years 1998 and 2018 (Table 2). Evaluations of status in relation to a threshold for L90 in perch were carried out for 15 of the in total 42 HELCOM scale 3 assessment units, and time-series data up to and including the year 2020 were available for all 15 of these units. Evaluations of trends in size distribution over time were carried out in flounder for 12 and for pikeperch three of the scale 3 assessment units. As data on flounder is unique for two assessment units (Eastern Gotland Basin Latvian Coastal waters and Eastern Gotland Basin Swedish Coastal waters), in total 17 assessment units were considered for the size structure of coastal key fish species. For more information on assessment units, see HELCOM Monitoring and Assessment Strategy Annex 4 .
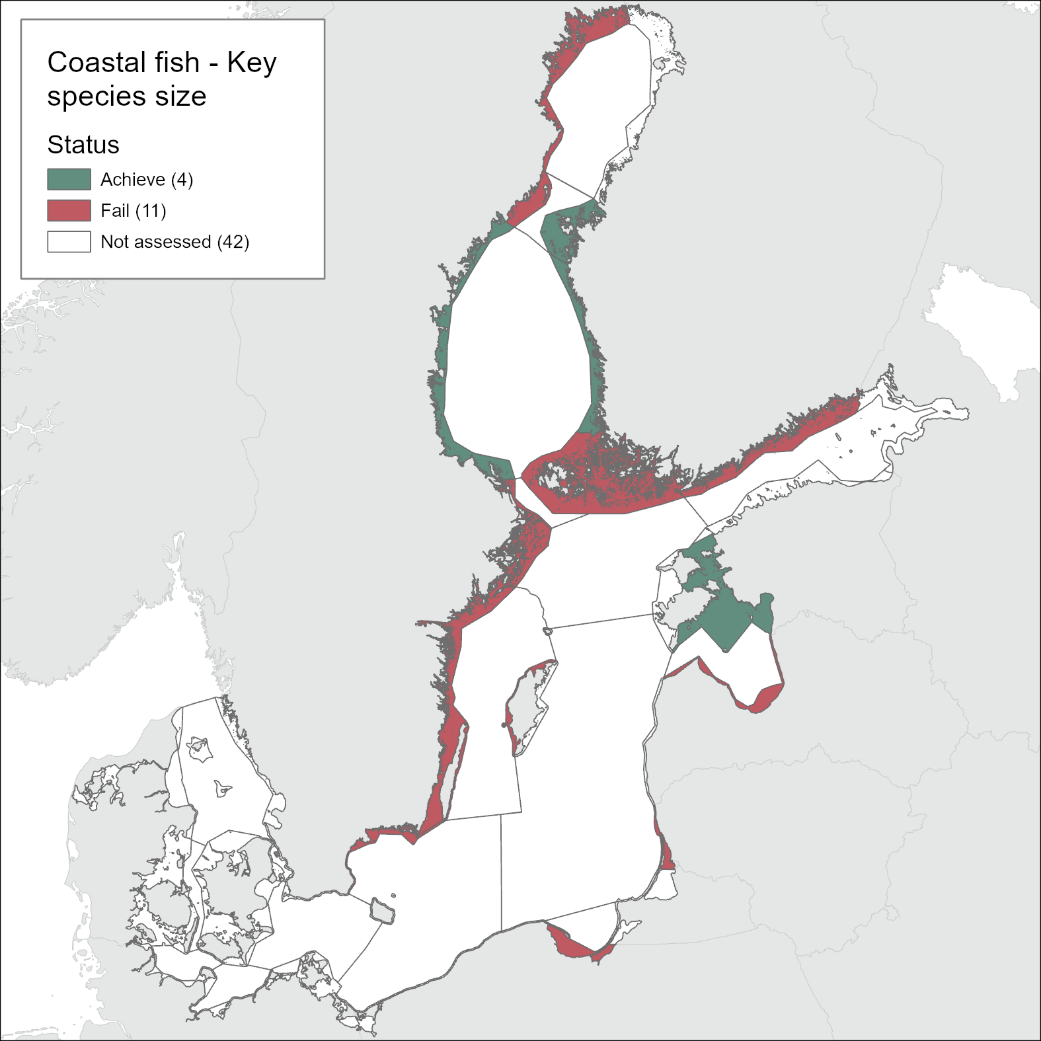
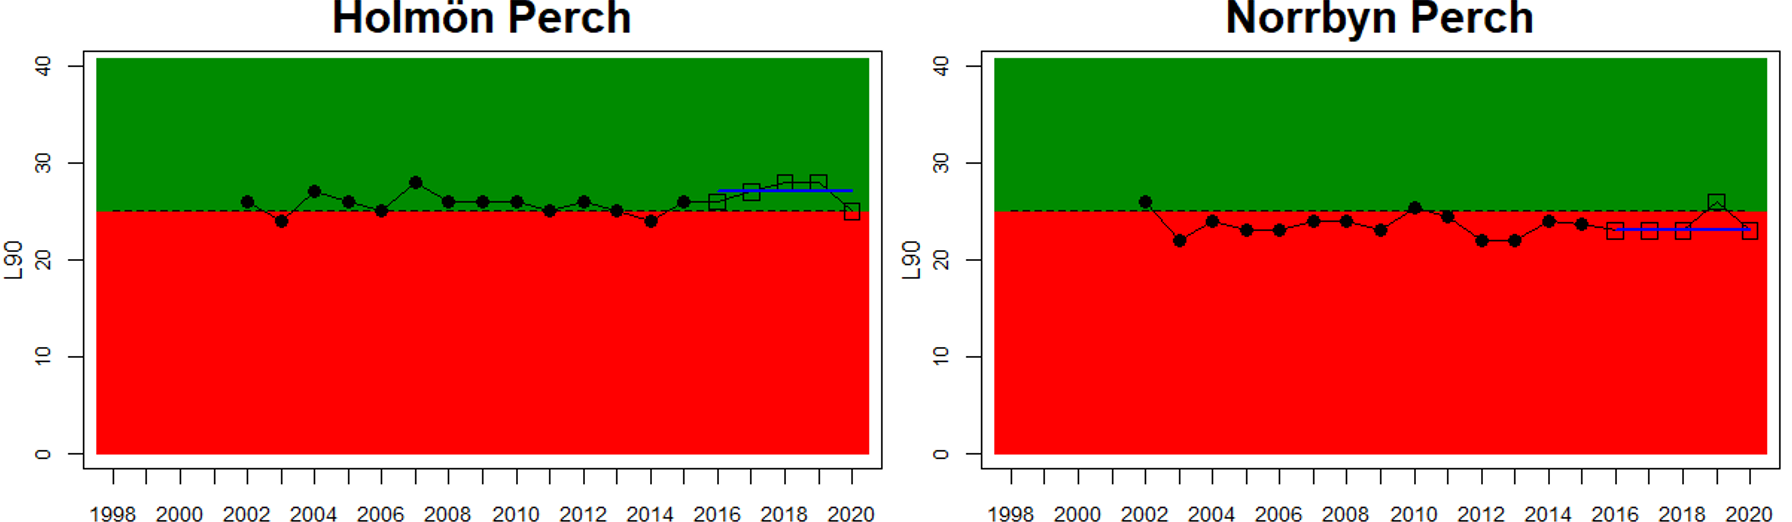
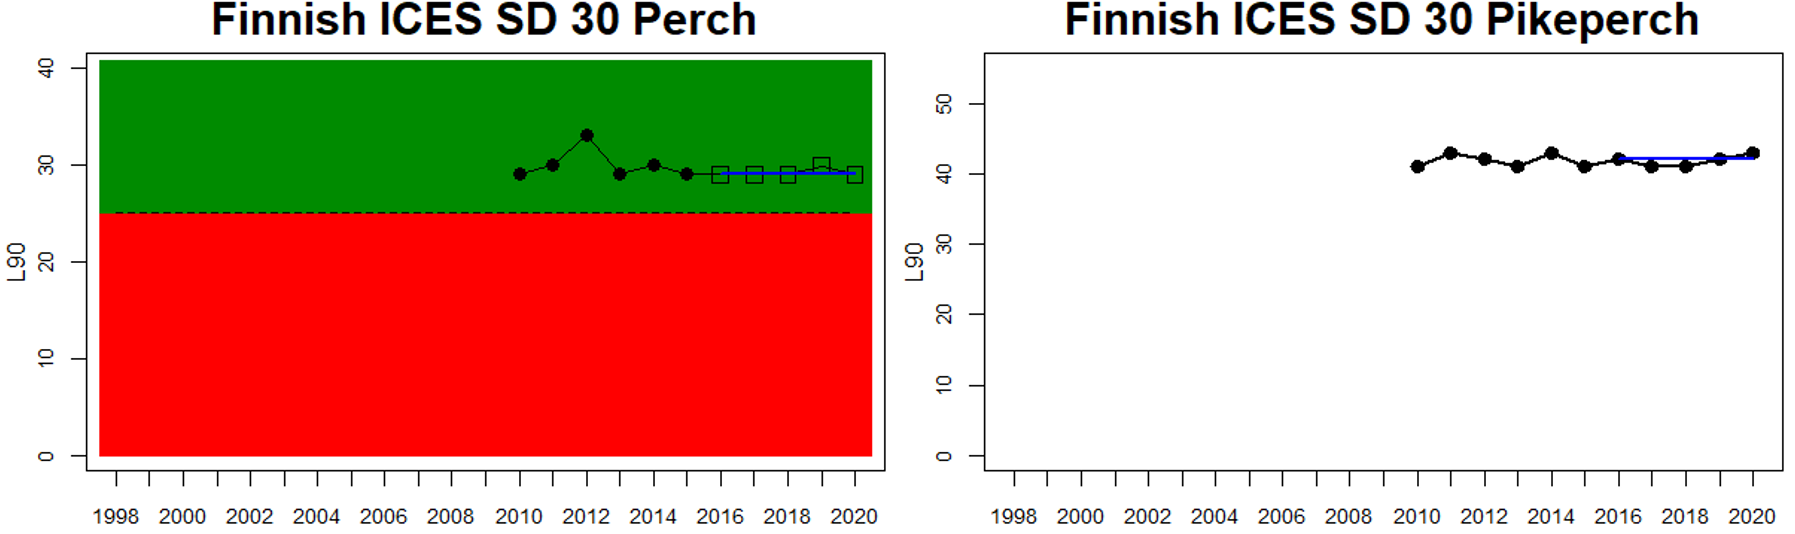
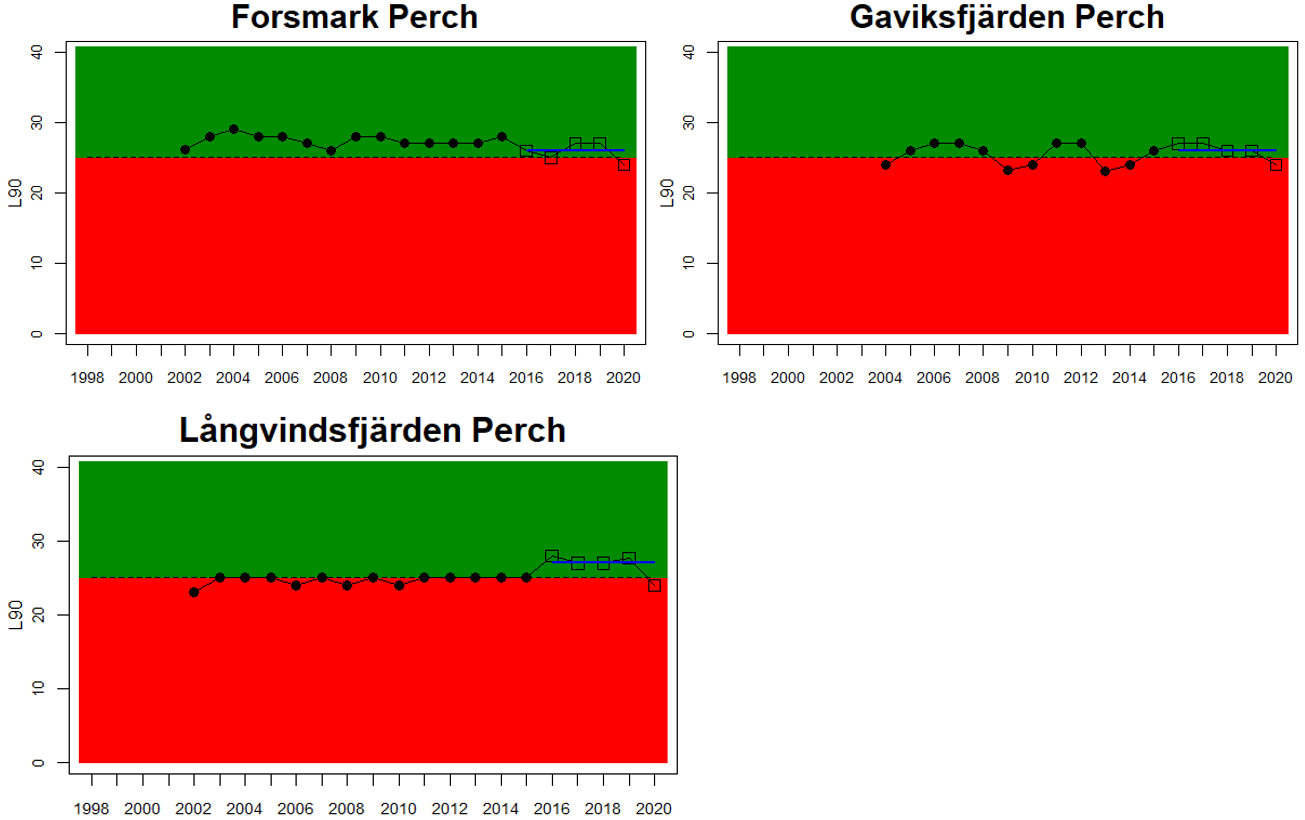
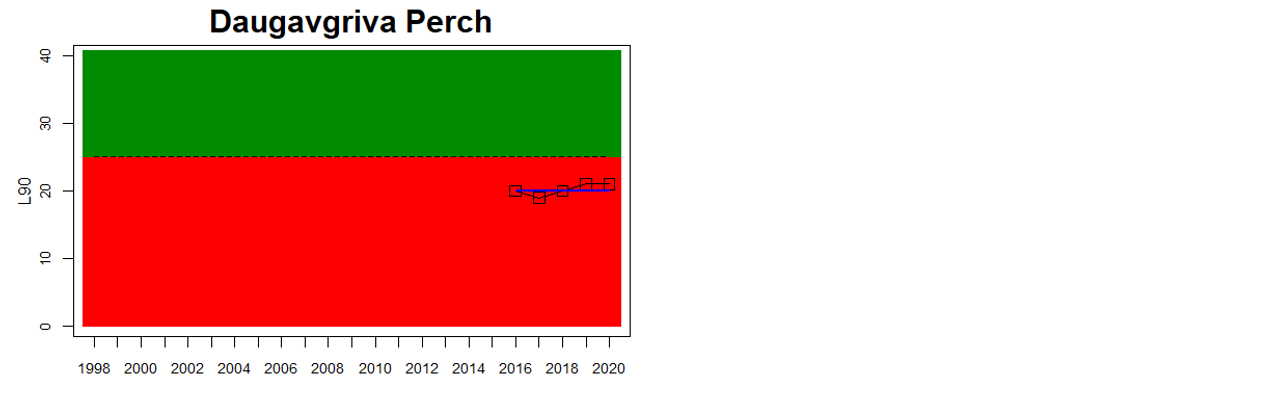
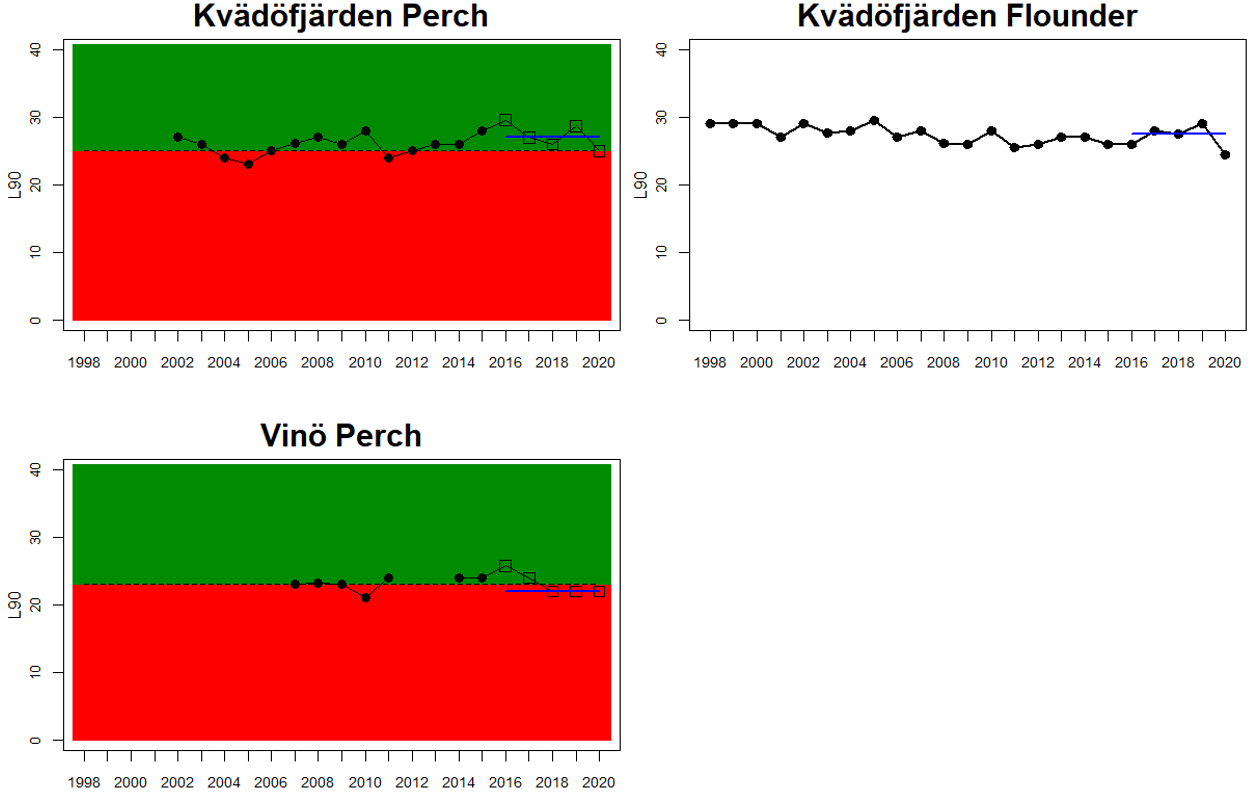
Good status is achieved for L90 in perch in half of the monitoring locations (14 out of 28 locations, Figure 3), indicating a moderate overall environmental status. There is substantial variation in L90 on small geographical scales. More northern parts of the Baltic Sea do, however, tend to have a better status, but a couple of monitoring locations in the Bothnian Bay and the Quark do not meet the threshold values whereas a few locations in the southern parts of the Baltic Sea meet the threshold. This substantial spatial variation in the status across coastal areas suggests that the role of local (for example fishing) more than regional (for example eutrophication and climate) factors are of importance for explaining the observed variation in the status of the indicator. When summarising over HELCOM assessment units, good status is achieved in only 4 out of 15 evaluated units, indicating an overall poor environmental status regarding perch size distribution in the Baltic Sea when aggregated on larger spatial scales. The indicator L90 meets the threshold value only in the Bothnian Sea (both Sweden and Finland), the Quark in Finland, and in the Gulf of Riga in Estonia.
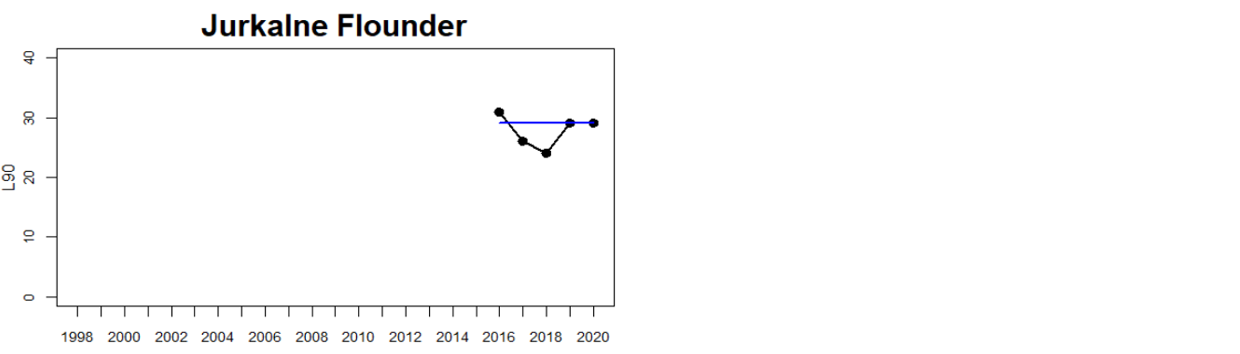
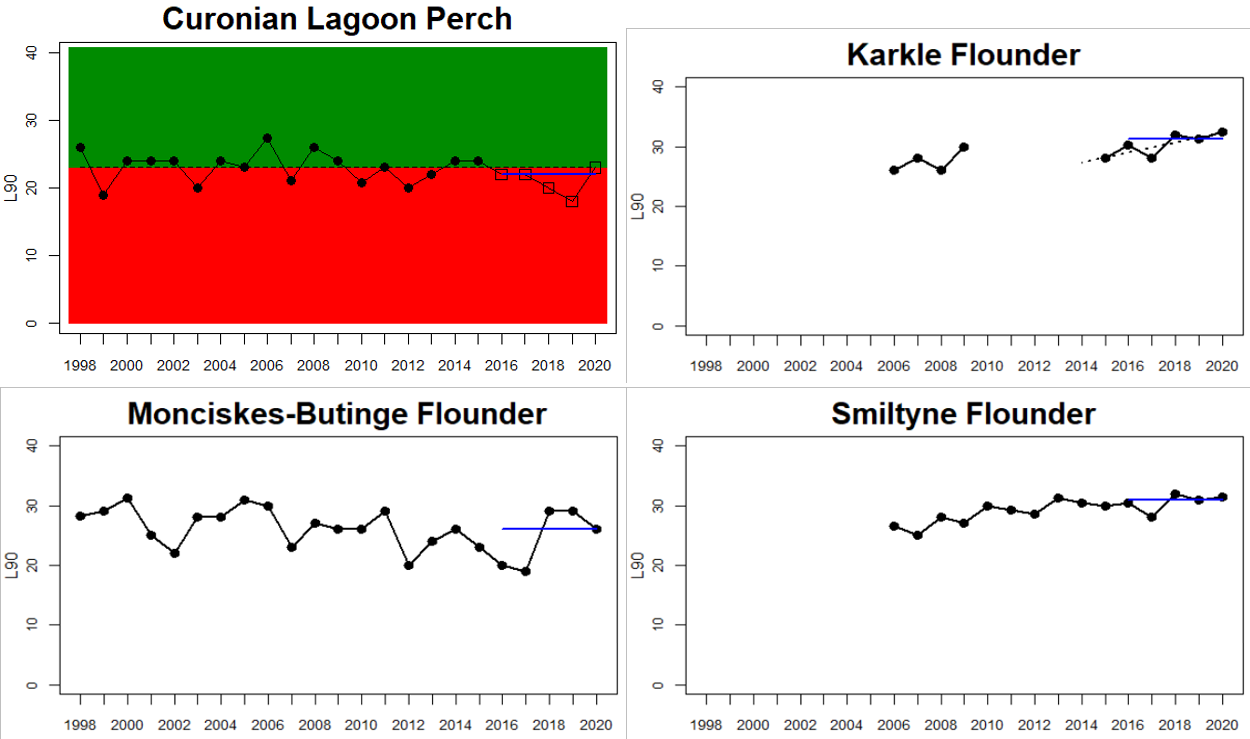
Status was not evaluated in relation to a threshold for flounder and pikeperch. Flounder showed substantial variation between monitoring locations in L90, with values between 23 and 31, indicating regional differences in the size distribution of flounder. However, L90-values were stable over time in 11 out of the in total 12 evaluated monitoring locations, with one area showing an increasing trend over time (Karklė, Lithuania). Similarly, pikeperch showed stable values over time in 2 out of 3 evaluated monitoring locations, with the third area showing an increasing trend over time (Finnish ICES SD 32). Thus, the more limited data on flounder and pikeperch suggests that the proportion of large fish in general tends to be rather stable over time.
Table 2. Status evaluation outcome per monitoring location and assessment unit for the assessment period 2016-2020. GS = good status, nGS = not good status. The current value is shown for perch. For flounder and pikeperch, the current value with accompanying direction of trend is shown (+: increasing, s: stable, -: decreasing).
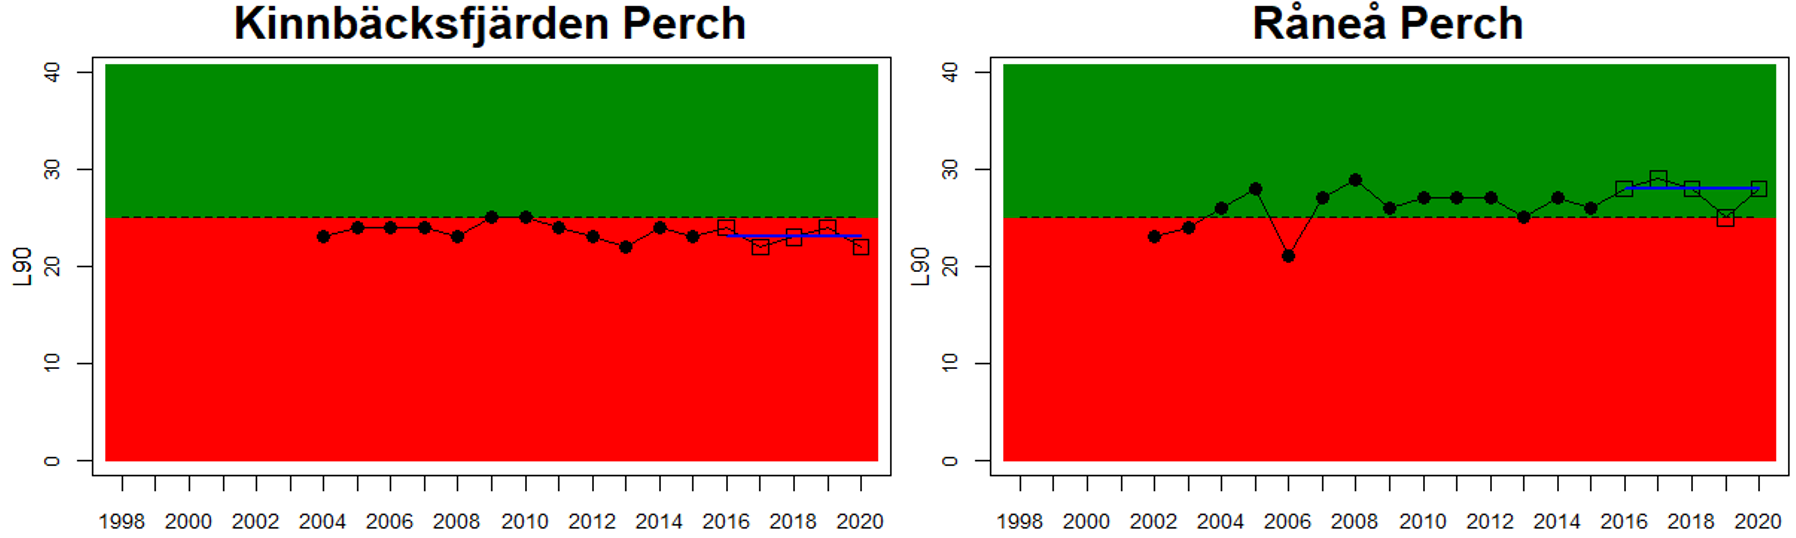
In the Bothnian Bay, L90 was only evaluated for perch in Sweden. The status was good in one of the monitoring locations (Råneå) and poor in the other location evaluated (Kinnbäcksfjärden). In the Quark, the indicator is applied in both Swedish and Finnish coastal waters. The status was good in one Finnish and one Swedish monitoring location, but poor in the second Swedish monitoring location (Norrbyn). The overall status of coastal fish size distribution in the Swedish parts of the Bothnian Bay and the Quark is therefore poor, and good in the Finnish parts of the Quark.
In the Bothnian Sea, Åland Sea and Archipelago Sea, L90 is evaluated for perch in Sweden, and perch and pikeperch in Finland. The status was good in all four (Finnish and Swedish) evaluated monitoring locations in the Bothnian Sea, poor in both Swedish locations in the Åland Sea, and poor in one (perch in Kumlinge) of the three Finnish locations in the Archipelago Sea. This results in an overall good status in the Bothnian Sea, but poor status in Åland Sea and Archipelago Sea.
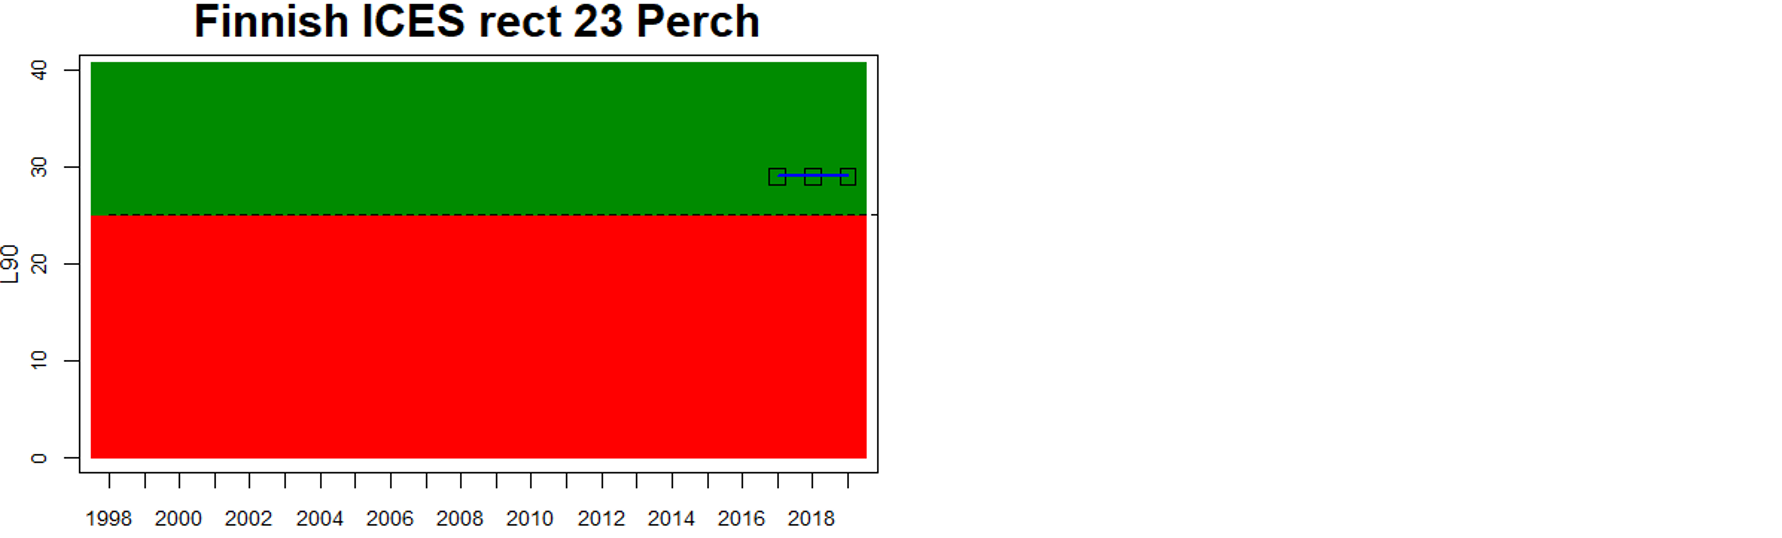
In the Northern Baltic Sea perch and flounder are included in the evaluation, and no evaluation is undertaken in Finland. The status of L90 perch is poor in one of the locations (Askö) and L90 flounder is stable in the monitoring location of Muskö, rendering an overall poor status of the assessment unit. In the Gulf of Finland, data is only available for Finnish coastal waters with three locations having data for perch and one for pikeperch. For perch the status is good in all but one (Helsinki) locations yielding an overall poor status of the assessment unit.
In the Gulf of Riga and Western Gotland Basin, perch and flounder (only in Sweden) is evaluated. There are differences in status across locations with about half the monitoring locations in each region showing good status. Besides for the Estonian waters, the One-Out-All-Out principle thus results in an overall poor status of coastal fish size distribution in these parts of the Baltic Sea.
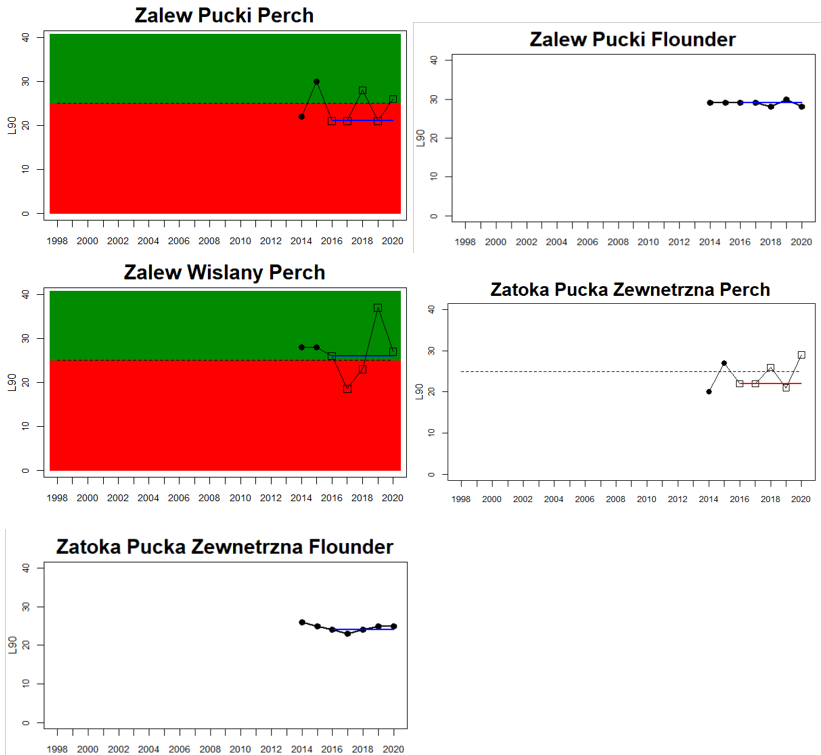
In the more southern parts of the Baltic Sea, the Eastern Gotland Basin, Gdansk Basin, and the Bornholm Basin, both perch and flounder are included in the evaluation. The status is consistently poor for perch in all but one monitoring location (Zalew Wiślany, Poland), yielding an overall poor status in these assessment units.
Bothnian Bay
Sweden
The Quark
Finland
Sweden
Bothnian Sea
Finland
Sweden
Åland Sea
Sweden
Archipelago Sea
Finland
Northern Baltic Sea
Sweden
Gulf of Finland
Finland
Gulf of Riga
Estonia
Latvia
Western Gotland Basin
Sweden
Eastern Gotland Basin
Latvia
Lithuania
Sweden
Gdansk Basin
Poland
Bornholm Basin
Sweden
Arkona Basin
Sweden
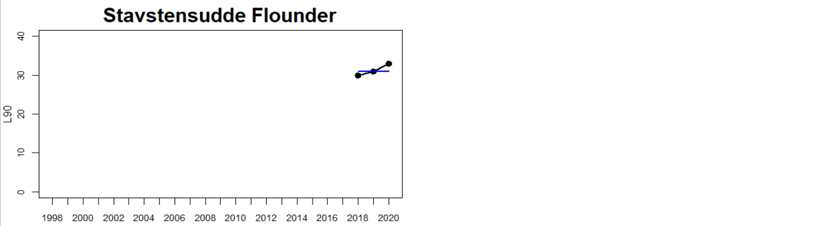
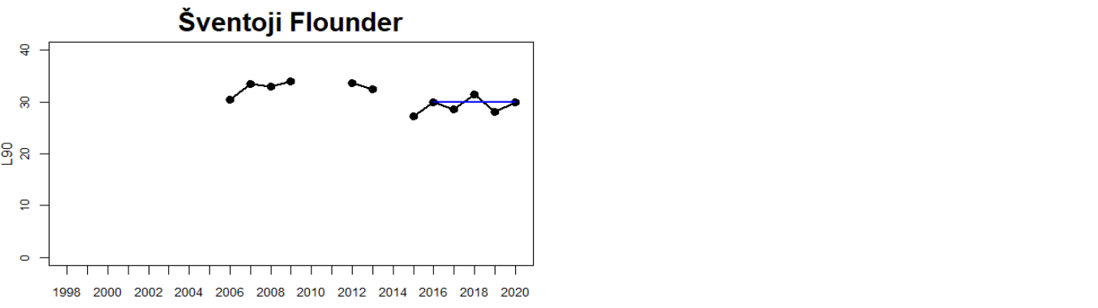
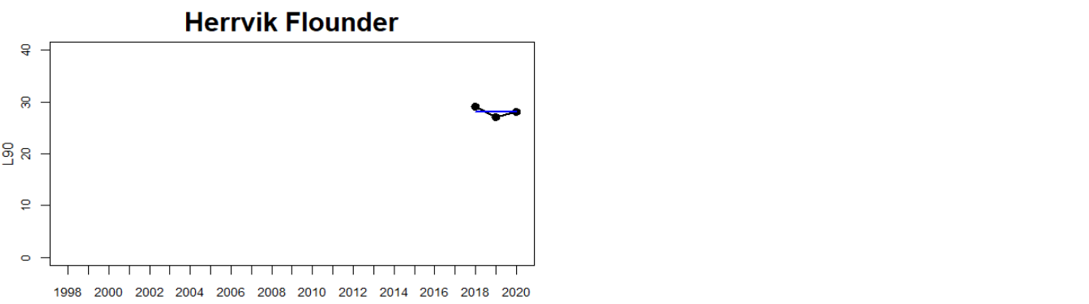
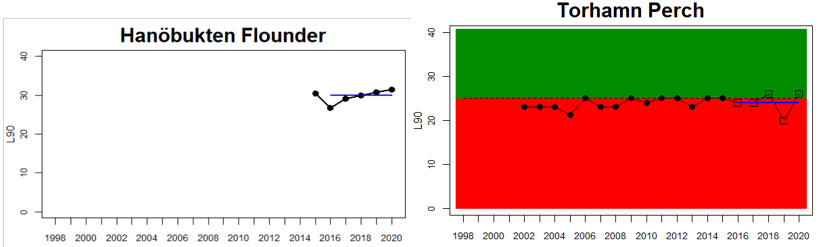
Figure 3. Status evaluations are displayed per sub-basin for each monitoring location. For perch, the gear-specific threshold value is displayed by a black dotted line between fields of green (good status) and red (not good status). The results preceding the assessment period are displayed with filled circles and the results during the assessment period with empty squares with the median displayed as a blue line. For flounder and pikeperch, trends over time are shown with the median during the assessment period marked by a blue line, and the hatched black trend-line indicates a significant positive or negative linear trend at p < 0.1 during 2014-2020 for the times-series in each location.
4.2 Trends
The size distribution of coastal fish was not included in the previous status evaluation, HOLAS II. Available data dating back to the late 1990s and early 2000s do, however, suggest that L90 in perch have been rather stable over time with no strong temporal trends (Bolund et al. in prep; Figure 3). L90 in flounder and pikeperch have likewise tended to remain stable over time in terms of L90 in most monitoring locations (Bolund et al. in prep; Figure 3). Despite that no previous evaluation has been undertaken, this lack of consistent regional trends over time indicates that there does not seem to be a general worsening of the situation regarding size distribution of key species in the Baltic Sea. However, current data only allows for an evaluation of three species with a rather limited spatial coverage. Moreover, L90 in perch did not meet the threshold for good environmental status in 11 out of 15 HELCOM assessment units (Table 3), suggesting that the environmental status in terms of L90 for perch in the Baltic Sea is consistently not good in the majority of evaluated coastal areas.
4.3 Discussion text
In conclusion, the overall environmental status of coastal fish size distribution is poor, when summarising the results over the 15 HELCOM assessment units that allow an evaluation of status against a threshold in perch. Good status is achieved in only 4 of the 15 evaluated units (Table 3). There were often pronounced differences in environmental status between different monitoring locations within the same assessment unit, indicating that local factors are important for the size structure of perch (Table 4). A poor status of the size distribution can have negative consequences for both the ecosystem functioning and for the availability of large fish for commercial and recreational fisheries. Local variation in L90 may reflect variation in fishing pressure (selectively removing large individuals), eutrophication (affecting growth rates), and predation by apex predators, but more information is needed to disentangle the relative importance of these effects. L90 does appear to be stable over time in perch, as well as in flounder and pikeperch, indicating that the size structure of key coastal fish species is not deteriorating further over time in the Baltic Sea.
Table 3. Perch size structure status integrated over HELCOM assessment units. Shown is the accumulated number of monitoring areas within each assessment unit that achieves or fails to achieve good environmental status, and the integrated status over the coastal area using the BEAT tool with the One-Out-All-Out principle, GS = good status, nGS = not good status.
5 Confidence
In general, the confidence varies across assessment units, countries and monitoring programmes since, for example, the number of years for which coastal fish monitoring has been carried out varies between locations, as does the spatial coverage of monitoring within assessment units, and thus the confidence in the actual evaluation. Generally, the confidence of the evaluation is higher in locations where data is available for the full assessment period (2016-2020), and where there is good spatial coverage of monitoring, and where the monitoring is fisheries independent and targeting the focal species of the evaluation.
The confidence scoring followed the principles as outlined in the HELCOM integrated biodiversity assessment. Confidence was scored using four criteria with three different levels (1= high, 0.5 = intermediate, and 0 = low). The criteria used were:
Confidence in the accuracy of the estimate (ConfA). Confidence in the evaluation is determined by the number of years during the assessment period that falls above or below the median. If all values fall either below or above the median, the confidence is high. If all values except one fall above/below the median, the confidence is medium, and if all values except two fall above/below, the confidence is low.
Confidence in the temporal coverage of evaluation (ConfT). Level 1 = data for all years during 2016-2020, 0.5 = one or two years of data missing during 2016-2020, and 0 = three or more years of data missing during 2016-2020.
Confidence in spatial representability of the evaluation (ConfS). Level = 1 full coverage/several monitoring locations per assessment unit given its size, 0.5 = two or more monitoring locations per assessment unit, and 0 = one monitoring location per assessment unit.
Methodological confidence (ConfM). For coastal fish all assessment units reach level 1 since all monitoring programs included in the evaluation are described in the coastal fish monitoring guidelines .
Table 4. Confidence in the status evaluation according to the criteria developed within HELCOM for the integrated biodiversity assessment.
In general, the confidence in the accuracy of the evaluation (ConfA) is medium to high in the majority of the assessment units. Only in the Polish coastal waters and the southernmost Swedish assessment unit (Bornholm Basin) is ConfA low as a result of strong interannual variation in L90 values during the assessment period (Figure 3). The confidence in the temporal coverage (ConfT) is high in most areas except for some Finnish areas due to missing data in one or more of the years in the assessment period. The confidence in spatial representability (ConfS) is generally high in Finnish, Lithuanian, and Polish areas, but poorer in other assessment units. The integrated confidence considering all four categories varies between high (in 7 units) and intermediate (in 8 units) depending on assessment unit (Table 3 and Figure 4).
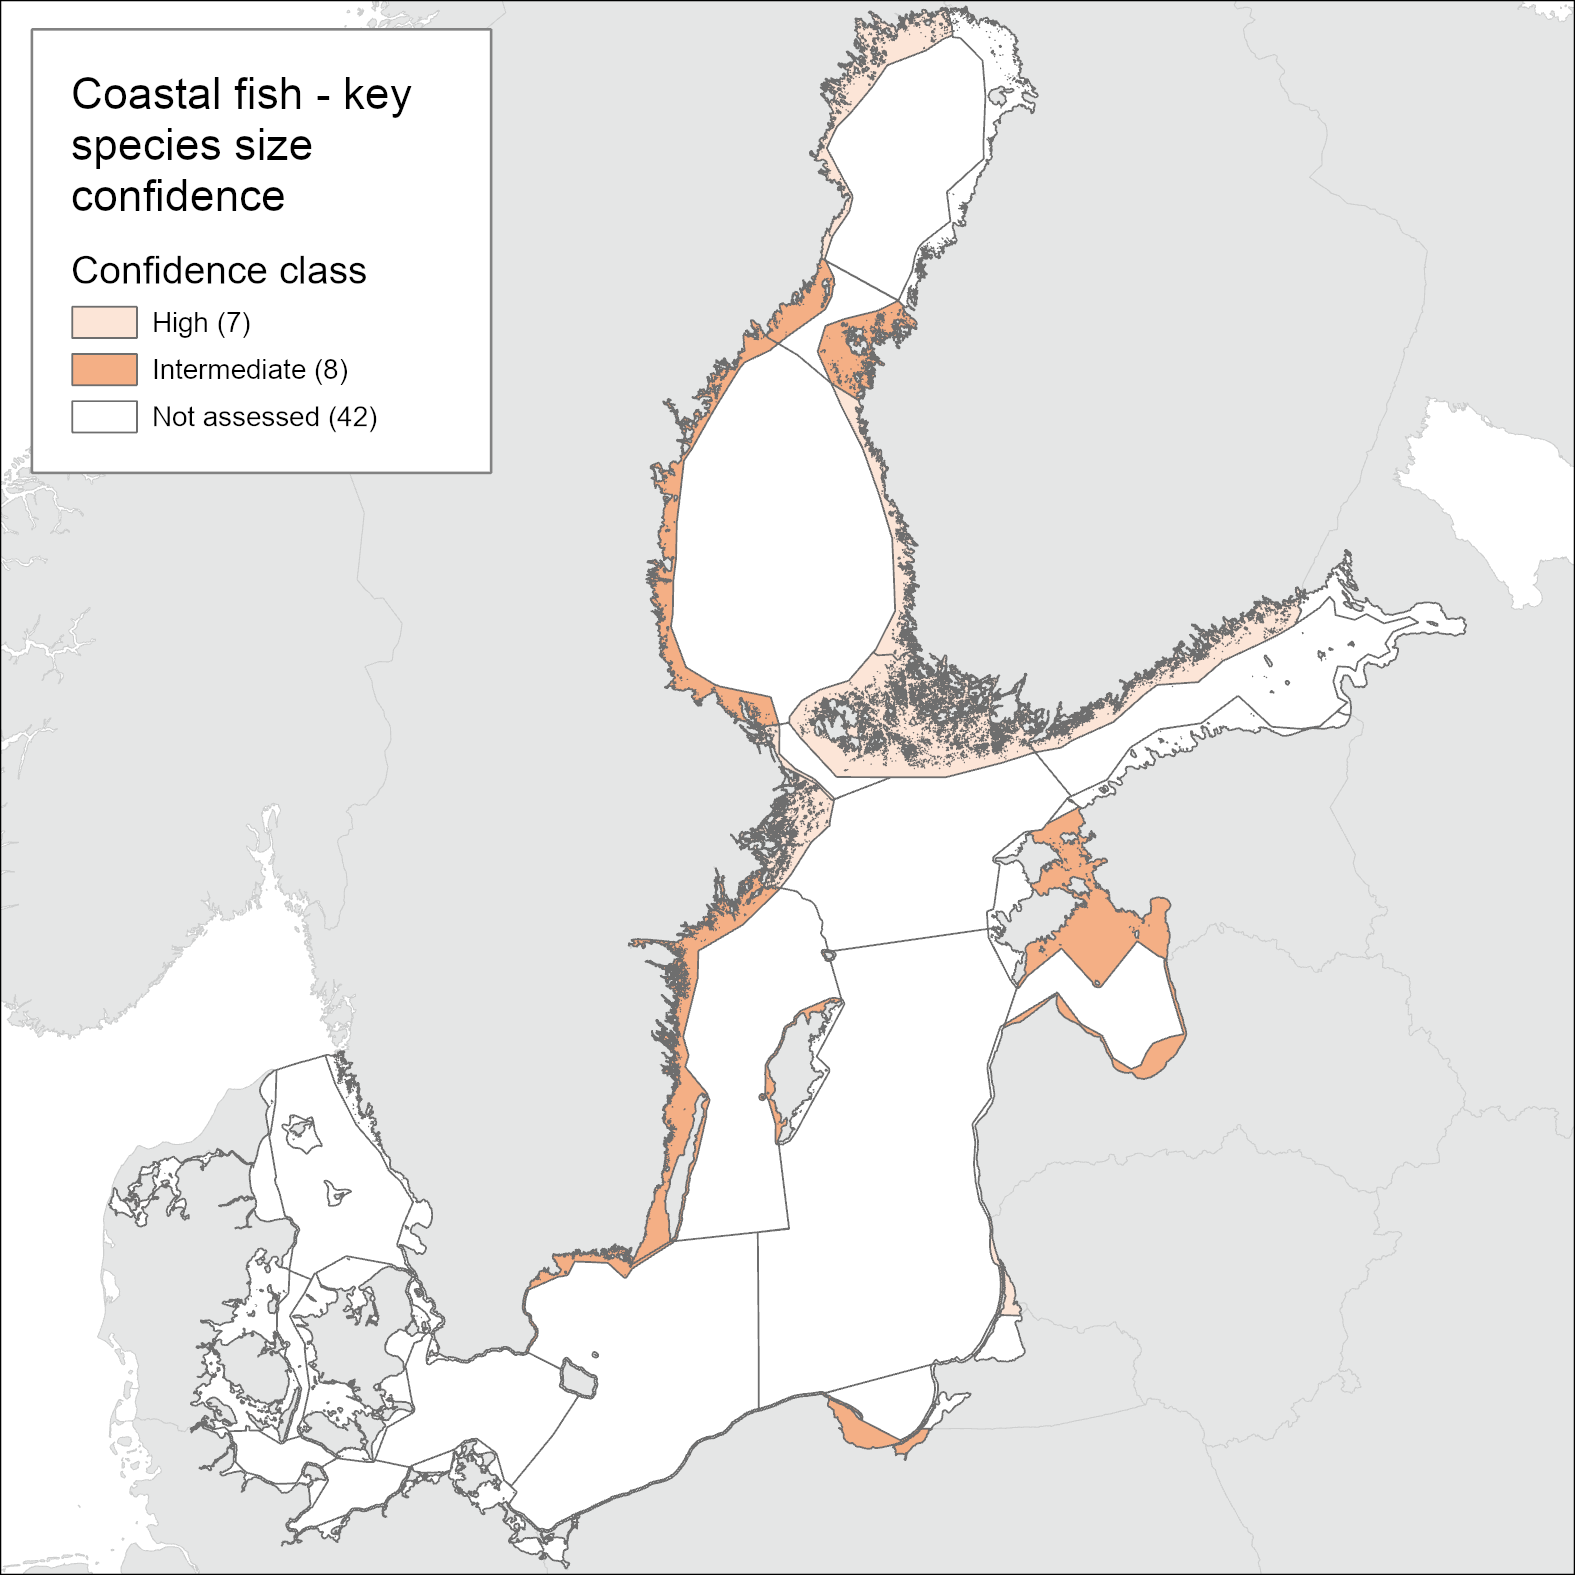
Figure 4. Maps of confidence of the current evaluation. See Table 3 for details.
The confidence concept as developed for the purposes of the integrated biodiversity assessment is not fully applicable to coastal fish as further evaluation of the precision in data and the congruence in status across monitoring locations within assessment units would provide additional needed information.
6 Drivers, Activities, and Pressures
The state of coastal fish species in the Baltic Sea is influenced by multiple pressures, including climate (cf. Chapter 7), eutrophication, fishing mortality and exploitation of essential habitats, but also by natural processes such as food web interactions and predation from apex predators (reviewed in Olsson 2019). In perch, the size distribution tends to decrease with increasing levels of eutrophication along the coast (Östman et al. in prep).
Large individuals of a population often contribute disproportionally to reproduction and are thus highly important for the sustainability of fish populations (Birkeland & Dayton 2005, Olin et al. 2012). Large coastal piscivores such as perch, pike, and pikeperch, are targeted by both the small-scale coastal commercial fishery as well as by recreational fishing (Olsson et al. 2015; Bergström et al. 2016b), with the recreational sector dominating in some countries (HELCOM 2015), whereas flounder are exploited both in the offshore and coastal commercial fishery. In some areas of the Baltic Sea, flounder is also targeted by recreational fisheries. The share of large perch in a population is affected by the fishing pressure in an area, and increases in Marine Protected Areas (Bergström et al. 2016a, Östman et al. in prep). Thus, the size distribution of a population gives an indication both regarding the fishing pressure in the area as well as the state of the coastal ecosystem.
Table 5. Brief summary of relevant pressures and activities with relevance to the indicator.
| General | MSFD Annex III, Table 2a | |
| Strong link |
Several pressures, both natural and human, acting in concert affect the state of coastal key fish species. These include climate, eutrophication, fishing, and exploitation and loss of essential habitats, prey depletion and habitat loss. There is also a strong link to the food web structure and the food quality, which are indirectly influenced by human activities. | Biological pressures:
Physical pressures:
Pressures by substances, litter and energy
|
| Weak link | There might also be effects of hazardous substances and non-indigenous species on coastal fish species. | Substances, litter and energy
– Input of other substances (e.g. synthetic substances, non-synthetic substances, radionuclides) Biological pressures:
|
7 Climate change and other factors
Fish of freshwater origin dominate most Baltic coastal areas, some preferring warm (perch, cyprinids) and others cold waters (salmonids, burbot). These species often migrate back to their natal spawning ground for spawning, resulting in many local populations that adapt to local conditions. Small scale environmental variations, local fishing pressure, habitat availability, and food web interactions influence their reproduction, recruitment, growth, and mortality (HELCOM 2021).
A common response to warming in fish is increased growth rates and smaller adult sizes (Atkinson 1994). Evidence from perch does suggest that growth rate may increase as a result of warming (Mustamäki et al. 2020). However, adult body size can be maintained despite increased growth under warming over several generations (Huss et al. 2019). Higher water temperature has already improved the reproduction of many spring and summer spawners, including perch and pikeperch (Böhling et al. 1991, Karås & Thoresson 1992, Lehtonen & Lappalainen 1995, Karås 1996, Kjellman et al. 2001, Heikinheimo et al. 2014, Kokkonen et al. 2019, Pekcan-Hekim et al. 2011). In contrast, the reproduction of autumn-spawners, e.g., vendace and whitefish, have been disfavoured by warm winters and their distribution decreasing with less ice cover and higher winter temperatures (Candolin & Voigt 2020, Kallio-Nyberg et al. 2019, Veneranta et al. 2013, Bergenius et al. 2013). Species preferring warm waters have become more common relative to winter-spawning species (Veneranta et al. 2013). In the future earlier spawning, faster egg, and larval development, increased larval survival of spring spawning freshwater coastal fish species can be expected due to warmer water temperatures (Kjellman et al. 2001, Heikinheimo et al. 2014, Kokkonen et al. 2019, Pekcan-Hekim et al. 2011, Tamario et al. 2019, Härmä et al. 2008, Dainys et al. 2019). Earlier migration from nursery habitats, as a consequene of warmer water, may influence food web interactions with negative effects on piscivorous species (Kjellman et al. 2001, Östman et al. 2014). The effect of water temperature on body growth differs among species and size-classes: growth is generally expected to increase for small but not for large fish (Karås & Thoresson 1992, Candolin & Voigt 2020, Dahl et al. 2014, Kallio-Nyberg et al. 2004, Härmä et al. 2008, Dainys et al. 2019) Possible brownification of coastal waters may decrease body growth (Böhling et al. 1991).
8 Conclusions
8.1 Future work or improvements needed.
Due to the presence of natural environmental gradients across the Baltic Sea and the rather local appearance of coastal fish communities (and hence their different structures and responses to environmental change), the spatial coverage of monitoring should be improved in some areas in order to enhance the confidence of the evaluation outcome. When designating new potential monitoring programmes, it should be considered that the levels of direct human impact on the coastal fish communities in many of the existing monitoring locations are low, and future locations should include more heavily affected areas.
Moreover, the current monitoring in the northern and eastern parts of the Baltic Sea is designed to target coastal fish species that prefer higher water temperatures and that dominate coastal areas during warmer parts of the year, typically those with a freshwater origin such as perch. Monitoring of species like whitefish, herring, flounder and cod that dominate coastal fish communities in more exposed parts of the coast and during colder parts of the year are, however, rather poorly represented. Increased monitoring of these species and components should be considered in the future establishment of coastal fish monitoring programmes.
The current evaluation implements a threshold for L90 only for perch. A threshold for flounder could not be implemented, due to difficulties in establishing the separate influences of various confounders (such as gears, ecotypes, seasons, and regions) on the size distribution given the available somewhat limited data. Efforts towards developing thresholds for flounder, as well as for other key species, such as pikeperch, whitefish, and pike, are needed, but are dependent on data availability.
9 Methodology
This indicator is evaluated against a gear-specific threshold for perch. For flounder and pikeperch, no evaluation against a threshold is made, but trends over time in L90 are displayed.
The methodology and basis of the indicator evaluation is provided below.
9.1 Scale of assessment
Due to the local appearance of typical coastal fish populations, status evaluations of coastal fish communities are representative for rather small geographical scales. In this evaluation the HELCOM assessment unit scale 3 ‘Open sub-basin and coastal waters’ has been applied. The indicator is not evaluated for the open sea sub-basins since the species in focus are coastal.
Evaluations against a quantitative threshold were carried out for perch in 15 of the 42 assessment units and data up to 2020 was available for all except one assessment units. The number of units evaluated are currently restricted by the availability of monitoring programs. An additional two assessment units was included when also considering flounder, but the assessment of status was not quantitative against a threshold value.
For the integration of status across species and monitoring locations within assessment units, the One-Out-All-Out principle is applied (Dierschke et al. 2021).
The assessment units are defined in the HELCOM Monitoring and Assessment Strategy Annex 4.
9.2 Methodology applied
Gear specific threshold values for good status are implemented for perch. The thresholds were arrived at by analysing data on perch size distributions from 33 monitoring locations throughout the Baltic Sea coasts, using time series data of varying length from each location, ending at the year 2020 and with the longest time series starting in 1978 (Bolund et al. in prep). The data was composed of annual survey data from Sweden, Estonia, Latvia, Lithuania, and Poland, and a combination of annual monitoring data and commercially collected data from Finland that fulfilled minimum data criteria (namely, a minimum of 50 measured individuals per year per location, and a minimum of six years of data from each location). Before calculating L90, a lower cut-off of 15 cm is applied to lower the influence of yearly fluctuations in recruitment. After accounting for the effects of gears, seasons, regions, and time on L90 in a linear mixed-effects model framework, implemented in R (R core team 2022), the mean L90 value was set as the threshold (Bolund et al. in prep). There was relatively low amount of variation in L90 across regions and seasons, and also over time, but significant differences in the size distribution due to gears used necessitated gear-specific thresholds of 23 cm for net series and 25 cm for Nordic multimesh nets and fyke nets. The data used to map size structure of perch likely reflects a situation where the populations are not overfished (i.e. we see no strong negative trends over time), but still exploited at a level that the size structure is impacted (i.e. L90 is higher in no-take areas and MPAs; Östman et al. in prep). To assess environmental status, the median value during the assessment period was evaluated in relation to the gear-specific threshold, and confidence in the status was determined by the number of years that fell above/below the threshold.
It is challenging setting a regional threshold value for L90 in flounder. This is because of substantial differences in L90 among regions, gears, seasons and ecotypes, and often there is a combination of these factors in different areas (Bolund et al. in prep). Therefore, trends over time in L90 for flounder are addressed in the different monitoring areas during the past 12 years (i.e. two MSFD management cycles). Linear trends are evaluated with a significance threshold set at p<0.1. For pikeperch, data from commercial fisheries in Finland provide sample sizes that allow estimation of L90 and evaluation of trends over time. The commercial data on pikeperch may allow the development of threshold values in future (Lappalainen et al. 2016).
Data analyses
The data used for the evaluations are derived from fishery independent monitoring, or commercial catch statistics.
Fishery independent monitoring
The analyses are based on annual length distribution data from all sampling stations in each area.
Commercial catch data
Analyses were based on annual length distribution data from commercial fyke nets, and hence target a somewhat different aspect of the fish community in the area compared to the fisheries independent gill-net monitoring data. In addition, fishing is not performed at fixed stations nor with a constant effort across years. As a result, the estimates from the gillnet monitoring programmes and commercial catch data are not directly comparable, and only relative changes across data sources should be compared.
9.3 Monitoring and reporting requirements
Monitoring methodology
The HELCOM common monitoring on coastal fish is described on a general level in the HELCOM Monitoring Manual in the sub-programme: Coastal fish.
The HELCOM common monitoring on coastal fish is described in guidelines that were adopted in 2014 and updated in 2019.
Current monitoring
The monitoring activities relevant to the indicator that are currently carried out by HELCOM Contracting Parties are described in the HELCOM Monitoring Manual in the Monitoring Concepts table as well as in the guidelines for coastal fish monitoring.
Sub-programme: Coastal fish
Coastal fish monitoring is rather widespread in the Baltic Sea, and at present covers 32 of the total 42 ‘scale 3 HELCOM assessment units’. Coastal areas that lack coastal fish monitoring includes Russia and Germany (in total 7 assessment units) where there is no current and official monitoring program for coastal fish, two assessment units in Finland (Åland Sea Finnish coastal waters and Northern Baltic Proper Finnish coastal waters) and one in Denmark (Kiel Bight Danish coastal waters). The current monitoring where information on the size of Key species can be extracted is less extensive, at present covering 17 assessment units of which 15 allows for an evaluation against a threshold value. In the future, an expansion of the evaluation including data from also Denmark and additional areas in Finland, Estonia and Latvia considering also additional species is expected as data is present but not yet available for an evaluation. Furthermore, in Germany, there is no coordinated monitoring program for coastal fish, but a project aiming to establish such a program was initiated in 2020 in the coastal areas of Schleswig-Holstein.
The current monitoring of coastal fish in the Baltic Sea represents a minimum level of effort and serves as a first step for evaluating the status of coastal fish communities.
The current monitoring likely yields insights into major and large-scale changes in coastal fish communities in the Baltic Sea, but unique and departing responses are possible in some areas.
10 Data
The data and resulting data products (e.g. tables, figures and maps) available on the indicator web page can be used freely given that it is used appropriately and the source is cited.
HELCOM (2023). Size structure of coastal fish (Coastal fish size). HELCOM core indicator report. Online. [Date Viewed], [Web link]. ISSN 2343-2543.
Result: Coastal fish size structure
Data: Coastal fish size structure
Data are typically collected annually in August by national and regional monitoring programmes. Commercial catch statistics in Finland represent total annual catches. See HELCOM (2019) for details. For future updates of this evaluation, data should be collected in each location on an annual basis.
A few time series of coastal fish began in the 1970s (Olsson et al. 2012), whereas others were started in the 1980s and the mid-1990s (HELCOM 2019). In Finland and Sweden, a new coastal fish monitoring programme with a higher spatial resolution was established in the early 2000s, and in Poland and Denmark monitoring data and citizen science data is typically available from the mid 2010s. For more information, see HELCOM 2019.
The data used for this newly developed indicator is not yet made publicly available in the HELCOM database for coastal fish core indicators, COOL (http://www.helcom.fi/baltic-sea-trends/data-maps/biodiversity/), hosted by the HELCOM secretariat. Data will be made available in COOL in future.
Data sources
Coastal fish monitoring is coordinated within the HELCOM FISH PRO III expert network. The network compiles data from fisheries independent monitoring in Finland, Estonia, Latvia, Lithuania, Poland, Germany, Denmark and Sweden. Coastal fish communities in the Baltic Sea areas of Russia are to some extent monitored as well. In Germany, there is no coordinated monitoring program for coastal fish, but a project aiming to establish such a program was initiated in 2020 in the coastal areas of Schleswig-Holstein. In Denmark, there is no coastal fish monitoring programme and the data provided relies on voluntary catch registration by recreational fishermen through the “key-fishermen” project, which has no long-term secured funding (initiated in 2005). Due to lack of geographical coverage, the state of coastal fish communities in Finland is monitored using estimates of catch per unit effort (CPUE) from the small-scaled coastal commercial fishery. There are some additional monitoring locations (see HELCOM 2019), which were not included in this evaluation due to lack of funding in some countries for carrying out status evaluations.
The institutes responsible for sampling are: Natural Resources Institute Finland (Luke) (Finland), Provincial Government of Åland Islands (Finland), Estonian Marine Institute (Estonia), University of Tartu (Estonia), Institute of Food Safety, Animal Health and Environment “BIOR” (Latvia), Nature Research Center (Lithuania), Klaipeda University (Lithuania), National Marine Fisheries Research Institute, Gdynia (Poland), National Institute of Aquatic Resources, Technical University of Denmark (Denmark), Department of Aquatic Resources, Swedish University of Agricultural Sciences (Sweden).
11 Contributors
The HELCOM FISH PRO III expert network on coastal fish:
Jens Olsson, Elisabeth Bolund, Lena Bergström, Örjan Östman, Noora Mustamäki and Rahmat Naddafi, Department of Aquatic Resources, Swedish University of Agricultural Sciences, Sweden
Mikko Olin and Antti Lappalainen, Natural Resources Institute Finland (Luke), Finland
Linda Sundström, Provincial Government of Åland Islands, Finland
Lauri Saks and Roland Svirgsden, Estonian Marine Institute, University of Tartu, Estonia
Laura Briekmane, Institute of Food Safety, Animal Health and Environment “BIOR”, Latvia
Tomas Zolubas and Antanas Kontautas, Klaipeda University, Lithuania
Linas Lozys and Justas Dainys, Nature Research Center, Vilnius, Lithuania
Adam Lejk and Łukasz Dziemian, National Marine Fisheries Research Institute, Gdynia, Poland
Elliot John Brown, National Institute of Aquatic Resources, Technical University of Denmark, Denmark
HELCOM Secretariat: Jannica Haldin, Owen Rowe, Jana Wolf
12 Archive
This version of the HELCOM core indicator report was published in April 2023:
The current version of this indicator (including as a PDF) can be found on the HELCOM indicator web page.
There are no previous versions of this indicator.
13 References
Atkinson, D. (1994) Temperature and organism size – A biological law for ectotherms? Advances in Ecological Research, 25, 2285– 58.
Baden, S. et al. (2012) Shift in seagrass food web structure over decades is linked to overfishing. Mar Ecol Prog Ser 451: 61–73.
Bergenius, M. A., Gårdmark, A., Ustups, D., Kaljuste, O. & Aho, T. (2013) Fishing or the environment–what regulates recruitment of an exploited marginal vendace (Coregonus albula (L.)) population? Adv. Limnol. 64, 57-70, https://doi.org/10.1127/1612- 166X/2013/0064-0029.
Bergström, L. et al. (2016a) Coastal fish indicators response to natural and anthropogenic drivers – variability at temporal and different spatial scales Long term changes in the status of coastal fish in the Baltic Sea. Estuarine, Coastal and Shelf Science 183: 62-72.
Bergström, L. et al. (2016b) Coastal fish indicators response to natural and anthropogenic drivers – variability at temporal and different spatial scales Long term changes in the status of coastal fish in the Baltic Sea. Estuarine, Coastal and Shelf Science 183: 62-72.
Birkeland C, Dayton PK. (2005) The importance in fishery management of leaving the big ones. Trends in Ecology & Evolution. 20(7):356-8.
Blanchard, J. L. et al (2005) Do climate and fishing influence size-based indicators of Celtic Sea fish community structure?ICES Journal of Marine Science 62(3): 405-411.
Bolund, E. (in prep.) An approach for deriving threshold values of the size distribution for data-limited coastal fish species in the Baltic Sea
Böhling, P. et al. (1991) Variations in Year-Class Strength of Different Perch (Perca fluviatilis) Populations in the Baltic Sea with Special Reference to Temperature and Pollution. Can. J. Fish. Aquat. Sci. 48, 1181-1187, https://doi.org/10.1139/f91-142.
Candolin, U. & Voigt, H.-R. (2020) Population growth correlates with increased fecundity in three-spined stickleback populations in a human-disturbed environment. Aquat. Sci. 82, 21, https:// doi.org/10.1007/s00027-020-0695-3.
Dahl, J. et al. (2004) The timing of spawning migration: implications of environmental variation, life history, and sex. Can. J. Zool. 82, 1864-1870, https://doi.org/10.1139/z04-184.
Dainys, J. et al. (2019) Predicted climate change effects on European perch (Perca fluviatilis L.) – A case study from the Curonian Lagoon, south-eastern Baltic. Estuar. Coast. Shelf Sci. 221, 83-89, https://doi.org/10.1016/j.ecss.2019.03.020.
Dierschke V. et al. (2021) Integration methods for Marine Strategy Framework Directive’s biodiversity assessments, EUR 30656 EN, Publications Office of the European Union, Luxembourg.
Eriksson, B.K. et al. (2009) Declines in predatory fish promote bloom-forming macroalgae. Ecological Applications 19: 1975-1988.
Eriksson, B.K. et al. (2011) Effects of altered offshore food webs on coastal ecosystems emphasizes the need for cross-ecosystem management. Ambio 40: 786-797.
Eklöf, J.S. (2020) A spatial regime shift from predator to prey dominance in a large coastal ecosystem. Communications Biology 3:459.
Härmä, M., Lappalainen, A. & Urho, L. (2008) Reproduction areas of roach (Rutilus rutilus) in the northern Baltic Sea: potential effects of climate change. Can. J. Fish. Aquat. Sci. 65, 2678-2688, https://doi.org/10.1139/f08-167.
Heikinheimo, O., Pekcan-Hekim, Z. & Raitaniemi, J. (2014) Spawning stock–recruitment relationship in pikeperch Sander lucioperca (L.) in the Baltic Sea, with temperature as an environmental effect. Fish. Res. 155, 1-9, https://doi.org/10.1016/j.fishres.2014.02.015.
HELCOM (2015) Recreational fisheries in the Baltic Sea and availability of data. http://www.helcom.fi/Documents/HELCOM%20at%20work/Projects/FISH-PRO%20II/Recreational%20fisheries%20in%20the%20Baltic%20Sea%20and%20availability%20of%20data.pdf
HELCOM (2019) HELCOM Guidelines for coastal fish monitoring. https://helcom.fi/wp-content/uploads/2020/01/HELCOM-Guidelines-for-coastal-fish-monitoring-2019.pdf
HELCOM (2021): Climate Change in the Baltic Sea. 2021 Fact Sheet. Baltic Sea Environment Proceedings n°180. HELCOM/Baltic Earth 2021.
Huss M. et al. (2019) Experimental evidence of gradual size-dependent shifts in body size and growth of fish in response to warming. Global Change Biology 25: 2285-2295.
Kallio-Nyberg, I., Jutila, E., Saloniemi, I. & Jokikokko, E. (2004) Association between environmental factors, smolt size and the survival of wild and reared Atlantic salmon from the Simojoki River in the Baltic Sea. J. Fish Biol. 65, 122-134, https://doi. org/10.1111/j.1095-8649.2004.00435.x.
Kallio-Nyberg, I., Veneranta, L., Saloniemi, I., Jokikokko, E. & Leskelä, A. (2019) Different growth trends of whitefish (Coregonus lavaretus) forms in the northern Baltic Sea. J. Appl. Ichthyol. 35, 683-691, https://doi.org/10.1111/jai.13898.
Karås, P. & Thoresson, G. (1992) An application of a bioenergetics model to Eurasian perch (Perca fluviatilis L.). J. Fish Biol. 41, 217-230, https://doi.org/10.1111/j.1095-8649.1992.tb02652.x.
Karås, P. (1996) ecruitment of perch (Perca fluviatilis L.) from Baltic coastal waters. Arch. Hydrobiol. 138, 99-121, https://doi. org/10.1127/archiv-hydrobiol/138/1996/99.
Kjellman, J., Lappalainen, J. & Urho, L. (2001) Influence of temperature on size and abundance dynamics of age-0 perch and pikeperch. Fish. Res. 53, 47-56, https://doi.org/10.1016/S0165- 7836(00)00265-4.
Kokkonen, E., Heikinheimo, O., Pekcan-Hekim, Z. & Vainikka, A. (2019) Effects of water temperature and pikeperch (Sander lucioperca) abundance on the stock–recruitment relationship of Eurasian perch (Perca fluviatilis) in the northern Baltic Sea. Hydrobiologia 841, 79-94, https://doi.org/10.1007/s10750-019- 04008-z.
Laikre, L. et al. (2005) Spatial genetic structure of northern pike (Esox lucius) in the Baltic Sea. Mol Ecol 14: 1955–1964.
Lappalainen, A. et al. (2016) Length at maturity as a potential indicator of fishing pressure effects on coastal pikeperch (Sander lucioperca) stocks in the northern Baltic Sea. Fisheries Research 174: 47-57.
Lehtonen, H. & Lappalainen, J. The effects of climate on the year-class variations of certain freshwater fish species. Canadian Special Publication of Fisheries and Aquatic Sciences 121, 37-44 (1995).
Mustamäki, N. et al. (2020). Fjällbacka, Västerhavet, 1989–2019; Torhamn, södra Egentliga Östersjön, 2002–2019; Kvädöfjärden, Egentliga Östersjön, 1981–2019; Holmöarna, Bottniska viken, 1989–2019. (in Swedish). Institutionen för akvatiska resurser , Sveriges lantbruksuniversitet. Faktablad från integrerad kustfiskövervakning. 2020:1.
Olin M, et al. (2012) Importance of maternal size on the reproductive success of perch, Perca fluviatilis, in small forest lakes: implications for fisheries management. Fisheries Management and Ecology. 19(5):363-74.
Olsson, J. et al. (2011) Genetic population structure of perch, Perca fluviatilis L, along the Swedish coast of the Baltic Sea. Journal of Fish Biology 79: 122–137.
Olsson, J. et al. (2012) Abiotic drivers of coastal fish community change during four decades in the Baltic Sea. ICES Journal of Marine Science 69: 961-970.
Olsson, J. et al. (2015) Using catch statistics from the small scale coastal Baltic fishery for status assessment of coastal fish. Aqua reports 2015:13. Sveriges lantbruksuniversitet, Öregrund.
Olsson, J. (2019) Past and Current Trends of Coastal Predatory Fish in the Baltic Sea with a Focus on Perch, Pike, and Pikeperch. Fishes 4: 7.
Östman, Ö., Boström, M. K., Bergström, U., Andersson, J. & Lunneryd, S.-G. (2014) Estimating Competition between Wildlife and Humans–A Case of Cormorants and Coastal Fisheries in the Baltic Sea. PLoS ONE 8, e83763, https://doi.org/10.1371/journal.pone.0083763.
Östman, Ö. et al. (2016) Top‐down control as important as nutrient enrichment for eutrophication effects in North Atlantic coastal ecosystems. Journal of Applied Ecology. 53: 1138-1147.
Östman, Ö. et al. (2017a) Inferring spatial structure from population genetics and spatial synchrony in population growth of Baltic Sea fishes: implications for management. Fish and Fisheries. 18: 324-339.
Östman, Ö. et al. (2017b) Temporal development and spatial scale of coastal fish indicators in reference sites in coastal ecosystems: hydroclimate and anthropogenic drivers. Journal of Applied Ecology. 54: 557-566.
Östman, Ö. et al. (in prep.) Size-based indicators of coastal fish – useful tools for assessments of ecological status in the Baltic Sea?
Pekcan-Hekim, Z. et al. (2011) Climate Warming and Pikeperch YearClass Catches in the Baltic Sea. Ambio 40, 447-456, https://doi. org/10.1007/s13280-011-0143-7.
R Core Team (2022). R: A language and environment for statistical computing. R Foundation for Statistical Computing, Vienna, Austria. URL https://www.R-project.org
Saulamo, K. & Neuman, E. (2002) Local management of Baltic fish stocks – significance of migrations. Finfo 2002, No. 9.
Tamario, C., Sunde, J., Petersson, E., Tibblin, P. & Forsman, A. (2019) Ecological and Evolutionary Consequences of Environmental Change and Management Actions for Migrating Fish. Front. Ecol. Evol. 7, https://doi.org/10.3389/fevo.2019.00271.
Veneranta, L., Hudd, R. & Vanhatalo, J. (2013) Reproduction areas of sea-spawning coregonids reflect the environment in shallow coastal waters. Mar. Ecol. Prog. Ser. 477, 231-250, https://doi. org/10.3354/meps10169.
14 Other relevant resources
There are no additional resources for this current indicator evaluation.