 Continuous noise
2 Relevance of the indicator
Properties of underwater sound are extremely diverse and sound can be classified in many different ways. A commonly accepted division of underwater sound is into two categories as natural and anthropogenic where the first encompasses all sounds that are produced by either animals or geophysical processes, while the second is produced by human activities. Examples of geophysical processes are rain, wind waves, ice, thunder and seismic activity. Biological sounds (animal vocalization) are produced by cetaceans, seals, fish, and invertebrates. Examples of anthropogenic sounds sources are ships, pile driving, sonars (navy and commercial), seismic airguns and other geophysical survey equipment, underwater explosions, acoustic deterrence devices and infrastructure (bridges, platforms, offshore wind farms).
Continuous anthropogenic noise represents a significant pressure on the marine environment due to its constant presence and extensive spatial coverage over the entire water column in open sea areas. The noise from ships, when sailing at service speed, is caused primarily by their propulsion (engine noise and propeller cavitation ), with secondary components being machinery and the movement of the hull through the water (Breeding et al., 1996; Wales & Heitmayer, 2002; Wittekind, 2014).
2.1 Ecological relevance
Low frequency ambient noise in the open oceans has increased by around 15 dB in the last half a century due to human activities (Andrew et al., 2002). Sound in water travels as a wave in which particles of the medium are alternately forced together and apart. The sound can be measured as a change in pressure within the medium, which acts in all directions, described as the sound pressure. The unit is Pascal, i.e. Newton per square meter.
The sound pressure level (SPL) of sound of pressure p is given in decibels (dB) by:
SPL [dB] = 20 log10 (p/p0)
P is the measured acoustic pressure and P0 is the reference pressure, where in underwater acoustics equal 1 µPa. As the dB value is given on a logarithmic scale, doubling the pressure of a sound leads to a 6 dB increase in sound pressure level.
Each sound wave has both a pressure component and a particle motion component, indicating the velocity and the acceleration of the moving molecules in the sound wave. Depending on their receptor mechanisms, marine life is sensitive to either pressure or particle motion, or both. Marine mammals are sensitive only to the pressure component, fish without swim bladders only to the particle acceleration component, whereas fish with swim bladders are sensitive to both components (Au and Hastings, 2008).
Sound has the capacity to impact marine organisms in several ways. For low frequency continuous noise, the ability to mask acoustic communication and reception of other, biologically relevant sounds, is of particular importance, as is the disturbance of behaviour that high levels of noise may lead to. Direct injury for example to the inner ear, leading to partial hearing impairment, is considered less relevant for this indicator, but empirical evidence is lacking. Even less is known about possible physiological impact (cardiovascular and stress effects) of continuous noise exposure, preventing meaningful evaluation of these effects. In this report we focused on continuous sound pressure component, which can cause auditory masking and disturbance of marine species. Effects of sound pressure are further discussed in section 3.1.
2.2 Policy relevance
At international level, marine biodiversity is to be protected and prevented from any kind of pollution (UNCLOS, 1982). Underwater noise is a type of pollution, although it is an emission of energy rather than a polluting substance. The International Maritime Organization (IMO) added “Noise from commercial shipping and its adverse impact on marine life” as a high priority item to the work programme of its Marine Environment Protection Committee (MEPC). In 2014, the MEPC approved Guidelines for the reduction of underwater noise from commercial shipping to address adverse impacts on marine life (IMO, 2014), which are being currently reviewed by a dedicated Correspondence Group, aiming at their consideration by the next meeting of the Sub-Committee on Ship Design and Construction (SDC 9) to be held in January 2023.
In the HELCOM framework, the updated Baltic Sea Action Plan (HELCOM, 2021a) contains a dedicated section on underwater noise including both ecological and managerial objectives to achieve. The fulfilment of these objectives will count with the Regional Action Plan on Underwater Noise, adopted in the 2021 Ministerial Meeting as HELCOM Recommendation 42-43/1, as its instrumental tool containing thirty-five regional actions and seventeen national actions focused on reduction of pressures and impacts from underwater noise sources of different type (HELCOM, 2021b). Moreover, within the actions addressing continuous noise, there are specific ones dedicated to the improvement of the monitoring of the pressure and collection of ecological data as well as on the improvement of the evaluation of its impact.
At EU level, the non-binding European Commission Guidelines for the establishment of the Natura 2000 network in the marine environment consider noise as a source of pollution that affects the marine environment and biodiversity (European Commission, 2007). The guidelines identify several sources of underwater noise pollution, including the propeller and machinery noise of ships. Moreover, the indicator provides information that covers the requirements of EU MSFD purposes. This is aligned with the 2018 HELCOM Brussels Ministerial Declaration where Contracting Parties agreed to continuing regional work in developing scientifically sound threshold values for underwater noise that are consistent with GES for species identified as sensitive to noise in the Baltic Sea, in close coordination with work undertaken by Contracting Parties in other relevant fora including UNEP Regional Seas Programme.
Policy relevance of HELCOM indicator Continuous noise is summarised in Table 1.
Table 1. Policy relevance of this specific HELCOM indicator.
| Baltic Sea Action Plan (BSAP) | Marine Strategy Framework Directive (MSFD) | |
| Fundamental link | Goal: Environmentally sustainable sea-based activities
Ecological objective: No or minimal harm to marine life from man-made noise Management objective: Minimize noise to levels that do not adversely affect marine life |
Descriptor 11 Introduction of energy, including underwater noise, is at levels that do not adversely affect the marine environment.
|
| Complementary link | Descriptor 1: biodiversity | |
| Other relevant legislation: | United Nations Convention on the Law of the Sea (UNCLOS, 1982), Convention on Biological Diversity (Decision XI/18 A) and IMO Guidelines for the Reduction of Underwater Noise from Commercial Shipping to Address Adverse Impacts on Marine Life (MEPC.1/Circ.833, 2014). Council Directive 92 /43 /EEC of 21 May 1992 on the conservation of natural habitats and of wild fauna and flora (Habitats Directive, 1992). International Convention for the Safety of Life at Sea (SOLAS, 1974)
UN Sustainable Development Goal 14 (Conserve and sustainably use the oceans, seas and marine resources for sustainable development) is most clearly relevant, though SDG 12 (Ensure sustainable consumption and production patterns) and 13 (Take urgent action to combat climate change and its impacts) also have relevance. |
|
2.3 Relevance for other assessments
Underwater noise is one of the anthropogenic pressures on the marine environment and should thus be considered in an overarching assessment of status of noise sensitive animals when determining GES on a regional basis. The current assessment reflects the evaluation of sound pressure levels in the HELCOM region and will be included in the HOLAS3 Thematic Assessment on Pollution as well as reflected in the HOLAS3 summary report where its relevance will be included in combination with other key issues.
3 Threshold values
HELCOM has not adopted threshold values for the continuous noise indicator. The EU expert Group on underwater noise, TG-Noise, has provided advice on a framework for setting thresholds for continuous noise (MSFD criterion D11C2, TG-Noise 2021) and have presented a proposal for EU-wide thresholds for continuous noise (TG Noise, 2022) which was supported by the Working Group on Good Environmental Status (WG GES) with the understanding that further work on the matter is needed. The current evaluation follows the recommendations from TG-Noise as far as it has been possible, noting that many choices in the modelling of the indicator had to be made before advice was available from TG Noise.
3.1 Setting the threshold value
Deliverable 3 (DL3) of TG-Noise (2021) describes a framework for evaluation of continuous underwater noise. This evaluation consists of nine steps, which are described below and details relevant for HOLAS3 added, aligned with the evaluation methodology agreed upon in HELCOM (HOD, 2021).
Step 1. Define indicator species and their habitats
Principles for selection of indicator species for the HELCOM area were outlined by the BalticBoost workshop and subsequently included in the BSEP 167 (HELCOM, 2019a). Indicator species should fulfil the following requirements:
- hearing sensitivity: for a species to be susceptible to impacts of noise, it must be able to detect sound;
- impact of noise: an indicator species must be sensitive to impact from noise A species might be able to detect and produce sound within a range of frequencies, but it may not be very sensitive to noise disturbance, or it may react to noise even if the frequency spectrum is outside the frequency of best hearing or sound production of the species. Potential noise impact on the species is considered.
- conservation status: populations already affected by other sources, such as eutrophication or hazardous chemicals, may be more susceptible to detrimental effects from noise. Evaluated based on information from the HELCOM red list (HELCOM, 2013).
- commercial value: noise effects on species with high commercial value can potentially affect the economy of an industry such as the fishing industry or on a smaller scale recreational industry relying on the presence of marine mammals. Commercial value is therefore also included as a parameter; and
- data availability: sufficient knowledge must be available on hearing sensitivity, sensitivity to impact from noise and spatio-temporal distribution of the species. Indicator species excluded due to lack of information can be included in later evaluations, as the needed information becomes available.
Based on these principles, two groups of indicator organisms were selected: fish and marine mammals. Fish is here understood as teleost fishes, i.e., excluding cartilaginous fish (sharks and rays) and sturgeons. Representative species for the Baltic Sea are cod (Gadus morrhua) and herring (Clupea harengus). Baltic herring and cod are both sensitive to low frequency sound and their threshold for disturbance has been assessed to be the same (see step 2, below). Both indicator fishes are sensitive for dominance effects of anthropogenic sound which can trigger behavioral reactions in herring and masking effects in spawning cod.
Marine mammals of relevance for the Baltic Sea are harbour porpoise (Phocoena phocoena), harbour seal (Phoca vitulina), grey seal (Halichoerus gryphus) and ringed seal (Pusa hispida). As the hearing of the grey, harbour and ringed seals are comparable, they are treated under one in the following, bearing in mind that in each subbasin there is at least one species of seals is present. Consequently, each subbasin (see below) is considered as a habitat of seals for this evaluation, although the actual habitats of the indicator species diverge and should be discussed for future evaluations. Harbour porpoises are present in the southern subbasins of the Baltic Sea, and they are sensitive to higher frequencies than seals. However, for the sake of simplicity, it is possible to use the same frequency band for both seals and porpoises. Calculations show that LOBE (Level of Onset of Biologically adverse Effects, see step 2) for seals and porpoises in this case are very close.
The available information about distribution and sensitivity to noise does not yet allow a further differentiated evaluation within each species group.
The evaluation is subdivided into habitats. As knowledge about distribution and habitats for the indicator species in the Baltic is low or missing, the evaluation was conducted at the level of HELCOM subbasins, as defined in the HELCOM Monitoring and Assessment Strategy (Annex 4), serving as proxies for habitats.
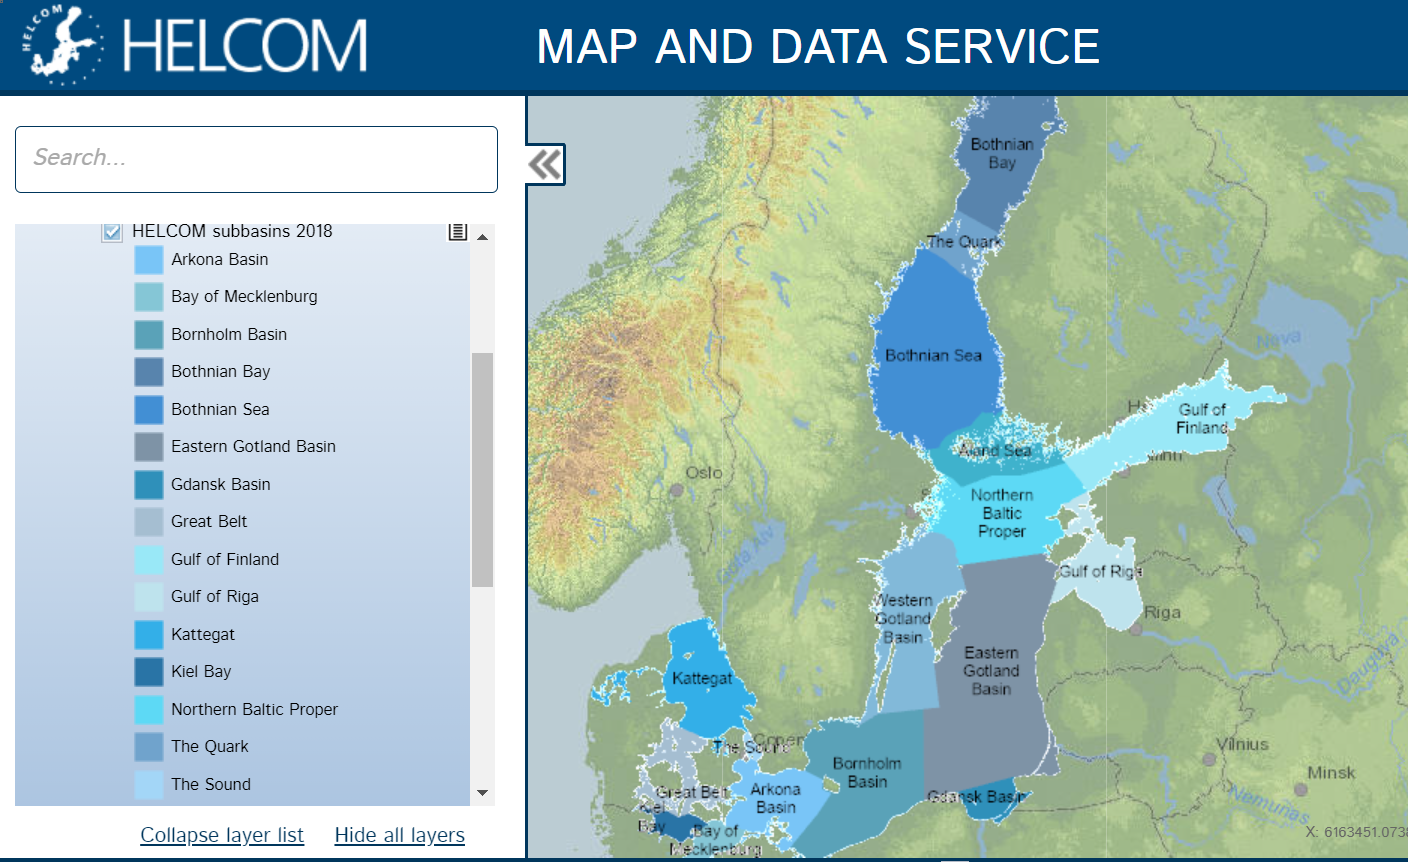
Figure 2. Map of the Level 2 of the HELCOM Monitoring and Assessment Strategy, division of the Baltic Sea into 17 sub-basins.
Step 2. Define the Level of Onset of Biologically adverse Effects (LOBE)
TG Noise deliverable 4 (DL4) defines the level of onset of biologically adverse effects (LOBE) as: “The noise level at which individual animals start to have adverse effects that could affect their fitness”.
Fitness in this context is the ability of an individual to successfully reproduce, relative to other individuals in the population. If an animal experiences a loss in fitness, it means that its reproductive output is affected negatively, even if only slightly.
LOBE depends on the indicator species, as it depends on the hearing abilities of the animal and the sensitivity of the species. Furthermore, the type of impact caused by the noise has implications for the choice of metric to use in establishing LOBE. Thus, the first step in determining LOBE is to decide on which (negative) effect of noise should form the basis of the evaluation. Examples of adverse effects of noise include disturbance of behaviour, temporary and permanent habitat loss due to displacement, reduced communication and listening space due to masking, and elevated stress hormone levels and other physiological effects.
TG-Noise does not provide guidance on which effect to select, but provides examples for assessing both behavioural disturbance and masking. It was decided by HOD 2021 that evaluation of continuous noise for HOLAS3 should pursue a double approach, where both masking and behavioural disturbance should be assessed.
LOBE values of two different kinds are used in the evaluation. Disturbance level is a total sound pressure level (SPL, sum of natural ambient noise and ship noise) that can trigger adverse behavioral reactions of the animal, such as avoidance of a habitat or startle reaction. The LOBE values have been selected by the BLUES project after consultation in EG Noise and based on the scientific literature and they are given in table 2. However, there is substantial uncertainty around these values and the values are likely to be adjusted in future evaluations, following new research and guidance on methodology from TG Noise.
Dominance on the other hand, is a metric developed to describe the potential reduction in communication and listening space due to an elevation of the ambient noise level by the presence of ships. Dominance thus expresses the temporal aspect of the elevation of ambient noise by ships and gives the percent of time where the excess level (difference between the total noise (natural ambient + ships) and the natural ambient alone) exceeds the LOBE. Masking by ship noise can lead to interference with reception of vitally important signals thus compromising social behaviour, prey – predator interactions etc. There is comparatively little information available in the scientific literature to help setting LOBE for masking, but the choice of the EU Interreg project JOMOPANS, to use 20 dB excess as LOBE, has been followed (Kinneging and Tougaard, 2021). LOBE values for masking are given in table 2 as well. An excess level of 20 dB means that, under simplified assumptions (spherical transmission loss of communication signals), the maximum communication range is reduced by 90%, which translates into a reduction of active acoustic space (the maximum area in which communication can occur) by 99%. Within limits animals can compensate for this by e.g. the Lombard response (i.e. by “speaking louder” or vocalising in less affected frequency bands; Fournet et al. 2021, Kragh et al. 2019) which would reduce the loss of communication space. However, in future evaluations it needs to be discussed where these limits are and how these relate to the onset of biological adverse effects.
Table 2. Levels of Onset of Biologically adverse Effects (LOBE) for indicator species, as used in this evaluation.
| Marine species | Decidecade | Disturbance level | Auditory masking | References and comments | |
| Hz | dB re 1μPa | ||||
| SPL | Dominance | ||||
| Seals | 500 | 110 | 20 | Kastelein et al., (2006), EG Noise recommendation | |
| Porpoise | 500 | 109 | n/a | EG Noise recommendation | |
| Herring | 125 | 110 | 20 | Engås et al. (1995), EG Noise recommendation | |
| Cod | 125 | 110 | 20 | Engås et al. (1995), EG Noise recommendation | |
Step 3. Determine time periods for the evaluation
The evaluation is done for the year 2018, which is used to represent conditions in the 6-year assessment period. The year 2018 was selected because it was the year where most monitoring data were available (see step 4). The resolution of the evaluation is one month, to allow evaluation of seasonal differences in conditions.
Step 4. Assess the acoustic status by monitoring
Monitoring of continuous underwater noise has been conducted by Contracting Parties in the assessment period, by measurement of continuous noise at fixed stations, in accordance with HELCOM guidelines (HELCOM, 2021c). Validated measurements were uploaded by Contracting Parties to the HELCOM continuous noise database, hosted at ICES. Not all Contracting Parties have obtained measurements and uploaded data to the database. This has no impact on the spatial extent of the evaluation, as the soundscape model (see step 5 and 6) extrapolates to the entire HELCOM area. Lack of measurements in certain areas will, however, lead to increased uncertainty on the evaluation in those areas. Finally, a measure of correspondence between model and measurements is specified.
Step 5. Establish the reference condition
The reference condition was modelled by the company QuietOceans (Brest, France). Based on meteorological data and knowledge of the relationship between wind speeds and noise levels (Mustonen et al., 2020), the noise in three frequency bands, each one decidecade[1] wide, centered at 63 Hz, 125 Hz and 500 Hz, was modelled throughout the Baltic Sea in steps of one hour throughout the assessment year. For technical reasons, the Baltic Sea was divided in three sub-areas of spatial resolution around 400m which were then merged into one single area (see figure 3).
Step 6. Establish the current condition
Based on information about the ships present at each hourly step in the modelling, the type, length and speed of the vessels, all obtained from AIS data, the noise from the individual ships were modelled with a source model (RANDI3). By means of input of bathymetry, sediment properties and hydrographical observations, the noise from individual ships were propagated into the surrounding waters around each ship, added together and added to the natural ambient noise modelled in step 5. The modelled output was compared against the measurements (from step 4) and model properties adjusted to obtain best possible correspondence with measurements.
Figure 3. Division of the Baltic Sea in three areas for the purpose of the modelling of the soundscape maps: West (9.4° West, 17.6° East, 53.9° South, .57.8° North), Central (15.8° West, 30.3° East, 54.2° South, 60.8° North) and North (16.9° West, 25.5° East, 60.2° South, 65.9° North.
Step 7. Evaluate the condition of the grid cells
Evaluation of conditions in each grid cell of the map was done for the two species groups (fish and marine mammals) and the two types of effects and hence metrics (behavioural disturbance and masking, respectively), meaning that in total four evaluations were performed for each grid cell (see table 3).
Step 8. Determine the status of the habitats
The status of each habitat (HELCOM subbasins) was evaluated against the spatial threshold proposed by TG-Noise (DL4, 2022). The proposed threshold for continuous noise is 20%, which should be understood such that in any given month of the assessment year, no more than 20% of a habitat can be in non-acceptable conditions (c.f. the evaluation in step 7).
Step 9. Assess the status of the MRU (Marine Reporting Units) as being GES or not GES
This step is omitted, as it relates to EU Member States’ own MSFD reporting.
Table 3. Evaluation of conditions conducted in each grid cell of the map for the two species groups (fish and marine mammals) and for the two types of effects considered (behavioural disturbance and masking).
| Behaviour – fish
The monthly median of the total noise level (natural ambient + ship noise) in the 125 Hz frequency band was compared to the LOBE of 110 dB re 1 µPa. Conditions in the grid cell acceptable, if monthly median <= LOBE. |
Behaviour – marine mammals
The monthly median of the total noise level (natural ambient + ship noise) in the 500 Hz frequency band was compared to the LOBE of 110 dB re 1 µPa. Conditions in the grid cell acceptable, if monthly median <= LOBE. |
| Masking – fish
The monthly median excess level (total noise – natural ambient) in the 125 Hz frequency band was compared to the LOBE of 20 dB. Conditions in the grid cell acceptable, if monthly median <= LOBE. |
Masking – marine mammals
The monthly median excess level (total noise – natural ambient) in the 500 Hz frequency band was compared to the LOBE of 20 dB. Conditions in the grid cell acceptable, if monthly median <= LOBE. |
4 Results and discussion
In figure 4, the modelling results of the median sound pressure level for the 125 Hz decidecade band in March 2018 is presented as illustration. In this period of the year the spatial effect of anthropogenic sound contribution is quite high because of favourable sound propagation conditions. In other months of the year, in particular during summer months, the sound propagation conditions are such that the ship noise is localized more around the shipping lanes. This effect is caused by downward refraction due to stratified waters (Klusek and Lisimenka 2016). However, sound channels could have effects which locally increase sound propagation (Sigray et al. 2016) which could not be accounted for by the model. The noise in the 125 Hz decidecade band used for evaluation on fish is higher than in the 500 Hz decidecade band used for marine mammals. Both factors mean that the map represents a worst-case example of the noise conditions in the Baltic Sea. The map represents the monthly median noise level, indicating that noise levels in the Baltic Sea in March 2018 have been at the sound pressure levels indicated by the colour scale or higher, 50% of the time. Similar maps were created for the remaining months and the 500 Hz decidecade band.
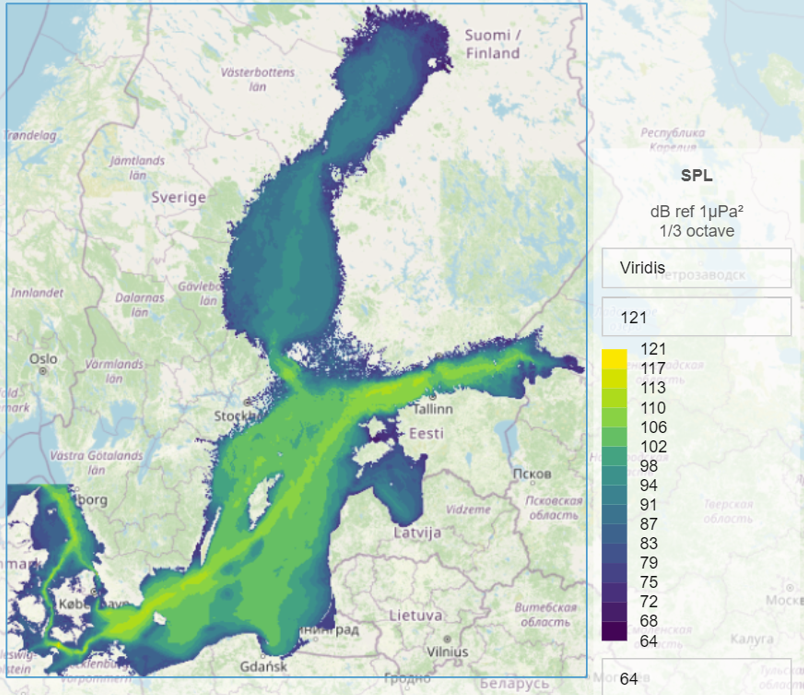
Figure 4. Median SPL for third octave band 125 Hz in March 2018.
The sound map in Figure 5 shows the median excess level, also for March 2018 and the 125 Hz decidecade band level. The map thus indicates that the ship noise is expected to have elevated the ambient noise level with the amount given by the colour scale or more for 50% of the month. As this map is affected by sound propagation conditions in the same way as the map in figure 4, this map represents the situation at the time of the year where conditions are worst for the Baltic Sea.
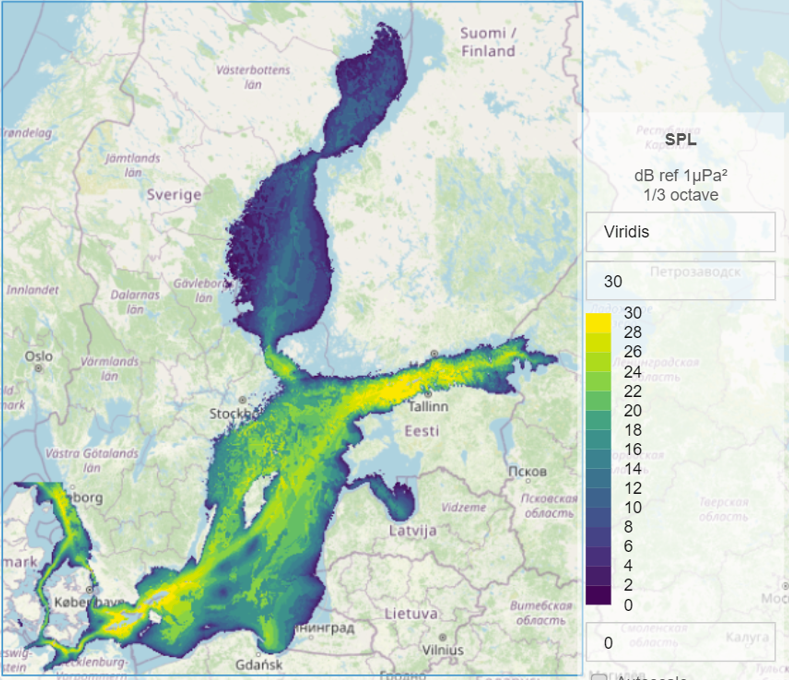
Figure 5. Median excess level for third octave band 125 Hz in March 2018.
The fraction of grid cells within each habitat (subbasins, figure 2) were evaluated against the different LOBE values, as described above, month by month in 2018 and results for three example habitats are plotted in figure 6 for the behavioural disturbance and in figure 7 for masking. The three selected areas, Gulf of Finland, Northern Baltic Proper and Arkona Basin are all areas with heavy shipping traffic.
Horizontal red lines show LOBE values for each analysis. For all three basins there is a seasonal variation, with highest levels in the late winter and lowest levels in the late summer. These fluctuations relate to annual changes in the sound propagation properties, due to changes in the vertical stratification of the water column and it is not related to variations in the number of ships.
It can be seen from Fig. 6 that for 125 Hz the median sound pressure level emerges in winter and spring but does not exceed the LOBE level of 110 dB re 1 µPa on 20% of any assessment unit in any month. As for 500 Hz, the median sound pressure level corresponding to the LOBE level of 110 dB is practically absent for any assessment unit in any month.
In Fig. 7 it can be seen that in terms of dominance 20% spatial threshold is exceeded for 125 Hz in all three subbasins indicating that in these subbasins fish can be affected. At the same time for 500 Hz exceedance of 20 dB is present, but never reaches spatial threshold of 20% set for marine mammals.
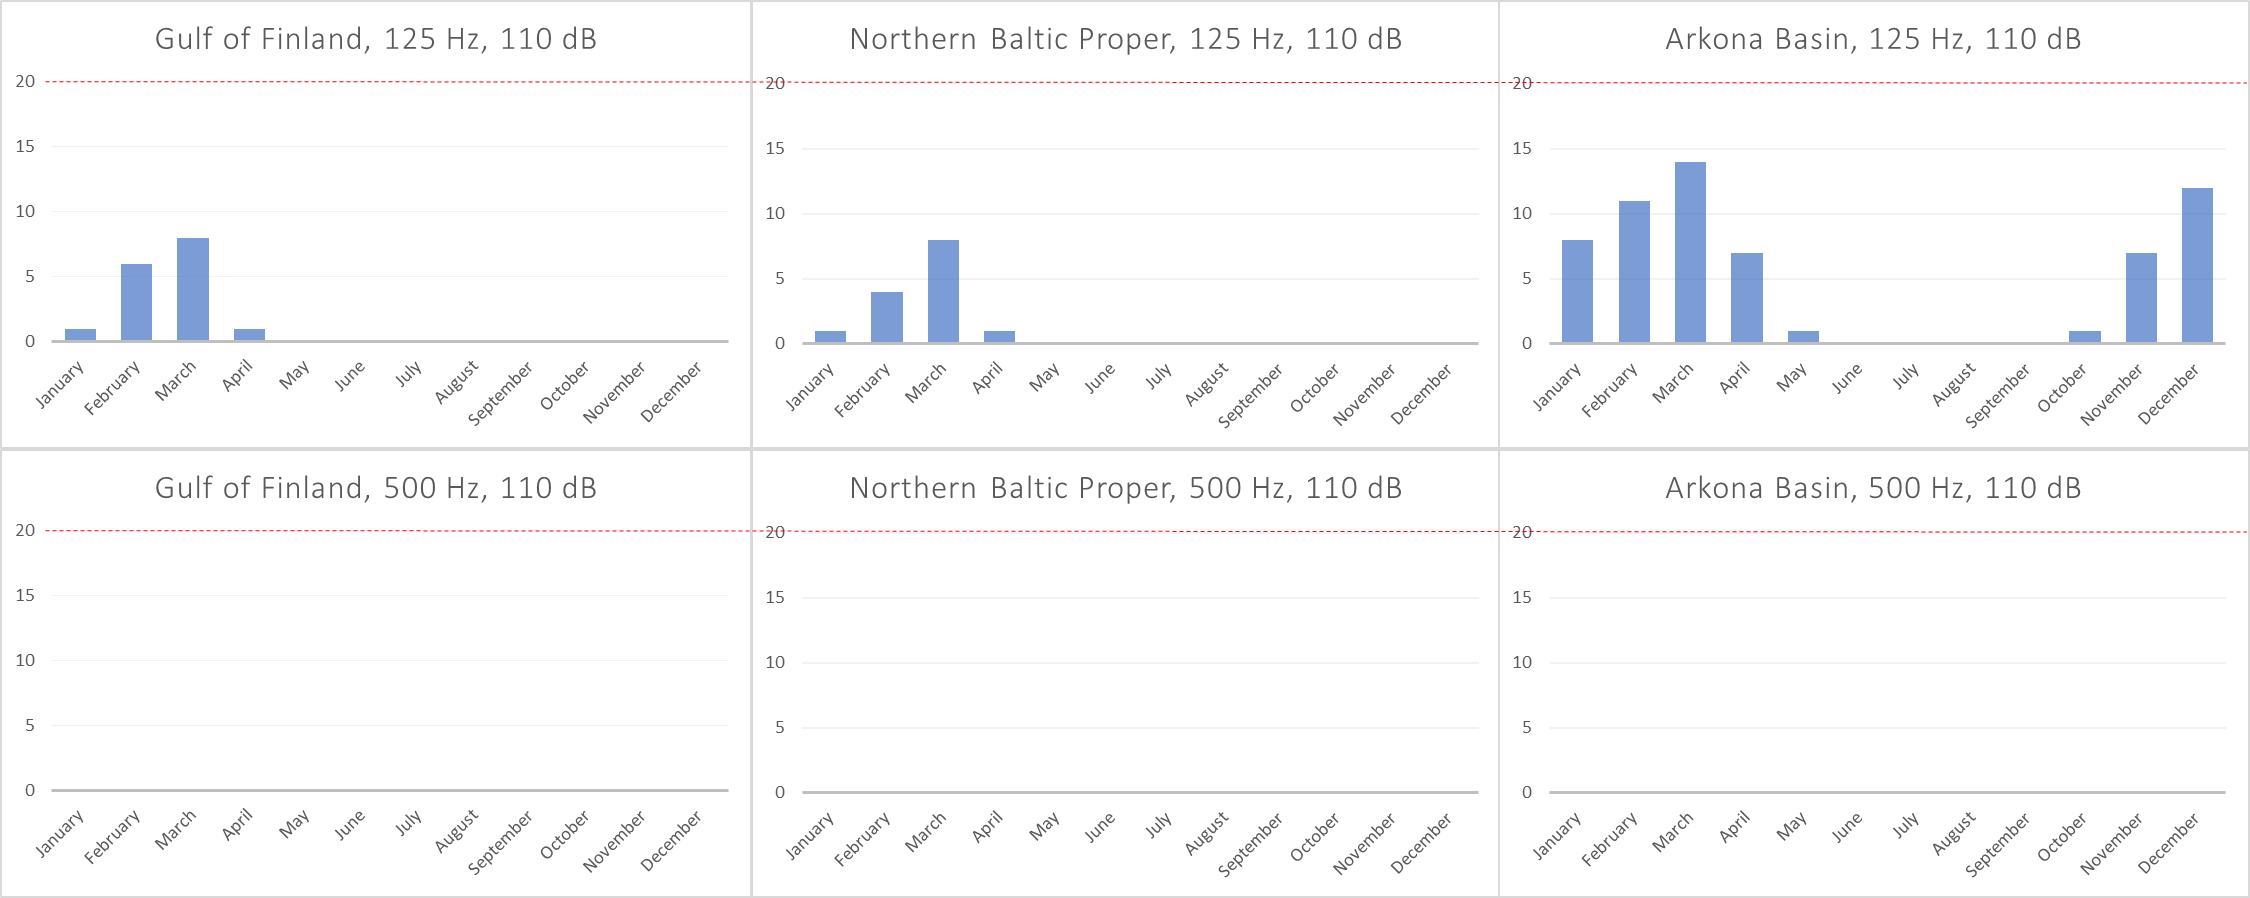
Figure 6. Disturbance level exceedance in 3 subbasins by month. Results are given for two third octave bands 125 Hz (up) and 500 Hz (down) in 2018. Red dotted line is showing LOBE value.
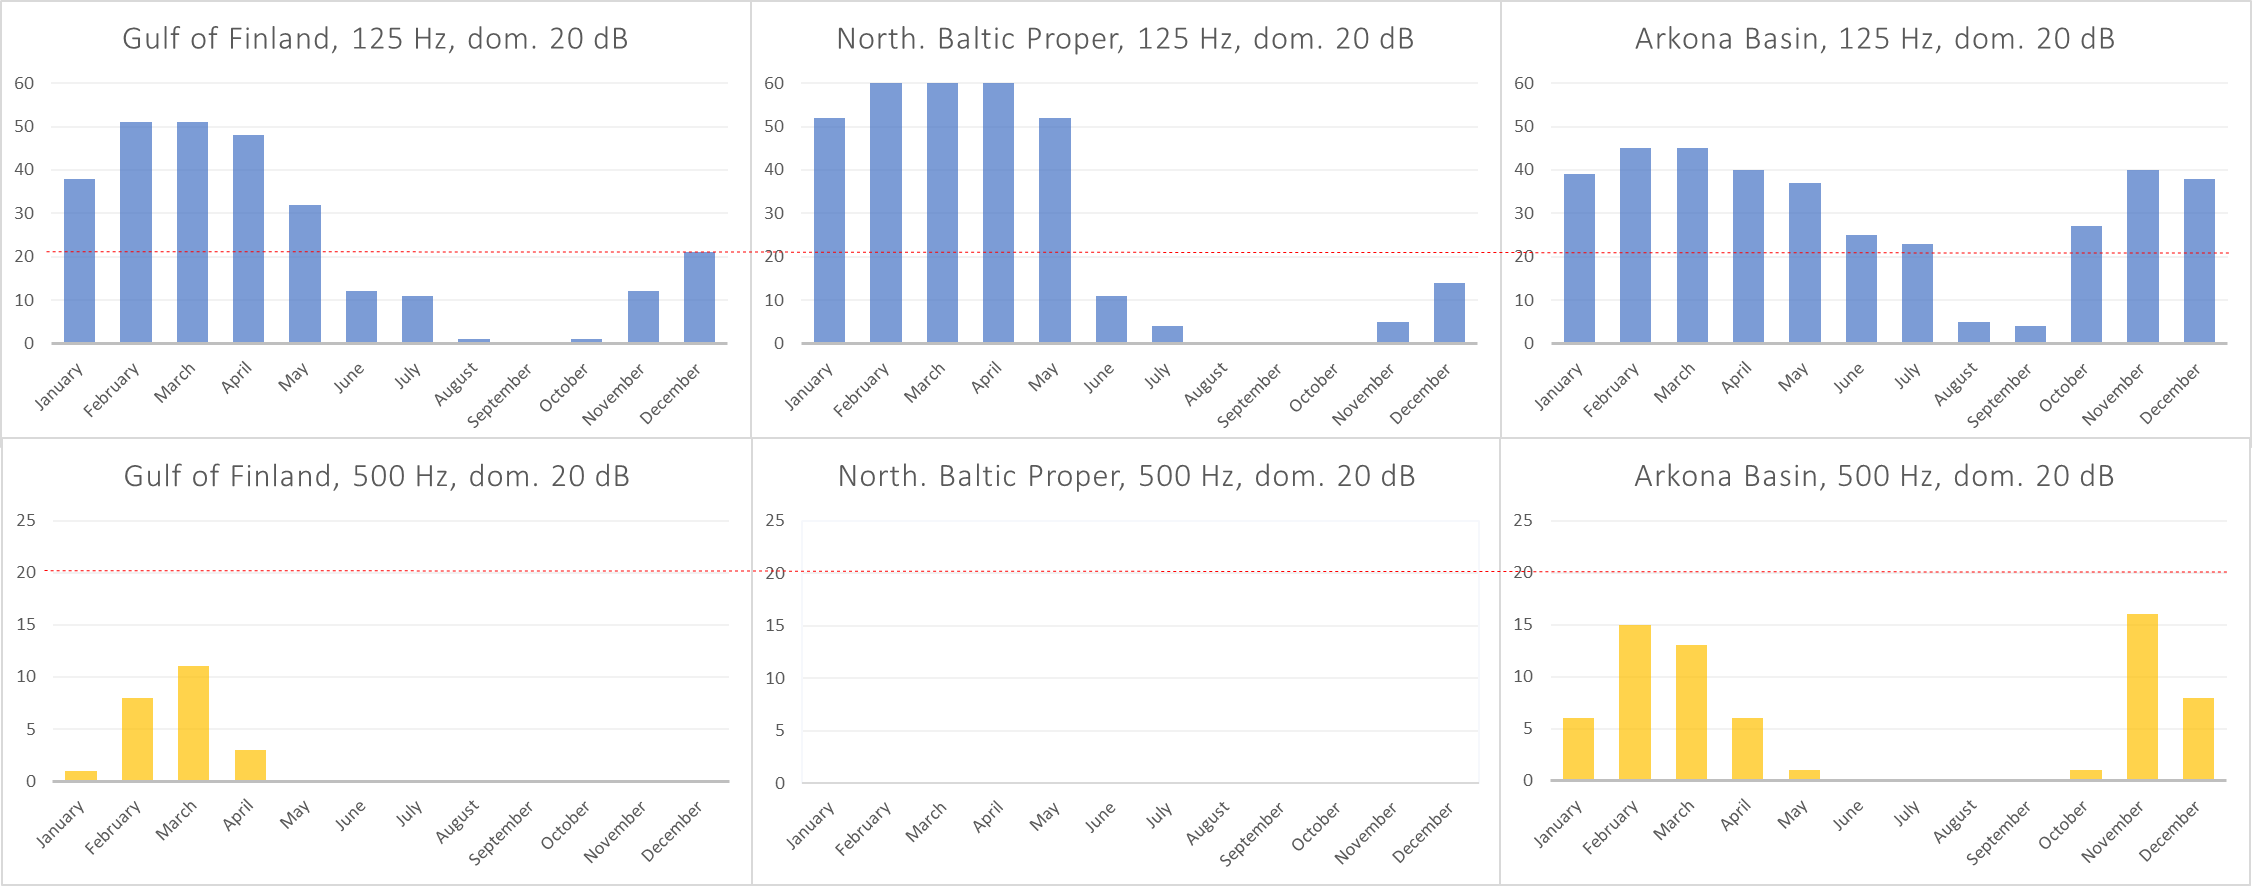
Figure 7. Dominance exceedance in 3 subbasins by month. Results are given for two third octave bands 125 Hz (up) and 500 Hz (down) in 2018. Red dotted lines are showing LOBE values.
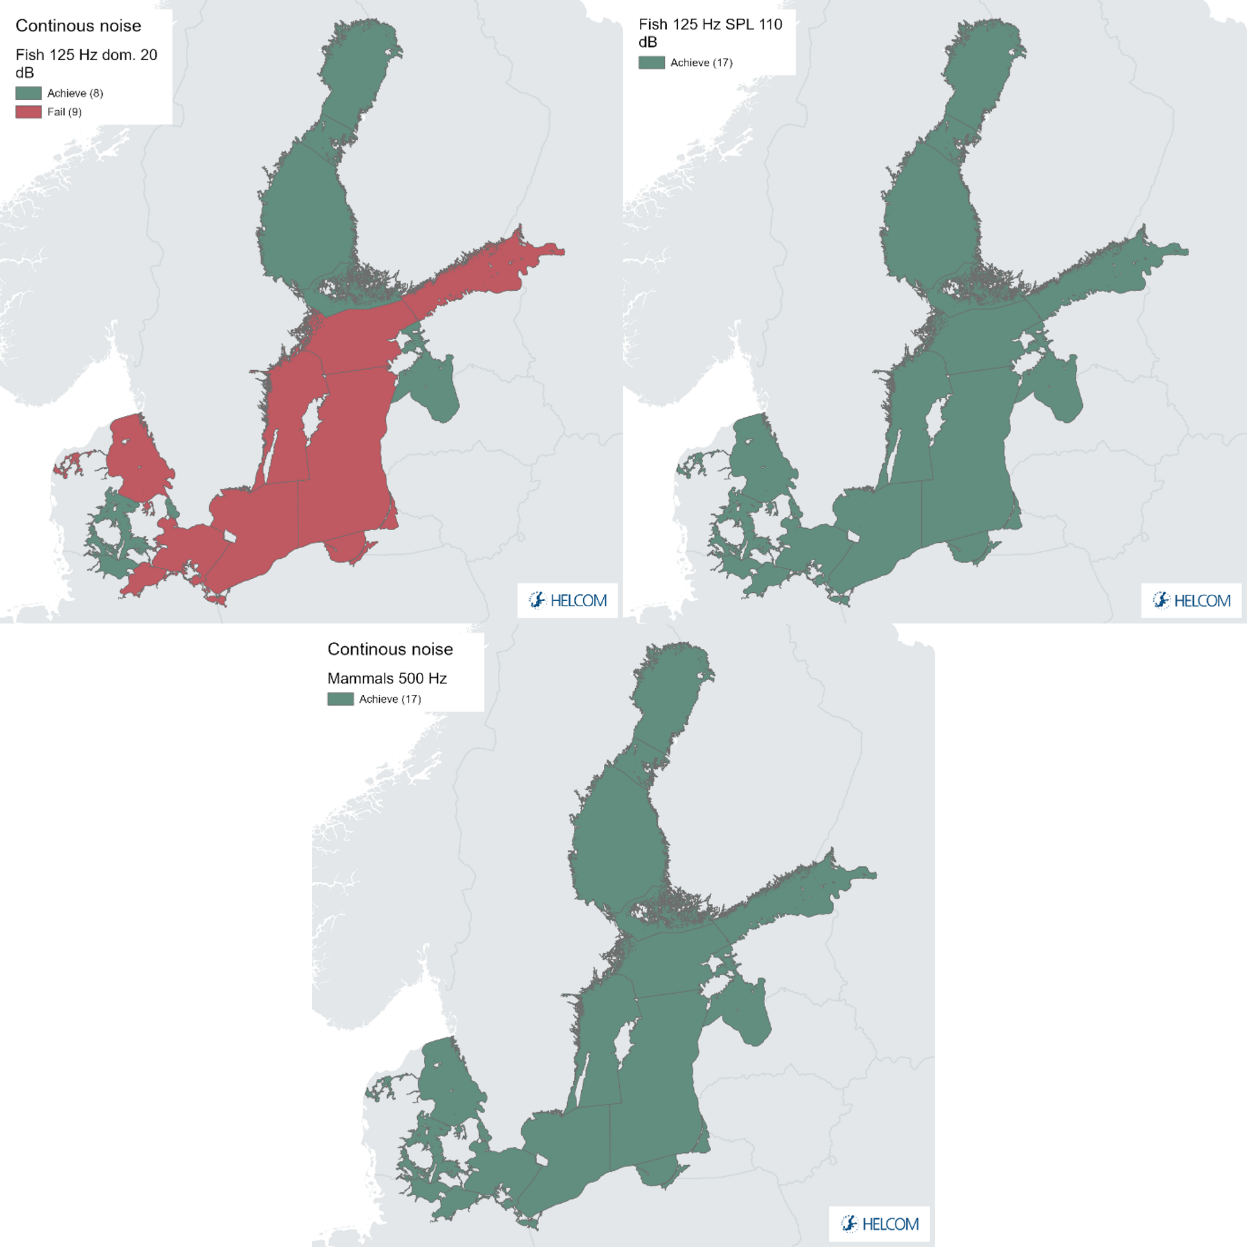
4.1 Status evaluation
Evaluation results of all subbasins are given in table 4. Three out of four variants of the indicator are in good environmental status (below the spatial threshold) in all subbasins, throughout the year, being the 125 Hz band, selected for masking of fish communication, the one that exceeds the spatial threshold in half of the subbasins (9 out of 17). Although the LOBE for disturbance was exceeded in an area below the 20% spatial threshold only, distinct known spawning grounds in Eastern Gotland, Bornholm and Arkona Basins as well as Kattegat may require a closer look for management purposes.
Table 4. Evaluation results. Fish: Baltic herring and cod, Marine mammals: all seals and harbour porpoise. No X indicates that the indicator is below the 20% spatial threshold for all months in 2018, X indicates that the indicator was above the 20% spatial threshold in at least one month of 2018.
| Subbasins | 125 Hz | 500 Hz | |||
| Fish | Marine mammals | ||||
| SPL 110 db | dom. 20 dB | SPL 110 dB | dom. 20 dB | ||
| 1 | Gulf of Finland | X | |||
| 2 | Gulf of Riga | ||||
| 3 | Northern Baltic Proper | X | |||
| 4 | Aland Sea | ||||
| 5 | Bothnian Sea | ||||
| 6 | The Quark | ||||
| 7 | Bothnian Bay | ||||
| 8 | Western Gotland Basin | X | |||
| 9 | Eastern Gotland Basin | X | |||
| 10 | Gdansk Basin | X | |||
| 11 | Bornholm Basin | X | |||
| 12 | Arkona Basin | X | |||
| 13 | The Sound | ||||
| 14 | Bay of Mecklenburg | X | |||
| 15 | Kiel Bay | ||||
| 16 | Great Belt | ||||
| 17 | Kattegat | X | |||
4.2 Trends
As this evaluation is the first evaluation made with the current metrics, it is not possible to evaluate trends across years.
4.3 Discussion text
In this study two evaluation methods have been used, following the decision by HOD-2021. The first one is based on monthly median sound pressure level (SPL). This metric is considered relevant for assessing impact on marine animals through disturbance of their behaviour (TG Noise, 2021). The second evaluation method is based on monthly median excess level, expressing the amount that ambient noise has been elevated above natural ambient by the presence of ship noise. This metric is considered appropriate for assessing the potential for masking of acoustic communication and passive hearing in marine animals (TG Noise, 2021).
Based on the first evaluation method it can be seen that disturbance thresholds (110 dB re 1 µPa) are not exceeded more than 50% of the time (as the median is used as metric) in more than 20% of the assessment area (subbasin), neither for the marine mammals in the 500 Hz decidecade band nor for the fish in the 125 Hz decidecade band. Although the 125 Hz frequency noise is higher in intensity and propagates better than the 500 Hz noise, the monthly median never exceeds the 110 dB threshold in more than 20% of any of the assessment units (subbasins).
The second evaluation method shows that median dominance in the 500 Hz decidecade band does not exceed 20 dB in more than 20% of each of the assessment areas (subbasins) for any of the months. Marine mammals are therefore not considered adversely affected by the shipping noise. In contrast, the monthly median excess in the 125 Hz decidecade band exceeds 20 dB in more than 20% of the assessment area, in 9 out of 17 areas (subbasins), indicating the potential for adverse effects on the ability of fish to communicate acoustically in these areas.
The difference between the two evaluation metrics relates primarily to the way the natural ambient noise is treated in the estimates of the metrics. For the first metric, the sound pressure level, the natural ambient noise is ignored and only the total noise (natural ambient + ship noise) is evaluated against the LOBE (110 dB re 1 µPa). The second metric, the excess, is modeled relative to the natural ambient noise, i.e., expressing the difference between the current condition (natural ambient + ship noise) and the reference condition (natural ambient alone). The fact that the two indicators for the 125 Hz bands differ considerably in the evaluation results indicates that the noise levels in the Baltic Sea (both current and reference conditions) are comparatively low. As the current condition is low, the areas where LOBE for behavioural disturbance (110 dB re 1µPa) is exceeded for significant amounts of time are few. However, as the reference condition is very low, the difference between current and reference condition exceeds LOBE for masking (20 dB) more often and in wider areas than the first indicator.
5 Confidence
Preliminary results from on-going projects and monitoring activities indicate that confidence of monthly averages, based on observational data are high enough to be used for assessing the statistical status of noise levels in the Baltic Sea. Regional standards for sensors, handling of data and signal processing have been established that will ensure that results will be trustable and comparable in the HELCOM region. Further, it has been demonstrated that annual and monthly soundscape maps can be drawn that cover the full area of the Baltic Sea, with exception of the shallow waters (less than 5-10 m), where the model may still be inappropriate. The benefit of the soundscape maps is that they extend the local measurement to the full Baltic Sea and thus they can be used to address impact in interest areas and/or specific periods. The combined use of soundscape maps and observations has not been fully investigated yet. The available results from observations and modelling shows that the prerequisites for managing anthropogenic sound is in place and can be used to establish statistical measures of the indicator. It must however be emphasised that the contribution of vessels not having AIS could not be taken into account and that sound propagation in coastal waters (e.g., shallow or in archipelagos) is complex and could also not be addressed in the model. Root mean square error between measurement and modelling were assessed at each measurement point and it changed from 0.4 to 3.4 dB depending from frequency band and measurement point position.
The main sources of uncertainty in the evaluation lies in the biological input to the evaluation. This relates to the spatio-temporal distribution of the indicator species, but also to the LOBE values, i.e., the levels of noise exposure expected to result in adverse effects. In the most recent guidance from TG Noise (2022), the responsibility for establishing values for LOBE is placed at the regional level, as LOBE is likely species dependent and thereby closely linked to the selection of indicator species. It is expected that further guidance from TG Noise on methodology for establishing LOBE values will follow in the next implementation cycle of the EU MSFD.
6 Drivers, Activities, and Pressures
Human activities in the marine environment inevitable generate sound that affects marine species. There are several anthropogenic sources that generate loud sound levels. The two most widespread in open sea are commercial ships and fishing vessels but also energy installations, renewable energy sources and continuous dredging contribute to the total noise budget. A significant source, especially in coastal areas and in the summer period is leisure boats (Hermannsen et al., 2019). At present, there is currently no monitoring method addressing these, meaning that they are not included in the noise maps. The long-term trend is that overall, the gross tonnage transported by ship in the Baltic is increasing; this may mean that the commercial fleet will change in character in the future and that the resultant underwater noise will rise.
7 Climate change and other factors
Climate change may affect the indicator by directly affecting the shipping activity and other activities. With warmer winter temperatures, the ice-covered season in the northern Baltic and Gulf of Finland becomes shorter, which may extend the open-water season, thereby extending the time when smaller ships and ships without sufficient ice classification can navigate these waters. This may lead to a redistribution of ships over the year and possibly also an increase in shipping.
Changes in the hydrography of the Baltic Sea is likely to follow due to climate change. This could have profound effects on the stratification of the water column, which, in turn, will affect the sound propagation properties significantly. In depth modelling of several scenarios is needed to understand associated effects on underwater noise.
8 Conclusions
The present evaluation demonstrates that the continuous noise indicator is now operational, as all elements are in place for recurring evaluations of the entire Baltic Sea with an appropriate spatial resolution (currently HELCOM subbasins, level 2). The evaluation itself comes with significant uncertainties, relating to the selection of input parameters (most notably the LOBE levels) and the distribution of the indicator species. Further work on regional specificities towards HOLAS 4 may have implications on the setting of threshold values. Nevertheless, the mapping of the noise shows substantial contributions of ship noise to the Baltic Sea environment, with considerable variations in space (shipping lanes much more affected than elsewhere) and in time (ship noise being more wide-spread in winter than summer). Some areas, such as the Bothnian Bay, are comparatively little affected by ship noise.
8.1 Future work or improvements needed
TG Noise document DL4 provides a spatial threshold of 20% with the option to set it lower, based on regional specificities. Such regional specificities could be: indicator species or populations considered particularly vulnerable and/or endangered, uncertainty in the noise model, for example related to effects of strong sound speed gradients, or influence from sources such as recreational boats not included in the current models, both of which requires a precautionary approach. Such regional specificities are to be considered towards HOLAS 4.
Knowledge about the Levels of Onset of Biologically adverse Effects (LOBE) for indicator species will be improved in coming years, as many research groups are working on this topic. In particular, fish is known to be sensitive to the water particle motions. Future evaluations are likely to include effects of particle motion generated by the sources of continuous noise. The habitat sizes of indicator species and the following sizes of assessment subbasins need attention and broader discussions involving also biodiversity expert groups.
Many wind parks will be constructed in the Baltic Sea in the near future. Continuous low-frequency noise from these installations should be taken into account in the future models.
Actual ship underwater noise model considers only commercial ships. However, fishing and leisure boats are known to contribute to the underwater noise in the coastal waters during some seasons and their contribution should be included as far as corresponding ship traffic data will be collected.
9 Methodology
9.1 Scale of assessment
The temporal scale used in this evaluation is the predefined time of a six-years period between 2016-2021 in accordance with the EU MSFD reporting period (European Commission, 2013). From this period of time 2018 was chosen as the most representative year due to the availability of national data. The year-to-year variation with the present modelling is considered to be smaller than the uncertainty in the model itself. On a spatial scale, the Scale 2 of the HELCOM sub-divisions of the Baltic Sea for regional monitoring and assessment purposes, i.e., Scale 2 divides the Baltic Sea into 17 sub-basins (see HELCOM Monitoring and Assessment Strategy, 2013) has been used.
9.2 Methodology applied
This indicator evaluates whether good environmental status is achieved by considering whether in any given month of the assessment year, 2018, no more than 20% of a habitat can be in non-acceptable conditions (LOBE exceeded). Two indicator metrics (sound pressure level and excess noise level) are modelled for each assessment unit and each metric is held against the respective LOBE values, one for behavioural disturbance and one for masking. This was done for two group of indicator organisms, fish and marine mammals. The overall status on continuous noise only achieves good status if both indicator metrics are within acceptable levels for both groups of indicator species.
9.3 Monitoring and reporting requirements
Both guidelines as well as a monitoring programme for continuous noise (HELCOM, 2021c, HELCOM 2019b) are in place. Moreover, the HELCOM Regional Action Plan on Underwater Noise, recommends “develop and operationalize common indicators and associated definition of Good Environmental Status (GES) related to underwater noise for application in the assessment of the state of the Baltic Sea marine environment, taking into consideration ongoing work at EU level for HELCOM countries who are EU Member States” as well as “continue and improve reporting of national monitoring data on continuous noise and impulsive noise events to the already established regional databases, to ensure availability of high-quality data for regular assessment of the state of underwater noise in the Baltic Sea area”.
10 Data
The data collected and used in this indicator is based on national monitoring data yearly reported to the HELCOM Continuous Noise Database hosted by ICES.
11 Contributors
Aleksander Klauson (BLUES project), Mirko Mustonen (BLUES project), Jakob Tougaard.
HELCOM Expert Group on Underwater Noise (HELCOM EG Noise).
HELCOM Secretariat: Marta Ruiz.
12 Archive
This version of the HELCOM core indicator report was published in April 2023:
The current version of this indicator (including as a PDF) can be found on the HELCOM indicator web page.
No earlier versions of this indicator currently exist.
13 References
Andrew, R. K., Howe, B. M., Mercer, J. A., & Dzieciuch, M. A. (2002). Ocean ambient sound: comparing the 1960s with the 1990s for a receiver off the California coast. Acoustics Research Letters Online, 3: 65-70.
Au, W. W. L. and Hastings, M. C. (2008). Principles of Marine Bioacoustics. Springer, New York.
Breeding, J. E., Pflug, L. A., Bradley, M., Walrod, M. H. and Mcbride, W. (1996). Research Ambient Noise Directionality (RANDI 3.1) Physics Description. Los Angeles. pp.
CBD (2012). UNEP/CBD/SBSTTA/16/INF/12. Scientific synthesis on the impacts of underwater noise on marine and coastal biodiversity and habitats.
Engås, A., Misund, O. A., Soldal, A. V., Horvei, B. and Solstad, A. 1995. Reactions of penned herring and cod to playback of original, frequency-filtered and time-smoothed vessel sound. Fisheries Research 22:243-254.
European Commission. (2007). Guidelines for the establishment of the Natura 2000 network in the marine environment.
Fournet, M.E.H., Silvestri, M., Clark, C.W., Klinck H., Rice, A.M. (2021). Limited vocal compensation for elevated ambient noise in bearded seals: implications for an industrializing Arctic Ocean, https://royalsocietypublishing.org/doi/full/10.1098/rspb.2020.2712?utm_campaign=RESR_MRKT_Researcher_inbound&af=R&utm_medium=referral&utm_source=researcher_app
HELCOM (2013). HELCOM Red List of Baltic Sea species in danger of becoming extinct. Baltic Sea Environment Proceedings No. 140. Helsinki Commission, Helsinki. 106 pp
HELCOM (2019a). Noise sensitivity of animals in the Baltic Sea. Baltic Sea Environment Proceedings N° 167.
HELCOM (2019b). HELCOM Monitoring Programme on continuous noise. https://helcom.fi/wp-content/uploads/2020/10/MM_Continuous-noise.pdf
HELCOM (2021a). HELCOM Baltic Sea Action Plan – Update 2021. https://helcom.fi/wp-content/uploads/2021/10/Baltic-Sea-Action-Plan-2021-update.pdf
HELCOM (2021b). HELCOM Recommendation 42-43/1 on the Regional Action Plan on Underwater Noise. Rec-42_43-1. https://helcom.fi/wp-content/uploads/2021/08/Rec-42_43-1.pdf.
HELCOM (2021c). HELCOM Guidelines for monitoring continuous noise (Updated HELCOM Guidelines as noted by State & Conservation 14-2021). https://helcom.fi/wp-content/uploads/2019/08/Guidelines-for-monitoring-continuous-noise.pdf
Hermannsen, L., Mikkelsen, L., Tougaard, J., Beedholm, K., Johnson, M. and Madsen, P. T. (2019). Recreational vessels without Automatic Identification System (AIS) dominate anthropogenic noise contributions to a shallow water soundscape. Scientific Reports 9:15477.
HOD, 2021. Outcome of the 61st Meeting of the Heads of Delegation. https://portal.helcom.fi/meetings/HOD%2061-2021-896/MeetingDocuments/Outcome%20of%20HOD%2061-2021.pdf
IMO. (2014). IMO Guidelines for the Reduction of Underwater Noise from Commercial Shipping to Address Adverse Impacts on Marine Life (MEPC.1/Circ.833, 2014).
Kastelein, R.A., van der Heul, S., Terhune, J.M., Verboom, W.C., Triesscheijn, R.J.V. Deterring effects of 8-45 kHz tone pulses on harbour seals (Phoca vitulina) in a large pool. (2006). Marine Environmental Research, 62 (5), pp. 356-373. doi: 10.1016/j.marenvres.2006.05.004.
Kastelein, R.A., van der Heul, S., Verboom, W.C., Jennings, N., van der Veen, J. and de Haan, D. (2008). Startle response of captive North Sea fish species to underwater tones between 0.1 and 64 kHz. Marine Environmental Research, 65(5), pp.369-377. https://doi.org/10.1016/j.marenvres.2008.01.001
Kinneging, N. and Tougaard, J. (2021). Assessment North Sea. Report of the EU INTERREG Joint Monitoring Programme for Ambient Noise North Sea (Jomopans). Rijkswaterstaadt, The Hague, Netherlands. 23 pp.
Klusek, Z. and Lisimenka, A. (2016). Seasonal and diel variability of the underwater noise in the Baltic Sea. J. Acoust. Soc. Am. 139 (4), April 2016.
Kragh, I.M., McHugh K., Wells, R.S., Sayigh, L.S., Janik, V.M., Tyack P.L. 2019. Signal-specific amplitude adjustment to noise in common bottlenose dolphins (Tursiops truncatus). https://journals.biologists.com/jeb/article/222/23/jeb216606/223633
MSFD. (2008). Directive 2008/56/EC of the European Parliament and of the Council of 17 June 2008 establishing a framework for community action in the field of marine environmental policy (Marine Strategy Framework Directive).
Mustonen, M., Klauson, A., Folegot, T. and Clorennec, D. 2020. Natural sound estimation in shallow water near shipping lanes. J Acoust Soc Am 147:EL177.
HELCOM (2019). Noise sensitivity of animals in the Baltic Sea. Baltic Sea Environment Proceedings N° 167. Schack, H., Ruiz, M., Andersson., M.H. Zweifel, U.L.
Sigray, P., Andersson, M., Pajala, J., Laanearu, J., Klauson, A., Tegowski, J., Boethling, M., Fischer, J., Tougaard, J., Wahlberg, M., Nikolopoulos, A., Folegot, T., Matuschek, R., Verfuss, U. (2016). Chapter 126 – BIAS: A Regional Management of Underwater Sound in the Baltic Sea. A.N. Popper, A. Hawkins (eds.), The Effects of Noise on Aquatic Life II, Advances in Experimental Medicine and Biology 875, DOI 10.1007/978-1-4939-2981-8_126
TG Noise. (2021). Assessment framework for threshold values for continuous sound and setting of threshold values – Recommendations from Technical Group on Underwater Noise (TG Noise – Deliverable 3 of work programme of Technical Group on Underwater Noise (TG Noise ) 2020-2022 https://circabc.europa.eu/ui/group/326ae5ac-0419-4167-83ca-e3c210534a69/library/fa50ee42-9e44-45fc-ae94-b7e8b3c13f06/details
TG Noise. (2022). TG Noise proposals for EU TV for continuous noise (DL4). https://circabc.europa.eu/ui/group/326ae5ac-0419-4167-83ca-e3c210534a69/library/6ae48991-4904-45a2-b9ec-0cb530588b5b/details
Olsen, K., (1971). Influence of vessel noise on behaviour of herring. Modern fishing gear of the world, 3, pp.291-294.
UNCLOS. (1982). United Nations Convention on the Law of the Sea.
Wales, S. C. and Heitmeyer, R. M. (2002). An ensemble source spectra model for merchant ship-radiated noise. J Acoust Soc Am 111:1211-1231.
Wittekind, D. K. (2014). A Simple Model for the Underwater Noise Source Level of Ships. Journal of Ship Production and Design 30:7-14.
14 Other relevant resources
No additional information is required for this indicator.
- Please note that decidecade means third octave band (log to basis of 10). ↑