 Cyanobacterial bloom
2 Relevance of the indicator
This HELCOM pre-core indicator is evaluated for the purposes of the ‘State of the Baltic Sea’ report (HOLAS 3) and further development towards a core indicator is expected in the future.
The approach and threshold values of this pre-core indicator are yet to be commonly agreed in HELCOM. The results are to be considered as intermediate.
Excess input of nutrients and decreasing N/P ratios of available nutrients enhance the cyanobacterial accumulations, which again contributes to the oxygen depletion in the bottom waters. The potential toxicity of cyanobacteria and the nuisance to recreational use negatively affect the socioeconomic value of the ecosystem.
2.1 Ecological relevance
Surface blooms of nitrogen-fixing cyanobacteria are a natural phenomenon (Bianchi et al. 2000) but have become more extensive and frequent in many parts of the Baltic Sea since the 1990s (Finni et al. 2001). Phosphorus load into a dominantly nitrogen-limited environment is considered as the main pressure affecting cyanobacterial growth, as many cyanobacteria are capable of fixing molecular nitrogen. The blooms of nitrogen fixing cyanobacteria are central in the main feedback processes that slow down the recovery from eutrophication. They provide nitrogen to the N-limited pelagic system and increase settling of organic matter to the bottom, which leads to more extensive oxygen depletion and release of phosphorus from the sediments (Figure 2, Vahtera et al. 2007).
The blooms partly consist of the toxic species Nodularia spumigena, which may have negative effects on grazing zooplankton (Engström et al. 2000, Sellner et al. 1994, Sopanen et al. 2009). Cyanobacteria have also been shown to have allelopathic effects on other phytoplankton groups (Suikkanen et al. 2004, 2005).
Also other, non-eutrophication related, causes have been suggested to affect the extent of the blooms, such as: hydrographic changes – increased temperature, decreased salinity or stability of the halocline, changes in micronutrients or trace metals, as well as changes in the interaction between phyto- and zooplankton species (Kahru et al. 1994).
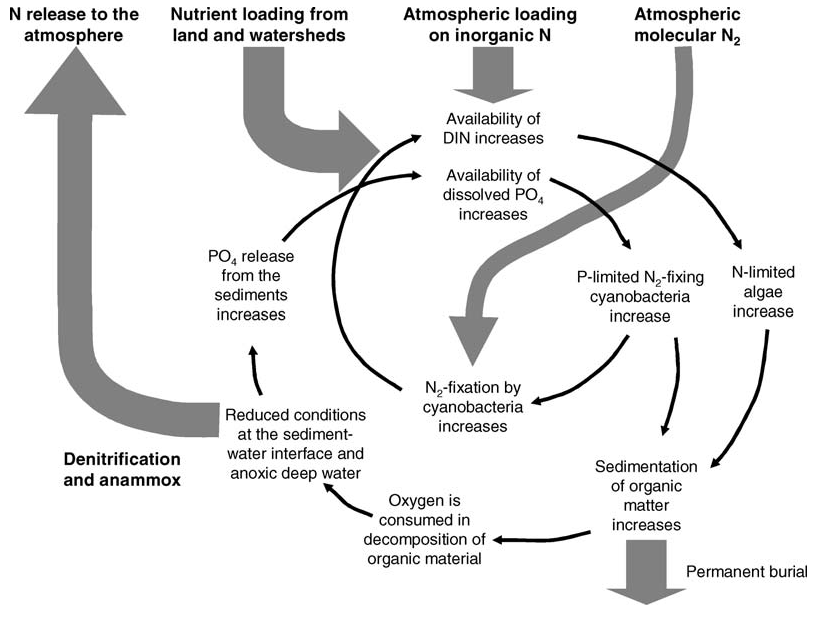
Figure 2. Simplified conceptual model of the vicious circle of eutrophication (from Vahtera et al. 2007). See Vahtera et al. 2007 for details.
2.2 Policy relevance
Eutrophication is one of the four thematic segments of the HELCOM Baltic Sea Action Plan (BSAP) with the strategic goal of having a Baltic Sea unaffected by eutrophication (HELCOM 2021). Eutrophication is defined in the BSAP as a condition in an aquatic ecosystem where excessive inputs of nutrients stimulate the growth of algae, which leads to imbalanced functioning of the system. The BSAP goal for eutrophication is broken down into five ecological objectives, one of which is “natural levels of algal blooms”.
The EU Marine Strategy Framework Directive (2008/56/EC) requires that “human-induced eutrophication is minimized, especially adverse effects thereof, such as losses in biodiversity, ecosystem degradation, harmful algal blooms and oxygen deficiency in bottom waters” (Descriptor 5). The Commission Decision on GES (2017) defines ‘Harmful algal blooms (e.g. cyanobacteria) in the watercolumn’ as the criteria element to be assessed using the criteria D5C3 “The number, spatial extent and duration of harmful algal bloom events are not at levels that indicate adverse effects of nutrient enrichment“.
Table 1. Eutrophication links to policy.
| Baltic Sea Action Plan (BSAP) | Marine Strategy Framework Directive (MSFD) | |
| Fundamental link | Segment: Eutrophication
Goal: “Baltic Sea unaffected by eutrophication”
|
Descriptor 5 Human-induced eutrophication is minimised, especially adverse effects thereof, such as losses in biodiversity, ecosystem degradation, harmful algae blooms and oxygen deficiency in bottom waters – Macrofaunal communities of benthic habitats.
|
| Complementary link | Segment: Biodiversity
Goal: “Baltic Sea ecosystem is healthy and resilient”
|
Descriptor 1 Criteria D1C6: The condition of the habitat type, including its biotic and abiotic structure and its functions (e.g. its typical species composition and their relative abundance, absence of particularly sensitive or fragile species or species providing a key function, size structure of species), is not adversely affected due to anthropogenic pressures.
|
| Other relevant policy links |
|
|
2.3 Relevance for other assessments
The indicator is included as a test indicator in the integrated assessment of eutrophication and also used in the BEAT tool for pelagic habitats.
Eutrophication assessment
The status of eutrophication is assessed using several core indicators. Each indicator focuses on one important aspect of the complex issue. In addition to providing an indicator-based evaluation of cyanobacterial blooms, this indicator also contributes to the overall eutrophication assessment, along with the other eutrophication indicators. In the integrated assessment, cyanobacterial bloom index is included in the direct effects of eutrophication. Since cyanobacterial blooms are also affected by non-eutrophication related changes (see chapter ‘Role of cyanobacterial blooms in the ecosystem’), the indicator has been down-weighted in the integrated assessment.
3 Threshold values
The indicator uses assessment unit specific threshold values that are presented as normalized values. The threshold values of this pre-core indicator are yet to be commonly agreed in HELCOM. The indicator is based on two parameters: (1) cyanobacterial surface accumulations (CSA) and (2) cyanobacterial biomass. A normalized threshold value is set for each parameter for each assessment unit, and the combined indicator threshold value is an average of the two. If either parameter is not applicable or available for a specific assessment unit, then only one parameter is used for the threshold value. Normalized values that are above the threshold value indicate good status (Figure 3).
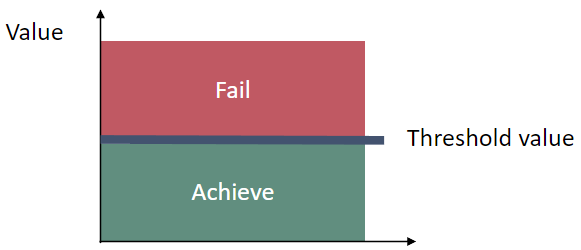
Figure 3 Schematic representation of the averaged and normalized threshold value applied in the cyanobacteria bloom index pre-core indicator, the threshold values are assessment unit specific (see Table 2).
The specific values for each parameter and the proposed overall threshold value are listed in Table 2.
Table 2. Summary table of assessment unit specific threshold values in the open-sea areas. The indicator (Cyanobacterial bloom index, CyaBI) threshold value is the average of the two parameter specific values (Cyanobacterial surface accumulations (CSA) and cyanobacterial biomass). For those assessment units, where threshold value is available only for one of the parameters, the indicator is based solely on that parameter. Threshold values have been updated for HOLAS 3.
| HELCOM ID | Assessment unit (open sea) |
Parameter threshold: CSA (normalized between 0-1, with 1 expressing good status) | Parameter threshold: Biomass (normalized threshold value between 0-1, with 1 expressing good status) | Indicator Threshold:CyaBI (normalized threshold between 0-1, with 1 expressing good status) | Comments on indicator protocol |
| SEA-001 | Kattegat | Relevance under investigation | |||
| SEA-002 | Great Belt | Relevance under investigation | |||
| SEA-003 | The Sound | Relevance under investigation | |||
| SEA-004 | Kiel Bay | Under development | |||
| SEA-005 | Bay of Mecklenburg | 0.85 | 0.92 | 0.89 | Indicator average of CSA and biomass |
| SEA-006 | Arkona Basin | 0.75 | 0.94 | 0.85 | Indicator average of CSA and biomass |
| SEA-007 | Bornholm Basin | 0.79 | 0.87 | 0.83 | Indicator average of CSA and biomass |
| SEA-007B | Pomeranian Bay | 0.81 | Under development | 0.81 | Indicator only based on CSA |
| SEA-008 | Gdansk Basin | 0.77 | Under development | 0.77 | Indicator only based on CSA |
| SEA-009 | Eastern Gotland Basin | 0.94 | 0.84 | 0.89 | Indicator average of CSA and biomass |
| SEA-010 | Western Gotland Basin | 0.88 | 0.82 | 0.85 | Indicator average of CSA and biomass |
| SEA-011 | Gulf of Riga | 0.92 | 0.88 | 0.90 | Indicator average of CSA and biomass |
| SEA-012 | Northern Baltic Proper | 0.87 | 0.98 | 0.93 | Indicator average of CSA and biomass |
| SEA-013A | Gulf of Finland Western | 0.93 | 0.83 | 0.88 | Indicator average of CSA and biomass |
| SEA-013B | Gulf of Finland Eastern | 0.97 | 0.84 | 0.91 | Indicator average of CSA and biomass |
| SEA-014 | Åland Sea | 0.91 | Not applicable | 0.91 | Indicator only based on CSA |
| SEA-015 | Bothnian Sea | 0.94 | 0.90 | 0.92 | Indicator average of CSA and biomass |
| SEA-016 | The Quark | Relevance under investigation | |||
| SEA-017 | Bothnian Bay | Relevance under investigation | |||
3.1 Setting the threshold value(s)
Method description for deriving the threshold values
Parameter specific threshold values for the assessment units were derived based on long-term data series of:
- – cyanobacterial surface accumulations (CSA); the independent satellite-based time series on algae accumulations from 1979-2014 in the Baltic Sea by Kahru and Elmgren (2014) and
- – cyanobacterial biomass; data on in-situ observations of cyanobacteria biomass 1990-2015 collated by the HELCOM PEG group (Wasmund et al. 2015)
The indicator threshold values for the assessment units were derived as an average of the parameter specific thresholds. When threshold was available only for one of the parameters, this parameter threshold was used as the threshold for the indicator, and the indicator assessment for that assessment unit was also based solely on that parameter. For the assessment period 2016-2021, this was the case for the Gdansk Basin, Pomeranian Bay and Åland Sea, which only had thresholds available for CSA.
The threshold values were derived by combining statistical analysis of long-term data with expert judgement. The main concern in proposing threshold values is the lack of sound and consistent historical data. The data starting from 1970s -1990s, which are available in the threshold setting datasets do not correspond to “no, or very little human impact” that could be used as a reference condition. Investigations of stable nitrogen and carbon isotope composition as well as of the organic carbon content of sediments have shown that the increase in nutrients and productivity began already in the 1950s–1960s (Andrén et al., 2000; Struck et al., 2000; Poutanen & Nikkilä, 2001). According to Finni et al. (2001), cyanobacterial blooms have become common in the open sea in both the Baltic Proper and the Gulf of Finland since at least the 1960s.
As cyanobacterial blooms are a natural phenomenon in the Baltic Sea, the threshold values should not describe a status with no blooms, but rather a status without extensive and potentially harmful blooms. This status should be consistent with sustainable use of the sea by humans. To meet this aim, the thresholds were derived based on the time periods within the available datasets where the status was already impacted by eutrophication, but the bloom intensity was low. Within the time periods covered by the available datasets, the status covers varying levels of cyanobacterial blooms. To distinguish the shorter periods of low bloom intensity in comparison to the general level, a shift detection method (Rodionov 2004) was used; or if no such periods were distinguished, the thresholds were based on individual low-bloom years using the lowest quartile method (document 3-5 rev.1 of State & Conservation 5E-2017).
Thresholds for CSA
The thresholds for CSA are based on satellite-based time series on algae accumulations (Fraction with Cyanobacterial Accumulations, FCA) from 1979-2014 in the Baltic Sea by Kahru and Elmgren 2014. The shift-detection method was successfully applied to all assessment units that were assessed in HOLAS II (State & Conservation 5E-2017, document 3-5 rev.1). Normalized FCA threshold values were transformed into CSA thresholds using a linear model between the two datasets (Anttila et al. 2018).
The normalization and linear models have been updated for HOLAS 3, which affects the normalized CSA threshold values, but the underlying FCA values remain unchanged (State & Conservation 17-2022, document 5J-27, appendix 2). New tentative thresholds have been set for Bornholm Basin and Arkona Basin, Pomeranian Bay, Bay of Mecklenburg and Åland Sea. For Bornholm Basin, the same method was used as in HOLAS II, whereas for the smaller basins, FCA data from 1979 – 1997, with higher uncertainty, was excluded from threshold setting, and thresholds were based on the 5th percentile of FCA% from 1998-2021. For the Åland Sea, the CSA threshold was set as an average of the values in adjacent basins Bothnian Sea and Northern Baltic Proper, due to poor dependency between the FCA and CSA time series in this assessment unit.
Thresholds for cyanobacterial biomass
Thresholds for the cyanobacterial biomass were set based on the assessment unit specific timeseries of yearly average cyanobacterial biomasses, as sum of the three main bloom forming genera (Nodularia, Aphanizomenon and Dolichospermum) in summer (generally June-August), collated by HELCOM PEG and presented in the HELCOM Baltic Sea Environment fact sheet for cyanobacterial biomass (Wasmund et al. 2015). Periods of low bloom intensity could be identified using the shift detection method only for the Bothnian Sea and the Gulf of Finland in HOLAS II (document 3-5 rev.1 of State & Conservation 5E-2017). For the rest of the assessment units the lowest quartile method was used. A new tentative threshold has been set for the Western Gotland Basin, using the lowest quartile method, and the threshold for Bothnian Sea has been corrected (State & Conservation 17-2022 document 5J-27, appendix 2). The normalization of the thresholds and data for the Northern Baltic Proper and Bothnian Sea was updated due to notable increase in the cyanobacterial biomass in these assessment units. This does not affect the underlying thresholds in µg L-1. Kiel Bay, Gdansk Basin and Pomeranian Bay still lack thresholds for cyanobacterial biomass and there is no data available for the Åland Sea. The non-normalized thresholds are presented in State & Conservation 17-2022 document 5J-27, appendix 2.
4 Results and discussion
The results of the indicator evaluation underlying the key message map and information are provided below. This pre-core indicator and its threshold values are yet to be commonly agreed in HELCOM. The indictor is included as a test indicator for the purposes of the ‘State of the Baltic Sea’ report, and the results are to be considered as intermediate.
4.1 Status evaluation
Good status was not achieved in any of the assessment units where the indicator was applied. EQRS was highest in the Arkona Sea, Bornholm Sea and Gulf of Finland Eastern (0.43-0.46) and lowest in the Bothnian Sea (0.23) (Figure 4 and table 3). The indicator consists of two parameters, cyanobacterial biomass and cyanobacterial surface accumulations, which provided generally a similar evaluation (Figure 5, figure 6, table 4). Difference in relation to the threshold for good status was found only for the Arkona Sea, where biomass reflects good status and CSA reflects a level below GES.
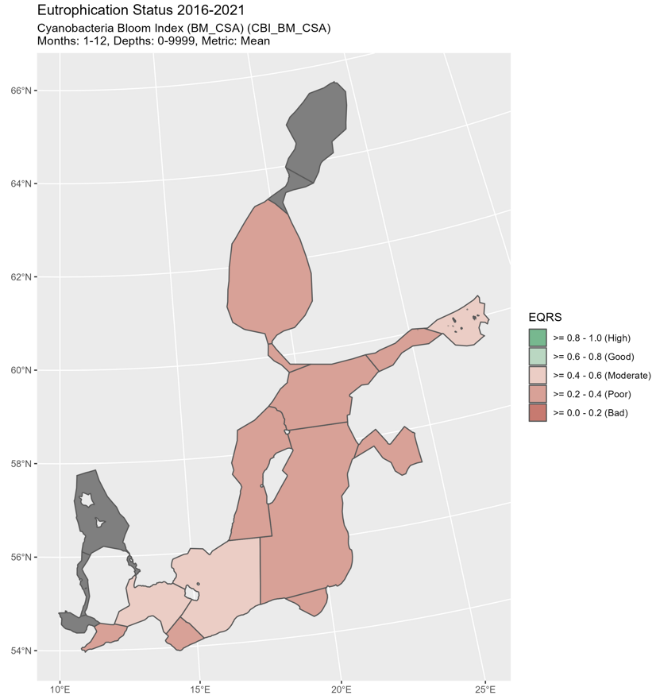
Figure 4. Status of cyanobacterial bloom index, presented as ecological quality ratio scaled (EQRS). EQRS shows the present concentration in relation to the reference value, decreasing along with increasing eutrophication. The threshold value has been achieved when EQRS ≥ 0.6.
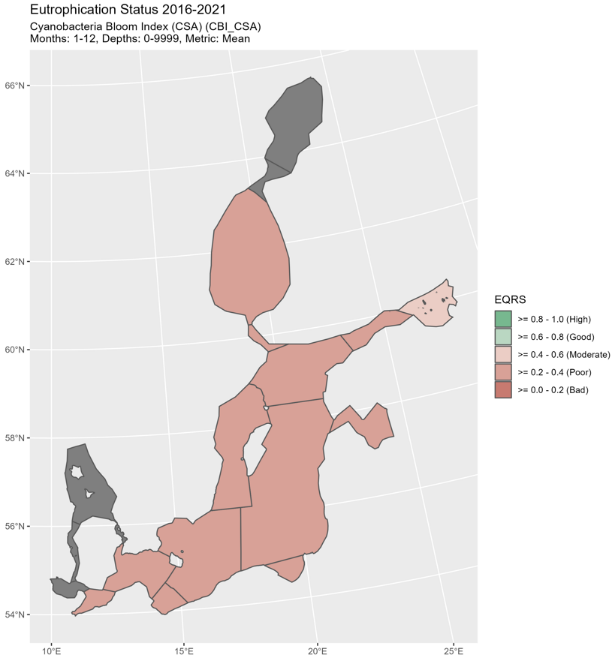
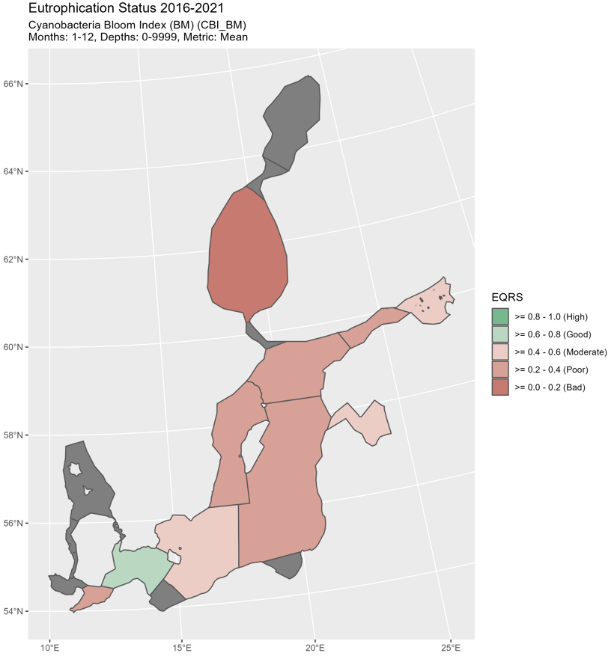 Figure 5. Status of cyanobacterial biomass (BM) presented as ecological quality ratio scaled (EQRS) on the left figure and Status of cyanobacterial surface accumulation (CSA) presented as ecological quality ratio scaled (EQRS) on the right figure. EQRS shows the present concentration in relation to the reference value, decreasing along with increasing eutrophication. The threshold value has been achieved when EQRS ≥ 0.6.
Table 3. Information on threshold values, present estimates and status (good status /not good status) of the Cyanobacterial Bloom Index indicator. The indicator values are based on two parameters, Cyanobacterial Surface Accumulations and Cyanobacteria biomass (See table 2 and Assessment protocol).
Table 4. Parameter specific results for cyanobacterial bloom index for HOLAS 3 period (2016-2021). Cyanobacterial biomass in µg L-1 and scaled Ecological quality ratios (EQRS) for cyanobacterial biomass and cyanobacterial surface accumulations (CSA). Note that the EQRS values for Cyanobacterial Bloom Index in Table 3 are based on the indicator estimate values (normalized between 0-1, with 1 expressing good status), and not on the parameter specific EQRS values (See assessment protocol).
| HELCOM ID | Assessment unit | Cyanobacterial biomass µg L-1 | Cyanobacterial biomass EQRS | CSA EQRS |
| SEA-005 | Bay of Mecklenburg | 73 | 0.34 | 0.36 |
| SEA-006 | Arkona Sea | 89 | 0.69 | 0.28 |
| SEA-007 | Bornholm Sea | 85 | 0.59 | 0.33 |
| SEA-007B | Pomeranian Bay | 0.36 | ||
| SEA-008 | Gdansk Basin | 0.38 | ||
| SEA-009 | Eastern Gotland Basin | 284 | 0.28 | 0.36 |
| SEA-010 | Western Gotland Basin | 149 | 0.26 | 0.37 |
| SEA-011 | Gulf of Riga | 160 | 0.42 | 0.26 |
| SEA-012 | Northern Baltic Proper | 688 | 0.29 | 0.26 |
| SEA-013A | Gulf of Finland Western | 412 | 0.34 | 0.30 |
| SEA-013B | Gulf of Finland Eastern | 334 | 0.48 | 0.45 |
| SEA-014 | Åland Sea | 0.28 | ||
| SEA-015 | Bothnian Sea | 83 | 0.18 | 0.34 |
4.2 Trends
Blooms of nitrogen-fixing cyanobacteria are a natural phenomenon in the Baltic Sea (Bianchi et al. 2000, Poutanen & Nikkilä 2001, Westman et al. 2003), and have been observed in phytoplankton sampling in the early 1900s (Hällfors et al. 2013). The blooms became extensive during the 20th century and have occurred commonly in the Baltic Proper and the Gulf of Finland since the 1960s (Finni et al. 2001, Poutanen & Nikkilä 2001).
The longest satellite-based time series on algae accumulations from the Baltic Sea is presented by Kahru and Elmgren (2014). According to this satellite-based investigation, cyanobacterial blooms have increased in the Baltic Sea since the late 1970s (Figure 6). Also, the total area covered by the blooms has increased during this time. However, the development has not been linear as the period with the lowest number of blooms occurred in the late 1980s – early 1990s.
Figure 6. Mean fraction of cyanobacteria accumulations (FCA%) and total accumulated area affected (TA) in the entire Baltic Sea between 1979 and 2013 based on satellite detection (from Kahru and Elmgren, 2014).
The indicator status indicates a worsening trend (i.e. decreasing Cyanobacterial Bloom Index values) from 1990s or early 2000s to 2021 (depending on data availability) for most of the assessed areas (Results figure 3). For the Bornholm Basin, Eastern Gotland Basin, Gulf of Finland Eastern and Gdansk Basin no significant trend was found. 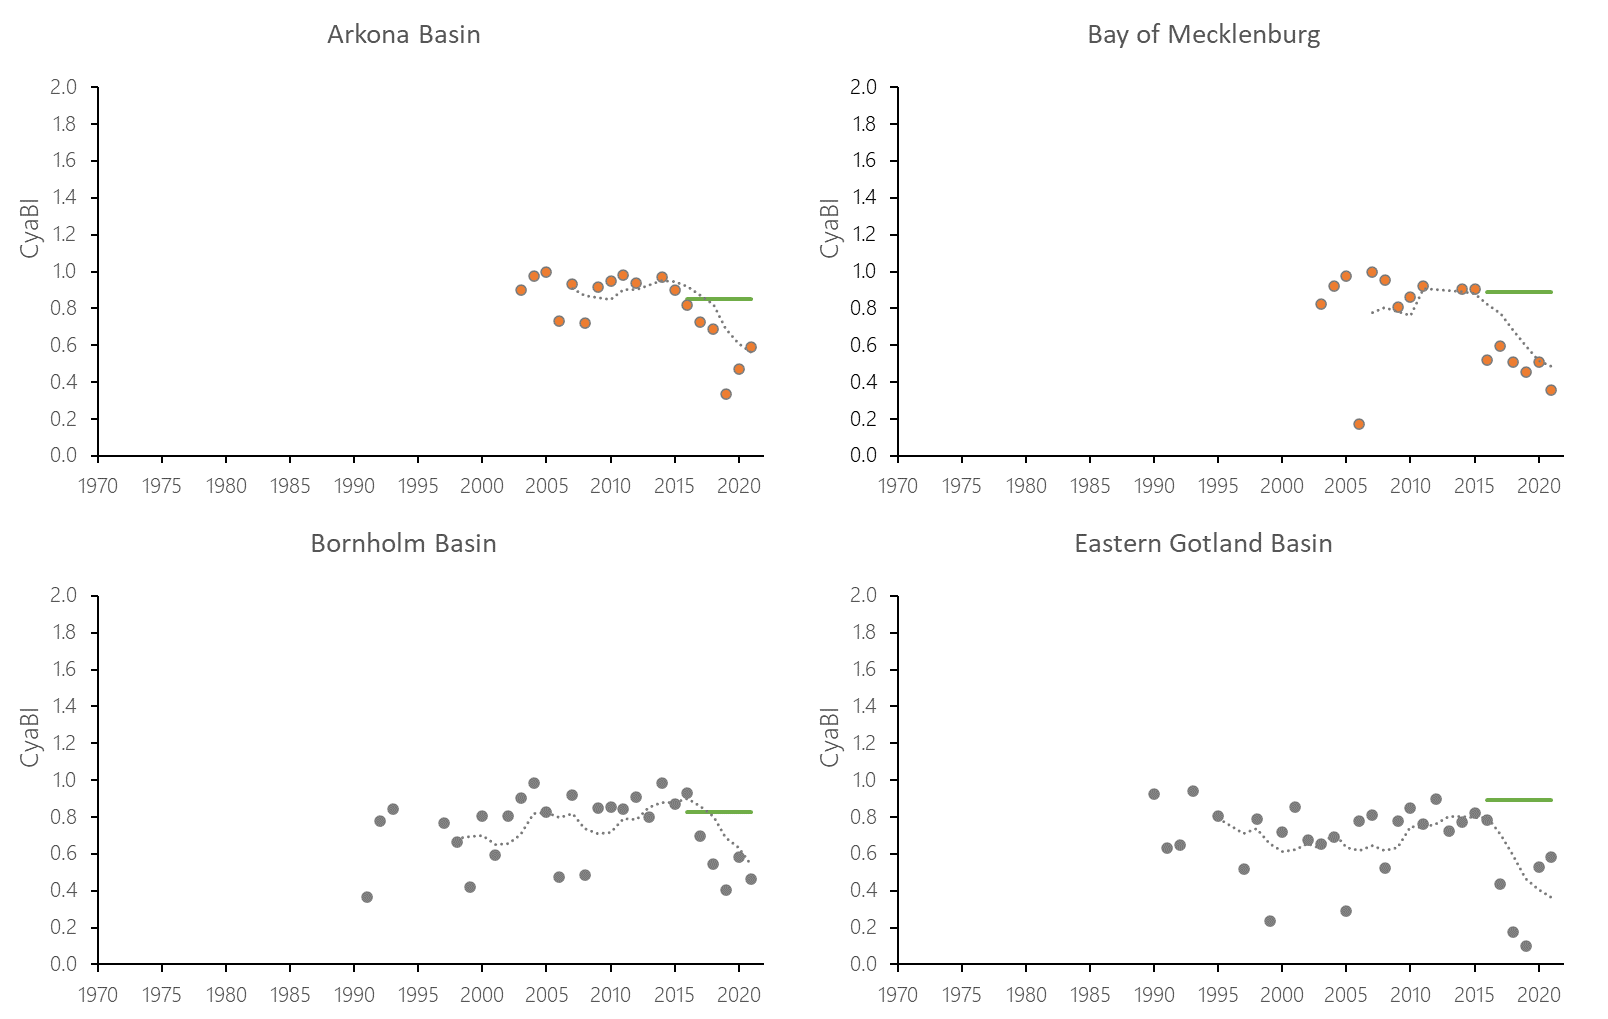
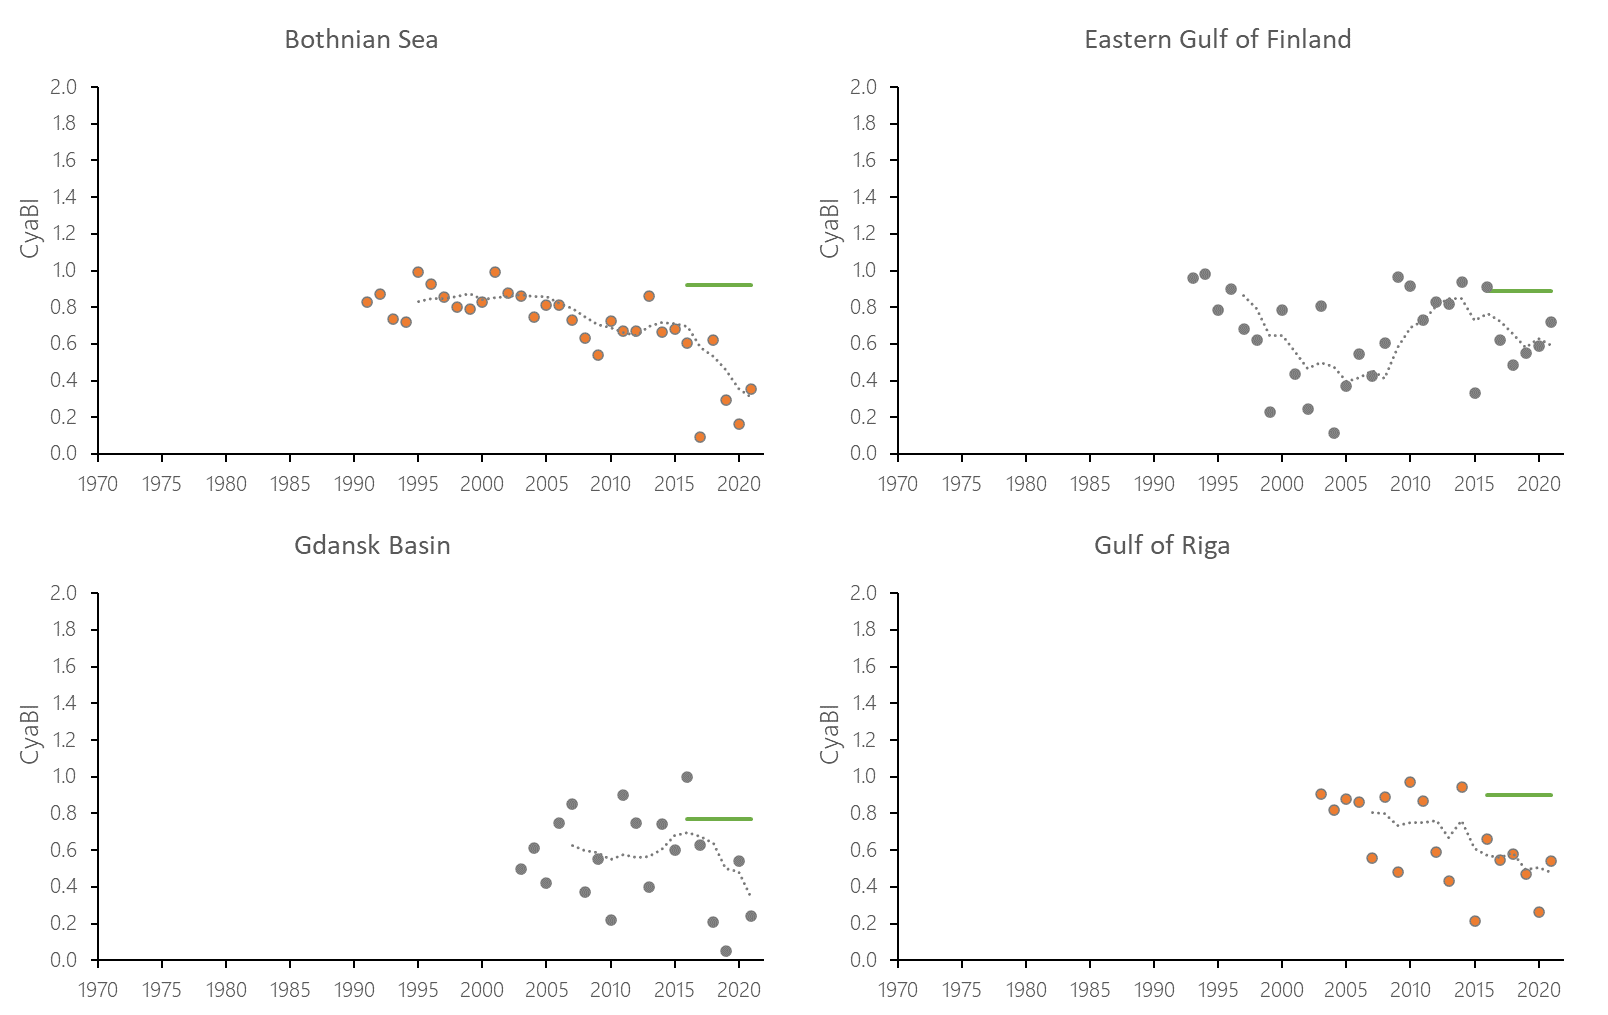
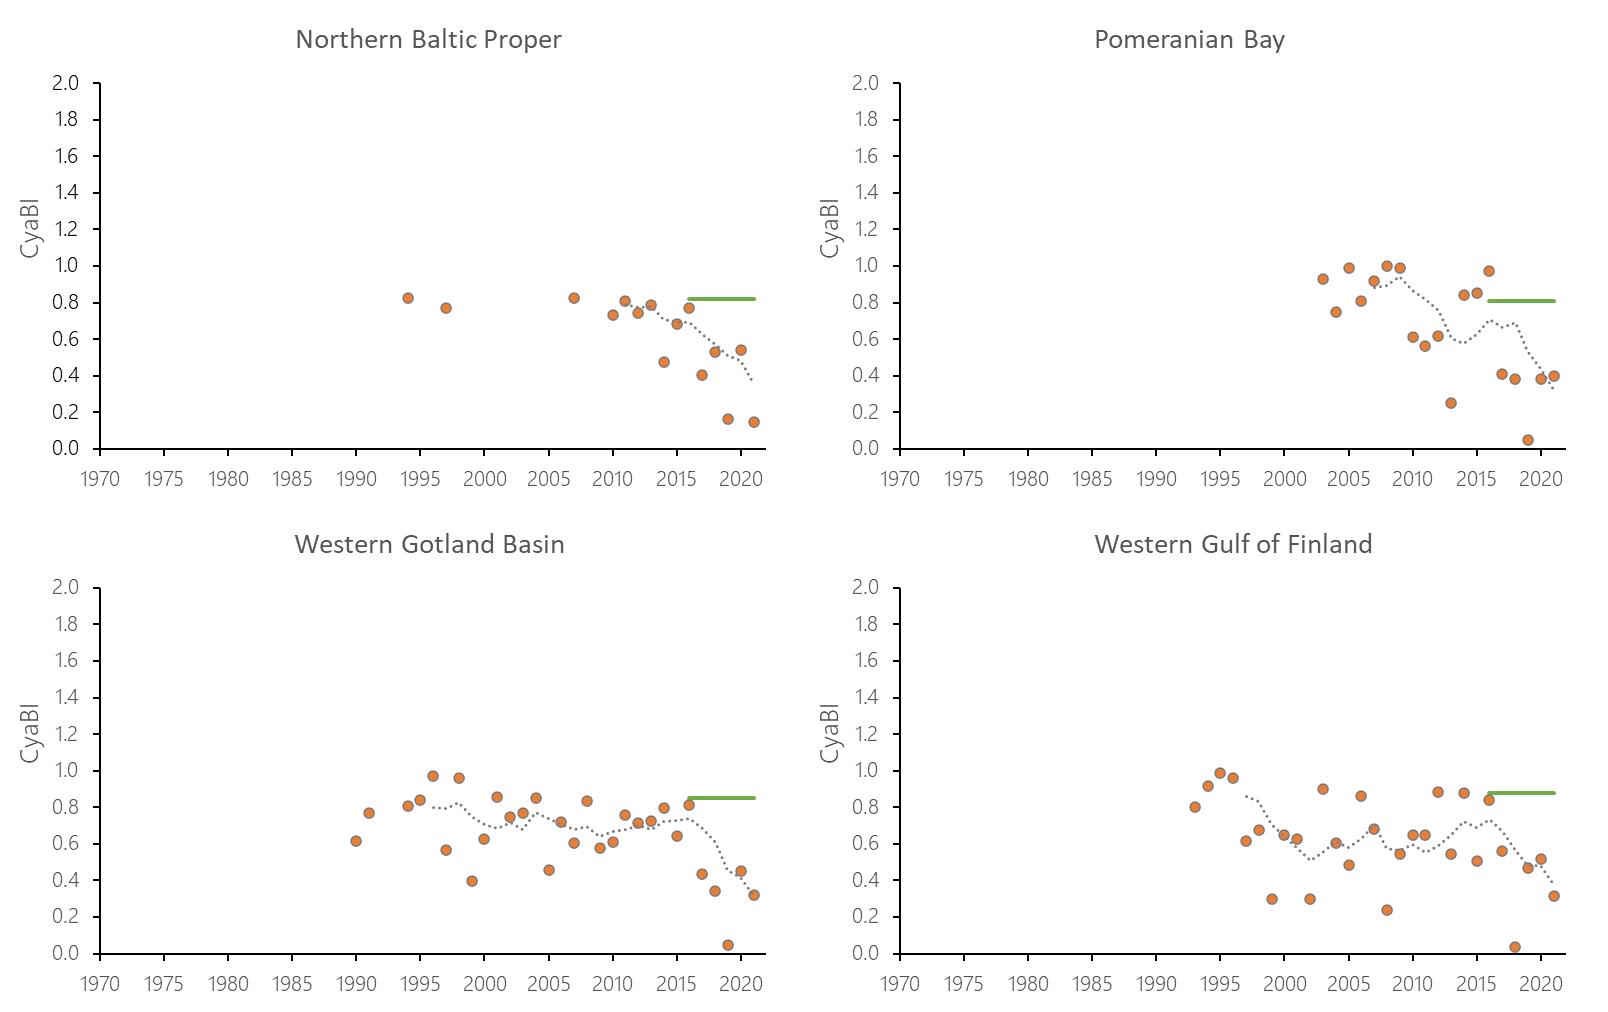
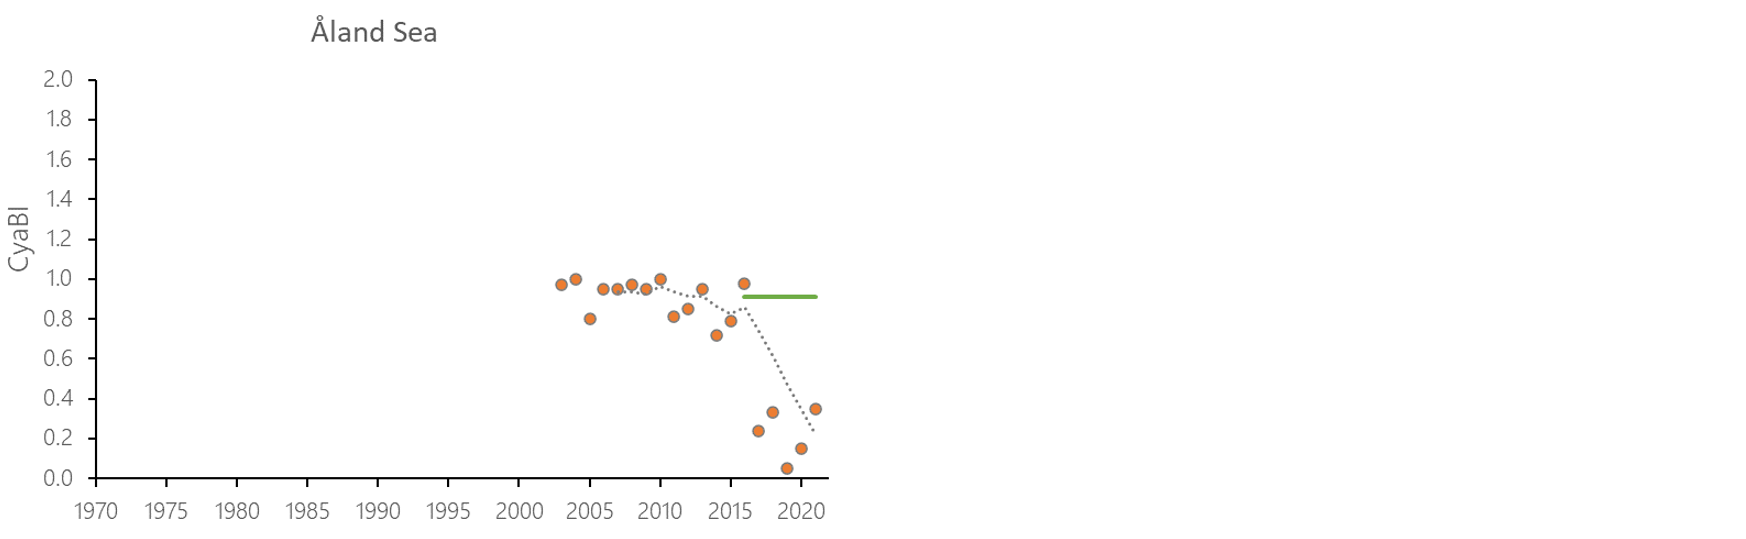
Figure 7. Temporal development of ‘Cyanobacterial bloom index’ in the open-sea assessment units in 1990-2021. Dashed lines show the five-year moving averages of the normalised estimates. Green lines are Assessment Unit (AU) specific threshold values. Significance of trends was assessed with Mann-Kendall non-parametric tests for the individual AUs . Significant (p<0.05) deteriorating trends are indicated with orange data points. No significant improving trends were found in the current data set.
4.3 Discussion text
Evaluation results for cyanobacterial bloom index were compared between the latest two evaluations of HOLAS II and HOLAS 3. All assessed basins remained below good status in HOLAS 3.
Table 5. Status of cyanobacterial bloom index estimates in the HOLAS II (2011-2016) and HOLAS 3 (2016-2021) period coloured red or green whether the sub-basins fails or achieves the threshold, respectively. The last column provides a description of outcome.
| HELCOM Assessment Unit name | HOLAS II status | HOLAS 3 status | Description of outcomes, if pertinent |
| Kattegat | |||
| Great Belt | |||
| The Sound | |||
| Kiel Bay | |||
| Bay of Mecklenburg | Fail | Fail | Remains below GES |
| Arkona Basin | Fail | Fail | Remains below GES |
| Bornholm Basin | Fail1 | Fail | Remains below GES |
| Pomeranian Bay | Fail | Remains below GES | |
| Gdansk Basin | Fail | Fail | Remains below GES |
| Eastern Gotland Basin | Fail | Fail | Remains below GES |
| Western Gotland Basin | Fail | Fail | Remains below GES |
| Gulf of Riga | Fail | Fail | Remains below GES |
| Northern Baltic Proper | Fail | Fail | Remains below GES |
| Gulf of Finland Western | Fail2 | Fail | Remains below GES |
| Gulf of Finland Eastern | Fail | Remains below GES | |
| Åland Sea | Fail | ||
| Bothnian Sea | Fail | Fail | Remains below GES |
| The Quark | |||
| Bothnian Bay |
1) The assessment unit borders have changed. Bornholm Basin and Pomeranian Bay were assessed together in HOLAS II.
2) The assessment unit borders have changed. Gulf of Finland was assessed as one unit in HOLAS II.
5 Confidence
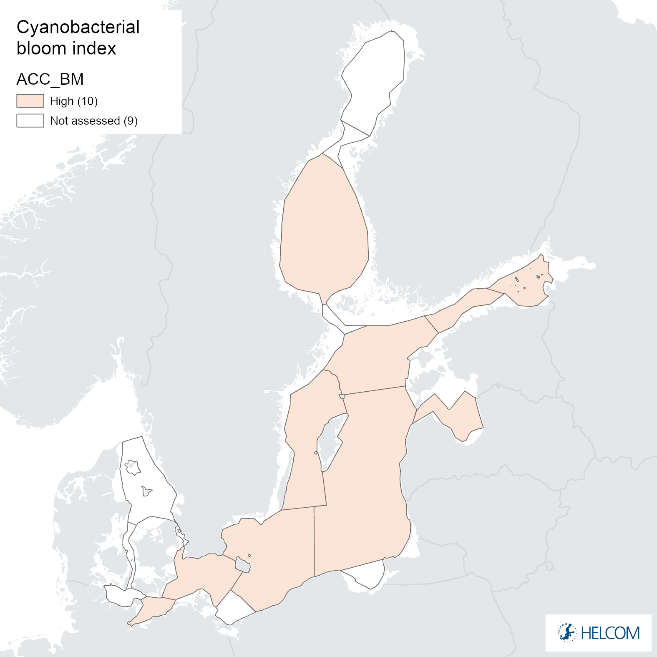
The overall confidence of the indicator status evaluation, based on the spatial and temporal coverage of data and accuracy of the classification result, was high in all assessment units except for the Pomeranian Bay and the Gdansk Basin, where it was moderate (Figure 8). The lower overall confidence in these assessment units was due to low spatial confidence (Annex 1).
The spatial confidence of the indicator was high in most assessment units, but low in the Bay of Mecklenburg, Pomeranian Bay and the Gdansk Basin (Annex 1). The spatial confidence of the biomass parameter was low in all assessment units, whereas the spatial confidence of the CSA parameter was high in all assessment units, except low in the Pomeranian Bay and the Gdansk Basin and moderate in the Bay of Mecklenburg. In areas with lower spatial confidence for CSA, the reason is due to shallow areas in the assessment area. Shallow areas can create overestimation in satellite observed cyanobacteria bloom detection, therefore over these areas satellite observations are excluded.
Temporal confidence of the indicator was high in all assessment units. Temporal confidence was also high for CSA parameter for all assessment units, and for biomass parameter for all assessment units except moderate in the Arkona Basin and Northern Baltic Proper.
The confidence in accuracy of the GES evaluation result was high in all open-sea assessment units. It was also high separately for both parameters.
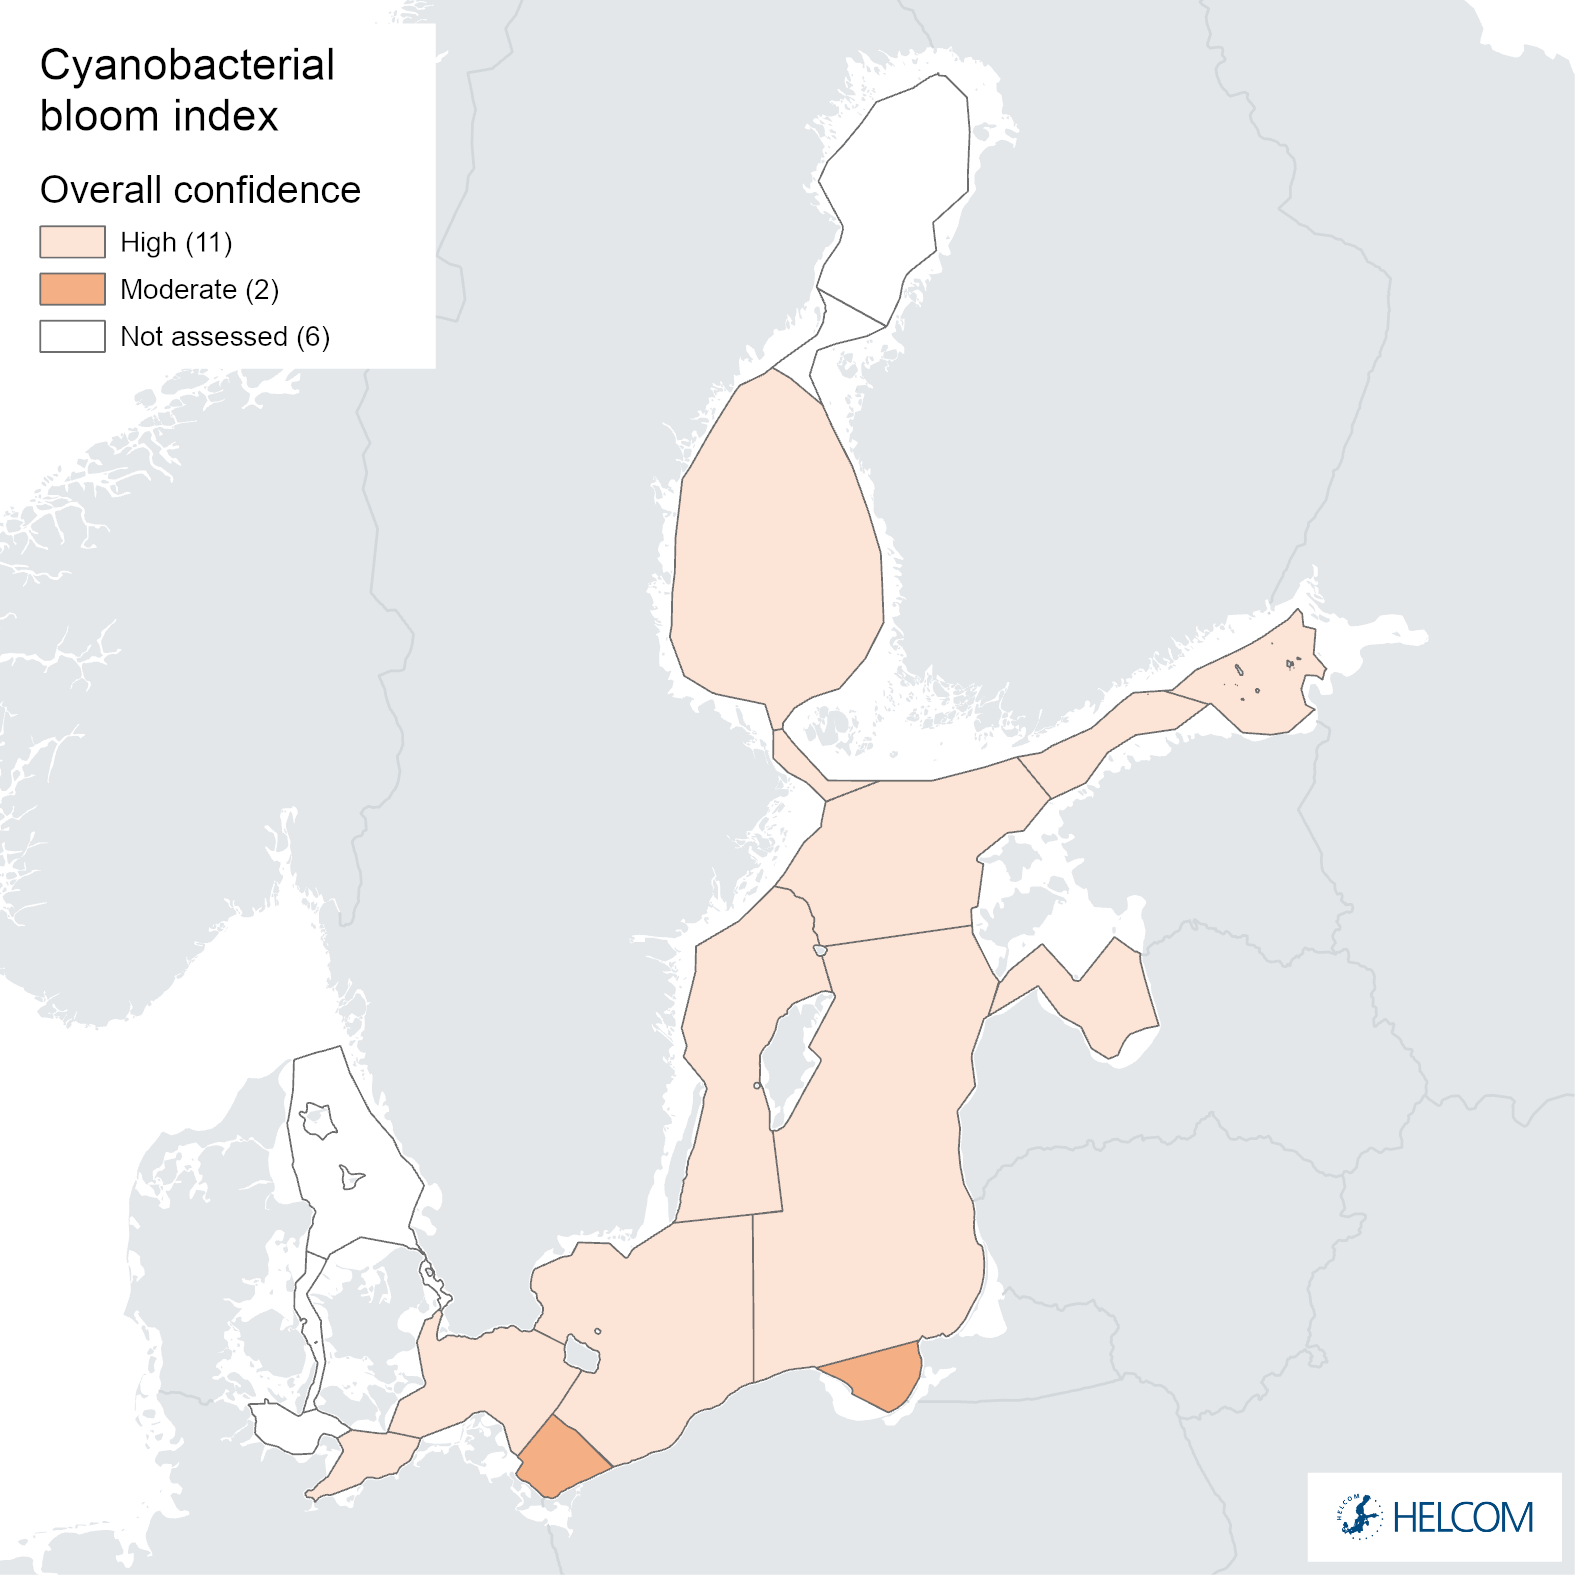
Figure 8. Indicator confidence determined as an average of the parameter specific confidences for cyanobacterial biomass and cyanobacterial surface accumulations.
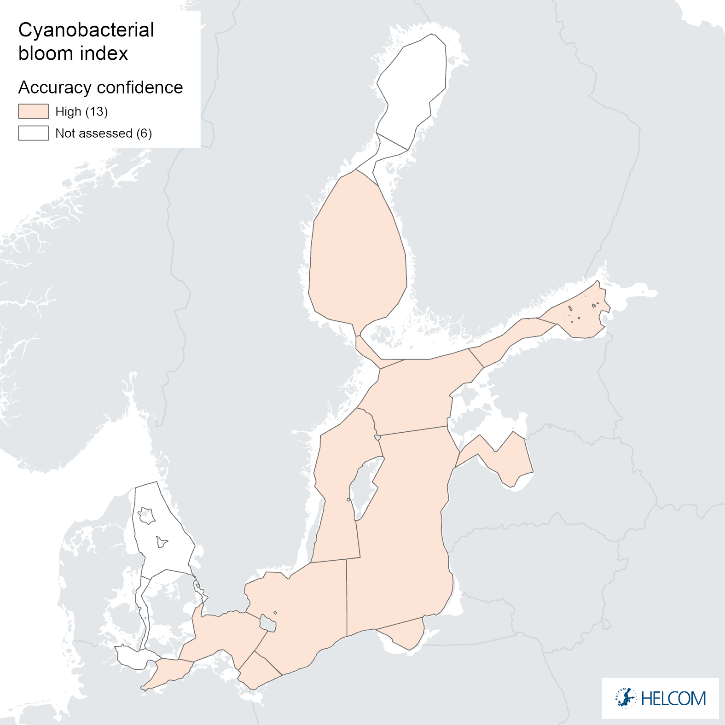
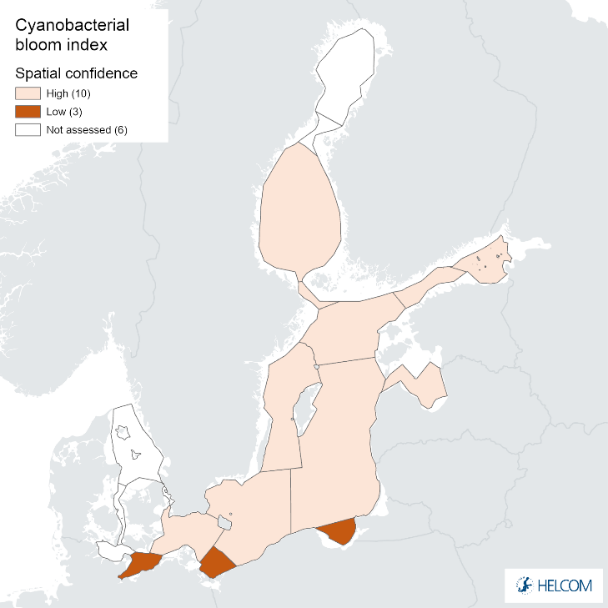

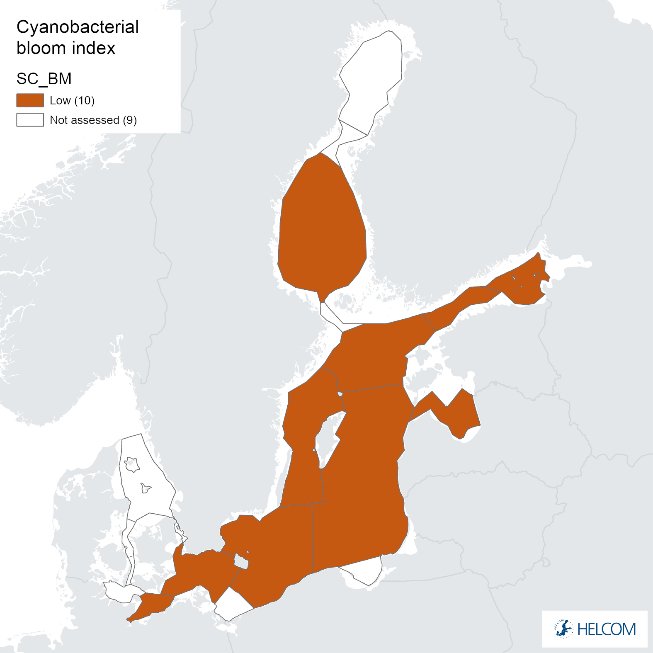
Figure 9. Confidence for cyanobacterial bloom index regarding Accuracy Class (ACC), Spatial Confidence (SC) and Temporal Confidence (TC). Low indicator confidence calls for increase in monitoring.
Parameter-specific confidence maps for CSA and BM are included in Annex 1.
6 Drivers, Activities, and Pressures
For HOLAS 3 initial work has been carried out to explore Drivers (and driver indicators) to evaluate how such information can be utilised within such management frameworks as DAPSIM. Although it is recognised as only addressing a small portion of the drivers (via proxies) of relevance for eutrophication wastewater treatment (Drivers and driver indicators for Wastewater Treatment) and agriculture (Drivers and driver indicators for Agricultural Nutrient Balance) have been explored in these pilot studies for HOLAS 3.
Diffuse sources constitute the highest proportion of total nitrogen (nearly 50%) and total phosphorus (about 56%) inputs to the Baltic Sea (HELCOM 2022). For total nitrogen, atmospheric deposition on the sea has the second highest share (24%) followed by natural background loads (20%) and point sources (9%). Natural background loads have the second highest share of total phosphorus inputs to the Baltic Sea (20%), followed by point sources (17%) and atmospheric deposition (7%). Point sources include activities such as municipal wastewater treatment plants, industrial plants and aquacultural plants and diffuse sources consist of anthropogenic sources such as agriculture, managed forestry, scattered dwellings, storm water etc.
A significant reduction of nutrient inputs has been achieved for the whole Baltic Sea. The normalized total input of nitrogen was reduced by 12% and phosphorus by 28 % between the reference period (1997-2003) and 2020 (HELCOM 2023a). The maximum allowable input (MAI) of nitrogen in this period was fulfilled in the Bothnian Bay, Bothnian Sea, Danish Straits and Kattegat and the maximum allowable input of phosphorus in the Bothnian Bay, Bothnian Sea, Danish Straits and Kattegat.
Further developing an overview of such components and the relevant data to be able to better quantify the linkages within a causal framework provide the opportunity for more informed management decisions, for example targeting of measures, and can thereby support the achievement of Good Environmental Status.
Table 6. Brief summary of relevant pressures and activities with relevance to the indicator.
| | General | Activity: MSFD Annex III, Table 2b | Pressure: MSFD Annex III, Table 2a |
| Strong link | Cultivation of living resources; Transport; Urban and industrial uses; Physical restructuring of rivers, coastline or seabed (water management) | Input of nutrients; input of organic matter | |
| Weak link |
7 Climate change and other factors
The current knowledge of the effects of climate change on eutrophication is summarized in the HELCOM fact sheet for climate change (HELCOM and Baltic Eartch 2021), and the effects on cyanobacterial blooms are described in more detail in the update of the climate change fact sheet for harmful algal blooms (HELCOM 2023b). The effect of climate change to the nutrient pools is not yet separable from the other pressures, and the future nutrient pools will dominantly be affected by the development of nutrient loading. The cyanobacterial growth season has already prolonged (HELCOM and Baltic Earth 2021). There has been a significant increase both in the frequency and extent of the cyanobacterial blooms, which has been attributed to a decrease in surface salinity and increase in sea surface temperature (HELCOM 2023b).
Climate change is, with medium confidence, considered to increase the stratification, further deteriorate near-bottom oxygen conditions, and increase the internal nutrient loading (HELCOM and Baltic Earth 2021). Warming favours cyanobacteria and is expected to lead to more extensive blooms (HELCOM 2023b). The cyanobacterial accumulations are expected to expand, if the nutrient loads are not reduced (HELCOM and Baltic Earth 2021).
8 Conclusions
The status evaluation fails to achieve good status in all assessed sub-basins.
8.1 Future work or improvements needed
The indicator will be further developed towards the next assessment period, including improving the understandability, especially through reviewing the normalisation and compilation of the CSA variables (severity, duration and volume) as well as combining the CSA and biomass parameters into one indicator. The threshold setting will be re-evaluated.
9 Methodology
9.1 Scale of assessment
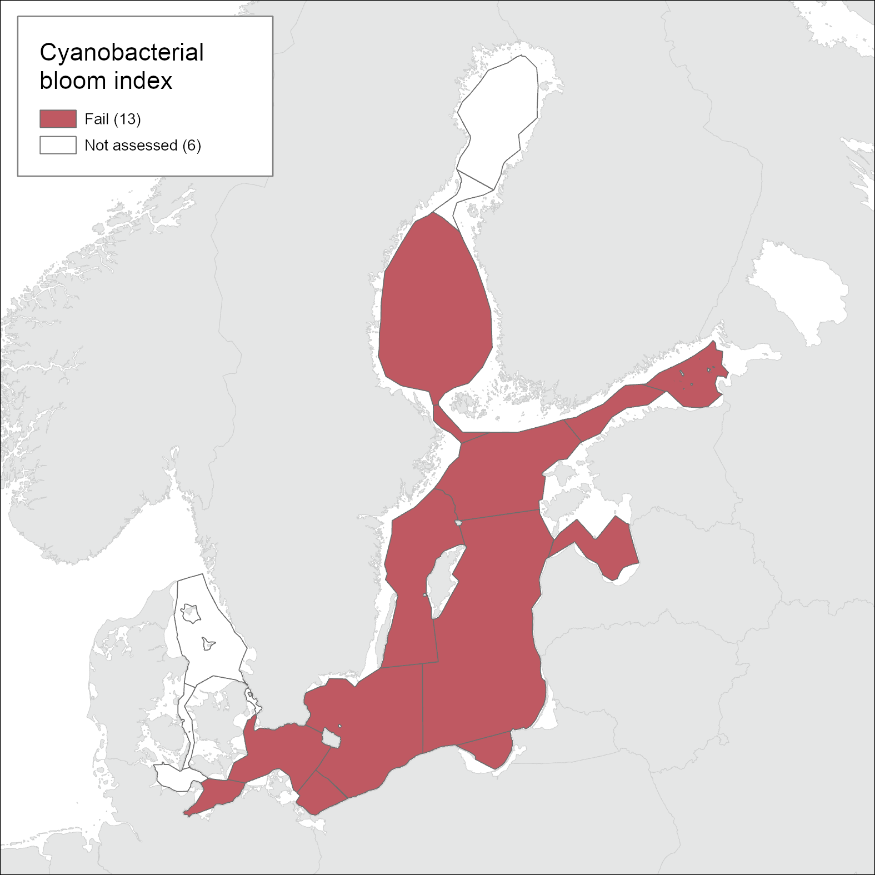
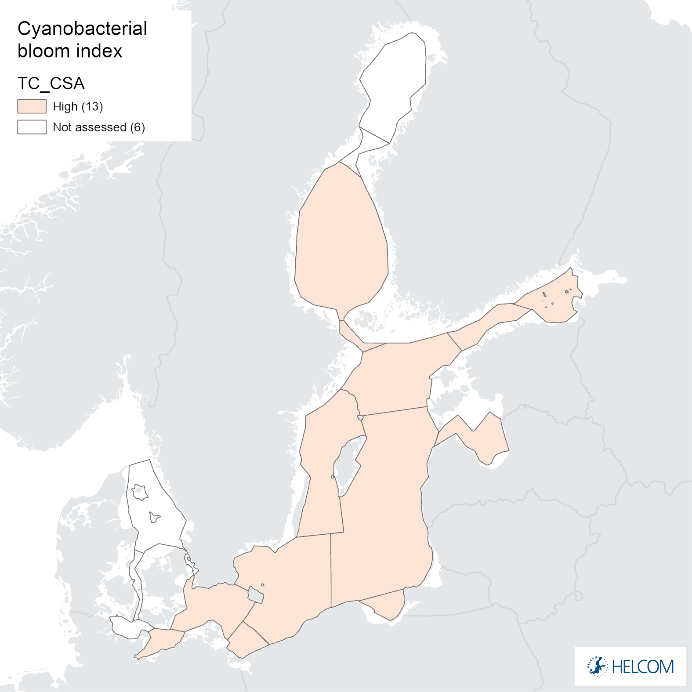
The pre-core indicator is operational in 13 open sea assessment units (at least one nautical mile seawards from the baseline).
The indicator is applicable in the following open sea assessment units: Bay of Mecklenburg, Arkona Basin, Bornholm Basin, Pomeranian Bay, Gdansk Basin, Eastern Gotland Basin, Western Gotland Basin, Gulf of Riga, Northern Baltic Proper, Gulf of Finland Western, Gulf of Finland Eastern, Åland Sea and Bothnian Sea. The relevance of the indicator in the Kattegat, the Sound, the Bothnian Bay, the Great Belt and the Quark is under investigation. Threshold for the Kiel Bay is under development. In its present form, the indicator is not applicable in the coastal areas.
The indicator is assessed within the HELCOM geographical assessment unit level 4 for eutrophication: open sea sub-basin areas. The assessment units are defined in the HELCOM Monitoring and Assessment Strategy Annex 4.
9.2 Methodology applied
The HELCOM pre-core indicator ‘Cyanobacterial bloom index’ (CyaBI) evaluates the increase in cyanobacterial blooms, taking into account different aspects of the bloom phenomenon. It responds negatively to increasing eutrophication, i.e. low values indicate increased eutrophication.
The indicator consists of two parameters 1) cyanobacterial surface accumulations (CSA), combining information of volume, length of bloom period and severity of surface accumulations estimated from remote sensing observations and 2) the cyanobacterial biomass in the water column analyzed from in-situ observations.
Both parameters describe different relevant aspects of the cyanobacterial accumulations: The CSA (parameter 1) relies on high-frequency data, and is optimal for describing the spatial and temporal extent and intensity of the surface blooms. However, this parameter is influenced, in addition to eutrophication, by climate-related variation including wind conditions. The cyanobacterial biomass (parameter 2) supplements CSA by providing information of the actual amount of cyanobacteria in the water column. Combining the two parameters allows for more reliable status estimation than either parameter alone: an indicator expressing the extent of the blooms with high confidence; yet related strongly to changes in the actual amount of cyanobacteria, and subsequently, to eutrophication.
The indicator specifics are presented in Table 7.
Table 7. Specifications of the core indicator cyanobacterial bloom index.
| Indicator | Cyanobacterial bloom index | ||||||||||||||||||||||||||||||||||||||||||||||||||||||||||||||||||||||||||||||||||||||||||||||||||||||||||||||||||||||||||||||||||||||||||||||||
| Response to eutrophication | negative for the normalized parameters and indicator | ||||||||||||||||||||||||||||||||||||||||||||||||||||||||||||||||||||||||||||||||||||||||||||||||||||||||||||||||||||||||||||||||||||||||||||||||
| Parameters | Cyanobacterial biomass and Cyanobacterial surface accumulations (CSA) | ||||||||||||||||||||||||||||||||||||||||||||||||||||||||||||||||||||||||||||||||||||||||||||||||||||||||||||||||||||||||||||||||||||||||||||||||
| Assessment period | 2016 –2021 | ||||||||||||||||||||||||||||||||||||||||||||||||||||||||||||||||||||||||||||||||||||||||||||||||||||||||||||||||||||||||||||||||||||||||||||||||
| Assessment season | Summer
Biomass: June-August, in the Bothnian Sea June-October CSA: EOs are accounted from 1st of June to 31st of August |
||||||||||||||||||||||||||||||||||||||||||||||||||||||||||||||||||||||||||||||||||||||||||||||||||||||||||||||||||||||||||||||||||||||||||||||||
| Depth | Surface
Biomass: integrated samples from 0 to up to 20 m (generally 0- 10 m), as described below CSA: the methodology accounts for the detection of both subsurface and surface blooms |
||||||||||||||||||||||||||||||||||||||||||||||||||||||||||||||||||||||||||||||||||||||||||||||||||||||||||||||||||||||||||||||||||||||||||||||||
| Removing outliers | On responsibility of data submitter | ||||||||||||||||||||||||||||||||||||||||||||||||||||||||||||||||||||||||||||||||||||||||||||||||||||||||||||||||||||||||||||||||||||||||||||||||
| Removing close observations | No close observations removed | ||||||||||||||||||||||||||||||||||||||||||||||||||||||||||||||||||||||||||||||||||||||||||||||||||||||||||||||||||||||||||||||||||||||||||||||||
| Indicator level (ES) | Defined using the two parameters : 1) Cyanobacterial surface accumulations (CSA) and 2) cyanobacterial biomass.
The final ES is the average of the annual estimates, which are defined as averages of the parameter specific ES estimates, normalized between 0-1, with values decreasing with increasing eutrophication. If only one parameter is available for an assessment unit, the ES value of that parameter is used as the indicator level. |
||||||||||||||||||||||||||||||||||||||||||||||||||||||||||||||||||||||||||||||||||||||||||||||||||||||||||||||||||||||||||||||||||||||||||||||||
| Eutrophication quality ratio (EQR) | The normalized estimates (0-1) are directly used as EQR values. The final EQR values are scaled after normalization to five classes of 0.2 width.
The class borders are given in table below
|
||||||||||||||||||||||||||||||||||||||||||||||||||||||||||||||||||||||||||||||||||||||||||||||||||||||||||||||||||||||||||||||||||||||||||||||||
| Indicator confidence | The confidence assessment for eutrophication indicators is included in HEAT, and includes aspects of temporal, spatial and accuracy confidence. The general methodology of the confidence assessment is described in Document 4.2 of IN-Eutrophication 16-2020 and updates are described in documents 4J-80 of State & Conservation 14-2021 and 4-2 of EG-EUTRO 20-2021. The R-code is available via https://github.com/ices-tools-prod/HEAT.
Confidence is calculated separately for each parameter. The overall indicator confidence is calculated using the average of the parameter specific values. The general HEAT confidence methodology was followed as such for the biomass parameter and with slight adjustments to fit the datatype for CSA, as described in Document 5J-27, appendix 3 for State & Conservation 17-2022. For each parameter, confidence is calculated as the average of the aspects of temporal, spatial and accuracy confidence, and the indicator confidence is the average of the data type specific confidence values. The evaluation criteria for temporal confidence are given in the table below.
If the specific temporal confidence is high (100) for at least half of the assessed years, it is set as high (100) for the assessment period. The total temporal confidence is the average of the general and specific temporal confidence aspects. The evaluation criteria for spatial confidence are given in the table below.
The accuracy aspect assesses the probability of the correct classification (classification being below or above the threshold for good status). The evaluation criteria for accuracy aspect are given in table below.
|
||||||||||||||||||||||||||||||||||||||||||||||||||||||||||||||||||||||||||||||||||||||||||||||||||||||||||||||||||||||||||||||||||||||||||||||||
Parameter 1: Cyanobacterial surface accumulations (CSA)
The main data source utilized by the indicator was satellite observation data derived from the daily algal bloom charts of the Finnish Environment Institute (SYKE). The bloom level is estimated utilizing atmospheric-corrected, satellite-observed reflectance signal at 560 nm wavelength (green light band). The method accounts for subsurface and surface blooms. The observations were interpreted to estimate the potentiality of surface algae accumulations in four classes: none (0), potential (1), likely (2), and evident (3). The spatial aggregation of daily Earth Observations (EO) from the assessment units was conducted by calculating an algae barometer value. The algae barometer (AB) value is a weighted sum of the proportion of positive algae observations in the different classes in an assessment area (Eq. 1; Rapala et al. 2012).
 where ntot is the total number of algae observations, and n#cl1, n#cl2, and n#cl3 are the number of algae observations in classes 1–3. By definition, AB is in the range of 0 to 3.
Seasonal bloom characteristics were estimated using an empirical cumulative distribution function (ECDF) drawn from seasonal observations of daily algae barometer values from each assessment area. The missing days were interpolated in the AB time series. ECDF gives the cumulative proportion of the seasonal algae barometer values. The bloom characteristics (i.e., the indicative variables of CSA) were defined for each assessment unit as follows: (1) seasonal volume, i.e., the areal coverage above the ECDF functions, (2) length of algal surface accumulation period, i.e., the fraction of the observation period with algae barometer values above bloom limit (taken as 0.5) on as many consecutive days as possible, and (3) bloom severity, i.e., the 90th percentile of the algae barometer observations. The CSA index time series was derived by taking an average from the normalized time series of the indicative variables and grouping all the three EO-based parameters together.
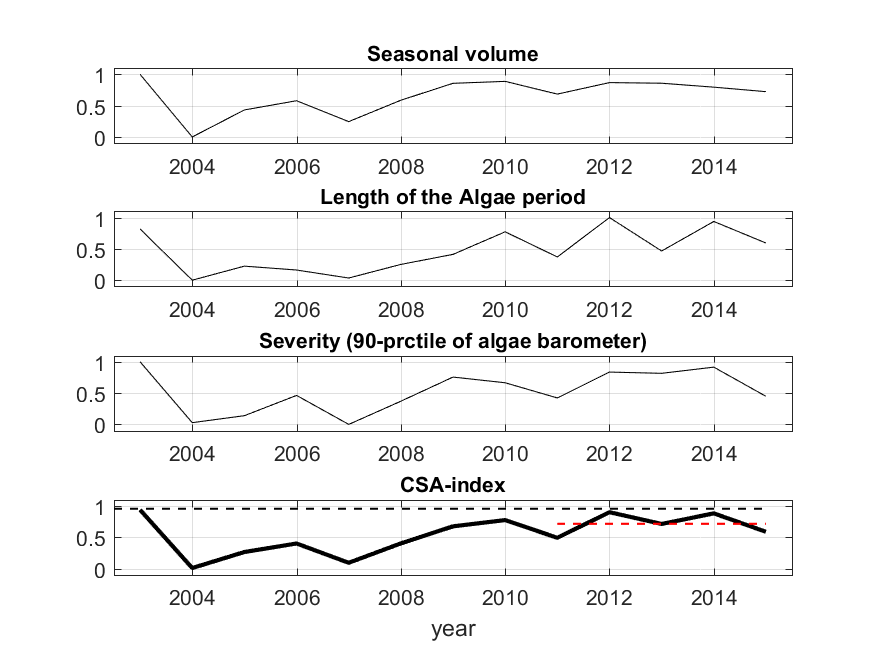
Figure 10. An example (Gulf of Finland) of grouping the normalized EO-based parameters (from top to bottom) (A) seasonal bloom volume, (B) length of bloom period and (C) Severity of blooms, and (D) a combined cyanobacterial surface accumulation (CSA) parameter. As the indicator responds negatively to increased eutrophication, 1 represents the best conditions and 0 the worst. Black dashed horizontal line indicates the parameter-specific target condition, and the red dashed line indicates the estimate for 2011-–2014.
Parameter 2: Cyanobacterial biomass
The annual cyanobacterial biomass values were calculated as described in Kownacka et al. 2022. In brief, cyanobacterial biomass was estimated from water samples using microscopy techniques. The data used in the indicator parameter originated from Danish, Estonian, Finnish, German, Latvian, Lithuanian, Polish and Swedish national monitoring data, and was collated by the HELCOM phytoplankton expert group (PEG), for the HELCOM Baltic Sea Environment Fact Sheet, which is updated annually (Kownacka et al. 2022). The main sampling locations are presented in Figure 11.
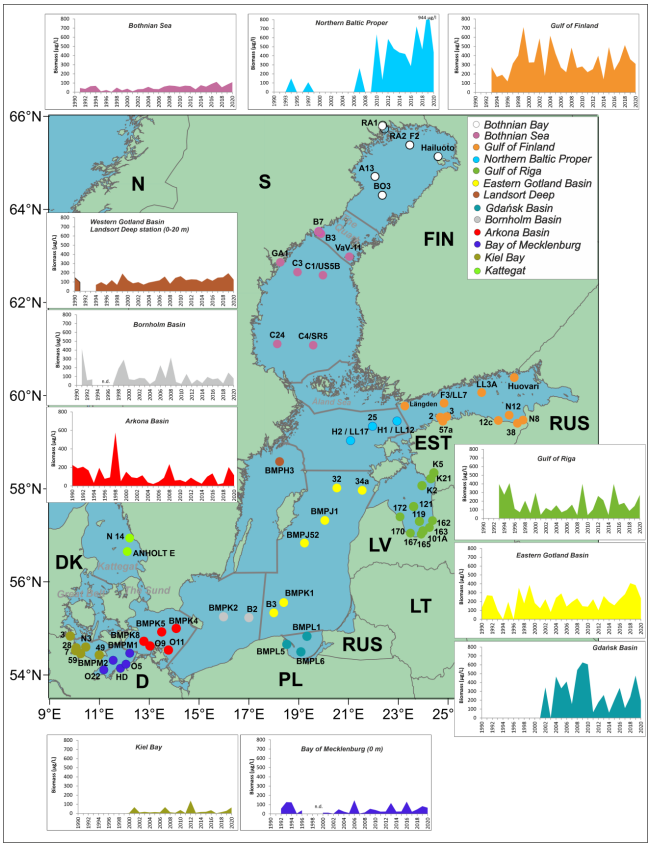
Figure 11. Map of the regularly sampled stations, containing assessment unit specific graphs on diazotrophic cyanobacteria biomass (seasonal mean biomass µg/L). Names of some Finnish coastal stations are abbreviated. Stations in Bothnian Bay and Kattegat have been tested but the results are not presented. Figure from: Kownacka et al. 2022.
The cyanobacterial biomass (wet weight in µg/L) was analyzed from integrated water samples (generally 0-10 m, with exceptions described in Kownacka et al. 2022). The biomass of the genera Nodularia, Aphanizomenon and Dolichospermum (previously Anabaena) was included in the parameter.
National monitoring samples were analyzed and identified by phytoplankton experts, following the HELCOM guidelines for monitoring phytoplankton species composition, abundance and biomass. Sampling frequency was variable and dependent on national monitoring cruises. At least one sample per month had to be available to allow the calculation of the seasonal average. Only in few exceptions data is presented despite missing data from one month out of three, as described in Kownacka et al. 2002.
Monthly means were first calculated for each assessment unit, and the seasonal means were then calculated as averages of the monthly values.
9.3 Monitoring and reporting requirements
Monitoring methodology
Monitoring of cyanobacteria in the Contracting Parties of HELCOM is described on a general level in the HELCOM Monitoring Manual in the sub-programme phytoplankton species composition, abundance and biomass.
Specific monitoring guidelines are under development with the aim to be included in the HELCOM Monitoring Manual at a later stage.
Current monitoring
The monitoring activities relevant to the indicator that are currently carried out by HELCOM Contracting Parties are described in the HELCOM Monitoring Manual Sub-programme sub-programme phytoplankton species composition, abundance and biomass.
The temporal and spatial coverage of the satellite remote sensing data used can be considered high in the open sea areas as well as in the outer coastal assessment areas of the Baltic Sea.
Cyanobacterial biomass monitoring takes place according to the national monitoring programmes.
Description of optimal monitoring
For remote sensing data, annually at least 30 daily spatial aggregates from valid bloom observations in an assessment area should be applied from the period between June 1st – August 30th in order to derive the annual bloom characteristics information. The compilation of observations is expected to be distributed spatially within the assessment unit in a non-biased way.
For biomass data, at least one sample per month has to be available to allow the calculation of seasonal averages.
10 Data
The data and resulting data products (e.g., tables, figures and maps) available on the indicator web page can be used freely given that it is used appropriately and the source is cited.
Result: Cyanobacterial bloom index
Data: Cyanobacterial bloom index
The Earth Observation (EO) data source was the daily surface algae interpretations of the Finnish Environment Institute (operative version of the algae bloom annual composites can be found in SYKE’s open EO-service TARKKA). The cyanobacteria biomass was collected and analysed by the HELCOM PEG group.
Geographical coverage:
- EO data collection took place over the bulk of the Baltic Sea from Danish straits up to the Quark (the narrow passage between Bothnian Sea and Bothnian Bay). EO data collection was systematic owing to the fixed satellite overpass tracks. During HOLAS 3, the method yielded 70 to 170 usable EOs for the average unit grid cell of an open sea assessment area (see Appendix 2 on CSA confidence), with a coefficient of variation in the range of 4 to 70 %.
- Cyanobacterial biomass was observed at HELCOM COMBINE stations situated in the Bay of Mecklenburg, Arkona Basin, Bornholm Basin, Eastern Gotland Basin, Western Gotland Basin, Northern Baltic Proper, Gulf of Riga, Gulf of Finland Western, Gulf of Finland Eastern and Bothnian Sea.
Temporal coverage:
- EOs yielded an algal barometer estimate for each basin of the Baltic Sea on 15 to 70 individual dates each year. Observations were only made in the date range 1 June to 31 August.
- The estimates are based on observations made between June – August for all covered assessment units, except for the Bothnian Sea, where observations were made between June – October. Estimates include observations made during 2016-2021.
Data aggregation:
- The 2016-2021 values for each sub-basin were estimated as an inter-annual summer (1st of June – 31st of August) averages.
11 Contributors
HELCOM Expert Group on Eutrophication and SYKE: Vivi Fleming and Laura Hoikkala.
SYKE: Sakari Väkevä, Jenni Attila.
EG Phyto and National Marine Fisheries Research Institute (NMFRI): Janina Kownacka.
HELCOM Secretariat: Laura Kaikkonen, Joni Kaitaranta, Theodor Hüttel.
12 Archive
This version of the HELCOM core indicator report was published in April 2023:
The current version of this indicator (including as a PDF) can be found on the HELCOM indicator web page.
Earlier versions of the core indicator report include:
Cyanobacterial bloom index HELCOM pre-core indicator 2018 (pdf)
HOLAS II component – Pre-core indicator report – web-based version July 2017 (pdf)
13 References
Andrén, E., Andrén, T. and Kunzendorf, H. 2000. Holocene history of the Baltic Sea as a background for assessing records of human impact in the sediments of the Gotland Basin. The Holocene 10, 687–702. https://doi.org/10.1191/09596830094944
Anttila S., Fleming-Lehtinen V., Attila J., Junttila S., Alasalmi H., Hällfors H., Kervinen M. and Koponen S. 2018. A novel earth observation based ecological indicator for cyanobacterial blooms. International Journal of Applied Earth Observation and Geoinformation 64: 145-155.
Bianchi, TS, Engelhaupt, E, Westman, P, Andrén, T, Rolff, C and Elmgren, R. 2000. Cyanobacterial blooms in the Baltic Sea: Natural or human-induced? Limnology and Oceanography 45:716-726.
DIRECTIVE 2000/60/EC OF THE EUROPEAN PARLIAMENT AND OF THE COUNCIL of 23 October 2000 establishing a framework for Community action in the field of water policy (Water Framework Directive). Official Journal of the European Union, L 327/2, 22.12.2000.
Directive 2008/56/EC of the European Parliament and the Council of 17 June 2008 establishing a framework for community action in the field of marine environmental policy (Marine Strategy Framework Directive). Official Journal of the European Union, L 164/19, 25.06.2008.
Engström, J, Koski, M, Viitasalo, M, Reinikainen, M, Repka, S and Sivonen, K. 2000. Feeding interactions of the copepods Eyrytemora affinis and Acartia bifilosa with the cyanobacteria Nodularia sp.
Finni, T., Kononen, K., Olsonen, R., Wallström, K., 2001. The history of cyanobacterial blooms in the Baltic Sea. Ambio 30, 172-178. Journal of Plankton Research 22:1403-1409.
HELCOM. 2021. “Baltic Sea Action Plan. 2021 Update.” https://helcom.fi/wp-content/uploads/2021/10/Baltic-Sea-Action-Plan-2021-update.pdf.
HELCOM. 2022. Assessment of sources of nutrient inputs to the Baltic Sea in 2017.” https://helcom.fi/wp-content/uploads/2022/12/PLC-7-Assessment-of-sources-of-nutrient-inputs-to-the-Baltic-Sea-in-2017.pdf
HELCOM. 2023a. Inputs of Nutrients to the Sub-Basins (2020). HELCOM Core Indicator Report. Online. 2023.
HELCOM 2023b. Harmful algal blooms – draft key messages on climate change impacts
HELCOM and Baltic Earth (2021) Climate Change in the Baltic Sea. 2021 Fact Sheet. Baltic Sea Environment Proceedings N°180. https://doi.org/ISSN: 0357-2994.
Hällfors H, Backer H, Leppänen J-M, Hällfors S, Hällfors G and Kuosa H. The northern Baltic Sea phytoplankton communities in 1903-1911 and 1993-2005: a comparison of historical and modern species data. 2013. Hydrobiologia DOI 10.1007/s10750-012-1414-4.
Kahru, M., Elmgren, R. 2014. Satellite detection of multi-decadal time series of cyanobacteria accumulations in the Baltic Sea. Biogeosciences Discussions, 11, 3319-3364.
Kahru M, Horstmann U and Rud O 1994. Satellite detection of increased cyanobacteria blooms in the Baltic Sea: natural fluctuation or ecosystem change? Ambio 23:469-472.
Kownacka, J., Busch, S., Göbel, J., Gromisz, S., Hällfors, H., Höglander, H., Huseby, S., Jaanus, A., Jakobsen, H.H., Johansen, M., Johansson, M., Jurgensone, I., Liebeke, N., Kobos, J., Kraśniewski, W., Kremp, A., Lehtinen, S., Olenina, I., v.Weber, M., Wasmund, N., 2022. Cyanobacteria biomass 1990-2020. HELCOM Baltic Sea Environment Fact Sheets 2021. Online. [14.10.2022], http://www.helcom.fi/baltic-sea-trends/environment-fact-sheets/eutrophication/cyanobacteria-biomass
Rapala, J, Kilponen, J, Järvinen, M, Lahti, K. 2012. Finland: guidelines for monitoring of cyanobacteria and their toxins. In Chorus, I. (ed.). Current approaches to Cyanotoxin risk assessment, risk management and regulations in different countries. Umweltbundesamt publications, 63: 54-62.
Rodionov, S. N. 2004. A sequential algorithm for testing climate regime shifts. Geophysical Research Letters, 31(9), L09204.
Sellner, KG, Olson, MM and Kononen, K, 1994. Copepod grazing in a summer cyanobacteria bloom in the Gulf of Finland. Hydrobiologia 292/293:249-254.
Sopanen, S, Uronen, P, Kuuppo, P, Svensen, C, Rühl, A, Tamminen, T, Granéli, E and Legrand, C, 2009. Transfer of nodularin to the copepod Eyrytemora affinis through the microbial food web. Aquat. Microb. Ecol. 55:115-130.
Struck, U., Emeis, K.-C. , Voss, M. , Christiansen, C. , Kunzendorf ,H. 2000. Records of southern and central Baltic Sea eutrophication in δ13C and δ15N of sedimentary organic matter. Marine Geology 164, 157-171. https://www.sciencedirect.com/science/article/pii/S0025322799001358
Suikkanen, S, Fistarol, GO and Granéli, E, 2004. Allelopathic effects of the Baltic cyanobacteria Nodularia spumigena, Aphanizomenon flos-aquae and Anabaena lemmermannii on algal monocultures. Journal of Experimental Marine Biology and Ecology 308:85-101.
Vahtera E, Conley DJ, Gustafsson BG, Kuosa H, Pitkänen H, Savchuk OP, Tamminen T, Viitasalo M, Voss M, Wasmund N, Wulff F, 2007. Internal ecosystem feedbacks enhance nitrogen-fixing cyanobacteria blooms and complicate management in the Baltic Sea. Ambio 36:186-194.
Wasmund N, Busch S, Göbel J, Gromisz S, Höglander H, Jaanus A, Johansen M, Jurgensone I, Karlsson C, Kownacka J, Kraśniewski W, Lehtinen S, Olenina I, v. Weber M, 2015. Cyanobacteria biomass. HELCOM Baltic Sea Environment Fact Sheet 2015, Published 18 September 2015. http://helcom.fi/baltic-sea-trends/environment-fact-sheets/eutrophication/cyanobacteria-biomass/
14 Other relevant resources
Annex 1. Confidence maps
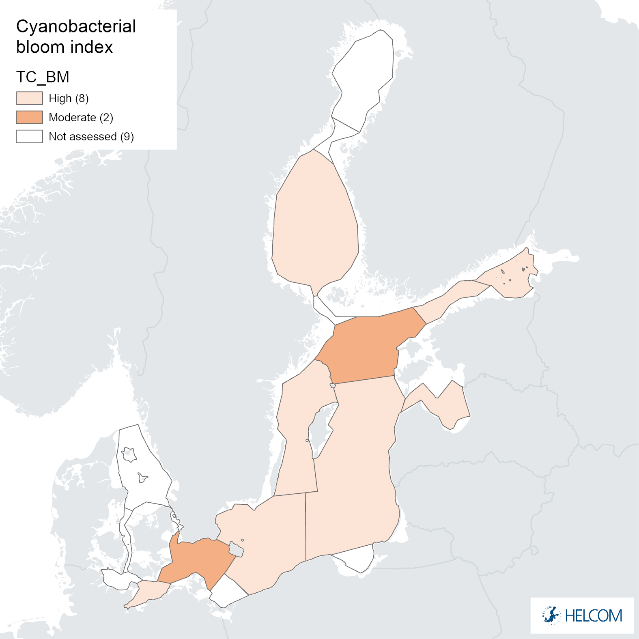
Annex figure 1. Confidence for biomass parameter of the cyanobacterial bloom index regarding Accuracy Class (ACC), Spatial Confidence (SC) and Temporal Confidence (TC). Low indicator confidence calls for increase in monitoring.
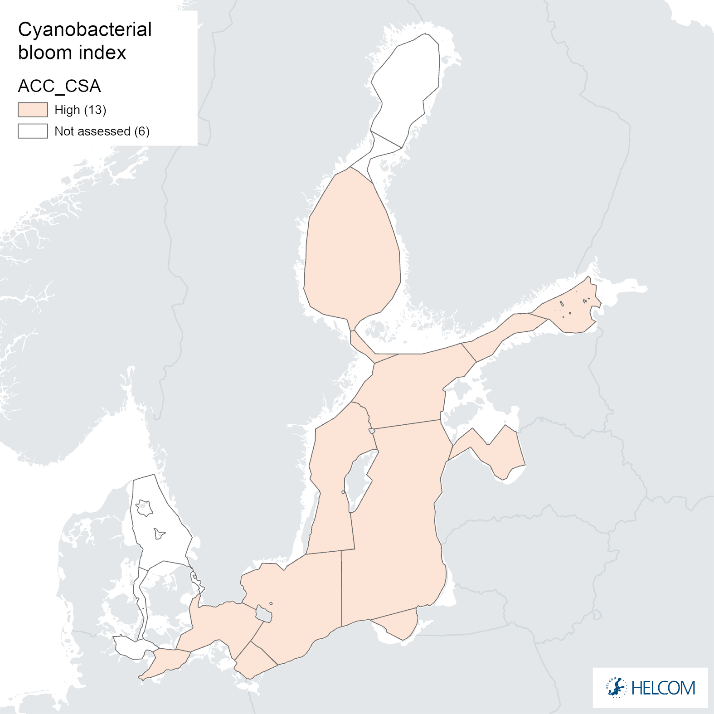
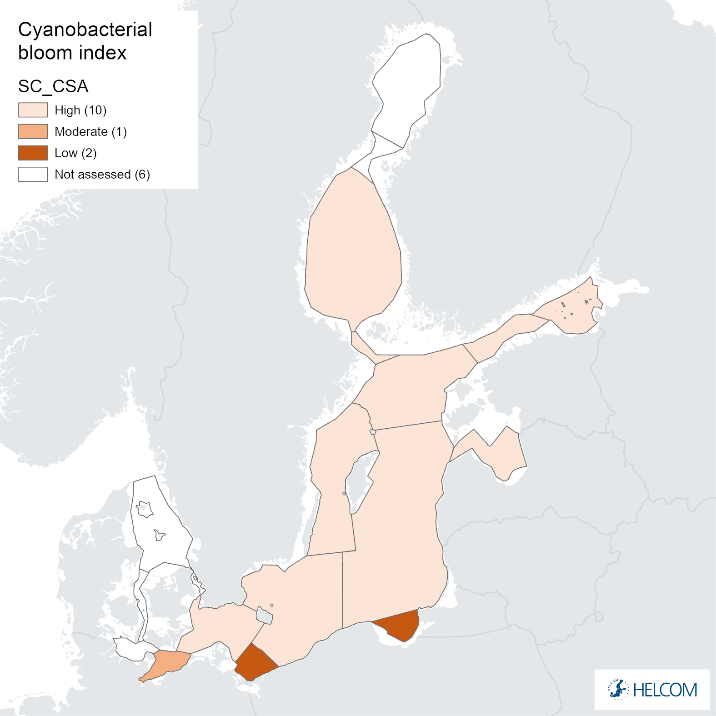
Annex figure 2. Confidence for CSA parameter of the cyanobacterial bloom index regarding Accuracy Class (ACC), Spatial Confidence (SC) and Temporal Confidence (TC).