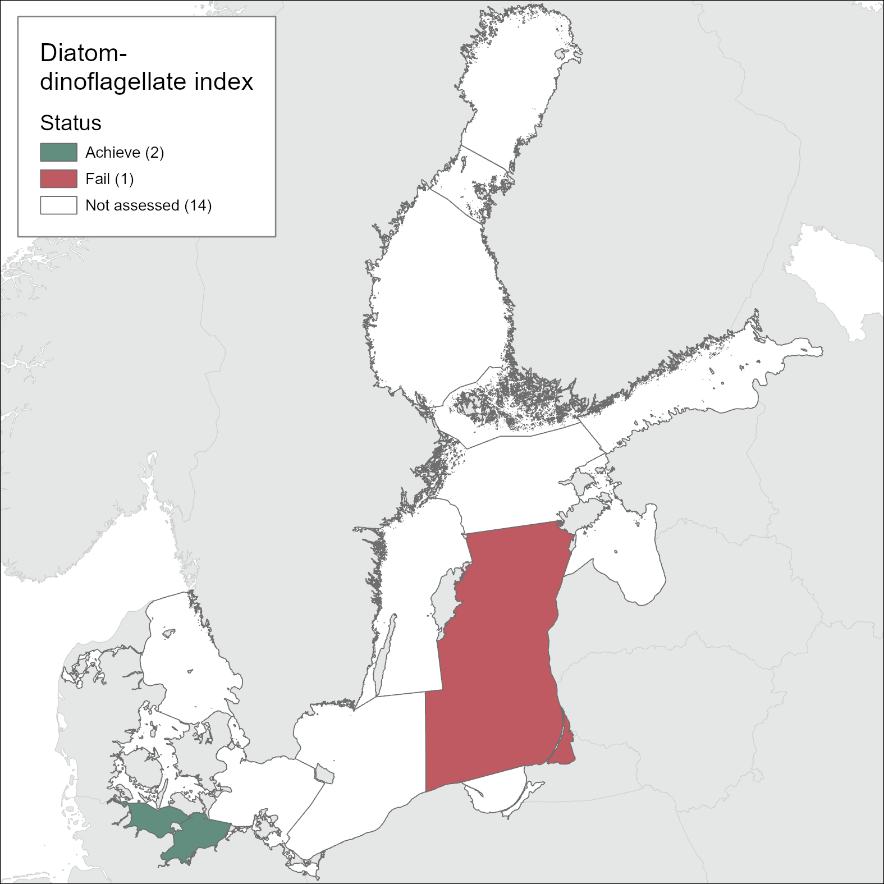
 Diatom/Dinoflagellate index
2 Relevance of the indicator
Phytoplankton are the key primary producers in marine ecosystems, and diatoms and dinoflagellates are dominating groups in spring. They play a decisive role as food for higher trophic levels. Shifts in the diatom/dinoflagellate ratio may have high relevance for the nutrition of zooplankton and the following trophic levels. They influence even the benthos as diatom blooms sink quickly down and contribute more food to zoobenthos than dinoflagellates, which stay longer in the water column. The Dia/Dino index is primarily a descriptive trend indicator for changes in the food web. Moreover, it may indicate silicate limitation which is an effect of eutrophication.
2.1 Ecological relevance
Phytoplankton are an important component of the food web in aquatic ecosystems and influence the global carbon cycle significantly (e.g. Smetacek 1999). Diatoms and dinoflagellates are the main components of the phytoplankton community not only in the Baltic Sea but also in the oceans. Their biomass can reach 6 g/m3 or more in the Baltic Proper.
Strong changes in the diatom/dinoflagellate ratio in spring blooms in the southern Baltic Proper were discovered by Wasmund et al. (1998) and identified by Alheit et al. (2005) as regime shifts. Such regime shifts are of high concern as they impact the whole food web. A dinoflagellate to diatom ratio has already been suggested “to reflect ecosystem state and the quality of the phytoplankton community as food for zooplankton” in the GES-REG project final report on food web indicators, September 2013 (Uusitalo et al. 2013, p.9).
The Dia/Dino Index may be used to indicate severe silicate limitation caused by eutrophication. Increased anthropogenic input of nitrogen and phosphorus may initiate the silica-depletion-sequence, where increased diatom production due to phosphorus enrichment reduces silica supplies to limiting levels (Schelske et al. 1983). However, the main use of the Dia/Dino Index is as a food web indicator.
The phytoplankton spring bloom does not only feed the pelagic food web but sinks partly to the bottom where it feeds the benthic food web. Diatoms, due to aggregation, are much more prone to sedimentation than dinoflagellates and therefore the main contributor of organic matter to the benthos (Heiskanen 1998). Thus, the Dia/Dino index may indicate whether the food substances stay primarily in the pelagic zone or are exported to the benthic zone. An indicator of the pathway of the food is of high interest for assessing the status of the environment.
2.2 Policy relevance
Assessments on the structure and functioning of the marine food web are requested by the HELCOM Baltic Sea Action Plan (BSAP 2021) and the MSFD. This indicator may be applied to the Marine Strategy Framework Directive (MSFD), primarily for descriptor 4 (Food web) and potentially also for descriptor 1 (pelagic habitats). As it deals with the principal pelagic food basis in spring, it establishes a link to the higher trophic levels both in the pelagic and the benthic communities. A type of diatom/dinoflagellate-ratio is already considered by OSPAR, as described in Chapter 4, Results and discussion.
This indicator may also contribute to descriptor 5 (Eutrophication) in the case of ongoing eutrophication that may lead to silicate limitation. It will react very sensitively to that limitation. Eutrophication is one of the thematic segments of the HELCOM Baltic Sea Action Plan (BSAP) with the strategic goal of having a Baltic Sea unaffected by eutrophication.
An overview of relevant policy aspects is provided in Table 1.
Table 1. Summary of applicable links and guidance from the HELCOM Baltic Sea Action Plan (BSAP) and Marine Strategy Framework Directive (MSFD).
| Baltic Sea Action Plan (BSAP) | Marine Strategy Framework Directive (MSFD) | |
| Fundamental link | Segment: Biodiversity
Goal: “Baltic Sea ecosystem is healthy and resilient”
|
Descriptor 4 Ecosystems, including food webs
|
| Complementary link | Segment: Biodiversity
Goal: “Baltic Sea ecosystem is healthy and resilient” Theme: Enabling ecosystem-based management
Topic: Indicators
|
Descriptor 4 Ecosystems, including food webs
Descriptor 1 Pelagic habitats
|
| Other relevant legislation: |
|
|
2.3 Relevance for other assessments
The Dia/Dino index is the only indicator that currently relates to the pathway of pelagic nutrients and biomass in the food web. Diatoms tend to sink quickly down after the bloom and feed the benthos whereas dinoflagellates stay in the pelagic zone for a longer time and contribute to the pelagic food web (see below). Changes in the Dia/Dino index indicate changes in the conditions for the nutrition of higher trophic levels. According to literature, a high Dia/Dino index indicates healthy benthic food webs in assessment units where benthic communities are dominated by filter- and suspension feeders (e.g., Kiel Bay and Bay of Mecklenburg), while implications of either dominance on status of deep basins (e.g., Eastern Gotland Basin) are more complex. While diatom dominance supports food supply to benthic fauna in well oxygenated shallow areas, the relationship is not straightforward in deeper areas of the central basins. As most of the biomass is decomposed by the benthic fauna, in shallow, well-mixed and well-oxygenated areas, oxygen consumption is enhanced only in the short-term. In deep, strongly stratified areas oxygen deficiency is increased by the oxygen demand of decaying phytoplankton blooms, enhancing bottom anoxia which prevents the flourishing of benthic communities.
3 Threshold values
The Working Group on Good Environmental Status (European Commission, 2015) recommended a common approach, based on the reference condition plus acceptable deviation, for determining environmental status. According to them, “reference state can be defined using a variety of methods, including historic conditions, based on various evidence about conditions before there was significant anthropogenic activity.”
The Dia/Dino index belongs to the few indicators that can be calculated already for the early 20th century when anthropogenic impact was low. Quantitative phytoplankton analyses date back to that time and were compiled by Wasmund (2017). The derivation of threshold values from historical data was explained by Wasmund et al. (2017). A deviation of 20% from the historical Dia/Dino index was allowed and therefore suggested as a threshold. In that paper, a threshold value for the Eastern Gotland Basin of 0.5 was suggested, which marks just the value of balanced (1:1) diatom and dinoflagellate biomass. Suggestions for thresholds values in other assessment units of the southern Baltic Sea were already made by Wasmund et al. (2016) and include threshold values for Kiel Bay and Bay of Mecklenburg of 0.75. A schematic representation of threshold value application is provided in Figure 2. These threshold values have already been accepted by HELCOM (2016, see Table 2) but will be reviewed after HOLAS 3.
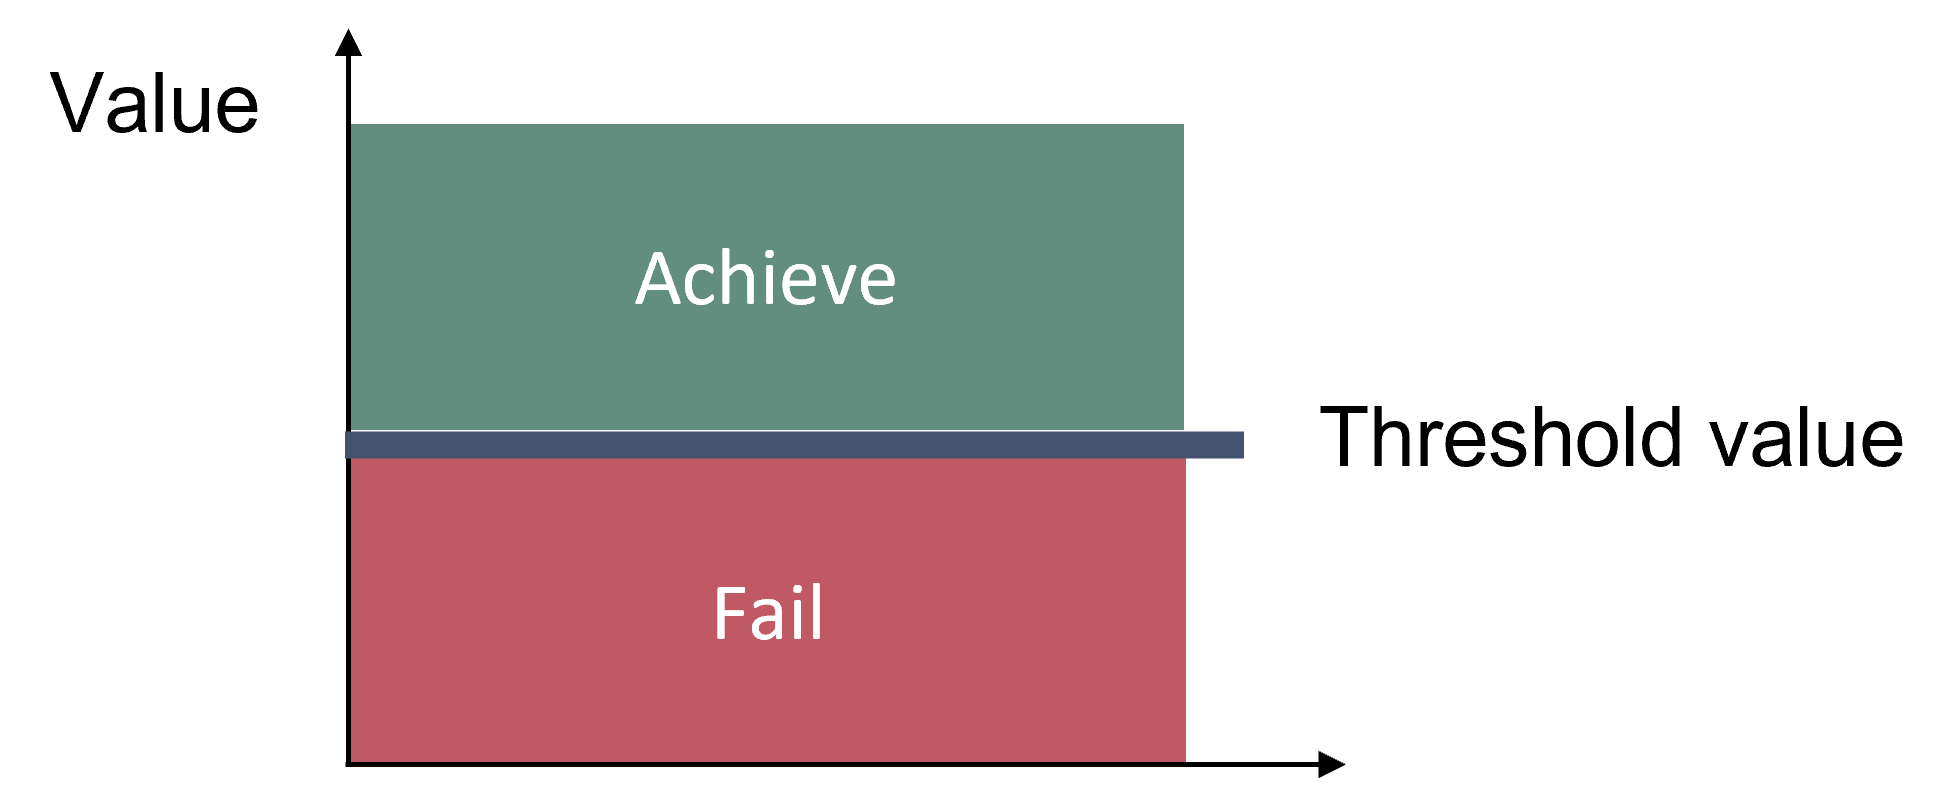
Figure 2. Schematic representation of the threshold value for the indictor “Dia/Dino index”, that is 0.5 in the Eastern Gotland Basin and 0.75 for Kiel Bay and Bay of Mecklenburg.
Table 2. Threshold value(s) for Dia/Dino Index according to Wasmund et al. (2016) and Wasmund et al. (2017).
| HELCOM Assessment unit name (and ID) | Threshold value (ratio) |
| Bay of Mecklenburg (SEA-005) | 0.75 |
| Kiel Bay (SEA-004) | 0.75 |
| Eastern Gotland Basin (SEA-009) | 0.50 |
3.1 Setting the threshold value(s)
While further approaches to substantiate threshold value setting are planned as part of future refinement of the Dia/Dino Index, the thresholds used in this evaluation were those set by Wasmund (2017) (see Chapter 9 Methodology). Historic data from the early 20th century, when anthropogenic impact in the Baltic Sea was still low, were analysed to calculate respective thresholds for each assessment unit as determined by HELCOM (2016). For the purpose of this evaluation, diatom dominance (i.e., standard Dia/Dino index > threshold) is considered as good status. Future GES determination will include geological proxies, which potentially allows to extend the historic data to include a pristine state of the Baltic Sea. Conducting eDNA based analyses of past phytoplankton communities is also planned in the next years: investigations of the international German-funded Leibniz research project PHYTOARK will be shared with HELCOM STATE & CONSERVATION Working Group as well as EG PHYTO.
The alternative Dia/Dino Index may be calculated if 1) the bloom was missed (samples < 1000 g/L) or 2) an unusually low Dia/Dino Index was calculated. The values of the alternative Dia/Dino Index are, however, much higher than those of the standard Dia/Dino Index. This is because the derivation of the threshold value for the alternative Dia/Dino Index is based on silicate minima and maxima. Accordingly, Wasmund et al. (2017) defined different GES thresholds, which were used in this evaluation.
4 Results and discussion
The results of the indicator evaluation that underlie the key message map and information are provided below.
4.1 Status evaluation
The evaluation is based on phytoplankton data from the spring period (February – April for Bay of Mecklenburg and Kiel Bay; March – May for Eastern Gotland Basin) from the upper mixed layer (0 – 10 m). Precondition for a valid calculation is a check whether the spring bloom is sufficiently represented in the data. The biomass of diatoms or dinoflagellates must exceed a threshold of 1000 µg/L at least once per season. If this is not achieved, the calculation of the alternative Dia/Dino index, based on silicate consumption, may be applied, as described by Wasmund et al. (2017). Each spring bloom of the assessment period (2016 – 2020) was represented sufficiently (Table 3).
Table 3. Maximum and mean biomass of diatoms and dinoflagellates in the years of the assessment period.
| Bay of Mecklenburg | ||||
| Year | Seasonal max Dia [ug/L] | Seasonal max Dino [ug/L] | Seasonal mean Dia [ug/L] | Seasonal mean Dino [ug/L] |
| 2016 | 2053.73 | 84.95 | 449.92 | 24.38 |
| 2017 | 1081.28 | 97.11 | 212.89 | 20.39 |
| 2018 | 2150.37 | 80.62 | 533 | 26.98 |
| 2019 | 1728.71 | 31.52 | 486.62 | 16.66 |
| 2020 | 1488.27 | 124.61 | 343.84 | 36.47 |
| Kiel Bay | ||||
| Year | Seasonal max Dia [ug/L] | Seasonal max Dino [ug/L] | Seasonal mean Dia [ug/L] | Seasonal mean Dino [ug/L] |
| 2016 | 2804.88 | 137.59 | 680.84 | 45.2 |
| 2017 | 5627.42 | 61.87 | 1155.85 | 11.96 |
| 2018 | 7065.55 | 173.11 | 1073.2 | 58.28 |
| 2019 | 6695.4 | 65.43 | 3107.23 | 32.04 |
| 2020 | 6608.19 | 172.1 | 2412.55 | 79.8 |
| Eastern Gotland Basin | ||||
| Year | Seasonal max Dia [ug/L] | Seasonal max Dino [ug/L] | Seasonal mean Dia [ug/L] | Seasonal mean Dino [ug/L] |
| 2016 | 1572.67 | 542.11 | 332.08 | 210.83 |
| 2017 | 561.75 | 1560.1 | 113.19 | 548.97 |
| 2018 | 1299.85 | 1359.6 | 329.55 | 486.18 |
| 2019 | 1047.2 | 1109.4 | 282.57 | 269.34 |
| 2020 | 1226.7 | 1085.15 | 381.45 | 400.26 |
Good status is defined at a Dia/Dino index > 0.75 for Bay of Mecklenburg and Kiel Bay and at > 0.5 for the Eastern Gotland Basin. It was achieved in each season of the assessment period in Bay of Mecklenburg and Kiel Bay, but failed in 2017, 2018, 2020, and in the total average over the assessment period for Eastern Gotland Basin. However, year 2017 did not provide enough data points to represent sufficient sampling (recommended 1 sample/week/season, i.e., 12 data points). The indices for 2019 and 2020 lie scarcely below and above the threshold value, respectively (Table 4).
Table 4. Dia/Dino index in Bay of Mecklenburg, Kiel Bay, and the Eastern Gotland Basin, separated for the years of the assessment period. Number of data points per season are given as “n”.
| Bay of Mecklenburg (GES = 0.75) | |||
| Year | n | Index | GES |
| 2016 | 15 | 0.95 | achieved |
| 2017 | 21 | 0.91 | achieved |
| 2018 | 20 | 0.95 | achieved |
| 2019 | 12 | 0.97 | achieved |
| 2020 | 17 | 0.90 | achieved |
| Average 2016 – 2020 | 17 | 0.94 | achieved |
| Kiel Bay (GES = 0.75) | |||
| Year | n | Index | GES |
| 2016 | 15 | 0.94 | achieved |
| 2017 | 19 | 0.99 | achieved |
| 2018 | 21 | 0.95 | achieved |
| 2019 | 20 | 0.99 | achieved |
| 2020 | 15 | 0.97 | achieved |
| Average 2016 – 2020 | 18 | 0.97 | achieved |
| Eastern Gotland Basin (GES = 0.50) | |||
| Year | n | Index | GES |
| 2016 | 24 | 0.61 | achieved |
| 2017 | 9 | 0.17 | failed |
| 2018 | 19 | 0.40 | failed |
| 2019 | 21 | 0.51 | achieved |
| 2020 | 25 | 0.49 | failed |
| Average 2016 – 2020 | 19.6 | 0.44 | failed |
4.2 Trends
Additional information on temporal trends
Temporal trends provide additional information on the spread and variability of the Dia/Dino index. The original data for each year from 1981 to 2020 is shown in Figure 3. It reveals a high variability of the indicator between basins. The spread over the entire potential range from 0 to 1 for the Eastern Gotland Basin indicates the high sensitivity of this indicator. If the spring bloom was missed by the routine sampling (i.e., biomass of diatoms or dinoflagellates was smaller than 1000 µg/L) and the standard indicator (red line) does not provide plausible results, the use of the alternative Dia/Dino index is necessary (green line). Generally, the threshold for the good status is higher in the alternative index (e.g., 0.94 for Bay of Mecklenburg and Kiel Bay, 0.84 for Eastern Gotland Basin compared to the standard index). In years of extreme outliers that failed the good status, the alternative Dia/Dino index may be checked. This applies, for example, to the year 1984 in the Eastern Gotland Basin and the year 1991 in Mecklenburg Bay, when the standard Dia/Dino index indicated a bad status whereas the status may be good according to the alternative Dia/Dino index. This effect is enhanced when (like in these two cases) preceding or succeeding values are missing. The alternative Dia/Dino index should only be used in exceptional and justified cases.
While generally, trends of the standard and alternative Dia/Dino Index are largely congruent, not all minima and maxima highlighted by the standard Dia/Dino Index are mirrored by the alternative index (Figure 3). As such, the alternative index remains above GES threshold more frequently than the standard Dia/Dino Index. For Bay of Mecklenburg, the alternative index varies between 1.00 and 0.91 with an extreme at 0.81. This is also found in the standard index (0.36) in addition to three other extremes (> 0.47) (Figure 3). For the Eastern Gotland Basin, the variability between 0.01 and 1.00 of the standard index is somewhat represented in the alternative index that peaks between 0.16 and 1.00; following a negative trend between 1988 and 2010 where GES (0.5 and 0.84) is reached only in two and eight cases, respectively (Results figure 1). The low standard index (0.17) from 2017, where insufficient samples (9 instead of 12) were analysed, is counteracted by an alternative index above GES (0.91). Generally, the alternative index in Eastern Gotland Basin shows a more positive (above GES) trend than the standard index. For Kiel Bay, the alternative index varies between 0.90 and 1.00, following twice below GES (0.94), whereas the standard index peaks at 0.81, thus not breaching GES (0.75) (Figure 3).
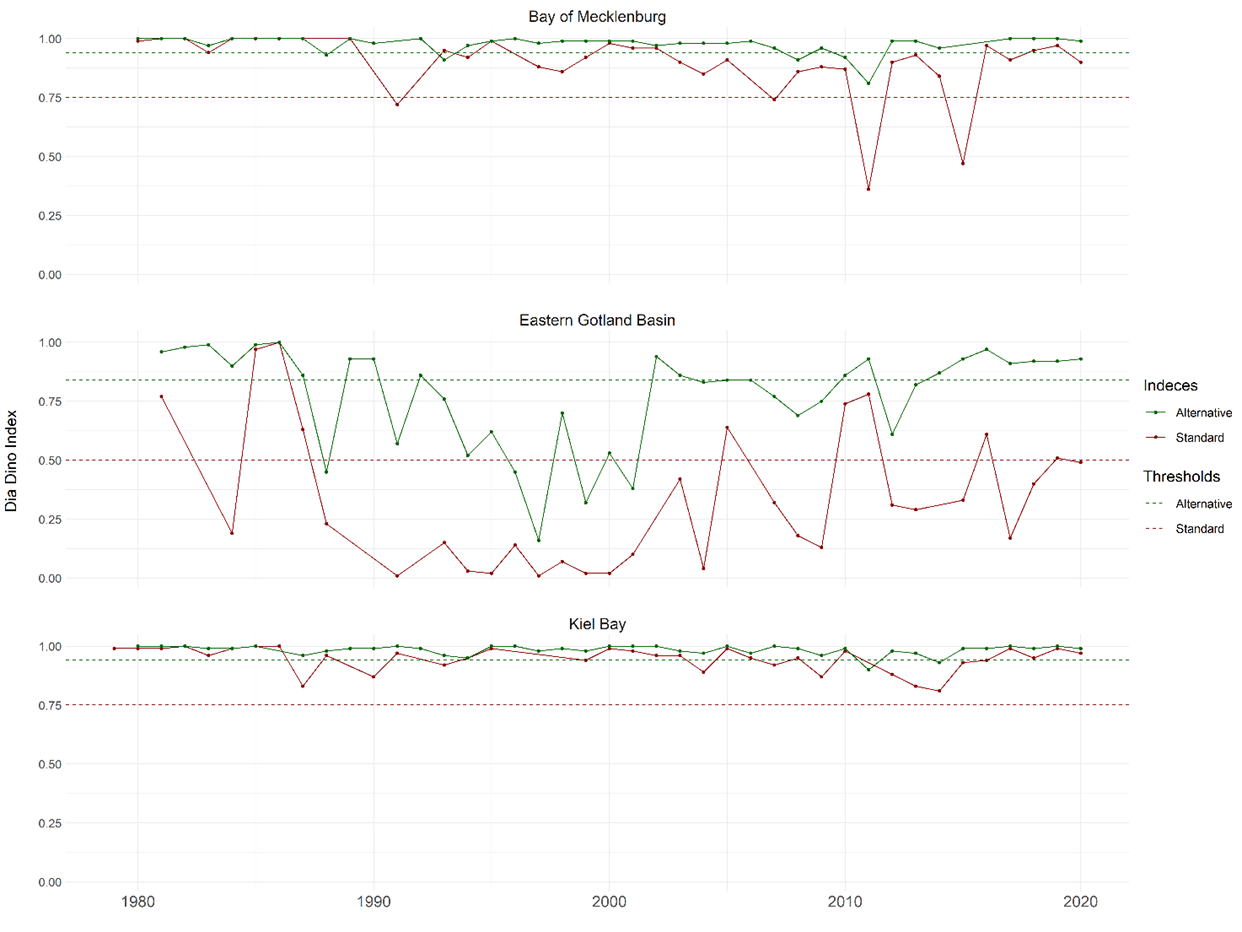
Figure 3. Annual values of the standard Dia/Dino index (red solid line) and the alternative Dia/Dino index (green solid line) from 1981 to 2020. Dashed lines indicate the standard (red) and alternative (green) thresholds for the good environmental status (GES).
For trend analyses, the curves may be smoothed, for example by using the 3-year moving average as shown in Figure 4. By this processing, the strong decline of diatom blooms in the Eastern Gotland Basin, as discovered by Wasmund et al. (1998), becomes obvious. After the very bad status in the 1990s concerning the diatom blooms (mostly < 0.10), cf. also Klais et al. 2011), the system recovered somewhat under high fluctuations (0.13 – 0.64) but did not reach GES (Figure 4). For Bay of Mecklenburg and Kiel Bay, the smoothing highlights a slight negative trend in the mid-2010s, where, while the indices declined, GES was mostly kept before recovering in the late 2010s (Figure 4).
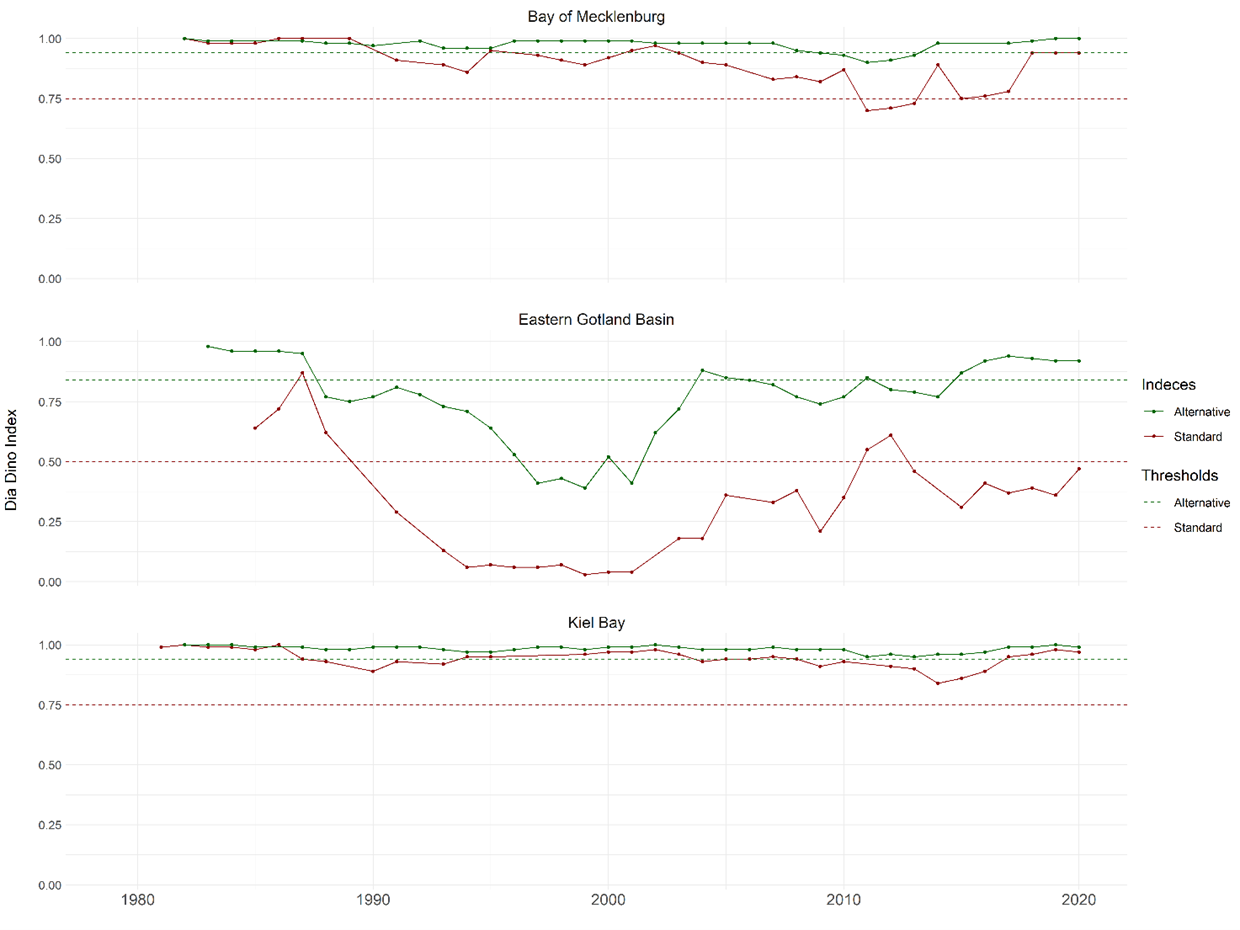
Figure 4. 3-year moving average of the standard Dia/Dino index (red solid line) and the alternative Dia/Dino index (green solid line) from 1981 to 2020. Dashed lines indicate the standard (red) and alternative (green) thresholds for the good environmental status (GES).
4.3 Discussion text
An overview of the status evaluation outcomes is provided below, including a comparison between the current and prior evaluation where relevant (Table 5).
Table 5. Overview of status evaluation and comparison between available assessment periods.
| HELCOM Assessment unit name (and ID) | Threshold value achieved/failed – HOLAS 3 | Threshold value achieved/failed – HOLAS 3 | Distinct trend between current and previous evaluation. | Description of outcomes, if pertinent. |
| Bay of Mecklenburg (SEA-005) | Not assessed | Overall achieved | NA | Assessment unit newly included in current HOLAS III assessment, thus no comparison to previous results possible. Good environmental status was achieved in each of the assessment years 2016 – 2020. Sampling frequency and timing was overall sufficient. Diatoms dominated dinoflagellates (overall index 0.94). |
| Kiel Bay (SEA-004) | Not assessed | Overall achieved | NA | Assessment unit newly included in current HOLAS III assessment, thus no comparison to previous results possible. Good environmental status was achieved each of the assessment years 2016 – 2020. Sampling frequency and timing was overall sufficient. Diatoms dominated dinoflagellates (overall index 0.97). |
| Eastern Gotland Basin (SEA-009) | Overall failed | Overall failed | Stable | Overall negative trend continues from previous assessment HOLAS II. In the last assessment, 2 out of 6 years failed GES, in this assessment 2 out of 5 years failed GES. Both years, similar average index ratios (0.46 and 0.44) were achieved, which did not reach GES. Compared to previous assessment, sampling timing was sufficient (i.e., spring bloom was sampled each year), however sampling frequency was not sufficient in year 2017 after removing outliers. |
5 Confidence
The indicator confidence depends on the data basis that underlies each evaluation and each assessment unit. The Dia/Dino index is based on data of the dominating phytoplankton groups, diatoms and dinoflagellates, that are more robust than those of rare phytoplankton groups. Moreover, these groups are easily to identify even without specific expert knowledge. This makes the original phytoplankton data robust.
The spring bloom was sufficiently represented during the assessment period from 2016 to 2020. The year 2021 was lacking data altogether, no data had been submitted to ICES for Bay of Mecklenburg and Kiel Bay, insufficient (5) data had been submitted for Eastern Gotland Basin. Hence, 2021 was not included in the evaluation. The number of data points in each of the years 2016 – 2020 is sufficient, except for Eastern Gotland Basin in 2017, where 9 instead of the recommended 12 data points were available for analysis (see Table 4). The standard Dia/Dino index can additionally be checked by an alternative method based on silicate data (Figure 3). As both methods result in the same evaluation for each year and show similar trends during the assessment period (Figure 4), the confidence of the evaluation is considered to be high.
6 Drivers, Activities, and Pressures
The indicator responds to human pressures (see Table 6) and changes in climate (see Chapter 7 Climate change and other factors).
Table 6. Brief summary of pressures and activities with relevance to the indicator.
| | General | MSFD Annex III, Table 2a |
| Strong link | Eutrophication by phosphorus and nitrogen leads to relative silicate shortage that may limit diatom growth and support unwanted flagellates. However, recently no Si limitation is expected. | Inputs of fertilisers and other nitrogen and phosphorus-rich substances (e.g. from point and diffuse sources, including agriculture, aquaculture, atmospheric deposition). |
| Weak link | The Dia/Dino index is related to the minimum winter temperature: mild winters inhibit diatoms. | Significant changes in thermal regime (e.g. by outfalls from power stations). |
7 Climate change and other factors
Mean sea surface temperature in the Baltic Sea is predicted to increase between 1.3 °C (RCP4.5) and 3.2 °C (RCP8.5) in spring by the end of this century (Meier et al. 2022). The resulting ongoing milder winter and spring temperatures are supposed to support dinoflagellates blooms and inhibit diatom bloom development. However, the direct relations are still not fully understood. Thus, potential effects on the Dia/Dino Index are not yet predictable and might depend strongly on regional conditions.
8 Conclusions
During the HOLAS 3 evaluation, the Dia/Dino Index was applied to the HELCOM assessment units Bay of Mecklenburg, Kiel Bay, and Eastern Gotland Basin to assess the GES. Previously set threshold were kept in place and applied to the spring bloom of upper layer waters in the years 2016 to 2020 following the method by Wasmund et al. (2017). Overall sampling frequency and timing was sufficient in all years and all assessment units except for Eastern Gotland Basin 2017, where data was available from 9 samples instead of the required 12 after removing outliers. After applying the Dia/Dino Index, GES was reached in Mecklenburg Bay (0.94) and Kiel Bay (0.97) and just missed in the Eastern Gotland Basin (0.44), continuing the trend discovered during the last evaluation, HOLAS II.
8.1 Future work or improvements needed
The Dia/Dino index reflects whether the spring bloom is dominated by diatoms or by dinoflagellates. The sampling schedule must ensure that the duration and magnitude of the spring bloom has been captured adequately. Weekly sampling would be optimal, resulting in 12 samples per station during spring. This number is reached for all assessment units in all years except for Eastern Gotland Basin in 2017 (Results table 2). However, sampling occasions are frequently clustered, leading to gaps despite a high number of samples. Therefore, samples must be evenly distributed over time and to be taken at different stations that are representative for the area. Also, samples from ships-of-opportunity and from research projects can be included if quantitatively analyzed according to the HELCOM Monitoring Manual. The contribution of data from all contracting parties is necessary to reach a sufficient data coverage and data availability for the individual basins will be assessed by evaluating national monitoring programs, focusing on whether the sampling frequency is sufficient to allow for plausible application of the Dia/Dino Index in each basin.
In terms of substantiating the threshold setting rationale, sediment archive studies and paleo-ecology approaches will be considered to further develop this indicator. Conducting eDNA based analyses of past phytoplankton communities is also planned in the next years. An analysis of the feeding preferences and causal relationships of the benthos and pelagic zone will allow to assess the proposition of the Dia/Dino Index in a practical framework in addition to comparing to historical thresholds.
Future work on this indicator could further aim on strengthening the rationale for the indicator, including demonstrating the link to anthropogenic pressures. Future work could also continue to develop the methodology of threshold setting.
9 Methodology
The analysis required for the indicator evaluation is that the biomass of planktonic diatoms is divided by the biomass of autotrophic (+ mixotrophic) dinoflagellates. In order to let this indicator range from 0 to 1, the ratio is calculated as follows:
![]()
The following conditions have to be fulfilled for the analysis to be valid:
- The data must be based on a representative sample of the upper mixed water layer (see Note 1)
- Only the autotrophic (inclusive mixotrophic) part of the pelagic community has to be included (see Note 2)
- The biomass has to be given in wet weight (see Note 3)
- Seasonal mean values have to be inserted into the formula (see Note 4)
- The Dia/Dino index refers only to the spring season (see Note 5)
- The spring biomass maxima of diatoms or dinoflagellates have to exceed a threshold (see Note 6)
Note 1: For practical reasons, a representative sample from the upper mixed layer irrespective of the sampling depth should be sufficient. Only in spring, the upper mixed layer is rather deep and comprises the whole euphotic (trophogenic) layer. Deep chlorophyll maxima, frequently formed by dinoflagellates, seem to rarely occur in spring. The influence of day-time is low, and thus the time of day need not be considered in the sampling guidelines.
Note 2: Diatoms are always considered as autotrophic, but dinoflagellates may also be mixotrophic or heterotrophic. The mode of nutrition is difficult to identify. Pigmented dinoflagellates are considered as autotrophs. Even the chloroplasts are sometimes hard to recognize. The bloom-forming dinoflagellates of the spring (Peridiniella catenata, Biecheleria baltica, Gymnodinium corollarium, Scrippsiella hangoei; cf. Klais et al. 2013) are autotrophs. A minor error in a few doubtful dinoflagellates will not affect the index.
Note 3: The biomass in the numerator and denominator has to be given in the same units. Wet weight or carbon units can be used, but as carbon data are frequently lacking in older data, wet weight is preferred. If carbon units are used the Dia/Dino index is skewed. As large diatoms have a big vacuole that contains only little organic carbon, the Dia/Dino index will be lower in comparison with that based on wet weight. However, especially in spring, when small diatoms dominate, the deviation is not as large as in other seasons and may be acceptable. When biovolume is used, data can be converted to wet weight based on a rough assumption of plasma density of 1 g cm-3 as follows (EN 16695):
1mm³ L-1 (biovolume) = 1cm³ m-3 (biovolume) = 1 mg L-1 (biomass wet weight) and
1 mm³ m-3 (biovolume) = 106 um³ L-1 (biovolume) = 1 ug L-1 (biomass wet weight).
Note 4: If sampling dates or numbers of samples are very irregularly distributed during the spring months, monthly means have to be calculated before seasonal means are calculated from the monthly means.
Note 5: The Dia/Dino index reflects the conditions during the spring bloom because this is the most prominent bloom in the annual cycle. The strongest effect of eutrophication (new nutrients) and global warming is expected in spring. Other arguments for using spring data are given in Note 3. Spring is defined as the period from March to May in the Baltic Proper and February to April in Kiel Bay and Bay of Mecklenburg.
Note 6: It has to be assured that the bloom was met. We suggest a biomass threshold of 1000 µg/L which has to be exceeded either by the diatoms or the dinoflagellates as a criterion. If this value is missed, the standard Dia/Dino index must not be calculated.
Note 7: Missing the diatom bloom may have two consequences: (1) The regular Dia/Dino index cannot be calculated because the threshold was missed (Note 6) or (2) the biomass threshold is just passed but the Dia/Dino index is unusually low nevertheless. In that case the diatom biomass can be calculated on the basis of silicate consumption as originally suggested by Wasmund et al. (2013). The resulting alternative Dia/Dino index is calculated as follows:
![]()
The alternative Dia/Dino index is normally higher than the standard Dia/Dino index because the silicate consumption estimates the maximal possible diatom biomass (cf. Results figure 1). Therefore, different good status values have to be derived.
9.1 Scale of assessment
For the purpose of the pre-core indicator, this assessment is made for Bay of Mecklenburg, Kiel Bay and the Eastern Gotland Basin.
9.2 Methodology applied
ICES DOME, the HELCOM and OSPAR contaminant and biological community abundance database was used to access phytoplankton data for the assessment. The data for the index calculation was assessed according to the notes in the Methodology section (above).
- Data were limited to spring (February to April) in Bay of Mecklenburg and Kiel Bay and spring (March to May) in the Eastern Gotland Basin
- Data were limited to the upper mixed layer (0 – 10 m)
- Data were limited to diatoms and dinoflagellates only, individual species were summed on the level of class, albeit heterotrophic dinoflagellates were excluded, only autotrophic, mixotrophic and auto-mixotrophic species were assessed
- All data were assessed as biomass wet weight (ug/L), any biovolume data were converted as outlined in Note 3 in Methodology section (above).
- To ensure the spring bloom was sufficiently sampled, the biomass data was compared against a threshold of 1000 ug/L
- Monthly means were calculated to avoid temporal skewness for all seasons in 2016 – 2020 before seasonal means were calculated which were used to calculate the index following the formula presented above.
- Outliers were defined as [Q1 – k(Q3 – Q1), Q3 + k(Q3 – Q1)], where Q1 = first quantile, Q3 = third quantile, and k = the nonnegative constant 1.5 following John Tukey and subsequently removed from the data.
9.3 Monitoring and reporting requirements
Monitoring methodology
Monitoring of phytoplankton biovolume according to the HELCOM Monitoring Manual.
Current monitoring
The monitoring activities relevant to the indicator, that are currently carried out by HELCOM Contracting Parties are described in the HELCOM Monitoring Manual in the programme topic: Phytoplankton. The methods for sampling, sample analysis and calculation of carbon biomass are described in the COMBINE manual. The COMBINE manual guidelines are under review for inclusion in the HELCOM Monitoring Manual. For this indicator, only samples from the upper mixed layer from spring are necessary. For the alternative Dia/Dino index, also silicate data are required.
These data are already taken in the running COMBINE monitoring. Also additional data from research projects can be included if the methods prescribed in the HELCOM Monitoring Manual are used. Unfortunately, the open sea monitoring activities of many countries have been reduced during the last years.
The indicator is operational as:
- A monitoring programme for getting the samples is established (HELCOM COMBINE)
- Samples are taken and processed according to guidelines (COMBINE manual)
- Data are delivered by experts belonging to the HELCOM Expert Group on Phytoplankton (EG PHYTO) and are therefore of high quality
- The data are regularly reported and stored in national and international data banks (ICES)
10 Data
The data and resulting data products (e.g. tables, figures and maps) available on the indicator web page can be used freely given that it is used appropriately and the source is cited.
Result: Diatom-Dinoflagellate index
Data: Diatom-Dinoflagellate index
Data source: The data of the HELCOM Contracting Parties are kept in the HELCOM COMBINE database, hosted by ICES (www.ices.dk), which contained sufficient data for the HOLAS 3 assessment period 2016 – 2020. The Bay of Mecklenburg and Kiel Bay were assessed based on data submitted by the German Bundesanstalt für Gewässerkunde (Federal Institute for Hydrology, BFGG). The Eastern Gotland Basin was assessed based on data submitted by the Swedish Meteorological and Hydrological Institute Västra Frölunda (SMHI), the Estonian Marine Institute (IMRE), the Polish Institute of Meteorology and Water Management (IMWP) and the Polish Regional Inspectorate of Environmental Protection Gdansk (GDPP), the Lithuanian Environmental Protection Agency, Department of Marine Research, Klaipeda (MRLT), and the Finnish Environment Institute Helsinki (SYKE).
For recent silicate data, the ICES DOME databank was utilised, were silicate data analysed between 1979 and 2021 is stored. This was combined with silicate data previously compiled by N. Wasmund from original data that was received from the contributors (see below).
Description of data: The basic data are phytoplankton biomass and biovolume data, determined as explained in the HELCOM COMBINE manual, originating from the depth of 0 – 10 m. Silicate data were used that were taken parallel to the phytoplankton sampling.
Temporal coverage: The assessment period comprised the years 2016 – 2020. From each year, spring data (February – April for Kiel Bay and Bay of Mecklenburg, March – May for Eastern Gotland Basin) were used. For silicate information, also data from one month prior to the respective spring season were considered.
Data aggregation: If original data were strongly skewed in temporal respect, monthly means were calculated first as a basis for seasonal means. The data from individual species was pooled by class and data from different stations were pooled by assessment unit.
Please note that, due to national database issues, Danish phytoplankton data are not included in this evaluation.
11 Contributors
Theda Hinrichs1, Carolin Paul2, Norbert Wasmund 2, Jeanette Göbel3, Andres Jaanus4, Marie Johansen 5, Janina Kownacka 6, Irina Olenina7
1AquaEcology, Germany
2 Leibniz Institute for Baltic Sea Research, Warnemünde, Germany (IOW)
3 Landesamt für Landwirtschaft, Umwelt und ländliche Räume (LLUR)
3 Estonian Marine Institute, University of Tartu, Estonia (EMI)
4 Swedish Meteorological and Hydrological Institute, Västra Frölunda, Sweden (SMHI)
5 National Marine Fisheries Research Institute, Gdynia, Poland (NMFRI)
6 Environmental Protection Agency, Department of Marine Research, Lithuania
HELCOM Secretariat: Jannica Haldin, Owen Rowe
12 Archive
This version of the HELCOM core indicator report was published in April 2023:
The current version of this indicator (including as a PDF) can be found on the HELCOM indicator web page.
Earlier versions of this indicator are available at:
HOLAS II component – pre-core indicator report – web-based version July 2017 (pdf)
Diatom-Dinoflagellate index HELCOM pre-core indicator 2018 (pdf)
13 References
Alheit,J., C. Möllmann, J. Dutz, G. Kornilovs, P. Loewe, V. Mohrholz and N. Wasmund (2005). Synchronous ecological regime shifts in the central Baltic and the North Sea in the late 1980s. ICES J. Mar. Sci. 62: 1205-1215.
European Commission (2015). Review of the GES Decision 2010/477/EU and MSFD Annex III – cross-cutting issues (version 4). GES_13-2015-02. Available online at: https://circabc.europa.eu/d/a/workspace/SpacesStore/53b2e4e2-2921-468a-941f-499811ee12f9/GES_13-2015-02_GESDecisionReview_Cross-cuttingIssues_v4.doc
Heiskanen, A.-S. (1998). Factors governing sedimentation and pelagic nutrient cycles in the northern Baltic Sea. Monographs of the Boreal Environmental Research 8, 1-80.
HELCOM (2016). Outcome of the fifth meeting of the Working Group on the State of the Environment and Nature Conservation (State & Conservation 5-2016). Available online at: https://portal.helcom.fi/meetings/STATE%20-%20CONSERVATION%205-2016-363/MeetingDocuments/Final%20Outcome%20State%20and%20Conservation%205-2016.pdf
Klais, R., T. Tamminen, A. Kremp, K. Spilling and K. Olli (2011). Decadal-Scale Changes of Dinoflagellates and Diatoms in the Anomalous Baltic Sea Spring Bloom. PLoS ONE 6(6): e21567. doi:10.1371/journal.pone.0021567
Klais, R., Tamminen, T., Kremp, A., Spilling, K., An, B.W., Hajdu, S., et al. (2013). Spring phytoplankton communities shaped by interannual weather variability and dispersal limitation: Mechanisms of climate change effects on key coastal primary producers. Limnol. Oceanogr. 58, 753-762.
Meier, H.E., Dieterich, C., Gröger, M., Dutheil, C., Börgel, F., Safonova, K., Christensen, O.B., Kjellström, E. (2022): Oceanographic regional climate projections for the Baltic Sea until 2100. Earth Syst. Dynam. 13, 159–199. https://doi.org/10.5194/esd-13-159-2022
Schelske, C. L., Stoermer, E. F., Conley, D. J., Robbins, J. A., & Glover, R. M. (1983). Early Eutrophication in the Lower Great Lakes: New Evidence from Biogenic Silica in Sediments. Science, 222, 320–322.
Smetacek, V. (1999): Diatoms and the ocean carbon cycle. Protist 150: 25-32. Uusitalo, L., H. Hällfors, H. Peltonen, M. Kiljunen, P. Jounela and E. Aro (2013). Indicators of the Good Environmental Status of food webs in the Baltic Sea, GES-REG project final report on food web indicators, September 2013.
Uusitalo, L., H. Hällfors, H. Peltonen, M. Kiljunen, P. Jounela and E. Aro (2013). Indicators of the Good Environmental Status of food webs in the Baltic Sea, GES-REG project final report on food web indicators, September 2013.
Wasmund, N., G. Nausch and W. Matthäus (1998): Phytoplankton spring blooms in the southern Baltic Sea – spatio-temporal development and long-term trends. J. Plankton Research 20: 1099-1117.
Wasmund, N., Nausch G. and Feistel, R. (2013): Silicate consumption: an indicator for long-term trends in spring diatom development in the Baltic Sea. Journal of Plankton Research 35: 393-406; doi: 10.1093/plankt/fbs101
Wasmund, N., Göbel, J., Jaanus, A., Johansen, M., Jurgensone, I., Kownacka, J., et al. (2016). “Pre-core indicator ‘Diatom-Dinoflagellate index’ – proposal to shift status to core indicator”. Document to the meeting of the HELCOM Working Group of the State of the Environment and Nature Conservation (STATE&CONSERVATION 5-2016), 7.-11.11.2016, Tallinn. Available online at: https://portal.helcom.fi/meetings/STATE%20-%20CONSERVATION%205-2016-363/MeetingDocuments/4J-6%20Pre-core%20indicator%20%E2%80%98Diatom-Dinoflagellate%20index%E2%80%99%20%E2%80%93%20proposal%20to%20shift%20status%20to%20core%20indicator.pdf
Wasmund, N., Kownacka, J., Göbel, J., Jaanus, A., Johansen, M., Jurgensone, I., Lehtinen, S., Powilleit, M. (2017): The diatom/dinoflagellate index as an indicator of ecosystem changes in the Baltic Sea. 1. Principle and handling instruction. Frontiers in Marine Science 4 (22): 1-13. doi: 10.3389/fmars.2017.00022
http://journal.frontiersin.org/article/10.3389/fmars.2017.00022/full?&utm_source=Email_to_authors_&utm_medium=Email&utm_content=T1_11.5e1_author&utm_campaign=Email_publication&field=&journalName=Frontiers_in_Marine_Science&id=235096
Wasmund, N. (2017): The diatom/dinoflagellate index as an indicator of ecosystem changes in the Baltic Sea. 2. Historical data for use in determination of good environmental status. Frontiers in Marine Science 4 (153): 1-12. doi: 10.3389/fmars.2017.00153 http://journal.frontiersin.org/article/10.3389/fmars.2017.00153/full?&utm_source=Email_to_authors_&utm_medium=Email&utm_content=T1_11.5e1_author&utm_campaign=Email_publication&field=&journalName=Frontiers_in_Marine_Science&id=247098
14 Other relevant resources
No additional information is currently required.