 Diclofenac
2 Relevance of the indicator
2.1 Ecological relevance
Pharmaceuticals represent a major group of substances of emerging concern. Diclofenac is widely used within the Baltic Sea Region (BSR). Basic information on diclofenac is presented in Table 1.
Table 1. General information on diclofenac.
| Common name | Diclofenac |
| Chemical name (IUPAC) | 2-[2-(2,6-dichloroanilino)phenyl]acetic acid |
| Chemical identifiers | CAS no. 15307-86-5
EC no. 239-348-5 |
| Molecular structure |  a) a) |
| Molecular formula | C₁₄H₁₁Cl₂NO₂ |
| Molecular weight | 296.1 b) |
| Water solubility | 2.37 mg/l at 25 °C b) |
| logKow | 4.51 b) |
- Chemspider
- PubChem
HELCOM (2022a) reported a detection frequency of 99% in effluent wastewaters from WWTPs located within the BSR. According to Unesco and HELCOM (2017) and Graumnitz and Jungman (2021) diclofenac is one of the active pharmaceutical ingredients (APIs) detected most commonly within the BSR in surface waters. Moreover, according to the UBA database on pharmaceuticals in the environment (UBA 2021), diclofenac is the API with the highest number of both database entries and positive detections in surface waters, reported from the Baltic Sea coastal countries. It has been detected in surface waters in all of the Baltic Sea coastal countries, and in 65 countries worldwide. Figure 2 shows the number of detections and database entries for the 20 APIs with the highest numbers of positive detections reported from Baltic Sea coastal countries, according to UBA 2021.
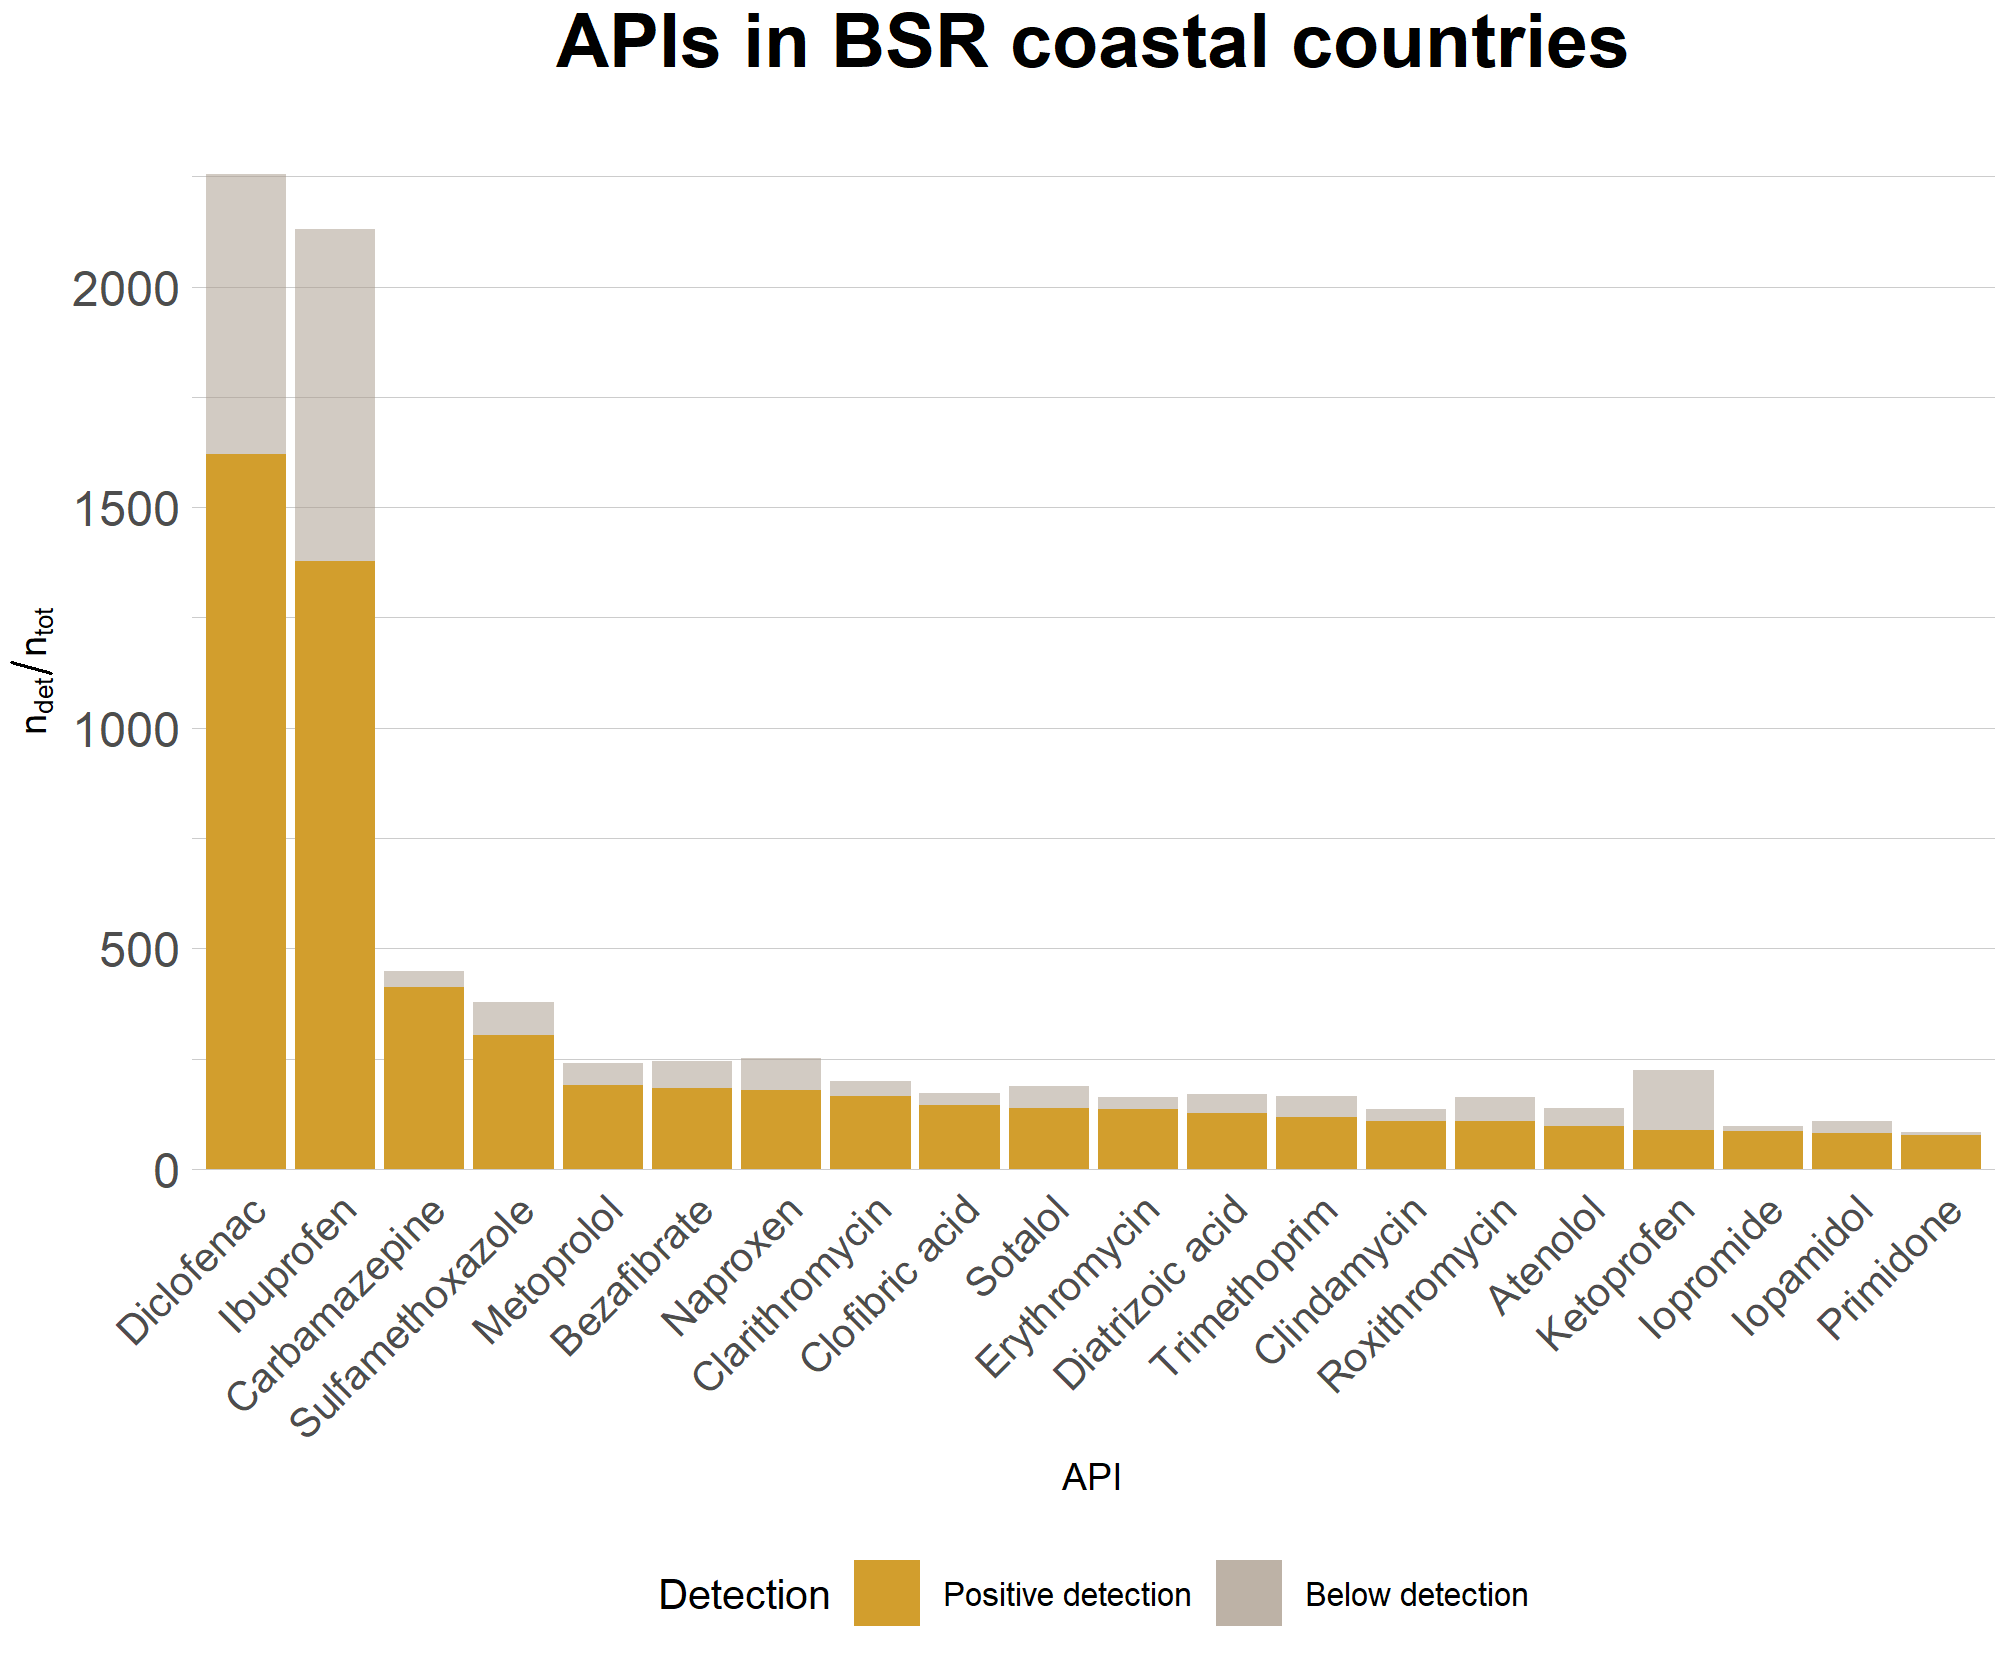
Figure 2. Different APIs and their detection frequencies in Baltic Sea coastal countries, as reported by UBA 2021.
Several predicted no-effect concentrations have been presented for Diclofenac in the literature. While e.g. Orias & Perrodin (2013) present PNEC-values of 0.020 µg/l, Fass.se presents a PNEC-value as high as 32 µg/l. However, the EQS-values, recently proposed by the European Commission (EC 2021) for diclofenac were 0.040 µg/l for freshwater and 0.0040 µg/l for marine water. Moreover, the proposed EQS values based on secondary poisoning of predators, were 1.16 µg/kg ww for biota, and 0.0054 µg/l for water.
The mean diclofenac concentration in WWTP effluents within the BSR was recently reported to be 2.5 µg/l (HELCOM 2022a). In a large scale estimate by Undeman et al (2022), a median of 0.56 µg/l was found in wastewater effluents in the BSR, with an estimated mass load of 1168 (589–1465) kg/year to the Baltic Sea (expressed as median (5% percentile-75% percentile)). According to UBA 2021 the mean detected concentration in surface waters in Baltic Sea coastal countries is 0.29 µg/l, while according to Unesco & HELCOM (2017), the mean detected concentration in Baltic Sea marine waters was 0.0030 µg/l, with individual values reaching over 0.050 µg/l. The mean concentration (0.0030 µg/l) in marine waters, reported by Unesco & HELCOM (2017) falls below the proposed EQS for marine waters (0.0040 µg/l). On the other hand, the previously reported concentrations in WWTP effluents exceed the proposed EQS-values by orders of magnitude. Consequently, WWTP effluents, and recipient waters can contain high concentrations of diclofenac.
Perhaps the best-known evidence of the detrimental effects of diclofenac stems from the terrestrial environment. Residues of diclofenac causing kidney failure is considered to be the main cause for a decline of >95 % in the population of oriental white-backed vulture, one of the (previously) most common raptors in India and Pakistan (Oaks et al. 2004). Toxicity to birds of prey has been utilized in estimating the concentrations in fish and water that will not result in secondary poisoning (EC 2021). In addition to elevated concentrations in wastewaters and surface waters, diclofenac has been detected in biota. E.g. Karlsson and Viktor (2014) reported concentrations as high as 38 µg/kg in perch bile fluid. Similarly, diclofenac has been detected in roach and rainbow trout biles and rainbow trout plasma (Brozinski et al. 2013; Lahti et al. 2012).
In the aquatic environment diclofenac has been shown to bioaccumulate in fish (e.g. Brown et al. 2007; Schwaiger et al. 2004; Brozinski et al. 2013), including diclofenac metabolites (Kallio et al. 2010), and mussels (Ericson et al. 2010). Toxic effects have also been recorded, including kidneys disruption (Schwaiger et al. 2004; Triebskorn et al. 2004; Hoeger et al. 2005), damage to eggs and embryos (Hallare et al. 2004), and altered gene expression (Cuklev et al. 2011). In crabs diclofenac has been shown to cause disruption of osmoregulation (Eades & Waring 2010) and in broadcast spawning marine invertebrates it may have consequences for reproductive success (Zanuri et al. 2017). In mussels diclofenac has been shown to have a number of impacts. Recently, Świacka et al. (2020) showed mussels exposed to diclofenac to exhibit histopathological changes. Early studies indicated that byssus strength (i.e. the ability to attach to substrates) was impaired and that energy was potentially diverted from growth and reproduction, with possible long term population effects (Ericson et al. 2010). Studies using biomarkers have shown a range of alterations indicative of oxidative stress, gill, and digestive gland damage, altered protein folding, impaired immunological response, and energy metabolism changes due to diclofenac or pollutant cocktail exposure (Schmidt et al. 2011; Schmidt et al. 2013, Turja et al. 2014; Gonzalez-Rey and Bebianno 2014; Turja et al. 2015, Mezzelani et al. 2016). It has also been shown that mussels from more pristine environments were more strongly influenced and that recovery time differed (Kumblad et al. 2015) and suggested that this biomarker approach may offer promise as an environmental status indicator component (Löf et al. 2016). Furthermore, in many cases these impacts were observed at environmentally relevant concentrations and in some systems in the environment itself.
While there is a consensus that acute toxicity caused by diclofenac appears unlikely, it has also been considered inappropriate to compare pharmaceutical concentrations to acute effect threshold values, since exposure to these substances is chronic (EC 2021). There is significant concern that long term exposure, continual discharges (e.g. from WWTPs), and local environmental factors may be key factors and that specific environmental zones or biological categories may be adversely influenced by diclofenac concentrations. Diclofenac has been shown to be susceptible to photo-degradation, though the process appears highly site-specific, and the breakdown compounds from this action may also be compounds of concern (Schmitt-Jansen et al. 2007). Furthermore, there is evidence to suggest that mixtures of several hazardous compounds, as is commonly found in the environment, can have markedly stronger negative impacts (Cleuvers 2004) and should be considered, particularly in the light of long-term exposure. Moreover, climate change alterations to the environment (e.g. ocean acidification) may influence the potency of diclofenac (Munari et al. 2016).
2.2 Policy relevance
The Moscow Ministerial Declaration 2010 gives HELCOM a clear obligation to ’further assess the environmentally negative impacts of pharmaceuticals and other substances that are not monitored regularly, with the aim as a first step to assess in a coordinated manner their occurrence in the Baltic Sea and evaluate their impacts on the Baltic biota’. The commitment was followed up by the 2013 HELCOM Ministerial Declaration in which the Contracting Parties agreed to collect information on pharmaceuticals and assess the status of contamination of pharmaceuticals and their degradation products in the marine environment. Furthermore, the Baltic Sea Action Plan (HELCOM 2021a) directed several actions to pharmaceuticals in the environment. These actions include e.g. developing guidance for environmental monitoring and analysis for indicator pharmaceuticals.
Diclofenac was included on the EU first watch list (2013/39/EU) with the aim being to gather monitoring data for the purpose of facilitating the determination of appropriate measures to address the risk posed by those substances. For those HELCOM Contracting Parties that are also EU members the inclusion on the first watch list required monitoring at selected representative monitoring stations for a 12-month period. The results from this work are summarised in Loos et al. 2018. The mean concentrations exceeded the PNEC-value of 0.050 µg/l, used by Loos et al. (2018).
The EU Water Framework Directive (WFD, 2000/60/EC) list of priority substances is currently under revision, with diclofenac being one of the candidate substances. The outcome of the revision process will determine future requirements for those HELCOM Contracting Parties that are also EU members.
The EU Urban Waste Water Treatment Directive (UWWTD, 91/271/EEC) is under revision. Pharmaceutical contamination is one of the issues looked into in the revision. The result of the revision may affect the requirements set by the UWWTD for those HELCOM contracting Parties that are also EU members.
Diclofenac sales are not restricted in the Baltic Sea Region. In many BSR countries, diclofenac in certain forms can only be purchased with a prescription. For instance, in Finland diclofenac can be purchased without a prescription only in topically applied gels. In Sweden all oral diclofenac preparations require a prescription due to their risk of adverse health effects. The policy relevance of the diclofenac pre core indicator is summarised in Table 2.
Table 2. Policy relevance of this specific HELCOM indicator.
| Baltic Sea Action Plan (BSAP) | Marine Strategy Framework Directive (MSFD) | |
| Fundamental link | Segment: Hazardous substances and litter goal
Goal: “Baltic Sea unaffected by hazardous substances and litter”
|
Descriptor 8 Concentrations of contaminants are at levels not giving rise to pollution effects.
|
| Complementary link | Descriptor 9 Contaminants in fish and other seafood for human consumption do not exceed levels established by Union legislation or other relevant standards.
(a) for contaminants listed in Regulation (EC) No 1881/2006, the maximum levels laid down in that Regulation, which are the threshold values for the purposes of this Decision; (b) for additional contaminants, not listed in Regulation (EC) No 1881/2006, threshold values, which Member States shall establish through
|
|
| Other relevant legislation: | For Contracting Parties that area also EU member states, the Water Framework Directive (WFD) (2000/60/EC) is relevant. Diclofenac was included on the first WFD watchlist ((EU) 2015/495). WFD priority substances are currently being revised, which may lead to diclofenac becoming a priority substance.
Diclofenac in the Baltic Sea also has clear links to SDGs 14 (Life below water) and 6 (Clean water and sanitation). |
|
2.3 Relevance for other assessments
The status of the Baltic Sea marine environment in terms of contamination by hazardous substances is assessed using several core indicators. These core indicators focus on contaminants with well-established knowledge base on their environmental impacts, often accompanied by long-standing monitoring activities. These core indicator contaminants include e.g. heavy metals (Pb, Cd and Hg), PAHs, PCBs and PCDD/Fs. Each of these indicators focuses on one important aspect of the complex issue, and are further used in producing an overall hazardous substances assessment.
As a pre-core indicator, this indicator will give an evaluation of the status of the Baltic Sea in terms of concentrations of diclofenac in the marine environment. In the future, this indicator may be suitable for incorporation into the overall hazardous substances assessment, integrated in conjunction with the other hazardous substances core indicators.
3 Threshold values
EC 2021 proposed annual average environmental quality standards (AA-EQSeco) of 0.040 µg/l (40 ng/l) and 0.0040 µg/l (4 ng/l) for fresh and salt water, respectively. A specific quality standard (EQSbiota,sec.pois) of 1.16 µg/kg was proposed for predator diet (i.e. biota). This value was further translated into a water concentration (EQSbiota,sec.pois) of 0.0054 µg/l (5.4 ng/l), which SCHEER (2022) considered the critical QS for freshwaters. EC (2021) concluded that as diclofenac does not seem to bind strongly to sediment particles, and sediment dwelling organisms have not been shown to be especially sensitive to diclofenac, no quality standard is proposed for sediment.
The Environmental Quality Standards proposed by the European Commission (EC 2021), as commented by SCHEER (2022) for diclofenac are proposed as the threshold levels for this indicator. Nevertheless, as the EQS derivation process is still a work in progress, the values presented in the final draft EQS dossier (EC 2021) may still change.
As shown in Figure 3, good status is achieved if the diclofenac concentrations are below the proposed threshold values. For datapoints where the concentration did not exceed the analytical limit, the status can only be evaluated if the analytical limit is below the threshold value. The proposed threshold values are presented in Table 3.
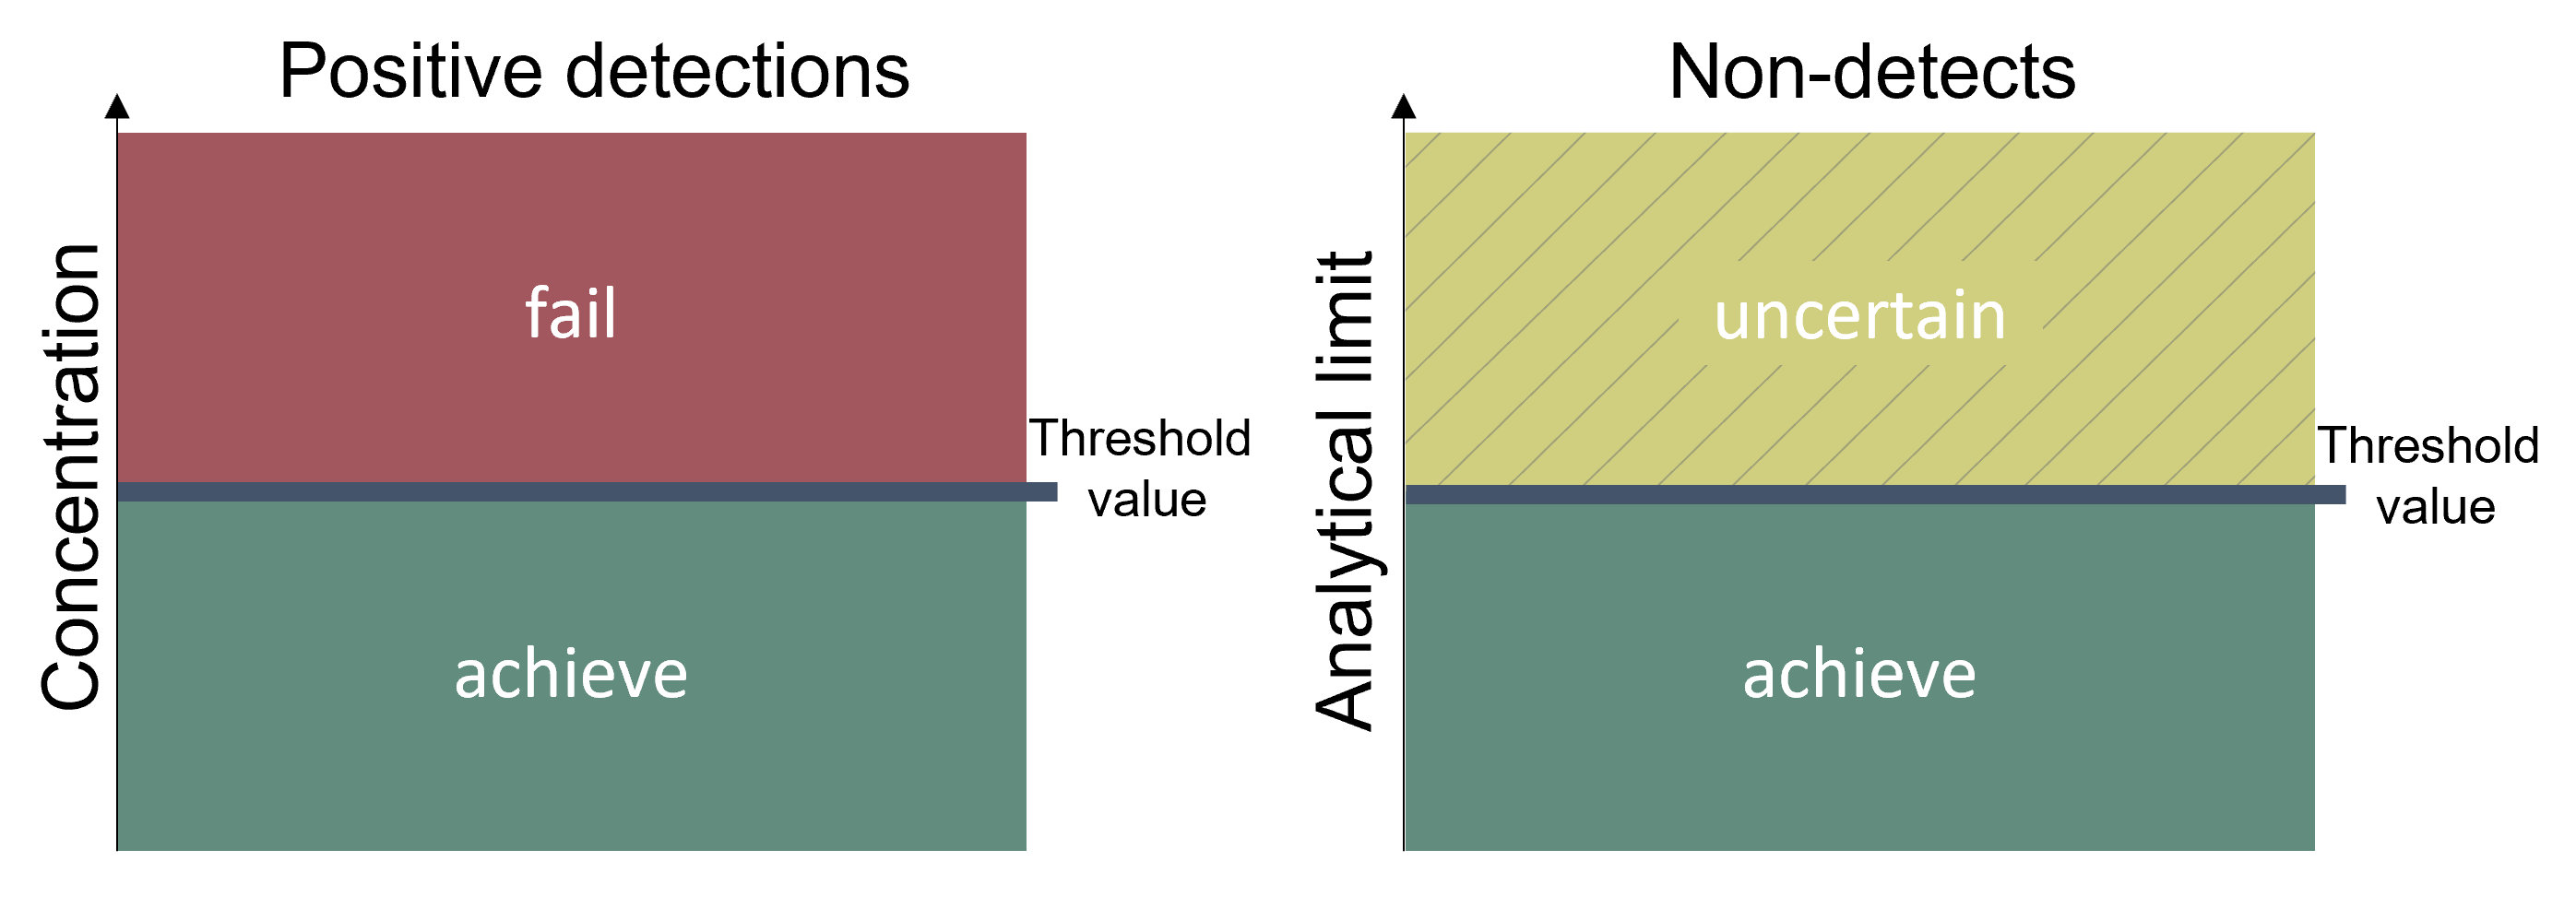
Figure 3. Good status is achieved if the concentrations of diclofenac are below the defined threshold values.
Table 3. Threshold values. Matrix-specific threshold values applied in this indicator. The indicator is evaluated using HELCOM assessment unit level 4.
| Matrix | Threshold value (Unit) |
| Marine water | 0.040 µg/l |
| Biota | 1.16 µg/kg ww |
3.1 Setting the threshold values
The EQS proposals, as suggested by EC 2021 are proposed here as threshold values for this indicator. The final draft EQS datasheet for diclofenac (EC 2021) was prepared in accordance with the EU WFD (2008/105/EC). The AA-EQSeco values for fresh and salt water presented in the draft EQS dossier were derived using data presented in a mesocosm study (Joachim et al. 2021) and an assessment factor of 5. The mesocosm study was carried out by exposing the bivalve Dreissena polymorpha to three different concentrations of diclofenac in test arrangements representing freshwater communities. The marine water quality standard (AA-EQSeco,sw) was derived from the freshwater value (AA-EQSeco,fw) by utilizing an additional assessment factor of 10.
The AA-EQSeco,fw proposal of 40 ng/l has been criticized by e.g. Leverett et al. 2021, who proposed an alternative value of 126 ng/l. On the other hand, the previously proposed EQS-value for fresh waters (50 ng/l, Loos et al. 2018) was well in line with the proposal by EC 2021. Moreover, the scientific opinion of the Scientific Committee on Health, Environmental and Emerging Risks (SCHEER 2022) supported the use of the EQS values proposed in EC 2021. However, SCHEER also identified the water quality standard derived based on secondary poisoning (EQSbiota,sec.pois., 5.4 ng/l) to be the critical one, when setting the overall EQS for freshwater.
The EQS for marine waters is derived based on toxicity to freshwater species. While there is no indication of sensitivity differing between freshwater and marine species, toxicity data for these species groups were combined in EC 2021, as suggested in the EQS derivation guideline (EC 2018). EC 2021 justified the use of the additional assessment factor (10) in deriving AA-EQSeco,sw with the higher species diversity in marine environments. The additional assessment factor aims to compensate for the potentially wider range of sensitivities in the higher number of species present in marine environments. The diversity of species present in the brackish water of the Baltic Sea might be relatively low compared to many other marine areas. Species richness and the number of functional attributes have been shown to decrease in the Baltic Sea with decreasing salinity gradient (Koehler et al. 2022; Zettler et al. 2014). Koehler et al. (2022) have suggested that functional redundancy in the Baltic Sea may decrease with decreasing salinity gradient. While the species richness in the Baltic Sea may be relatively low, the use of the additional assessment factor can still be considered justified in the Baltic Sea, since it results in a more conservative evaluation. Relevant aspects may be considered in future derivation of suitable threshold values.
The EQSbiota,sec.pois., as presented by EC 2021 was calculated by estimating a threshold value for vulture diet, below which adverse effects are not expected to take place. The proposed quality standard was first calculated per diet energy content, and further extrapolated to threshold concentrations in different food items. The assessment factor used in EQS derivation was 1,000, accounting for the extrapolation from LC50 to chronic toxicity, and from vultures to the ecosystem. The derived values ranged from 1.16 µg/kg for bivalves to 3.99 µg/kg for fish. EC (2021) highlighted, that the ecotoxicity data covers only few avian species, while many marine and inland water species are not covered.
4 Results and discussion
4.1 Status assessment
Good status was achieved in terms of diclofenac concentrations in marine waters in seven of the 39 evaluated assessment units and failed in 15. Due to high analytical limits, status was considered uncertain for 17 assessment units. The results for concentrations in marine water are presented in Figure 4. On the other hand, concentrations in biota achieved good status in 13 of the 23 evaluated assessment units and were uncertain in 10. However, information on concentrations in biota is very scarce, and the dataset did not contain a single positive detection. Concentrations in Baltic Sea biota are presented in Figure 5.
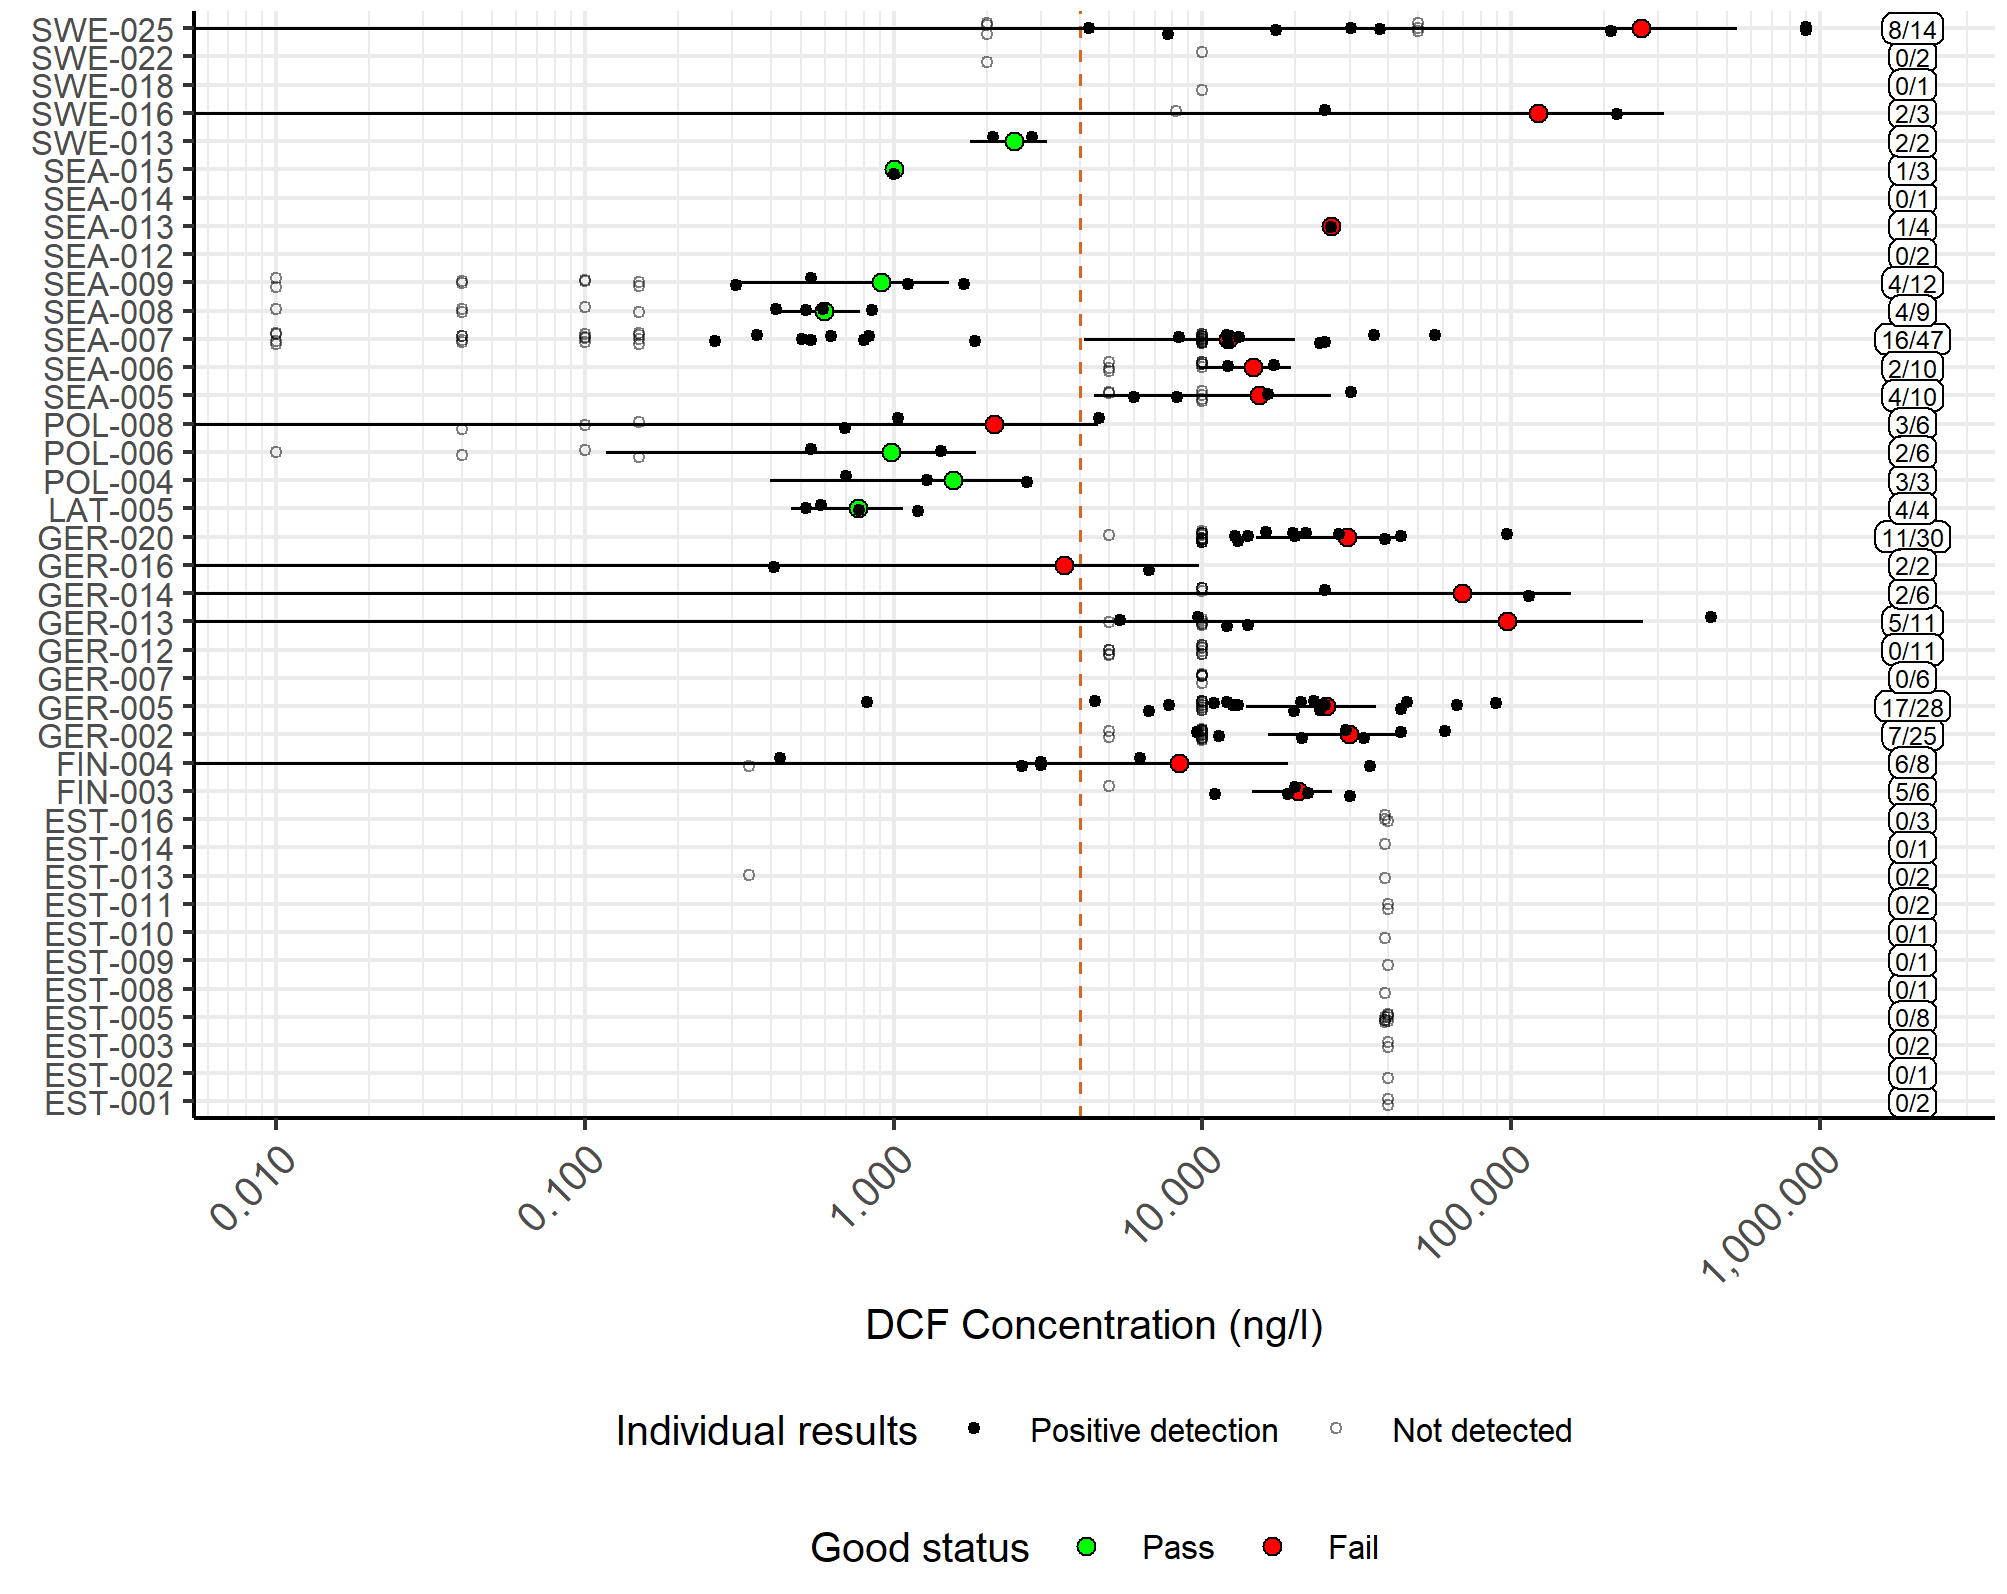
Figure 4.Concentrations of diclofenac in Baltic Sea water compared to the proposed threshold value. The filled circles represent a mean value for each assessment unit, while the whiskers show the 95% confidence interval, calculated from positive detections. Green colour indicates that the assessment unit achieves good status, while red shows fail. The red dashed line shows the proposed threshold value, while the labels on the right-hand side show the numbers of detections and samples.
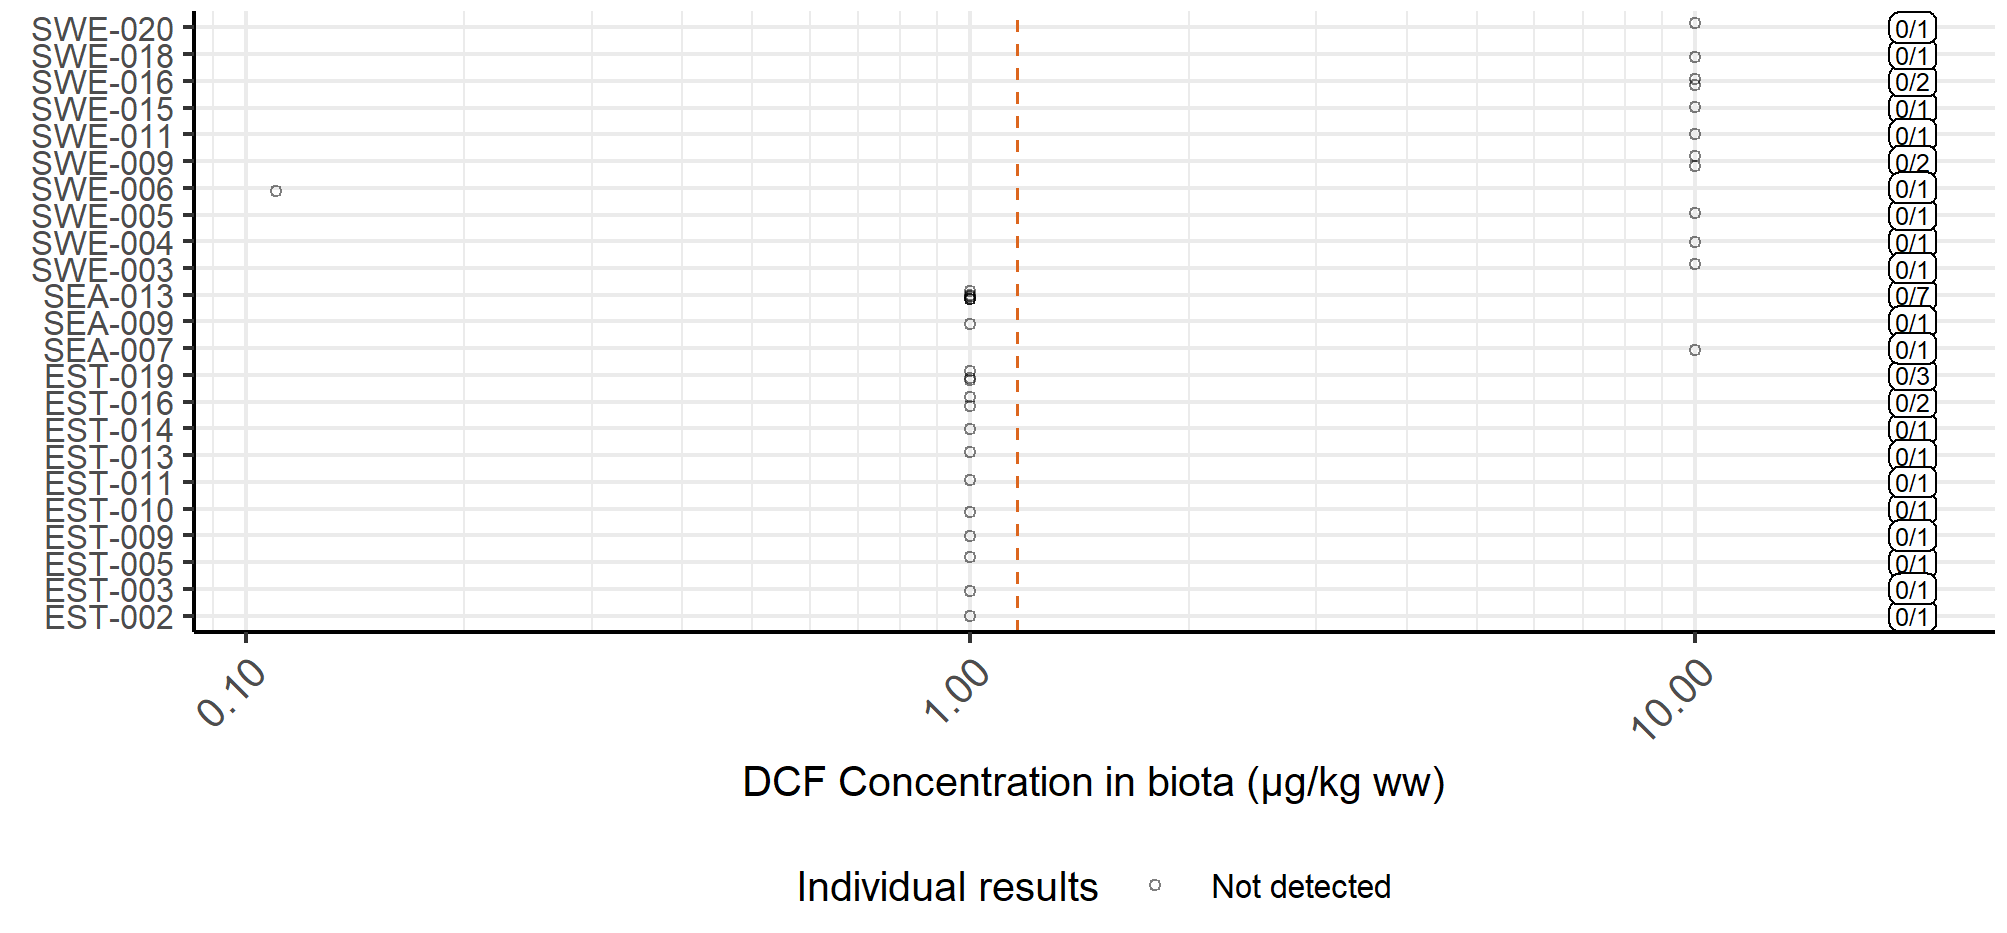
Figure 5. Concentrations of diclofenac in Baltic Sea biota. All datapoints were below the analytical limit. The red dashed line shows the proposed threshold value, while the labels on the right-hand side show the numbers of detections and samples.
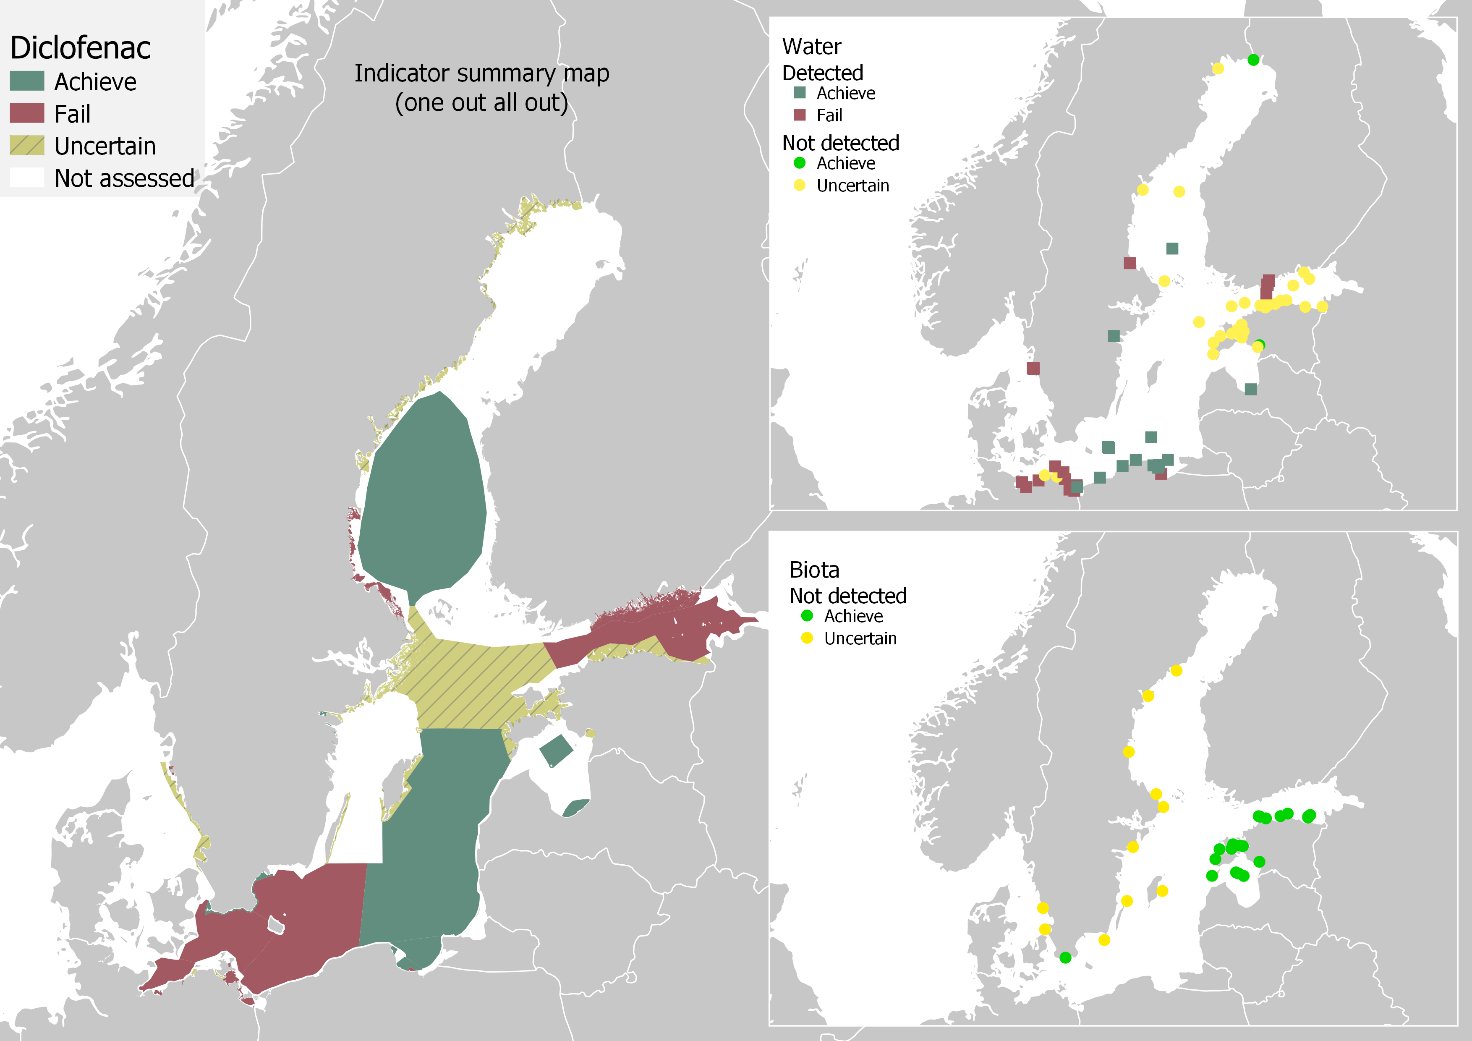
The results from water and biota comparisons were combined to produce an overall status evaluation, presented in Figure 6. Using a one-out-all-out approach (OOAO), altogether nine assessment units achieved good status, and 15 failed, while the status was uncertain for 22 assessment units. Achieving good status is failed in the coastal waters of Finland, Germany, Poland, and Sweden and in open sea areas at the Bay of Mecklenburg (SEA-005), Arkona basin (SEA-006), Bornholm basin (SEA-007), and Gulf of Finland (SEA-013). On the other hand, according to the available data, good status is achieved in certain coastal areas of Estonia, Latvia, Poland, and Sweden. Additionally, good status is achieved in open sea areas in the Gdansk basin (SEA-008), Eastern Gotland basin (SEA-009), and Bothnian Sea (SEA-015).

Figure 6. Status of the Baltic Sea, related to diclofenac, and data coverage for marine water and biota. Green colour indicates food status, which is reached when the upper 95 % confidence interval concentrations are below the threshold values. Brownish yellow indicates that status is uncertain, i.e. diclofenac has not been detected in at least one of the matrices, but the analytical limits are higher than the proposed threshold values.
4.2 Trends
The number of sampling sites in the Baltic Sea, for which concentrations were reported for multiple years is low. Thus, a confident trend estimation cannot be made based on the available data.
When grouping the data on water concentrations per sampling site, there are only four sampling locations with data available for more than three years, and with more than one sample per year. The trends for these sampling sites are presented in Figure 7.
For these sampling sites, an improving trend in the status of the Baltic Sea can be visualized. Nevertheless, as all four of the sampling sites presented in Figure 7 are located in the German coast, conclusions cannot be made for the entire Baltic Sea. Furthermore, a slightly opposite trend can be visualized for German inland waters (see Figure 14). For a more comprehensive trend estimation, more time series are required.
While time series on concentration data for diclofenac are scarce, sales statistics could be used as a proxy for estimating the occurrence in the environment.
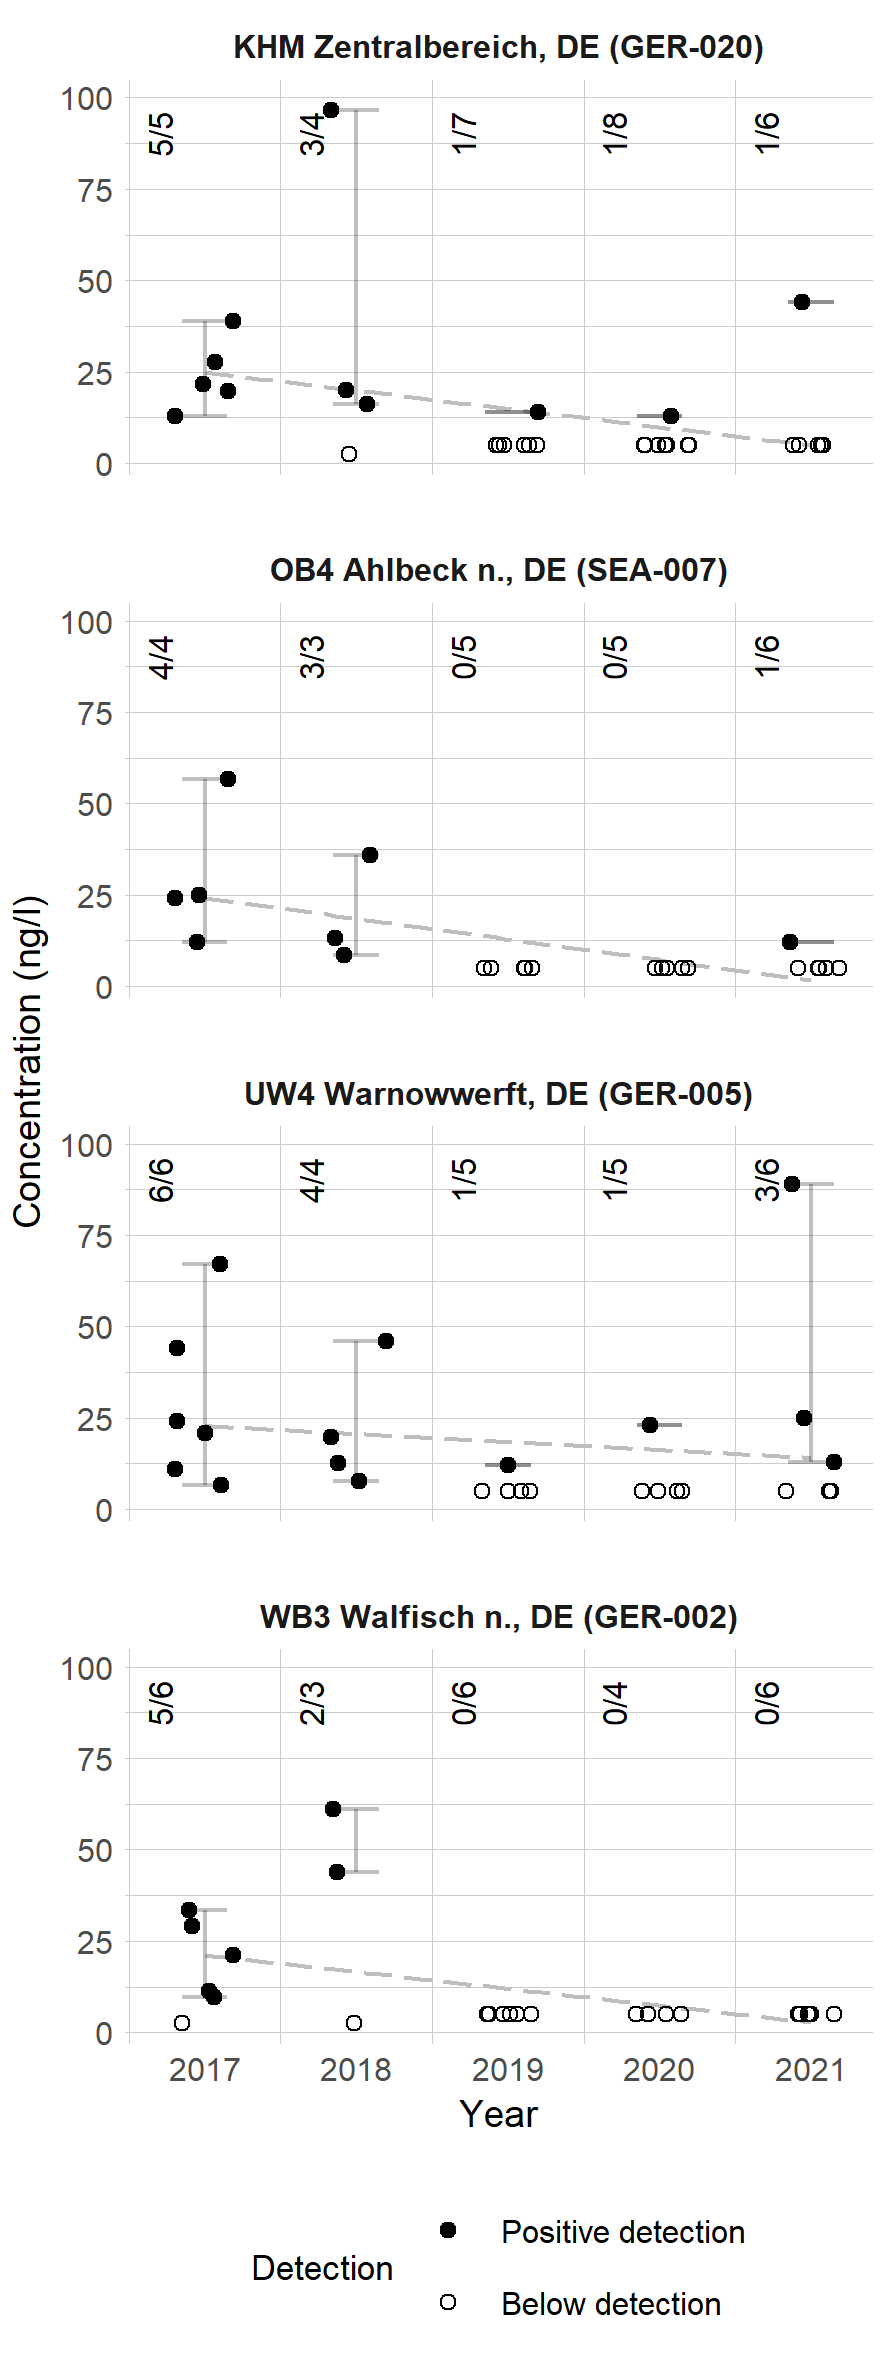
Figure 7. Diclofenac trends in four sampling sites in the Baltic Sea. The numbers in the upper corner present the numbers of detections and samples. The dashed line shows a linear trend estimated from the datapoints, while the whiskers show the range of detected concentrations. Results below the analytical limit were treated as half the analytical limit.
4.3 Discussion
The status of each assessment unit is presented in the Annex. The following subchapters present brief overviews on the data coverage for each individual Baltic Sea matrix.
Baltic Sea water
Data coverage varied greatly between assessment units, as shown in Figures 4 and 5. Similarly, the number of datapoints reported for each country varied greatly. The numbers of samples from sampling sites located in the Baltic Sea are presented in Table 4. The data coverage is not balanced. German datapoints covered over 40% of all datapoints, while concentrations in water accounted for over 80%.
Table 4. The numbers of samples and detections per country and matrix.
| Matrix | DE | EE | FI | LV | PL | SE |
|---|---|---|---|---|---|---|
| BS surface water | 58/162 | 0/24 | 13/24 | 4/4 | 24/60 | 12/22 |
| Biota | 0/0 | 0/21 | 0/0 | 0/0 | 0/0 | 0/13 |
| Sediments | 0/0 | 2/29 | 0/0 | 0/2 | 0/0 | 0/2 |
Sediments
Data on diclofenac concentrations in sediments is scarce. The dataset contained altogether 123 datapoints for sediments, 33 of which originated from sampling sites located within the Baltic Sea. Diclofenac was detected in altogether seven sediment samples from Estonia. The analytical limits in sediment samples ranged from 0.1 to 0.7 µg/kg dw. The sediment samples were taken at the same sites as water samples. Due to the low detection frequency, no correlation could be plotted between concentrations in water and sediments.
Biota
Data regarding concentrations of diclofenac in Baltic Sea biota is currently extremely limited. Literature has shown diclofenac to be present e.g. in fish bile (Brozinski et al. 2013; Karlsson & Viktor 2014). However, the dataset reported for this indicator evaluation contained only 34 measurements for biota, all originating from Estonia and Sweden. This data contained measurements from european perch (Perca fluvitilis), atlantic herring (Clupea harengus), blue mussel (Mytilus edulis x trossulus), and Baltic tellin (Macoma balthica). All datapoints were below the analytical limits, which ranged from 0.11 to 10 µg/kg.
The concentrations reported by Karlsson & Viktor (2014) reach values as high as 38 µg/kg, clearly exceeding the threshold value of 1.16 µg/kg. However, they focused on diclofenac concentration in fish bile. More data would be required for diclofenac concentrations in total fish, which would better represent the diet of e.g. predatory birds.
5 Confidence
The status evaluation presented here should be considered preliminary. Data availability varies greatly between assessment units, with most assessment units having less than ten datapoints available, decreasing the confidence of the evaluation. Nevertheless, the assessment units with the highest numbers of samples (SEA-007, GER-020 and GER-005), and therefore the most robust evaluation, fail good status.
Currently data on diclofenac are obtained from a limited number of monitoring observations and from screening studies. The data on Baltic Sea surface waters was reported to originate mainly from monitoring campaigns (85% of datapoints). Data was reported from most BS coastal countries, but data was available for only a small fraction of all the assessment units. Moreover, data availability is uneven between different countries and regions, and generally low. Greater spatial and temporal coverage is required from all compartments with relevance to this indicator, especially the concentrations of diclofenac in Baltic Sea water and biota. Furthermore, a high priority will be to focus the development of clear agreements regarding analytical methodologies to ensure the highest quality data can be obtained and that analytical limits do not prevent good status evaluation within marine environments downstream of source discharge points.
The results and confidence in the current indicator evaluation are thus considered as intermediate.
6 Drivers, Activities, and Pressures
The processes described below are considered to be relevant nodes in the transport pathway of diclofenac into the Baltic Sea environment. While this indicator document suggests threshold values to be used in assessing the current status of the Baltic Sea, the processes covered in the following sub-sections are important for assessing the development of diclofenac occurrence and may be worth considering when further developing the indicator. These components for example may show where drivers or activities are relevant in creating pressures and thus where measures may best be placed.
Pharmaceutical residues detected in the environment can originate e.g. from pharmaceutical usage, waste management and the pharmaceutical industry. Pharmaceutical usage and subsequent excretion are commonly considered the most important sources (e.g. EC 2019). Pharmaceutical residues from human use are widely discharged into recipient waters through wastewater treatment plants (WWTPs). Diclofenac enters WWTPs and is subsequently transferred to rivers and the marine environment, where biota can consequently be exposed.
6.1 Use & excretion
Diclofenac is an API belonging to a group often called nonsteroidal anti-inflammatory drugs (NSAIDs). It is widely used in the Baltic Sea region, especially in the forms of tablets to be ingested and as creams for topical application. Diclofenac classification according to the anatomical therapeutic chemical classification (ATC), is presented in Table 5.
Table 5. Classification of diclofenac, according to the ATC index (WHO 2021).
| ATC-level | ||||
| I | II | III | IV | V |
| D:
Dermatologicals |
D01:
Other dermatological preparations |
D01A:
Other dermatological preparations |
D01AX:
Other dermatologicals |
D01AX18:
Diclofenac |
| M:
Musculo-skeletal system |
M01:
Anti-inflammatory and antirheumatic products |
M01A:
Anti-inflammatory and antirheumatic proucts, non-steroids |
M01AB:
Acetic acid derivatives and related substances |
M01AB05:
Diclofenac |
| M01AB55:
Diclofenac, combinations |
||||
| M02:
Topical products for join and muscular pain |
M02A:
Topical products for join and muscular pain |
M02AA:
Anti-inflammatory preparations, non-steroids for topical use |
M02AA15:
Diclofenac |
|
| S:
Sensory organs |
S01:
Ophthalmologicals |
S01B:
Anti-inflammatory agents |
S01BC:
Anti-inflammatory agents, non-steroids |
S01BC03:
Diclofenac |
| S01C:
Anti-inflamatory gents and anti-infectives in combination |
S01CC:
Anti-inflammatory agents, non-steroids and anti-infectives in combination |
S01CC01:
Diclofenac and anti-infectives |
||
As diclofenac is emitted into the environment mainly from its intended use as a human pharmaceutical, sales statistics can give valuable insight into its occurrence in the environment and be used as a proxy to assess its trends. Diclofenac sales statistics have been compiled e.g. in projects CWPharma (Ek Henning et al. 2020), MORPHEUS (Kaiser et al. 2019) and BASE (HELCOM 2014). The sales estimates have ranged from 0.44 mg/person/day in Denmark to 3.1 mg/person/day in Estonia (Ek Henning et al. 2020). However, data availability and its reliability vary greatly between BSR countries.
In the HELCOM BASE pilot project sales statistics were collected for Russia. Calculations were made to estimate the total usage of diclofenac in the St. Petersburg region (HELCOM 2014). Based on the survey, the consumption of pharmaceutical preparations containing diclofenac in the St. Petersburg area was estimated to be 700 kg/year, with topical products accounting for 170 kg. If all the diclofenac were to enter the sewage system, the concentrations could reach 850 ng/l (HELCOM 2014).
In several countries, pharmaceutical sales are reported annually in defined daily doses (DDDs). Pharmaceutical sales reported in this format give the number of sold doses. These statistics are useful especially in comparing years or regions between another. Information on diclofenac sales in DDDs was previously compiled by Undeman 2020. According to the statistics, diclofenac sales had been declining for the last several years. However, as Undeman (2020) and Ek Henning et al. (2020) pointed out, pharmaceutical sales in DDDs may not cover all sales. This is true for diclofenac. As shown in Table 5, diclofenac use is divided into several ATC groups. DDDs have been defined for only M01AB05 and M01AB55. Thus, sales in other ATC groups are often not included into sales statistic in DDDs.
To the author’s knowledge, Denmark is currently the only BSR country with comprehensive sales statistics being publicly available on an annual basis. In Denmark, sales statistics can be accessed through the medstat.dk website, where they can be downloaded e.g. in DDDs or in sold packages, accompanied with comprehensive background information on each package type. Figure 8 shows diclofenac sales in Denmark in between 1997 and 2020. The graph presents sales in both DDDs and in mass units. The sales in DDDs show a clear downward trend for the past 15 years. However, these numbers do not cover sales e.g. in topically used products. In 2020 the sales in of the ATC codes (M01AB05 and M01AB55) with DDDs accounted for only 28% of total sales, with the remaining 72% being sold mainly in topical products (i.e. M02AA15). Similarly, Äystö et al. (2020) estimated topical products to account for 65% of diclofenac sales in Finland, and Undeman (2020) reported similar statistics for Sweden.
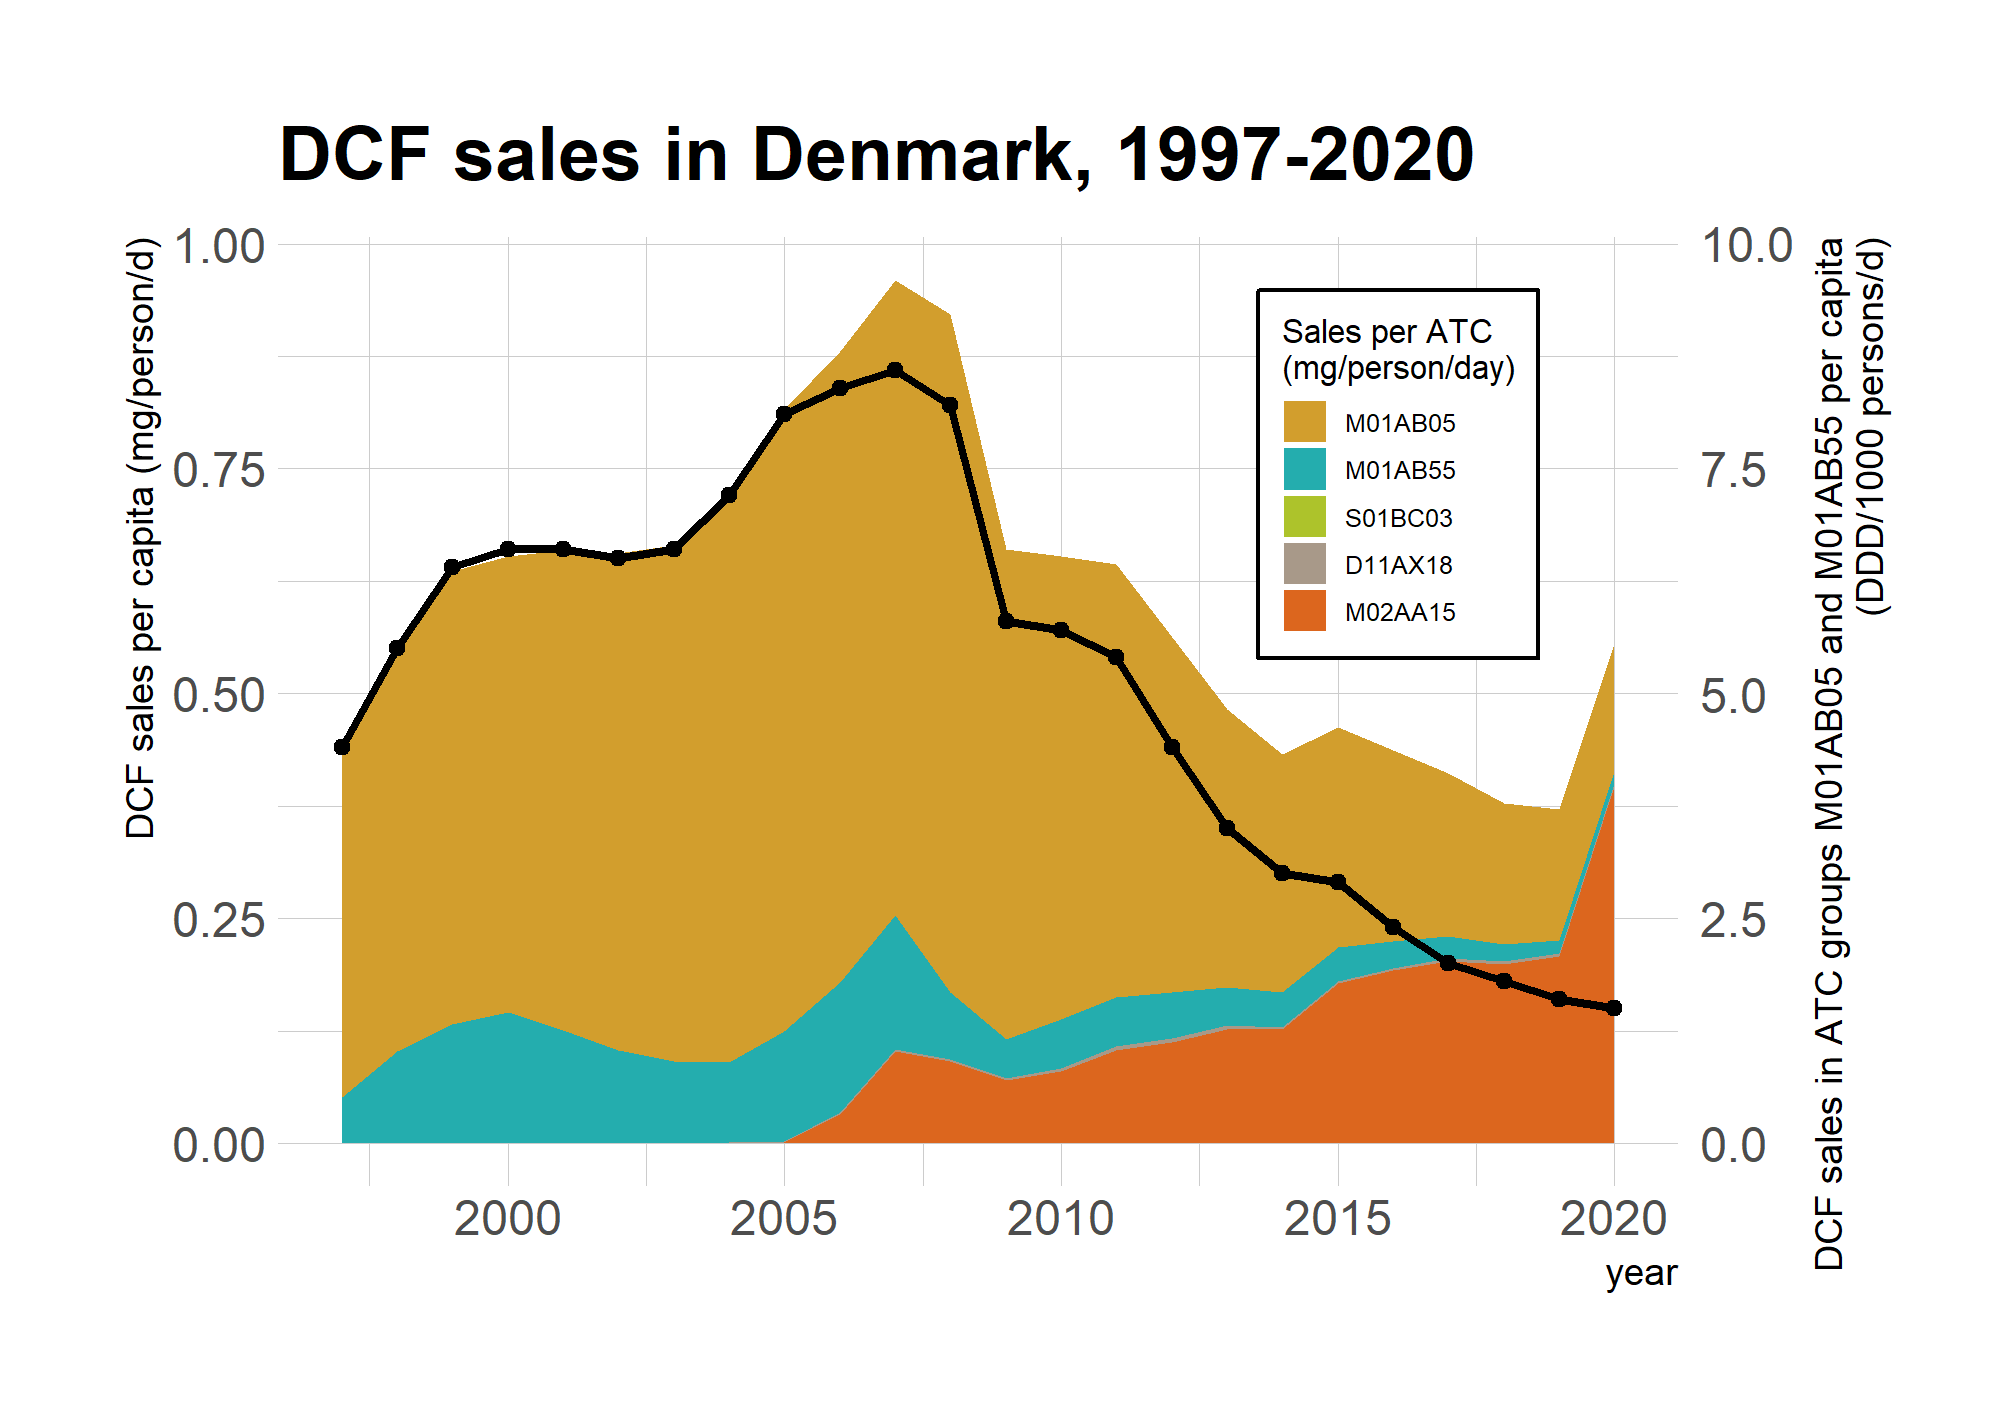
Figure 8. Diclofenac sales in Denmark, as reported in medstat.dk. The line presents the sales in DDDs, covering only ATCs M01AB05 and M01AB55.
In addition to annual sales statistics, some countries publish them on a higher temporal resolution as well. In Finland, statistics for reimbursable prescription medicines sold through community pharmacies are accessible on a weekly basis through an R package and a related web application (Kainu et al. 2022). The data does not include sales in mass units, but e.g. as costs and the numbers of purchase transactions. Furthermore, as opposed to the Danish sales statistics, the Finnish data for diclofenac covers only ATC classes M01AB05 and M01AB55. The costs for these ATC classes during from 2019 to 2021 are presented in Figure 9. While the Finnish dataset may be seen to give indication of sales being slightly higher during fall, and lowest during the summer months, it does not show any apparent seasonal trend.
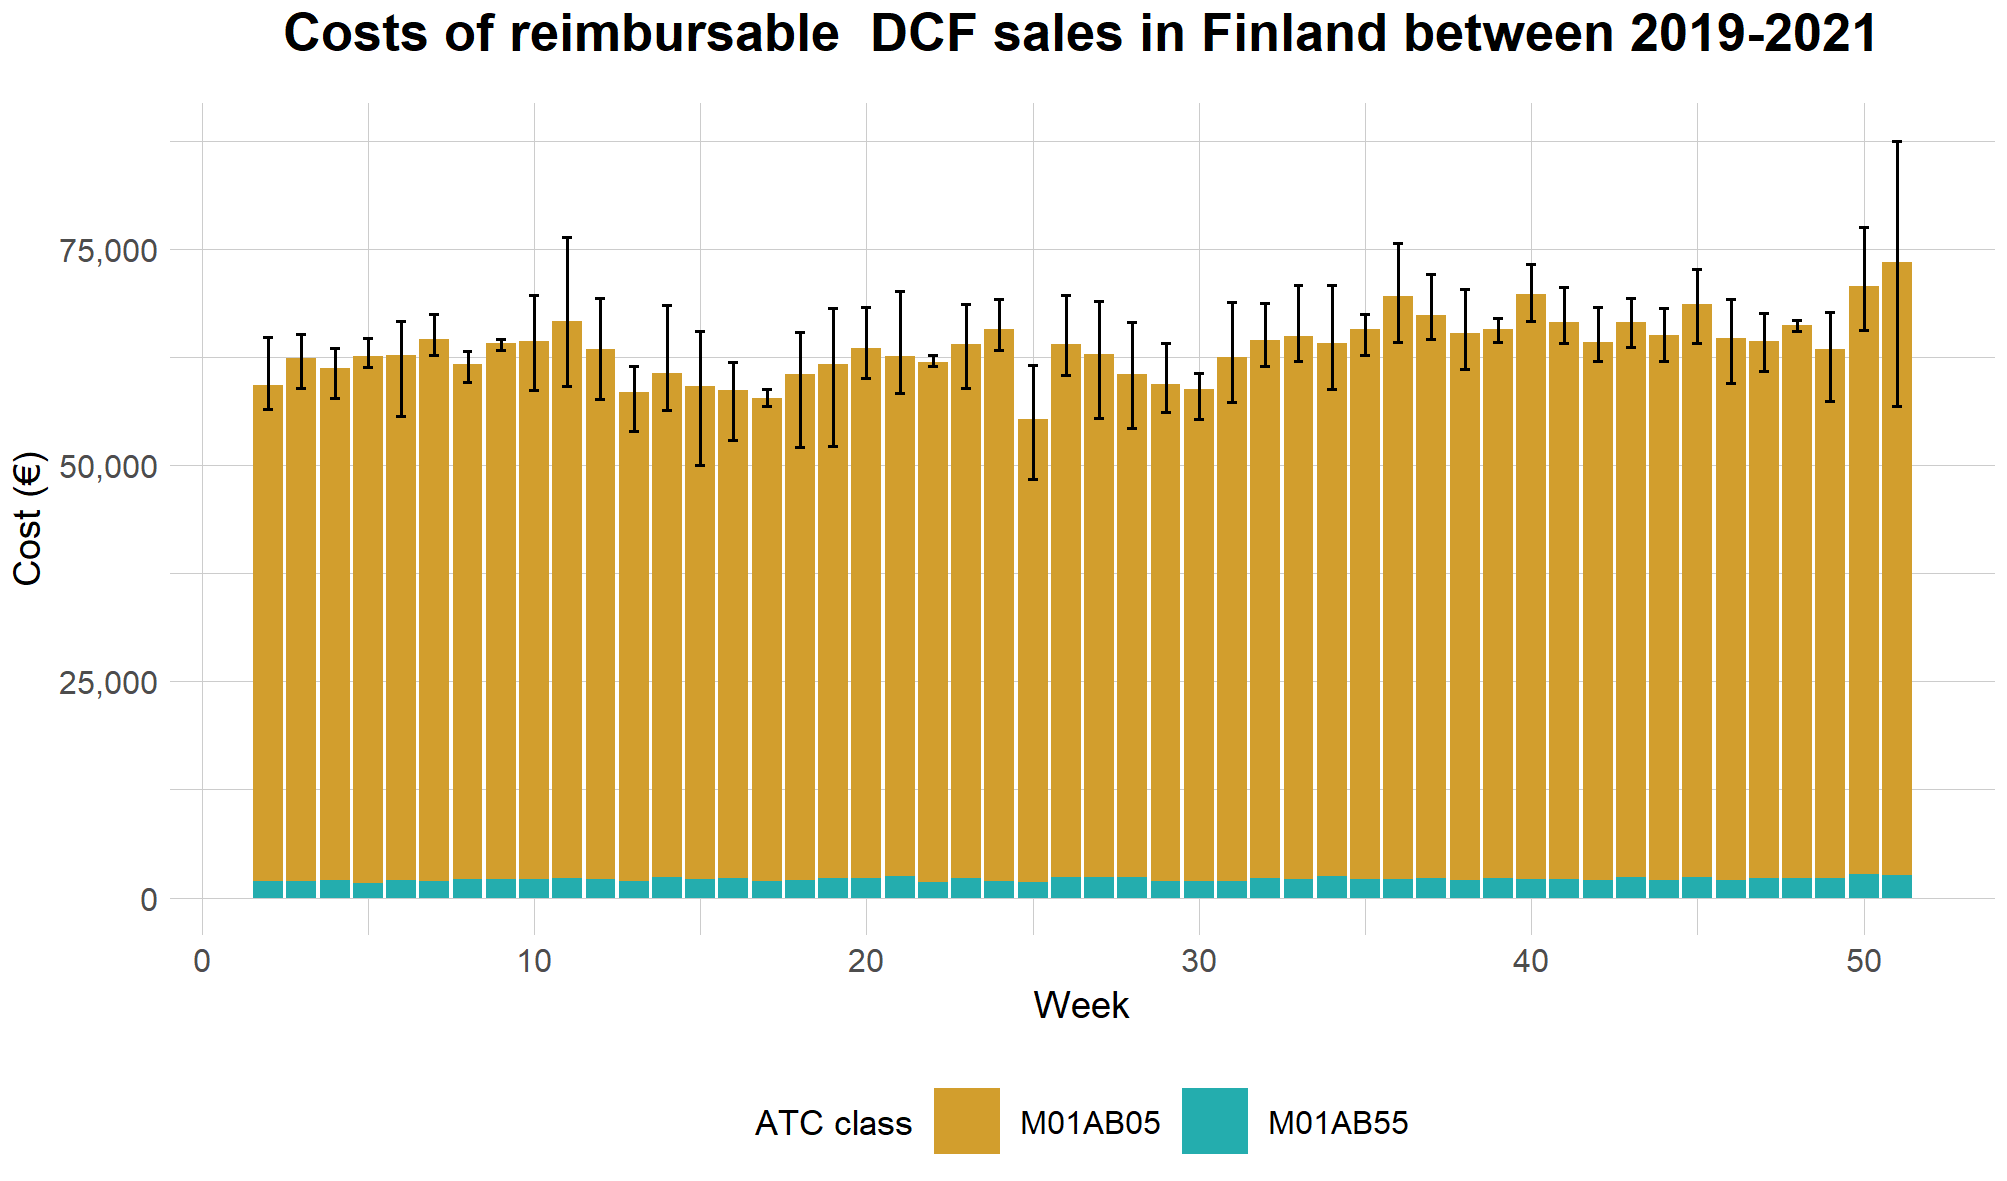
Figure 9. The costs of reimbursable prescription sales of diclofenac through community pharmacies in Finland from 2019–2021. The stacked bars show the mean sales grouped by week, while the whiskers show the range of values between years.
If comprehensive sales statistics for diclofenac were available, they could be utilized in estimating its emissions into the environment. However, as the statistics are currently available mostly in DDDs, they are not comprehensive. Diclofenac sales data, in conjunction with other variables such as WWTP removal rates, could be utilised in modelling diclofenac emissions or concentrations in the environment. Different calculation approaches have been utilised e.g. to estimate the loads to the environment (e.g. Äystö et al. 2020), to consider future challenges in management (Baranauskaitė and Dvarionienė 2014), and to follow annual trends and predict discharges to the Baltic Sea (Lember et al. 2016) or river basins (Lindim et al. 2016). The latter study was followed up with a detailed prediction on discharges to the Baltic Sea, including gaining high correlations with measured environmental data from the Stockholm region where wastewater effluent is discharged to the Baltic without significant river transport (Lindim et al. 2017).
Information on the sale of diclofenac is a relevant proxy to be used in the evaluation of environmental status. However, reporting of all diclofenac sales would be required for the entire catchment region. Moreover, potential seasonal variations in sales, and correlation with population demographics should be considered as well. In addition to sales statistics, relevant other processes, such as waste management practices, excretion rate, and removal at WWTPs should be considered as well.
Orally administered diclofenac is reported to be extensively metabolised, with less than 1% of the administered dose being excreted as the parent compound (e.g. Vieno & Sillanpää 2014). However, according to available statistics, the majority of diclofenac is used in topical products in BSR countries. Only a fraction of the applied API is estimated to be absorbed through the skin, while the rest may be washed off. According to Davies and Anderson (1997) and Hui et al. (1998), only 6–7% of topically administered diclofenac is absorbed. Therefore, the diclofenac discharges from human medication are likely much higher than 1% of all sales. Using the values presented above, and assuming 65% of diclofenac is used in topical products, Äystö & Stapf (2020) estimated an effective excretion rate of 61.5% for diclofenac.
If unused pharmaceuticals are flushed into sewers, they are likely to increase the load reaching the environment and the Baltic Sea. According to computational estimates carried out in the CWPharma-project (Äystö & Stapf 2020), improper waste management is most likely to increase the environmental load of APIs that are extensively metabolized in humans. These include e.g. ibuprofen and carbamazepine. For diclofenac, potential emissions from waste management were considered a relatively small emission source. However, this estimate relies on the excretion rate of diclofenac being relatively high (e.g. >60%, as presented above). If the excretion rate is very low, waste management becomes more important in managing diclofenac emissions.
6.2 Waste water treatment plants (WWTPs)
According to Unesco & HELCOM (2017), diclofenac is regularly detected amongst the 20 highest pharmaceutical concentrations in WWTP waters and sludges. More recently HELCOM 2022a showed similar results, with diclofenac being detected in 99% of WWTP effluent samples.
Diclofenac removal rates at WWTPs in the BSR have previously been shown to vary greatly, but to be generally low. Low removal patterns in WWTPs have generally been observed previously, where concentrations of diclofenac decreased by 11 and 28% between influent and effluent waters (Andersson et al. 2006; Fick et al. 2011; Miljøministeriet, Naturstyrelsen 2015), and in some cases effluent concentrations were higher than those in the influent waters (HELCOM 2014; Zorita et al. 2009). HELCOM & UNESCO (2017) reported diclofenac removal rates to be on average 1%. On the other hand, Ek Henning et al. (2020) reported removal rates to have ranged from -154% to 33%. A median removal rate in the CWPharma project, as reported by Äystö et al. (2020) was 6.4%. According to Vieno and Sillanpää (2014), the mean removal rate for diclofenac in conventional activated sludge systems is 36%. Moreover, studies comparing WWT processes have shown there to be a wide range of removal rates dependent on the type of process employed and that environmental conditions at or surrounding individual WWTPs may have an influence (reviewed in Vieno and Sillanpää 2014 and Lonappan et al. 2016).
The data reported for this indicator evaluation include 907 datapoints for WWTPs. A summary of this data is presented in Table 6. According to the data, the concentration levels are generally very similar in influent and effluent wastewaters, indicating a low removal rate.
Table 6. Summary of WWTP results reported for the ad hoc data call, divided by matrix and country. Results below the analytical limit were treated as missing values. The numbers of detections (ndet) and samples (n) are presented for each country and matrix.
| COUNTRY | Influent (ng/l) | Effluent (ng/l) | Sludge (µg/kg dw) | |||
| Mean (range) |
ndet/n | Mean (range) |
ndet/n | Mean (range) |
ndet/n | |
| DE | 7,150 (637–15,900) |
10/10 | 3,820 (380–26,100) |
346/346 | 316 (190–630) |
5/5 |
| DK | 273 (10.0–4,900) |
130/130 | 295 (10.0–5,700) |
140/140 | – | – |
| EE | 4,690 (140–23,000) |
42/43 | 4,490 (0.920–38,200) |
52/59 | 379 (2.25–1,920) |
36/36 |
| FI | 2,140 (85.0–5,230) |
28/29 | 1,800 (160–6,830) |
30/30 | 109 (58.0–340) |
13/13 |
| LV | 4,640 (3,980–6,090) |
6/6 | 4,070 (2,250–5,040) |
6/6 | 202 (140–300) |
4/4 |
| PL | 7,100 (4,490–9,720) |
2/2 | 9,660 (3,080–16,200) |
2/2 | 910 (860–960) |
2/2 |
| SE | 2,760 (1,740–3,360) |
6/6 | 2,760 (1,400–4,170) |
6/6 | 136 (35.0–330) |
32/32 |
The coverage of the reported data varied between countries, but also between seasons. When grouping the data based on sampling month, Germany was the only country with effluent data reported for every month. Figure 10 shows the wastewater concentrations reported for this indicator work, grouped by month for the period of 2016–2021. The reported concentrations seem to exhibit some seasonal variation, with the concentrations being highest during the winter months and lowest in the summer. Similar variation was not obvious for other countries, nor for German influent wastewaters. For other countries, and for German influents, the number of datapoints was lower, and data was available only for some months.
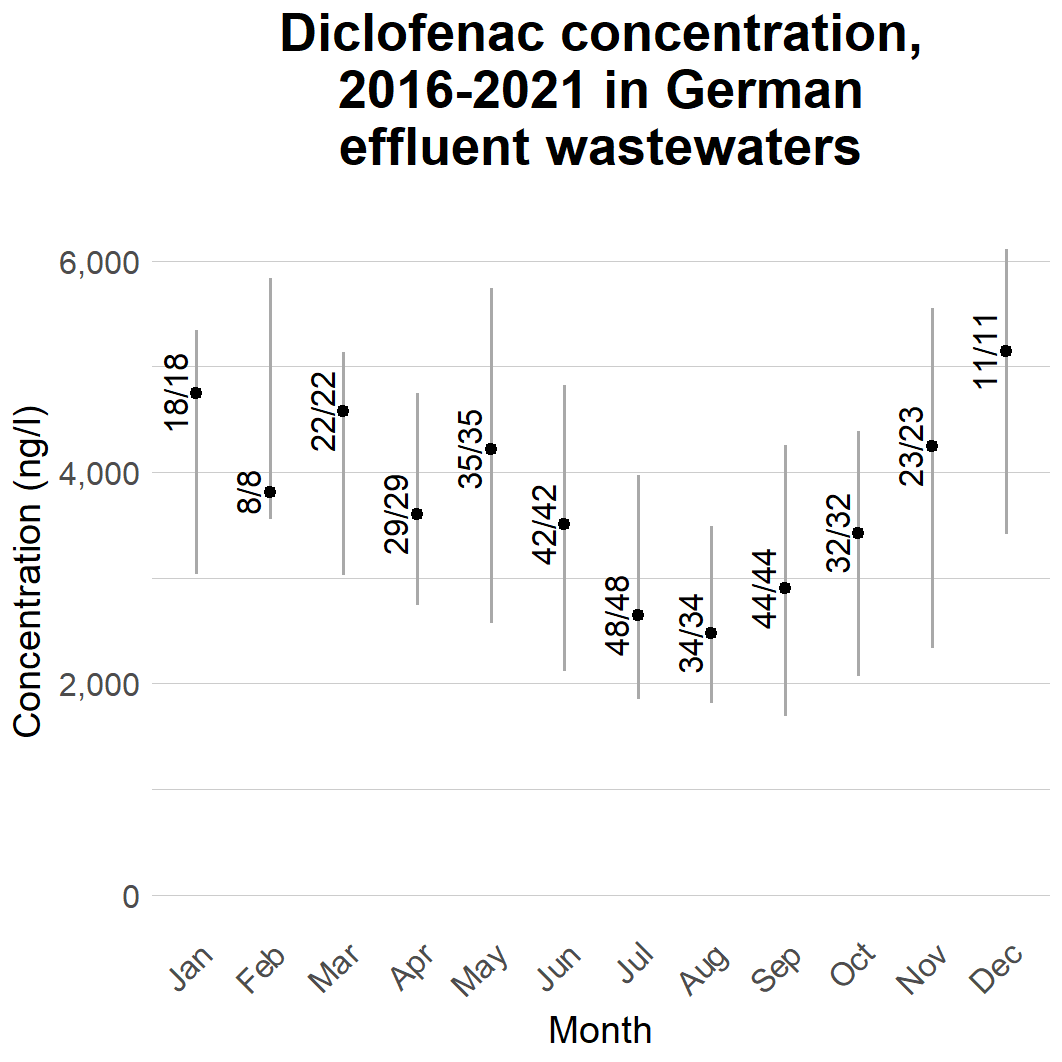
Figure 10. Reported diclofenac concentrations in effluent wastewaters by month. The point presents the median concentration while the whiskers present 50% of data. The numbers present the numbers of detections and samples. Concentrations below the analytical limit were treated as half the analytical limit.
The reported datapoints were divided based on their location in HELCOM level 3 division subcatchment areas, as estimated by Äystö et al. (2020). The locations of the WWTPs covered by the dataset are presented in Figure 11.
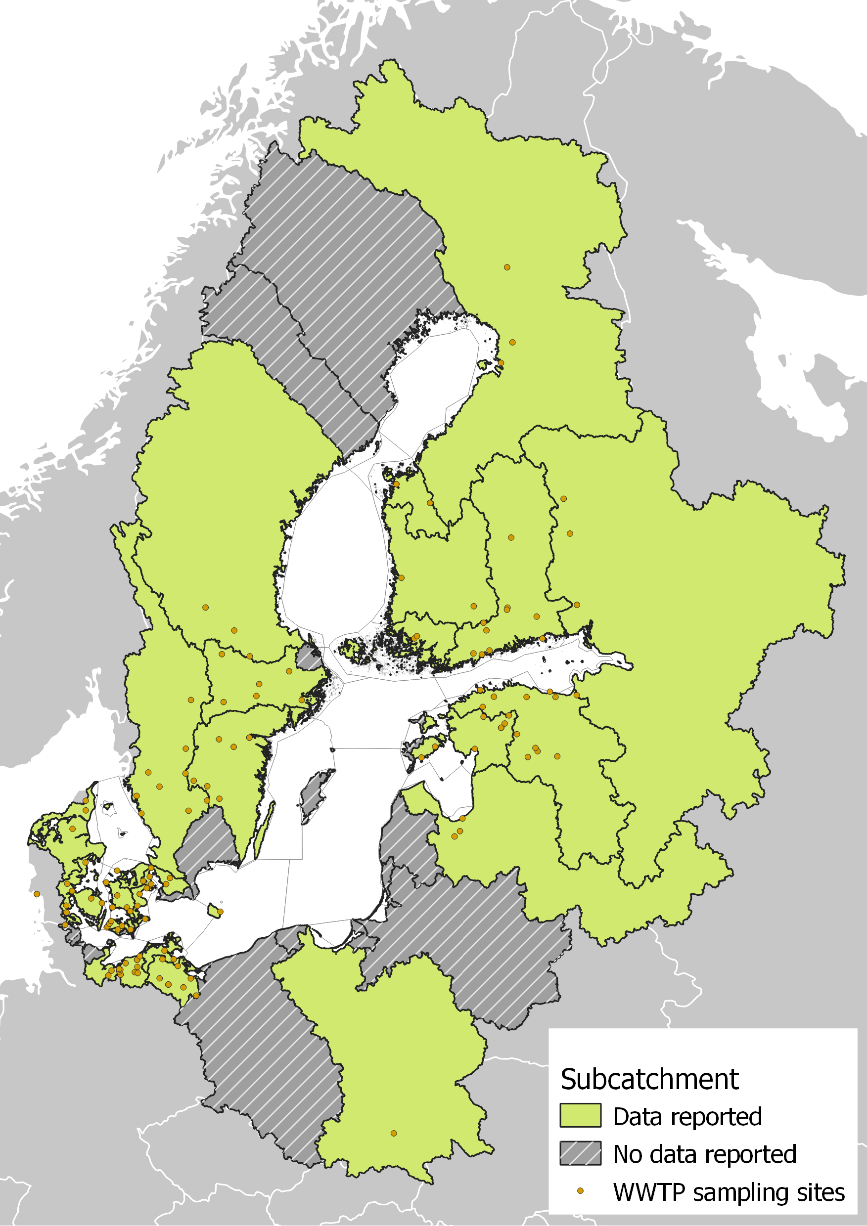
Figure 11. Locations of the WWTPs covered by the reported data, divided by subcatchment area.
The concentrations reported for effluent wastewaters, compared to the proposed threshold values are summarised in Figure 12. The concentrations in effluent wastewaters generally exceed the threshold values proposed by EC 2021 and Leverett et al. 2022. However, the effluent wastewater discharged from WWTPs is diluted in recipient waters. Therefore, high concentrations in WWTP effluents do not necessarily cause meaningful risk in the environment. A commonly used default dilution factor when estimating contamination from WWTPs is 10. This value is proposed to be used in e.g. risk assessment for pharmaceuticals by the European Medicines Agency (EMA 2006). Therefore, PNEC exceedances of less than 10-fold, can be considered to cause no concern. As shown in Figure 12, diclofenac concentrations in BSR effluents often exceed the proposed threshold values by more than 10-fold.
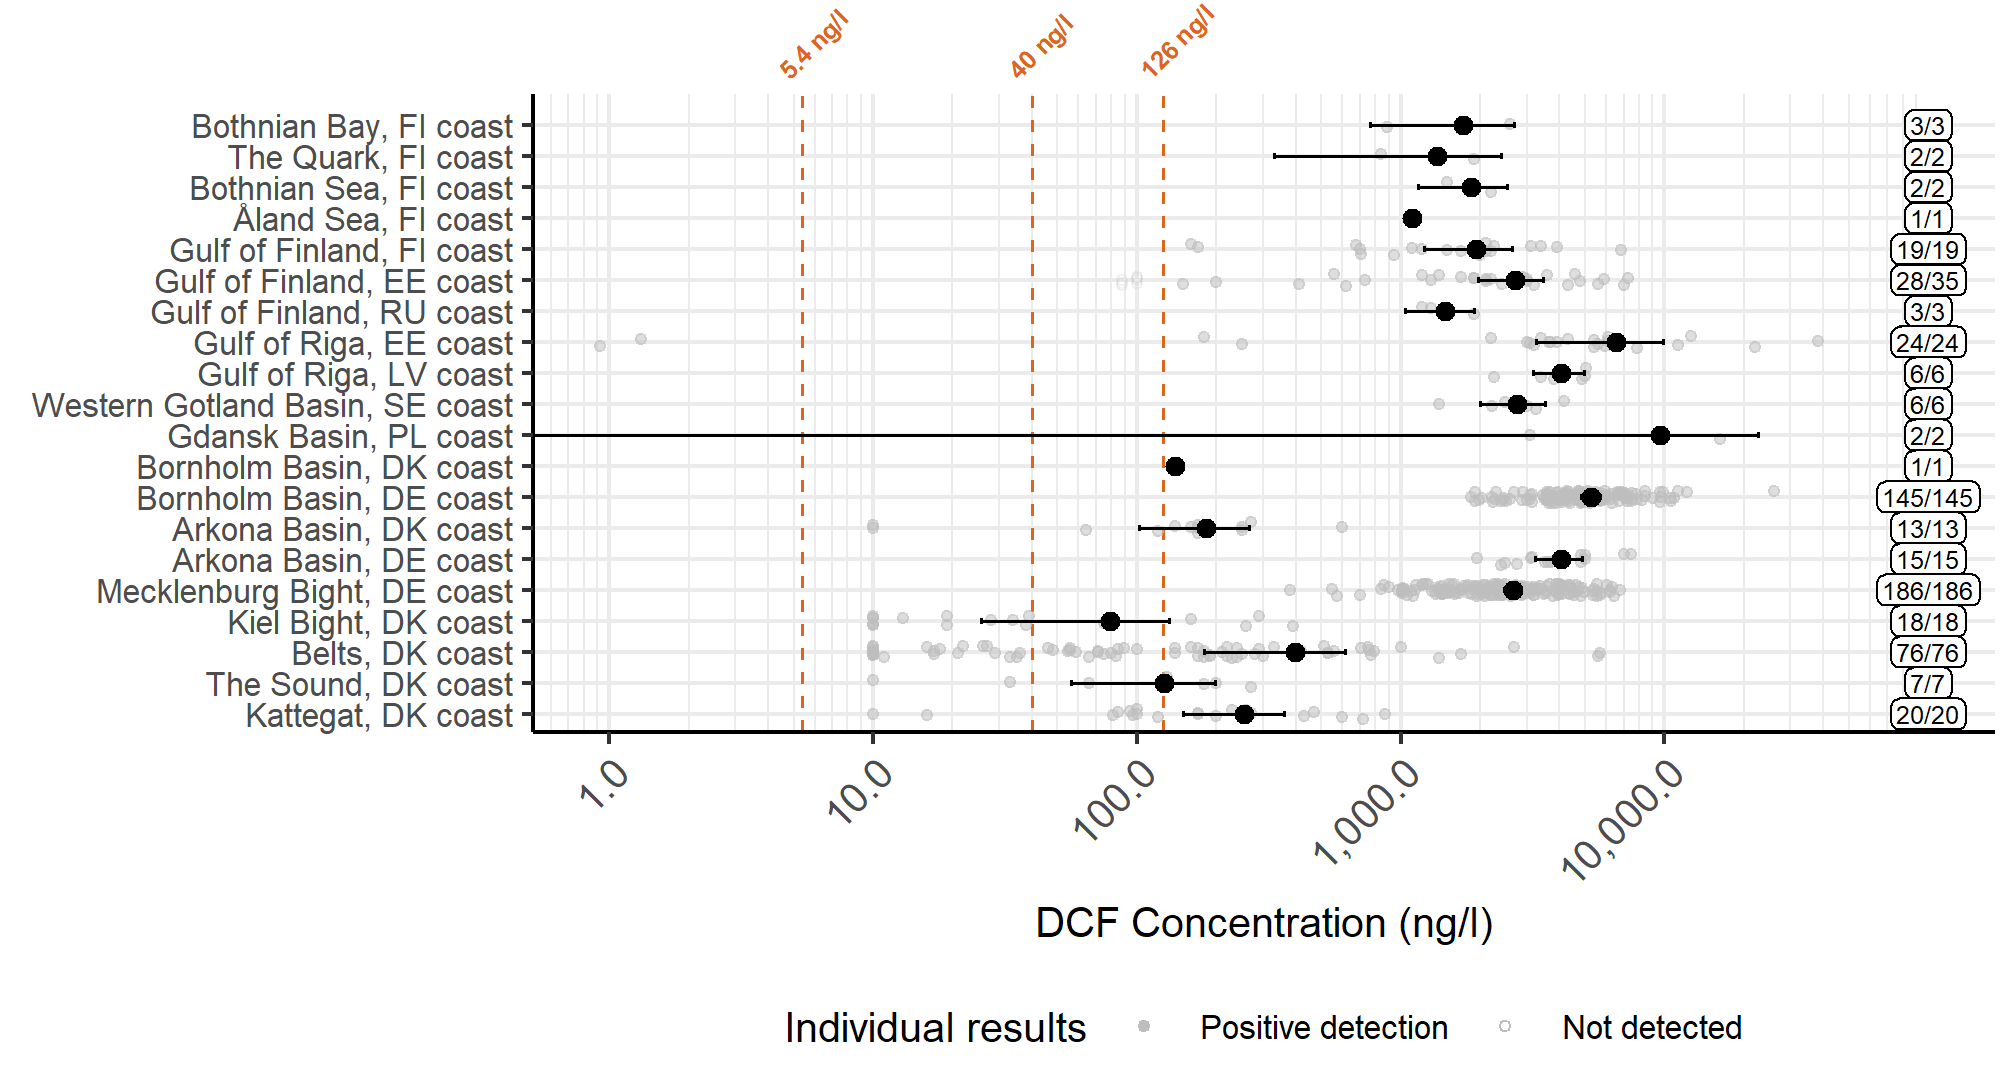
Figure 12. Concentrations reported for WWTP effluents, divided by subcatchments. The filled circles represent a mean value for each assessment unit, while the whiskers show the 95% confidence interval, calculated from positive detections. The label on the right-hand side shows the numbers of samples and detections. The dashed lines present the threshold values proposed by EC 2021 (values 5.4 ng/l (EQSbiota,sec.pois, and 40 ng/l (AA-EQSfw,eco)) and Leverett et al. 2021 (126 ng/l).
Despite WWTPs being considered the main point sources for diclofenac in the environment, other sources have been suggested, including the recreational use of waters (especially in lakes and rivers, Daneshvar et al. 2012) and the spreading of WWTP sludges on land (Lindim et al. 2016). Sources such as hospitals, pharmaceutical manufacturers, sewer overflow or leakage, septic tanks, agriculture and storm water run-off are also relevant to consider as potential pathways of introduction to the Baltic Sea.
6.3 Pathways – inland waters
WWTPs discharge effluent wastewaters commonly to their recipient waters. Although only a fraction of WWTPs within the BSR are located in the Baltic Sea coast, diclofenac discharged into inland waters will eventually also reach the Baltic Sea, unless it is degraded during its transport. Äystö et al. (2020) estimated nearly 70% of diclofenac reaching the Baltic Sea to originate from inland areas.
Most of the data reported for this indicator evaluation focused on inland surface waters. This data included altogether 2,306 datapoints. The division by country, and concentration levels are summarised in Table 7.
Table 7. Diclofenac concentrations in inland surface waters, as reported to the ad-hod data call. Results below the analytical limit were treated as missing values.
| Country | Mean, ng/l (range) |
ndet/ntot |
|---|---|---|
| DE | 158 (4.00-2,850) |
848/1445 |
| DK | 87.5 (10.0-357) |
16/16 |
| EE | 51.6 (2.19-240) |
38/603 |
| FI | 71.3 (3.00-640) |
66/83 |
| LV | 229 (3.40-1,100) |
13/14 |
| PL | 851 (1.30-2,200) |
6/6 |
| SE | 92.3 (1.50-430) |
45/139 |
As Table 7 shows, data is unevenly distributed between countries. As with WWTP data, Germany was the country reporting most data. Germany and Estonia were the only countries reporting data for every month of the year. While diclofenac was detected in only 6% of the inland surface water samples reported from Estonia, no potential seasonal trend could be identified. However, for the German data, the concentrations exhibited a seasonal trend, similar to the one observed in WWTP effluents (see Figure 13) Figure 13 presents the German inland surface water data by month. The data gives indication that concentrations in inland waters may vary seasonally, peaking during winter months. The reasons behind this could relate to levels of usage in these months, which is supported by the slight temporal trend observed for German WWTP effluents. However, to help better estimate if changes in sales explain the variation in environmental concentrations, sales statistics from Germany should be accessed in a high level of temporal resolution. The seasonal trend could also relate to environmental conditions such as rainfall and discharge rates, or e.g. colder temperatures, potentially affecting WWTP function or microbial degradation in the environment.
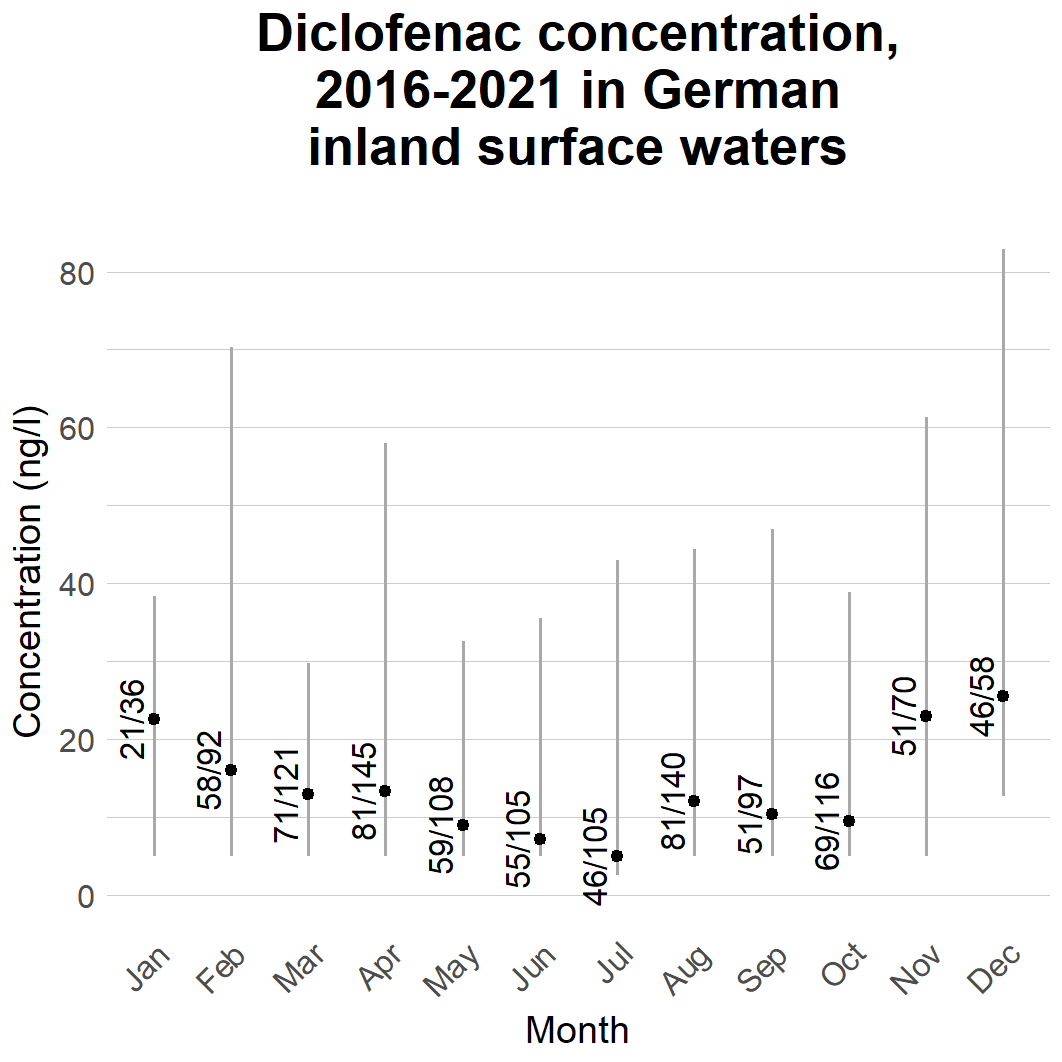
Figure 13. Diclofenac concentrations in inland surface waters by month. The dot presents the median concentration while the whiskers present 50% of data. The numbers present the numbers of detections and samples. Concentrations below the analytical limit were treated as half the analytical limit.
When looking for concentration trends at distinct sampling sites, eight sites could be identified, where data was reported for more than three years, and on average for more than one sample per year. These sites were located in Estonia, Finland and Germany. The concentrations in these sampling sites are presented in Figure 14. The concentrations in the Finnish sampling sites can be estimated to have a slight downward trend, while the opposite is true for the German sampling sites. When assessing the significance of the Pearson correlations, the p-values were below 0.05 in only two sites, implying statistical significance for them (Sites D and F, see Fig. 14).
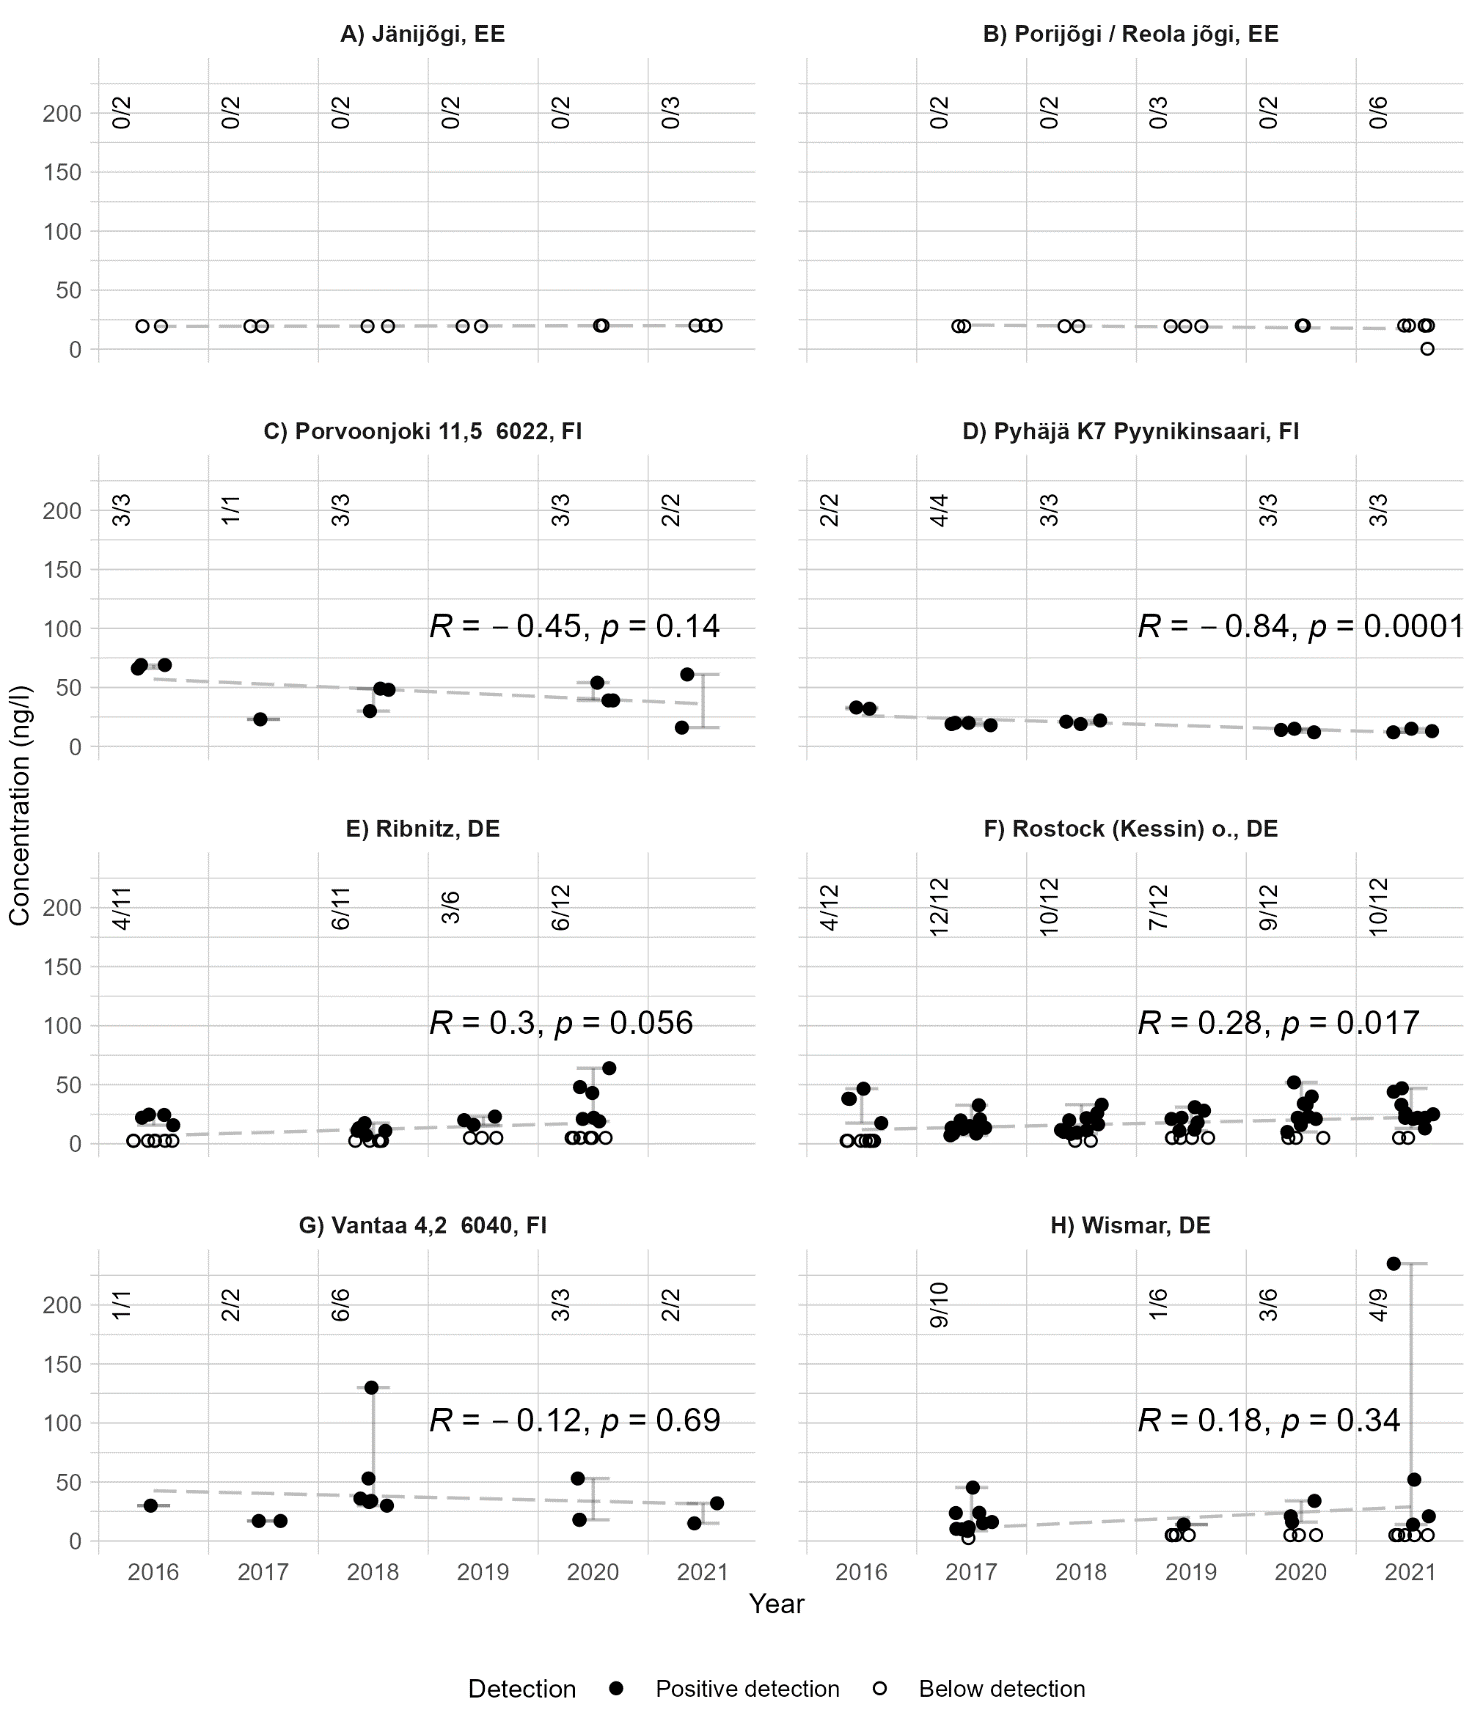
Figure 14. Diclofenac trends in inland waters within the Baltic Sea catchment area. The numbers in the upper corner present the numbers of detections and samples. The dashed line shows a linear trend estimated from the datapoints, while the whiskers show the range of detected concentrations. Results below the analytical limit were treated as half the analytical limit.
The datapoints were divided based on their location in HELCOM level 3 division subcatchment areas, as estimated by Äystö et al. (2020). The sampling sites along with the subcatchment division is presented in Figure 15. The reported concentrations in each subbasin are presented in Figure 16.
The lowest of the freshwater thresholds is exceeded in nearly all subcatchments covered by the data. The only exceptions are the inland waters discharging to the Finnish coast of the Åland Sea and Estonian coast of Baltic Proper. The dataset contained five results for the former area, with the highest detected concentration being 5 ng/l. Diclofenac was not detected in any of the five samples reported for the latter one. Exceedances of the two higher threshold values are also common. The 95% confidence interval exceeds the highest proposed value in inland areas discharging to the coastal waters of all covered countries, except Estonia.
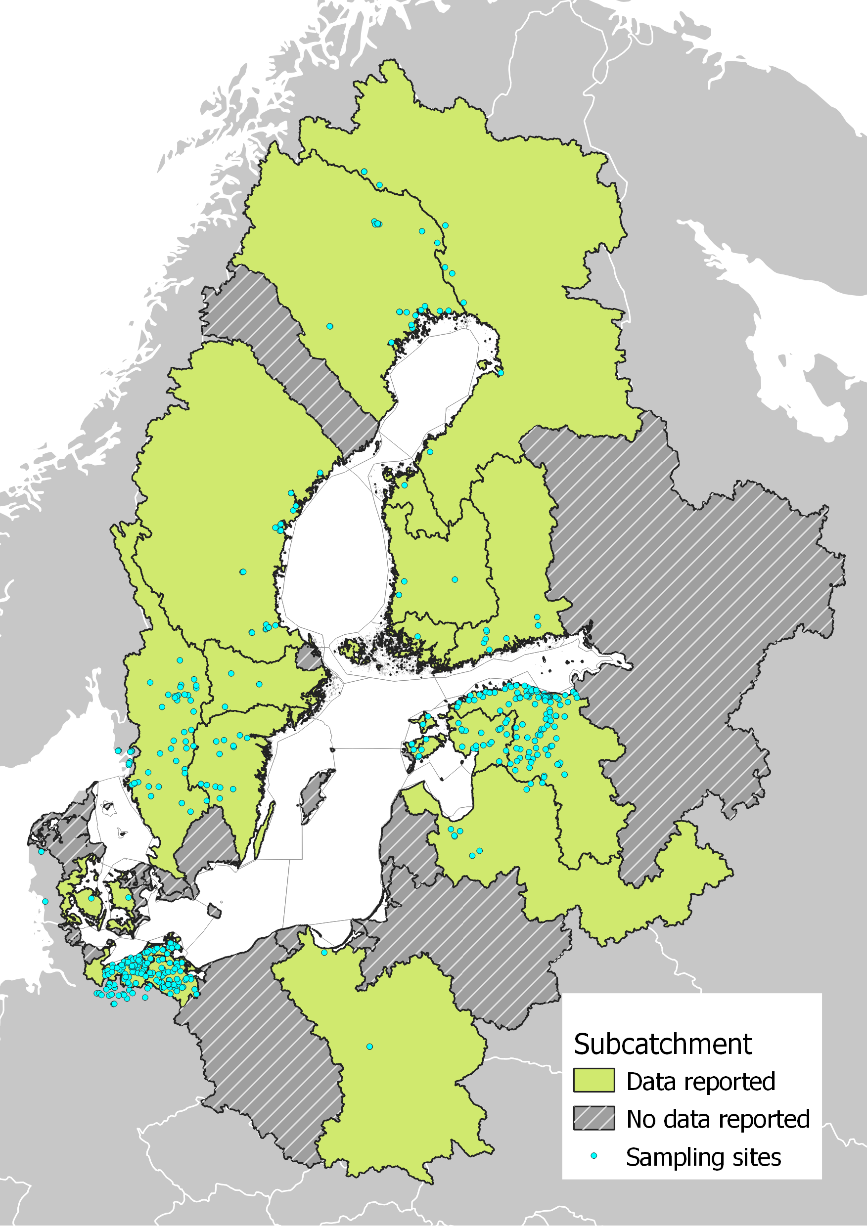
Figure 15. Inland surface water sampling sites per subcatchment.
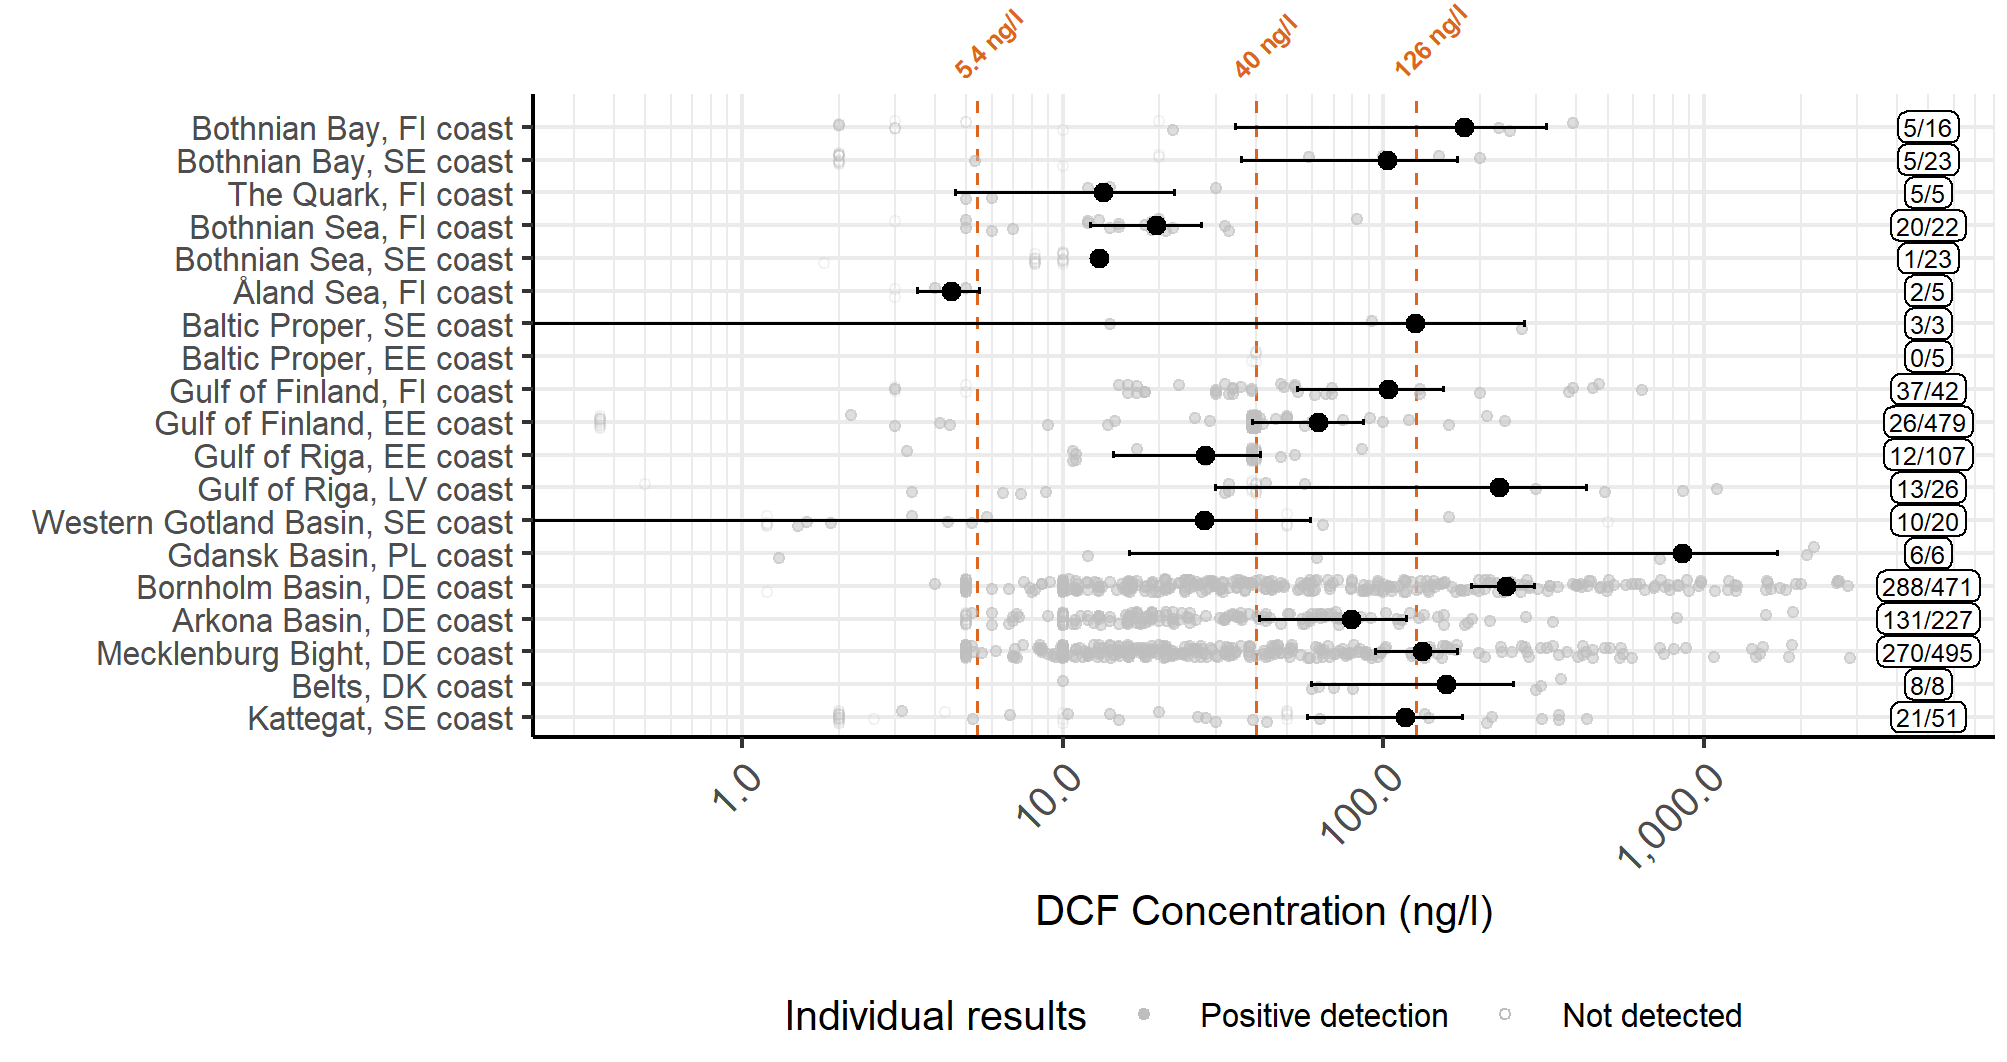
Figure 16. Diclofenac concentrations in inland waters, divided by subcatchments. The filled circles represent a mean value for each assessment unit, while the whiskers show the 95% confidence interval, calculated from positive detections. The label on the right-hand side shows the numbers of samples and detections. The dashed lines present the threshold values proposed by EC 2021 (values 5.4 ng/l (EQSbiota,sec.pois), and 40 ng/l (AA-EQSfw,eco)) and Leverett et al. 2021 (126 ng/l).
7 Climate change and other factors
Diclofenac is a substance that is currently in active use. As diclofenac discharges are highly dependant on usage patterns, changes in them may have a greater impact on the occurrence of the substance in the environment than climate change. All considerations presented below assume that diclofenac consumption remains unchanged.
Precipitation is anticipated to increase in the BSR in the future (HELCOM 2021b). Increased precipitation cannot be expected to have a direct impact on diclofenac emissions. However, the increased incidence of extreme precipitation events may increase the frequency of WWTP overflows, where untreated wastewater is released into recipient waters. Nevertheless, these incidents will simultaneously increase water flow volume in the recipient waters, decreasing diclofenac concentration. Although diclofenac removal at WWTPs is variable and often low, increased precipitation will increase the overall load of diclofenac into recipient waters. However, due to the increased flow rate in recipient waters, increased precipitation might not affect diclofenac concentrations in those waters.
Surface water temperature is expected to rise in the Baltic Sea (HELCOM 2021b). While diclofenac is not quick to biodegrade in water (e.g. Rastogi et al. 2021), increased temperature can generally be anticipated to increase the biodegradation rate. Diclofenac is mainly degraded through photolysis (e.g. Buser et al. 1998; Kovacic et al. 2016). Therefore, decreased sea-ice extent and decreased duration of ice cover in both Baltic Sea, and inland waters will likely result in increased photodegradation rates for diclofenac. However, this impact might be negligible, especially in the northern latitudes.
Overall, climate change can be expected to affect the temporal variation of diclofenac concentrations in the Baltic Sea water environment. Changes in precipitation are likely to result in increased variability of loads into the environment, while decreased ice cover may increase degradation rates. While the overall impact on diclofenac concentrations remains uncertain, Munari et al. (2016) showed that ocean acidification caused by climate change may increase the sensitivity of marine biota to diclofenac.
Climate change is expected to have numerous impacts on the Baltic Sea environment and ecosystem and the cumulative pressures exerted may also influence the susceptibility/resilience to new or emerging pressures.
8 Conclusions
The available data shows diclofenac concentrations to exceed the proposed threshold values in several assessment units in the Baltic Sea. However, as the data coverage is variable, and often the number of datapoints is low, this evaluation should be considered preliminary.
8.1 Future work or improvements needed
More information on diclofenac occurrence in the Baltic Sea environment is required to make a more robust status evaluation. In addition to the quantity of the data, its quality should also be higher. Currently analytical limits are often higher than the proposed threshold values. In future monitoring campaigns, the analytical limits should be decreased. In the current data, the analytical limits were reported to have been lower than the proposed threshold values in only 64.7% and 31.8% of the datapoints for biota and Baltic Sea water, respectively. Furthermore, future monitoring should aim to produce time series, to help assess trends.
In addition to improving future monitoring efforts, using diclofenac sales as a proxy should be further investigated. This would benefit from close collaboration between medicines agencies and environmental researchers.
Finalization and adoption of suitable threshold values, as well as detailed information on the potential inclusion of this substance as a priority substance, would also enhance the indicator evaluation. To harmonise data collection further for this indicator relevant HELCOM monitoring and assessment guidelines would be valuable.
9 Methodology
9.1 Scale of assessment
The indicator was evaluated on the HELCOM assessment unit level 4 (HELCOM 2022b, attachment 4).
9.2 Methodology applied
Data for this diclofenac status evaluation was compiled through an ad hoc data call (HELCOM 2021c). Since no commonly agreed monitoring strategy has been developed for pharmaceuticals, data reported by HELCOM contracting parties is used as it was reported. The data was supplemented with data produced in the CWPharma-project, funded by the EU’s Interreg Baltic Sea Region Programme. The dataset contained some duplicated datapoints. The duplicates were removed from further analyses.
The majority of the data (63%) originated from inland surface waters and WWTP effluents (16%). These were not incorporated into the evaluation but were included into a brief discussion on drivers ad pressures. Samples from the Baltic Sea accounted for 9.1% (n=296) and 0.93% (n=34) for surface waters and biota, respectively.
The data was transformed to common units, ng/l for water matrices and µg/kg ww for biota. Some concentrations in fish were reported per dry weight. These values were converted to wet weight basis, assuming a dry weight content of 20%.
The reported dataset contained individual suspiciously high values. These values were checked from the reported original source and corrected. The errors were caused by unit conversion errors in the reported data.
The data originated partially from monitoring campaigns, and partially from screening studies or literature. Therefore, some of the sampling sites were assigned more than one sampling site names. To help identify each sampling point, irrespective of the original source of the database entry, each sampling site was assigned a sampling site code. To do this, the dataset was divided by sampling country and reported coordinates, rounding the coordinates to six significant figures. Each distinct combination was given a unique identifier.
The created sampling site IDs were utilized in identifying sampling sites with data allowing for a trend evaluation. The number of datapoints per sampling site and year were calculated. Trends were estimated only for the sites with data available for more than three years during 2016-2021, and more than one datapoint per year.
The datapoints were mapped based on their reported coordinates. The points were linked with HELCOM assessment units (HELCOM 2022c). Individual points, located on the coastline, but falling outside the HELCOM assessment unit division were assigned the assessment unit code manually.
To assess the status of the Baltic Sea, datapoints from Baltic Sea water and biota were grouped by HELCOM assessment units. Indicator values, including mean and 95% confidence limits, were calculated for the data by treating values below the analytical limit as missing values. Confidence intervals were calculated assuming that the concentration follows a normal distribution. When there were no positive detections, the highest reported analytical limit for the assessment unit was used for the evaluation.
To assess the status, the concentrations were compared to the proposed threshold values. Interpretation of the comparison is presented below:
- Whenever the upper 95% confidence limit was lower than the threshold value, good status was considered achieved.
- If there was only one positive detection, it was used in the comparison. If the concentration was lower than the threshold value, good status was considered achieved.
- Whenever the mean concentration or the upper 95% confidence limit exceeded the threshold value, good status was considered failed.
- Whenever there were only non-detects for an assessment unit,
- …and the highest analytical limit was below the proposed threshold value, good status was considered achieved.
- …and the highest analytical limit exceeded the proposed threshold value, good status was considered uncertain.
The overall status of the Baltic Sea was further evaluated as a combination of the water and biota comparisons. In assessment units, where there were data from both water and biota, the lowest status was assigned. For example, while the datapoints for concentrations in biota within the assessment unit SEA-013 contained only results below the analytical limit, and the analytical limit was below the proposed threshold, SEA-013 achieved good status for biota. However, the only detected concentration in water was 26 ng/l, clearly exceeding the proposed threshold for water, resulting in a failure of good status. Thus, overall the status of SEA-013 was considered to fail good status.
Since values below the analytical limit were excluded from the dataset when calculating confidence limits and mean concentrations, the concentrations used in the evaluation may be higher than the actual representative concentration levels in the assessment units. Moreover, the number of datapoints used in the status evaluation is very low. When more data becomes available, this methodology may require revision.
9.3 Monitoring and reporting requirements
Monitoring methodology
For assessing the environmental status of the Baltic Sea using the threshold limits proposed by EC 2021, as commented by SCHEER 2022, concentrations should be monitored in Baltic Sea water and biota. To allow for a meaningful comparison to the biota threshold value of 1.16 µg/kg ww, the biota monitoring should be carried out in whole organisms. This would better represent the diet of predatory birds, which the threshold value is based on.
Earlier screening campaigns focused largely on sites influenced by WWTP discharges. These campaigns were commonly short-term and project-based. As the occurrence of diclofenac in the environment and its link to WWTPs as emission sources has been established, future monitoring should focus more on producing concentration timeseries. This kind of data would allow estimating trends. Moreover, monitoring should not focus only on WWTP impacted sites, but also areas further away from these emission sources. This would help in estimating representative concentration levels in surface waters.
10 Data
The data and resulting data products (e.g. tables, figures and maps) available on the indicator web page can be used freely given that it is used appropriately and the source is cited.
The data utilised in the evaluation was reported by HELCOM contracting parties through an ad hod data call (HELCOM 2021c). This dataset was further supplemented with data produced in the project CWPharma, funded by the EU’s Interreg Baltic Sea Region Programme. After removing duplicate entries, the dataset contained altogether 3,666 datapoints, out of which 2,048 exceeded the analytical limit. Data coverage by country and matrix is presented in Table 8.
Table 8. Data coverage grouped by country and matrix.
| Country | Baltic Sea | Inland waters | WWTP | |||||
|---|---|---|---|---|---|---|---|---|
| Water | Biota | Sediment | Water | Sediment | Influent | Effluent | Sludge | |
| DE | 58/162 | – | – | 848/1445 | – | 10/10 | 346/346 | 5/5 |
| DK | – | – | – | 16/16 | – | 130/130 | 140/140 | – |
| EE | 0/24 | 0/21 | 2/29 | 38/603 | 5/90 | 42/43 | 52/59 | 36/36 |
| FI | 13/24 | – | – | 66/83 | – | 28/29 | 30/30 | 13/13 |
| LV | 4/4 | – | 0/2 | 13/14 | – | 6/6 | 6/6 | 4/4 |
| PL | 24/60 | – | – | 6/6 | – | 2/2 | 2/2 | 2/2 |
| SE | 12/22 | 0/13 | 0/2 | 45/139 | – | 6/6 | 6/6 | 32/32 |
11 Contributors
Lauri Äystö, Finnish Environment Institute
Contributors of the previous indicator version:
Ekaterina Chernova, Lena Avellan, Kari Lehtonen, Jakob Strand, Dmitry Frank-Kamenetsky, Owen Rowe
HELCOM Secretariat: Jannica Haldin Joni Kaitaranta, Owen Rowe, Deborah Shinoda
12 Archive
This version of the HELCOM core indicator report was published in April 2023:
The current version of this indicator (including as a PDF) can be found on the HELCOM indicator web page.
Earlier versions of this indictor are available at:
13 References
Andersson, J., Woldegiorgis, A., Remberger, M., Kaj, L., Ekheden, Y., Dusan, B., Svenson, A., Brorström-Lunden, E., Dye, C & Schlabach, N. 2006. Results from the Swedish national screening programme. Subreport 1: Anti-biotics, anti-inflammatory substances and hormones. Swedish Environment Research Institute. IVL Report B1689.
Baranauskaitė, I. & Dvarionienė, J. 2014. Presence and detection of pharmaceutical substances (Diclofenac, 17-β-estradiol, 17-α-etilinestradiol) in the environment. Future challenges for Lithuania. Environmental Research, Engineering and Management 2(68): 25-40.
Brown, J.N., Paxéus, N., Förlin, L. & Larsson, D.G.J. 2007. Variations in bioconcentration of human pharmaceuticals from sewage effluents into fish blood plasma. Environmental Toxicology and Pharmacology; 24: 267-274.
Brozinski, J.M., Lahti, M., Meierjohann, A., Oikari, A., & Kronberg L. 2013. The anti-inflammatory drugs diclofenac, naproxen and ibuprofen are found in the bile of wild fish caught downstream of a wastewater treatment plant. Environmental Science and Technology 47(1): p.342–348.
Buser, H.-R., Poiger, T. & Müller, M.D. 1998. Occurrence and Fate of the Pharmaceutical Drug Diclofenac in Surface Waters: Rapid Photodegradation in a Lake. Environ. Sci. Technol. 32, 3449–3456. https://doi.org/10.1021/es980301x
Cleuvers, M. 2004. Mixture toxicity of the anti-inflammatory drugs diclofenac, ibuprofen, naproxen, and acetylsalicylic acid. Ecotoxicology and environmental safety 59(3): 309-315.
Cuklev, F., Kristiansson, E., Fick, J., Asker, N., Förlin, L., & Larsson D. G. J. 2011. Diclofenac in fish: blood plasma levels similar to human therapeutic levels affect global hepatic gene expression. Environmental Toxicology and Chemistry 30 (9): 2126-2134.
Daneshvar, A., Svanfelt, J., Kronberg, L. & Weyhenmeyer, G.A. 2012. Neglected sources of pharmaceuticals in river water—footprints of a Reggae festival. J Environ Monit 14(2): 596-603. doi: 10.1039/c1em10551e
Davies, N.M. & Anderson, K.E. 1997. Clinical pharmacokinetics of diclofenac therapeutic insights and pitfalls. Clin Pharmacokinet 33:184–213. https://doi.org/10.2165/00003088-199733030-00003
Eades, C. & Waring, C.P. 2010. The effects of diclofenac on the physiology of the green shore crab Carcinus maenas. Marine Environmental Research 69:46–48.
Ek Henning, H., Putna.Nimane, I., Kalinowski, R., Perkola, N., Bogusz, A., Kublina, A., Haiba, E., Barda, I., Karkovska, I., Schütz, J., Mehtonen, J., Siimes, K., Nyhlén, K., Dzintare, L., Äystö, L., Sinics, L., Laht, M., Lehtonen, M., Stapf, M., Stridh, P., Poikāne, R., Hoppe, S., Lehtinen, T., Kõrgma, V., Junttila, V. & Leisk, Ü. 2020. Pharmaceuticals in the Baltic Sea Region – emissions, consumption and environmental risks. Report no. 2020:28, Länsstyrelsen Östergötland, Linköping. Available at: https://www.lansstyrelsen.se/4.f2dbbcc175974692d268b9.html
EMA 2006. Committee for medicinal products for human use (CHMP). Guideline on the environmental risk assessment of medicinal products for human use. London, 01 June 2006. Doc. Ref. EMEA/CHMP/SWP/4447/00 corr 2.
Ericson, H., Thorsén, G. & Kumblad, L. 2010. Physiological effects of diclofenac, ibuprofen and propranolol on Baltic Sea blue mussels. Aquat. Toxicol. 99, 223–231. https://doi.org/10.1016/j.aquatox.2010.04.017
European Commission (EC). 2018. Revised Technical Guidance for deriving Environmental Quality Standards. Common Implementation Strategy for the Water Framework Directive Guidance Document No. 27. European Commission.
European Commission (EC) 2019. Communication from the commission to the European Parliament, the Council and the European Economid and Social Committee. European Union Strategic Approach to Pharmaceuticals in the Environment. Brussels 11.3.2019. COM(2019) 128 final.
European Commission (EC) 2021 Draft EQS Datasheet: Diclofenac. https://circabc.europa.eu/ui/group/9ab5926d-bed4-4322-9aa7-9964bbe8312d/library/696bd6ba-0a50-4d6c-bbfd-d59b1c848c36
Fick, J., Lindberg, RH., Kaj, L. & Brorström-Lundén, E. 2011. Results from the Swedish national screening programme 2010. Subreport 3: Pharmaceuticals. Swedish Environment Research Institute. IVL Report B2014.
Graumnitz, S. & Jungman, D. 2021. The database “ Pharmaceuticals in the Environment” – Updated for the period 2017-2020. German Environment Agency. Texte 163/2021.
Gonzalez-Rey, M. & Bebianno, M. J. 2014. Effects of non-steroidal anti-inflammatory drug (NSAID) diclofenac exposure in mussel Mytilus galloprovincialis. Aquatic toxicology: 148, 221-230.
Hallare, A. V., Köhler, H-R. & Triebskorn, R. 2004. Developmental toxicity and stress protein response in zebrafish embryos after exposure to diclofenac and its solvent, DMSO. Chemosphere 56; 659-66.
HELCOM 2014 BASE project 2012-2014: Pilot activity to identify sources and flow patterns of pharmaceuticals in St. Petersburg to the Baltic Sea.
HELCOM 2021a. Baltic Sea Action Plan – 2021 update.
HELCOM 2021b. Climate Change in the Baltic Sea Fact Sheet 2021. Available at: https://helcom.fi/baltic-sea-climate-change-fact-sheet-new-publication-shows-latest-scientific-knowledge-on-climate-change-in-the- baltic-sea/
HELCOM 2021c. Third State of the Baltic Sea report (HOLAS III) – Data call. Available at: https://portal.helcom.fi/meetings/STATE%20-%20CONSERVATION%2014-2021-824/MeetingDocuments/4J-11Att1%20HOLAS%20III%20Data%20call.pdf
HELCOM 2022a. Micropollutants in wastewater and sewage sludge. Baltic Sea Environment Proceedings Proceedings No. 185.
HELCOM 2022b. HELCOM Monitoring and Assessment Strategy. Attachment 4, updated in 25.2.2022 following HOD 61-2021 meeting decision on updating HELCOM Assessment Units and 29.8.2022 following update on coastal assessment units. https://helcom.fi/wp-content/uploads/2020/02/Monitoring-and-assessment-strategy.pdf
HELCOM 2022c. HELCOM subbasins with coastal WFD waterbodies or watertypes 2022 (level 4a). https://metadata.helcom.fi/geonetwork/srv/eng/catalog.search#/metadata/67d653b1-aad1-4af4-920e-0683af3c4a48 [Referred to on 29.7.2022]
Hoeger, B., Köllnere, B., Dietrich, D.R. & Hitzfeld, B. 2005. Water-borne diclofenac affects kidney and gill integrity and selected immune parameters in brown trout (Salmo trutta f. fario). Aquatic Toxicology 75: 53-64.
Hui,X., Hewitt, P.G.,Poblete, N., Maibach, H.I., Shainhosue, J.Z. & Wester, R.,C. 1998. In Vivo Bioavailability and Metabolism of Topical Dicofenac Lotion in Human Volunteers. Pharm Res. 1998;15(10):1589–1595. https://doi.org/10.1023/a:1011911302005
Joachim, S., Beaudouin, R. Daniele, G., Geffard, A., Bado-Nilles, A., Tebby, C. Palluel, O., Dedourge-Geffardd, O. Fieuc, M., Bonnardd, M., Palos-Ladeirod, M., Turièsa, C., Vulliet, E. David, V., Baudoin, P. James, A., Andres, S. & Porcher, J.M. 2021. Effects of diclofenac on sentinel species and aquatic communities in semi-natural conditions, Ecotoxicology and Environmental Safety, 211, 111812 https://doi.org/10.1016/j.ecoenv.2020.111812
Kainu, M., Heino, P., Kari, H., Saastamoinen, L., Koskinen, H., Rättö, H. & Kurko, T. 2022. reseptilaakesovellus: Reseptilääkkeiden ostot ATC-luokittain. R package version 0.7.0. https://github.com/kelaresearchandanalytics/reseptilaakesovellus
Kaiser, A., Träncker, J., Björklund, E., Svahn, O., Suzdalev, S., Langas, V., Gamaga-Budré, G., Szopinska, M., Fudala-Ksiazek, S. & Jankowska, K. 2019. Pharmaceutical consumption patterns in four coastal regions of the South Baltic Sea. Project MORPHEUS 2017-2019, Deliverable 3.1.
Kallio, J-M., Lahti, M., Oikari, A. & Kronberg, L. 2010. Metabolites of the aquatic pollutant diclofenac in fish bile. Environmental Science and Technology 44: 7213-7219.
Karlsson, M. & Viktor, T. 2014. Miljöstörande ämnen I fisk från Stockholmsregionen 2013. Raport B2214 from the Swedish Environment Research Institute IVL.
Koehler, B., Erlandsson, M., Karlsson, M. & Bergström, L. 2022. Species richness and functional attributes of fish assemblages across a large-scale salinity gradient in shallow coastal areas. Biogeosciences 19, 2295–2312. https://doi.org/10.5194/bg-19-2295-2022
Kovacic, M., Juretic Perisic, D., Biosic, M., Kusic, H., Babic, S. & Loncaric Bozic, A. 2016. UV photolysis of diclofenac in water; kinetics, degradation pathway and environmental aspects. Environ. Sci. Pollut. Res. 23, 14908–14917. https://doi.org/10.1007/s11356-016-6580-x
Kumblad, L., Oskarsson, H., Palmer, C., & Wiklund, A. K. E. 2015. Response and recovery of Baltic Sea blue mussels from exposure to pharmaceuticals. Marine Ecology Progress Series, 526: 89-100.
Lahti, M., Brozinski, J.M., Segner, H., Kronberg, L. & Oikari, A. 2012. Bioavailability of pharmaceuticals in waters close to wastewater treatment plants: Use of fish bile for exposure assessment. Environ. Toxicol. Chem. 31, 1831–1837. https://doi.org/10.1002/etc.1879
Lember, E., Pachel, K. & Loigu, E. 2016. Modelling diclofenac and ibuprofen residues in major Estonian seaside cities. Journal of Water Security 2.
Leverett, D., Merrington, G., Crane, M., Ryan, J. & Wilson, I. 2021. Environmental quality standards for diclofenac derived under the European Water Framework Directive: 1. Aquatic organisms. Environ. Sci. Eur. 33. https://doi.org/10.1186/s12302-021-00574-z
Lindim, C., van Gils, J., Georgieva, D., Mekenyan, O. & Cousins, I.T. 2016. Evaluation of human pharmaceutical emissions and concentrations in Swedish river basins. Science of the Total Environment. 572: 508-519.
Lindim, C., van Gils, J., Cousins, I.T., Kuhne, R., Georgieva, D. & Kutsarova, S. 2017. Model-predicted occurrence of multiple pharmaceuticals in Swedish surface waters and their flushing to the Baltic Sea. Environmental Pollution 223: 595-604.
Lonappan, L., Brar, S.K., Das, R.K., Verma, M. & Surampalli, R.Y. 2016. Diclofenac and its transformation products: Environmental occurrence and tioxicity – A review. Environment International 96: 127-138.
Loos, R., Marinov, D., Sanseverino, I., Napierska, D. & Lettieri, T. 2018. Review of the 1st Watch List under the Water Framework Directive and recommendations for the 2nd Watch List, EUR 29173 EN, Publications Office of the European Union, Luxembourg, 2018, ISBN 978-92-79-81839-4, doi:10.2760/614367, JRC111198
Löf, M., Sundelin, B., Liewenborg, B., Bandh, C., Broeg, K., Schatz, S. & Gorokhova, E. 2016. Biomarker-enhanced assessment of reproductive disorders in Monoporeia affinis exposed to contaminated sediment in the Baltic Sea. Ecol. Indic. 63, 187–195. https://doi.org/10.1016/j.ecolind.2015.11.024
Mezzelani, M., Gorbi, S., Da Ros, Z., Fattorini, D., d’Errico, G., Milan, M., Bargelloni, L. & Regoli, F. 2016. Ecotoxicological potential of non-steroidal anti-inflammatory drugs (NSAIDs) in marine organisms: Bioavailability, biomarkers and natural occurrence in Mytilus galloprovincialis. Mar. Environ. Res. 121, 31–39. https://doi.org/10.1016/j.marenvres.2016.03.005
Miljøministeriet, Naturstyrelsen 2015. NOVANA-Screeningsundersøgelse for humane lægemidler i vandmiljøet (In Danish). Available at: http://naturstyrelsen.dk/media/133385/screening-for-humane-laegemilder-i-vandmiljoeet.pdf
Munari, M., Chemello, G., Finos, L., Ingrosso, G., Giani, M. & Marin, M. G. 2016. Coping with seawater acidification and the emerging contaminant diclofenac at the larval stage: A tale from the clam Ruditapes philippinarum. Chemosphere: 160, 293-302.
Oaks, J.L., Gilbert, M., Virani, M.Z., Watson, R.T., Meteyer, C.U., Rideout, B.A., Shivaprasad, H.L., Ahmed, S., Chaudhry, M.J.I., Arshad, M., Mahmood, S., Ali, A. & Khan, A.A. 2004. Diclofenac residues as the cause of vulture population decline in Pakistan. Nature 427, 630–633. https://doi.org/10.1038/nature02317
Orias. F. & Perrodin. Y. 2013. Characterisation of the ecotoxicity of hospital effluents: A review. Sci Tot Environ. 454–455. 250–276.
Rastogi, A., Tiwari, M.K. & Ghangrekar, M.M. 2021. A review on environmental occurrence, toxicity and microbial degradation of Non-Steroidal Anti-Inflammatory Drugs (NSAIDs). J. Environ. Manage. 300. https://doi.org/10.1016/j.jenvman.2021.113694
SCHEER (Scientific Committee on Health, Environmental and Emerging Risks) 2022. Scientific Opinion on “Draft Environmental Quality Standards for Priority Substances under the Water Framework Directive” Diclofenac, 2 August 2022. https://health.ec.europa.eu/publications/scheer-scientific-opinion-draft-environmental-quality-standards-priority-substances-under-water-0_en
Schmidt, W., O’Rouke, K., Hernan, R. & Quinn, B. 2011. Effects of the pharmaceuticals gemfibrozil and diclofenac on the marine mussel (Mytilus spp.) and their comparison with standard toxicity tests. Marine Pollution Bulletin 62: 1389-1395.
Schmidt, W., Rainville, L-C., McEneff, G., Sheehan, D. & Quinn, B. 2013. A proteomic evaluation of the effects of the pharmaceuticals diclofenac and gemfibrozil on marine mussels (Mytilus spp.): evidence for chronic sublethal effects on stress-response proteins. Drug Testing and Analysis 6: 210-219.
Schmitt-Jansen, M., Bartels, P., Adler, N. & Altenburger, R. 2007. Phytotoxicity assessment of diclofenac and its phototransformation products. Analytical and bioanalytical chemistry 387(4): 1389-1396.
Schwaiger, J., Ferling, H., Mallow, U., Wintermayr, H. & Negele, R.D. 2004. Toxic effects of the non-steroidal anti-inflammatory drug diclofenac. Part I: histopathological alterations and bioaccumulation in rainbow trout. Aquatic Toxicology 68: 141–150.
Świacka, K., Smolarz, K., Maculewicz, J. & Caban, M. 2020. Effects of environmentally relevant concentrations of diclofenac in Mytilus trossulus. Sci. Total Environ. 737. https://doi.org/https://doi.org/10.1016/j.scitotenv.2020.139797
Triebskorn, R., Casper, H., Heyd, A., Eikemper, R., Köhler H-R. & Schwaiger, J. 2004. Toxic effects of non-steroidal anti-inflammatory drug diclofenac. Part II. Cytological effects on liver, kidney, gills, and intestine of rainbow trout (Oncorhynchus mykiss). Aquatic Toxicology 68: 151-66.
Turja, R., Höher, N., Snoeijs, P., Baršiene, J., Butrimavičiene, L., Kuznetsova, T., Kholodkevich, S. V., Devier, M.H., Budzinski, H. & Lehtonen, K.K. 2014. A multibiomarker approach to the assessment of pollution impacts in two Baltic Sea coastal areas in Sweden using caged mussels (Mytilus trossulus). Sci. Total Environ. 473–474, 398–409. https://doi.org/10.1016/j.scitotenv.2013.12.038
Turja, R., Lehtonen, K. K., Meierjohann, A., Brozinski, J. M., Vahtera, Soirinsuo, A, Sokolov, A., Snoeijs, P., Budzinski, H. & Devier, M.H., Peluhet, L., Pääkkönen, J.P., Viitasalo, M., Kronberg, L. 2015. The mussel caging approach in assessing biological effects of wastewater treatment plant discharges in the Gulf of Finland (Baltic Sea). Marine pollution bulletin, 97(1): 135-149.
UBA 2021. Database – Pharmaceuticals in the environment. Website: https://www.umweltbundesamt.de/en/database-pharmaceuticals-in-the-environment-0. [Visited 6th October 2022]
Undeman, E. 2020. Diclofenac in the Baltic Sea – Sources, transport routes and trends. Helcom Baltic Sea Environment Proceedings n°170.
Undeman, E., Rasmusson, K., Kokorite, I., Lepppänen, M.T., Larsen, M.M., Pazdro, K., Diedlewicz, G. 2022. Micropollutants in urban wastewater: large-scale emission estimates and analysis of measured concentrations in the Baltic Sea catchment. Marine Pollution Bulletin 178, https://doi.org/10.1016/j.marpolbul.2022.113559UNESCO and HELCOM, 2017. Pharmaceuticals in the aquatic environment of the Baltic Sea region – A status report. UNESCO Emerging Pollutants in Water Series – No. 1, UNESCO Publishing, Paris.
Vieno, N. & Sillanpää, M. 2014. Fate of diclofenac in municipal wastewater treatment plan – A review. Environment International 69: 28-39.
WHO 2021. ATC/DDD index 2022. Website: https://www.whocc.no/atc_ddd_index/ [Referred to on 8.8.2022]
Zanuri, N.B.M., Bentley, M. G. & Caldwell, G. S. 2017. Assessing the impact of diclofenac, ibuprofen and sildenafil citrate (Viagra®) on the fertilisation biology of broadcast spawning marine invertebrates. Marine Environmental Research: 127, 126-136.
Zettler, M.L., Karlsson, A., Kontula, T., Gruszka, P., Laine, A.O., Herkül, K., Schiele, K.S., Maximov, A. & Haldin, J. 2014. Biodiversity gradient in the Baltic Sea: A comprehensive inventory of macrozoobenthos data. Helgol. Mar. Res. 68, 49–57. https://doi.org/10.1007/s10152-013-0368-x
Zorita, S., Mårtensson, L. & Mathiasson L. 2009. Occurrence and removal of pharmaceuticals in a municipal sewage treatment system in the south of Sweden. Science of the Total Environment 407: 2760-70.
Äystö, L., Siimes, K., Junttila, V., Joukola, M. & Liukko, N. 2020. Emissions and environmental levels of pharmaceuticals – Upscaling to the Baltic Sea Region. Project CWPharma activity 2.3 report. http://hdl.handle.net/10138/321722
Äystö, L. & Stapf, M. 2020. Scenarios for reducing pharmaceutical emissions – Estimated load reductions, greenhouse gas emissions & costs. Project CWPharma Activity 5.1 + 5.2 report. https://helda.helsinki.fi/handle/10138/322549
14 Other relevant resources
Annex I Status of each assessment unit covered by the evaluation
The status of each assessment unit is presented in the table below.
Table 9. Status of each assessment unit covered by the evaluation.
| Assessment unit | BS water | BS biota | Overall good status | ||
|---|---|---|---|---|---|
| Good statusa | Number of datapoints, and analytical limitb | Good statusc | Number of datapoints, and analytical limitb | ||
| Gulf of Finland (FIN-003) |
Failed | 5/5/6 Highest analytical limit: 5 ng/l |
– | – | Failed |
| Gulf of Finland (FIN-004) |
Failed | 2/6/8 Highest analytical limit: Information missing. Highest reported analytical limit: 0.34 ng/l |
– | – | Failed |
| Bay of Mecklenburg (GER-002) |
Failed | 7/7/25 Highest analytical limit: 10 ng/l |
– | – | Failed |
| Bay of Mecklenburg (GER-005) |
Failed | 16/17/28 Highest analytical limit: 10 ng/l |
– | – | Failed |
| Arkona Basin (GER-007) |
Uncertain | 0/0/6 Highest analytical limit: 10 ng/l |
– | – | Uncertain |
| Arkona Basin (GER-012) |
Uncertain | 0/0/11 Highest analytical limit: 10 ng/l |
– | – | Uncertain |
| Arkona Basin (GER-013) |
Failed | 5/5/11 Highest analytical limit: 10 ng/l |
– | – | Failed |
| Arkona Basin (GER-014) |
Failed | 2/2/6 Highest analytical limit: 10 ng/l |
– | – | Failed |
| Bornholm Basin (GER-016) |
Failed | 1/2/2 Highest analytical limit: 0.34 ng/l |
– | – | Failed |
| Bornholm Basin (GER-020) |
Failed | 11/11/30 Highest analytical limit: 10 ng/l |
– | – | Failed |
| Gulf of Riga (LAT-005) |
Achieved | 0/4/4 Highest analytical limit: 0.34 ng/l |
– | – | Achieved |
| Gdansk Basin (POL-004) |
Achieved | 0/3/3 Highest analytical limit: 0.1 ng/l |
– | – | Achieved |
| Gdansk Basin (POL-006) |
Achieved | 0/2/6 Highest analytical limit: 0.15 ng/l |
– | – | Achieved |
| Gdansk Basin (POL-008) |
Failed | 1/3/6 Highest analytical limit: 0.15 ng/l |
– | – | Failed |
| Bay of Mecklenburg (SEA-005) |
Failed | 4/4/10 Highest analytical limit: 10 ng/l |
– | – | Failed |
| Arkona Basin (SEA-006) |
Failed | 2/2/10 Highest analytical limit: 10 ng/l |
– | – | Failed |
| Bornholm Basin (SEA-007) |
Failed | 8/16/47 Highest analytical limit: 10 ng/l |
Uncertain | 0/0/1 Highest analytical limit: 10 µg/kg ww |
Failed |
| Gdansk Basin (SEA-008) |
Achieved | 0/4/9 Highest analytical limit: 0.15 ng/l |
– | – | Achieved |
| Eastern Gotland Basin (SEA-009) |
Achieved | 0/4/12 Highest analytical limit: 0.15 ng/l |
Achieve | 0/0/1 Highest analytical limit: 1 µg/kg ww |
Achieved |
| Gulf of Finland (SEA-013) |
Failed | 1/1/4 Highest analytical limit: Not reported |
Achieve | 0/0/7 Highest analytical limit: 1 µg/kg ww |
Failed |
| Bothnian Sea (SEA-015) |
Achieved | 0/1/3 Highest analytical limit: Not reported |
– | – | Achieved |
| Kattegat (SWE-003) |
– | – | Uncertain | 0/0/1 Highest analytical limit: 10 µg/kg ww |
Uncertain |
| Kattegat (SWE-004) |
– | – | Uncertain | 0/0/1 Highest analytical limit: 10 µg/kg ww |
Uncertain |
| The Sound (SWE-005) |
– | – | Uncertain | 0/0/1 Highest analytical limit: 10 µg/kg ww |
Uncertain |
| Arkona Basin (SWE-006) |
– | – | Achieve | 0/0/1 Highest analytical limit: 0.11 µg/kg ww |
Achieved |
| Eastern Gotland Basin (SWE-009) |
– | – | Uncertain | 0/0/2 Highest analytical limit: 10 µg/kg ww |
Uncertain |
| Northern Baltic Proper (SWE-011) |
– | – | Uncertain | 0/0/1 Highest analytical limit: 10 µg/kg ww |
Uncertain |
| Western Gotland Basin (SWE-013) |
Achieved | 0/2/2 Highest analytical limit: 0.34 ng/l |
– | – | Achieved |
| Northern Baltic Proper (SWE-015) |
– | – | Uncertain | 0/0/1 Highest analytical limit: 10 µg/kg ww |
Uncertain |
| Bothnian Sea (SWE-016) |
Failed | 2/2/3 Highest analytical limit: 8.2 ng/l |
Uncertain | 0/0/2 Highest analytical limit: 10 µg/kg ww |
Failed |
| Bothnian Sea (SWE-018) |
Uncertain | 0/0/1 Highest analytical limit: 10 ng/l |
Uncertain | 0/0/1 Highest analytical limit: 10 µg/kg ww |
Uncertain |
| The Quark (SWE-020) |
– | – | Uncertain | 0/0/1 Highest analytical limit: 10 µg/kg ww |
Uncertain |
| Bothnian Bay (SWE-022) |
Uncertain | 0/0/2 Highest analytical limit: 10 ng/l |
– | – | Uncertain |
| Kattegat (SWE-025) |
Failed | 8/8/14 Highest analytical limit: 50 ng/l |
– | – | Failed |
| Gulf of Finland (EST-001) |
Uncertain | 0/0/2 Highest analytical limit: 40 ng/l |
– | – | Uncertain |
| Gulf of Riga (EST-013) |
Uncertain | 0/0/2 Highest analytical limit: 39 ng/l |
Achieve | 0/0/1 Highest analytical limit: 1 µg/kg ww |
Uncertain |
| Eastern Gotland Basin (EST-011) |
Uncertain | 0/0/2 Highest analytical limit: 40 ng/l |
Achieve | 0/0/1 Highest analytical limit: 1 µg/kg ww |
Uncertain |
| Northern Baltic Proper (EST-010) |
Uncertain | 0/0/1 Highest analytical limit: 39 ng/l |
Achieve | 0/0/1 Highest analytical limit: 1 µg/kg ww |
Uncertain |
| Gulf of Riga (EST-016) |
Uncertain | 0/0/3 Highest analytical limit: 40 ng/l |
Achieve | 0/0/2 Highest analytical limit: 1 µg/kg ww |
Uncertain |
| Gulf of Finland (EST-002) |
Uncertain | 0/0/1 Highest analytical limit: 40 ng/l |
Achieve | 0/0/1 Highest analytical limit: 1 µg/kg ww |
Uncertain |
| Gulf of Finland (EST-005) |
Uncertain | 0/0/8 Highest analytical limit: 40 ng/l |
Achieve | 0/0/1 Highest analytical limit: 1 µg/kg ww |
Uncertain |
| Gulf of Riga (EST-009) |
Uncertain | 0/0/1 Highest analytical limit: 40 ng/l |
Achieve | 0/0/1 Highest analytical limit: 1 µg/kg ww |
Uncertain |
| Gulf of Riga (EST-019) |
– | – | Achieve | 0/0/3 Highest analytical limit: 1 µg/kg ww |
Achieved |
| Gulf of Finland (EST-003) |
Uncertain | 0/0/2 Highest analytical limit: 40 ng/l |
Achieve | 0/0/1 Highest analytical limit: 1 µg/kg ww |
Uncertain |
| Gulf of Riga (EST-014) |
Uncertain | 0/0/1 Highest analytical limit: 39 ng/l |
Achieve | 0/0/1 Highest analytical limit: 1 µg/kg ww |
Uncertain |
| Gulf of Riga (EST-008) |
Uncertain | 0/0/1 Highest analytical limit: 39 ng/l |
– | – | Uncertain |
aGood status was achieved, if the upper 95% confidence limit concentration did not exceed the proposed threshold value of 4 ng/l bThe number of datapoints is presented as “the number of exceedances of the proposed threshold value/number of detections/number of samples” cGood status was achieved, if the upper 95% confidence limit concentration did not exceed the proposed threshold value of 1.16 µg/kg ww