 Dissolved inorganic nitrogen
2 Relevance of the indicator
Eutrophication is caused by excessive inputs of nutrients (nitrogen and phosphorus) resulting from various human activities. High concentrations of nutrients and the ratios of these nutrients (e.g. N:P stoichiometric ratios) form the preconditions for algal growth, reduced water clarity and increased oxygen consumption. Long-term nutrient data are key parameters for quantifying the effects of anthropogenic activities and evaluating the success of measures undertaken since they directly link to increased nutrient inputs.
2.1 Eutrophication assessment
The status of eutrophication is assessed using several core indicators. Each indicator focuses on one important aspect of the complex issue. In addition to providing an indicator-based evaluation of the dissolved inorganic nitrogen, this indicator contributes to the overall eutrophication assessment along with the other eutrophication core indicators.
2.2 Ecological relevance
Role of dissolved inorganic nitrogen (DIN) in the ecosystem
Marine eutrophication is mainly caused by nutrient enrichment, leading to increased production of organic matter in the Baltic Sea, with subsequent effects on water transparency, phytoplankton communities, benthic fauna and vegetation, as well as oxygen conditions. Phytoplankton as well as benthic vegetation need nutrients, mainly nitrogen and phosphorus, for growth. DIN is influenced by complex biotic processes like nitrogen fixation in surface waters by cyanobacteria – a DIN source – and microbial denitrification in oxygen depleted environments of deeper waters – a DIN sink (Figure 2),).
In a simplified conceptual model for nitrogen and phosphorus nutrients (Figure 2), flows between the different components are illustrated. To get a good understanding of the trend in nutrient concentrations in the marine environment the assessment of both, total and dissolved nutrients, is important. Dissolved inorganic nitrogen (DIN) is a major nutrient that supports primary production. Usually, it is subjected to a strong seasonality in surface water (0-10 m) with highest concentration during winter months and a rapid decline during the spring bloom until its depletion. During summer, DIN remains depleted until autumnal remineralisation activity and storm induced deeper mixing brings up DIN to surface waters. The winter concentration of DIN controls the amount of algae development during the subsequent spring bloom and is an indicator of the level of nutrients in the system. Threshold values are elaborated to allow a normal spring bloom without excess algae growth.
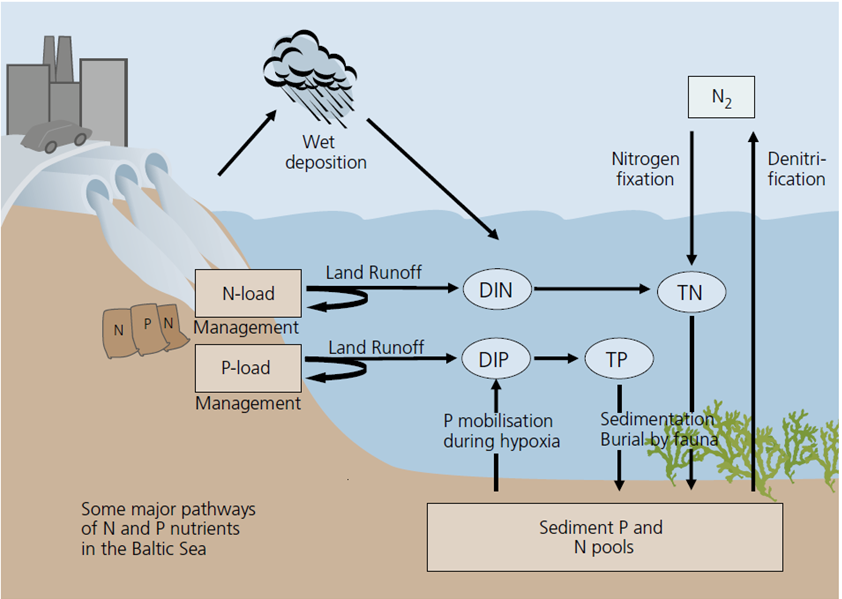
Figure 2. Simplified conceptual model for N and P nutrients in the Baltic Sea, where DIN = Dissolved inorganic nitrogen, TN = Total nitrogen, DIP = Dissolved inorganic phosphorus and TP = Total phosphorus. Flows along arrows into the blue sea area tend to increase concentrations and flows along arrows out from the sea act in the opposite direction. Management refers to nutrient load reductions.
2.3 Policy relevance
Eutrophication is one of the thematic segments of the HELCOM Baltic Sea Action Plan (BSAP). The BSAP has the strategic goal of a Baltic Sea unaffected by eutrophication (HELCOM 2021). Eutrophication is defined in the BSAP as a condition in an aquatic ecosystem where high nutrient concentrations stimulate the growth of algae, which leads to imbalanced functioning of the system. Elevated nutrient concentrations in the water column are caused by increased anthropogenic nutrient loads from land and air. The goal for eutrophication is broken down into five ecological objectives, one of which is “concentrations of nutrients close to natural levels”. The BSAP management objective is to “minimize inputs of nutrients from human activities”.
The EU Marine Strategy Framework Directive ((2008/56/EC)) requires that “human-induced eutrophication is minimized, especially adverse effects thereof, such as losses in biodiversity, ecosystem degradation, harmful algal blooms and oxygen deficiency in bottom waters” (Descriptor 5, Table 1). ‘Nutrients in the water column’ (including DIN) are one of the criteria elements in MSFD GES Decision ((EU) 2017/848) for assessing eutrophication under the criterion ‘D5C1 – Nutrient concentrations are not at levels that indicate adverse eutrophication effects’.
The EU Water Framework Directive ((2000/60/EC)) requires good ecological status in the European coastal waters. Good ecological status is defined in Annex V of the Water Framework Directive, in terms of the quality of the biological community, the hydrological and the chemical characteristics, including nitrogen concentration.
Table 1. Eutrophication links to policy.
2.3 Relevance for other assessments
This indicator is utilised in the integrated assessment of eutrophication (HEAT tool).
3 Threshold values
Status is evaluated in relation to scientifically based and commonly agreed sub-basin specific threshold value, which define the concentration that should not be exceeded (Table 2 and Table 3).
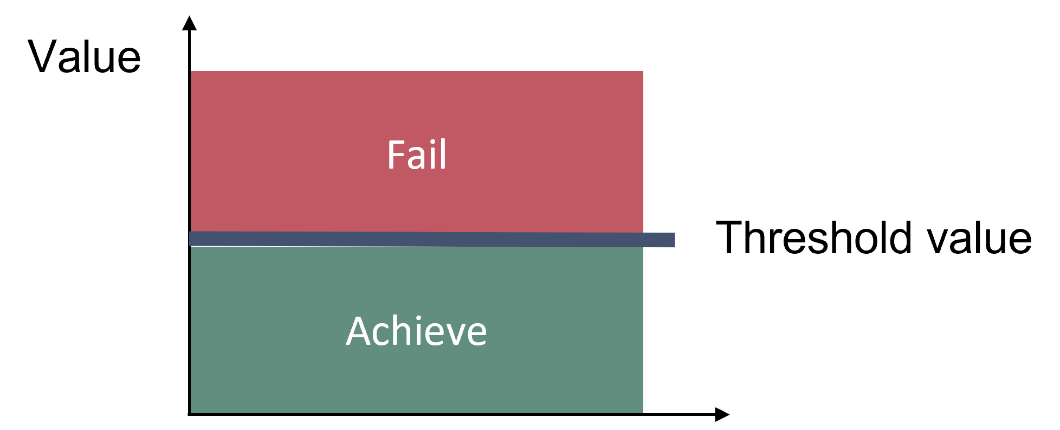
Figure 3. Schematic representation of the threshold values applied in the DIN core indicator, the threshold values are assessment unit specific (see Table 1).
3.1 Setting the threshold value(s)
Indicator threshold values were based on the results obtained in the TARGREV project (HELCOM 2013), also taking advantage of the work carried out during the EUTRO PRO process (HELCOM 2009) and national work for EU WFD. The final threshold values were set through an expert evaluation process done via intersessional activity to develop core eutrophication indicators (HELCOM CORE EUTRO), and the threshold values were adopted by the HELCOM Heads of Delegations 39/2012. The threshold values were principally not changed since HOLAS II, but for new assessment units Pomeranian Bay and the split of the Gulf of Finland into an eastern and western assessment unit new thresholds were derived using the HOLAS II thresholds as a basis and adopted by HELCOM HOD 61-2021.
Table 3. Assessment unit specific threshold values for the DIN core indicator.
| HELCOM_ID | Assessment unit (open sea) | Threshold value (μmol L−1) |
| SEA-001 | Kattegat | 5.0 |
| SEA-002 | Great Belt | 5.0 |
| SEA-003 | The Sound | 3.3 |
| SEA-004 | Kiel Bay | 5.5 |
| SEA-005 | Bay of Mecklenburg | 4.3 |
| SEA-006 | Arkona Basin | 2.9 |
| SEA-007 | Bornholm Basin | 1.8 |
| SEA-007B | Pomeranian Bay | 5.5 |
| SEA-008 | Gdansk Basin | 4.2 |
| SEA-009 | Eastern Gotland Basin | 2.6 |
| SEA-010 | Western Gotland Basin | 2.0 |
| SEA-011 | Gulf of Riga | 5.2 |
| SEA-012 | Northern Baltic Proper | 2.9 |
| SEA-013A | Gulf of Finland Western | 3.3 |
| SEA-013B | Gulf of Finland Eastern | 4.3 |
| SEA-014 | Åland Sea | 2.7 |
| SEA-015 | Bothnian Sea | 2.8 |
| SEA-016 | The Quark | 3.7 |
| SEA-017 | Bothnian Bay | 5.2 |
4 Results and discussion
The results of the indicator evaluation underlying the key message map and information are provided below.
4.1 Status evaluation
Current status of the Baltic Sea DIN concentration
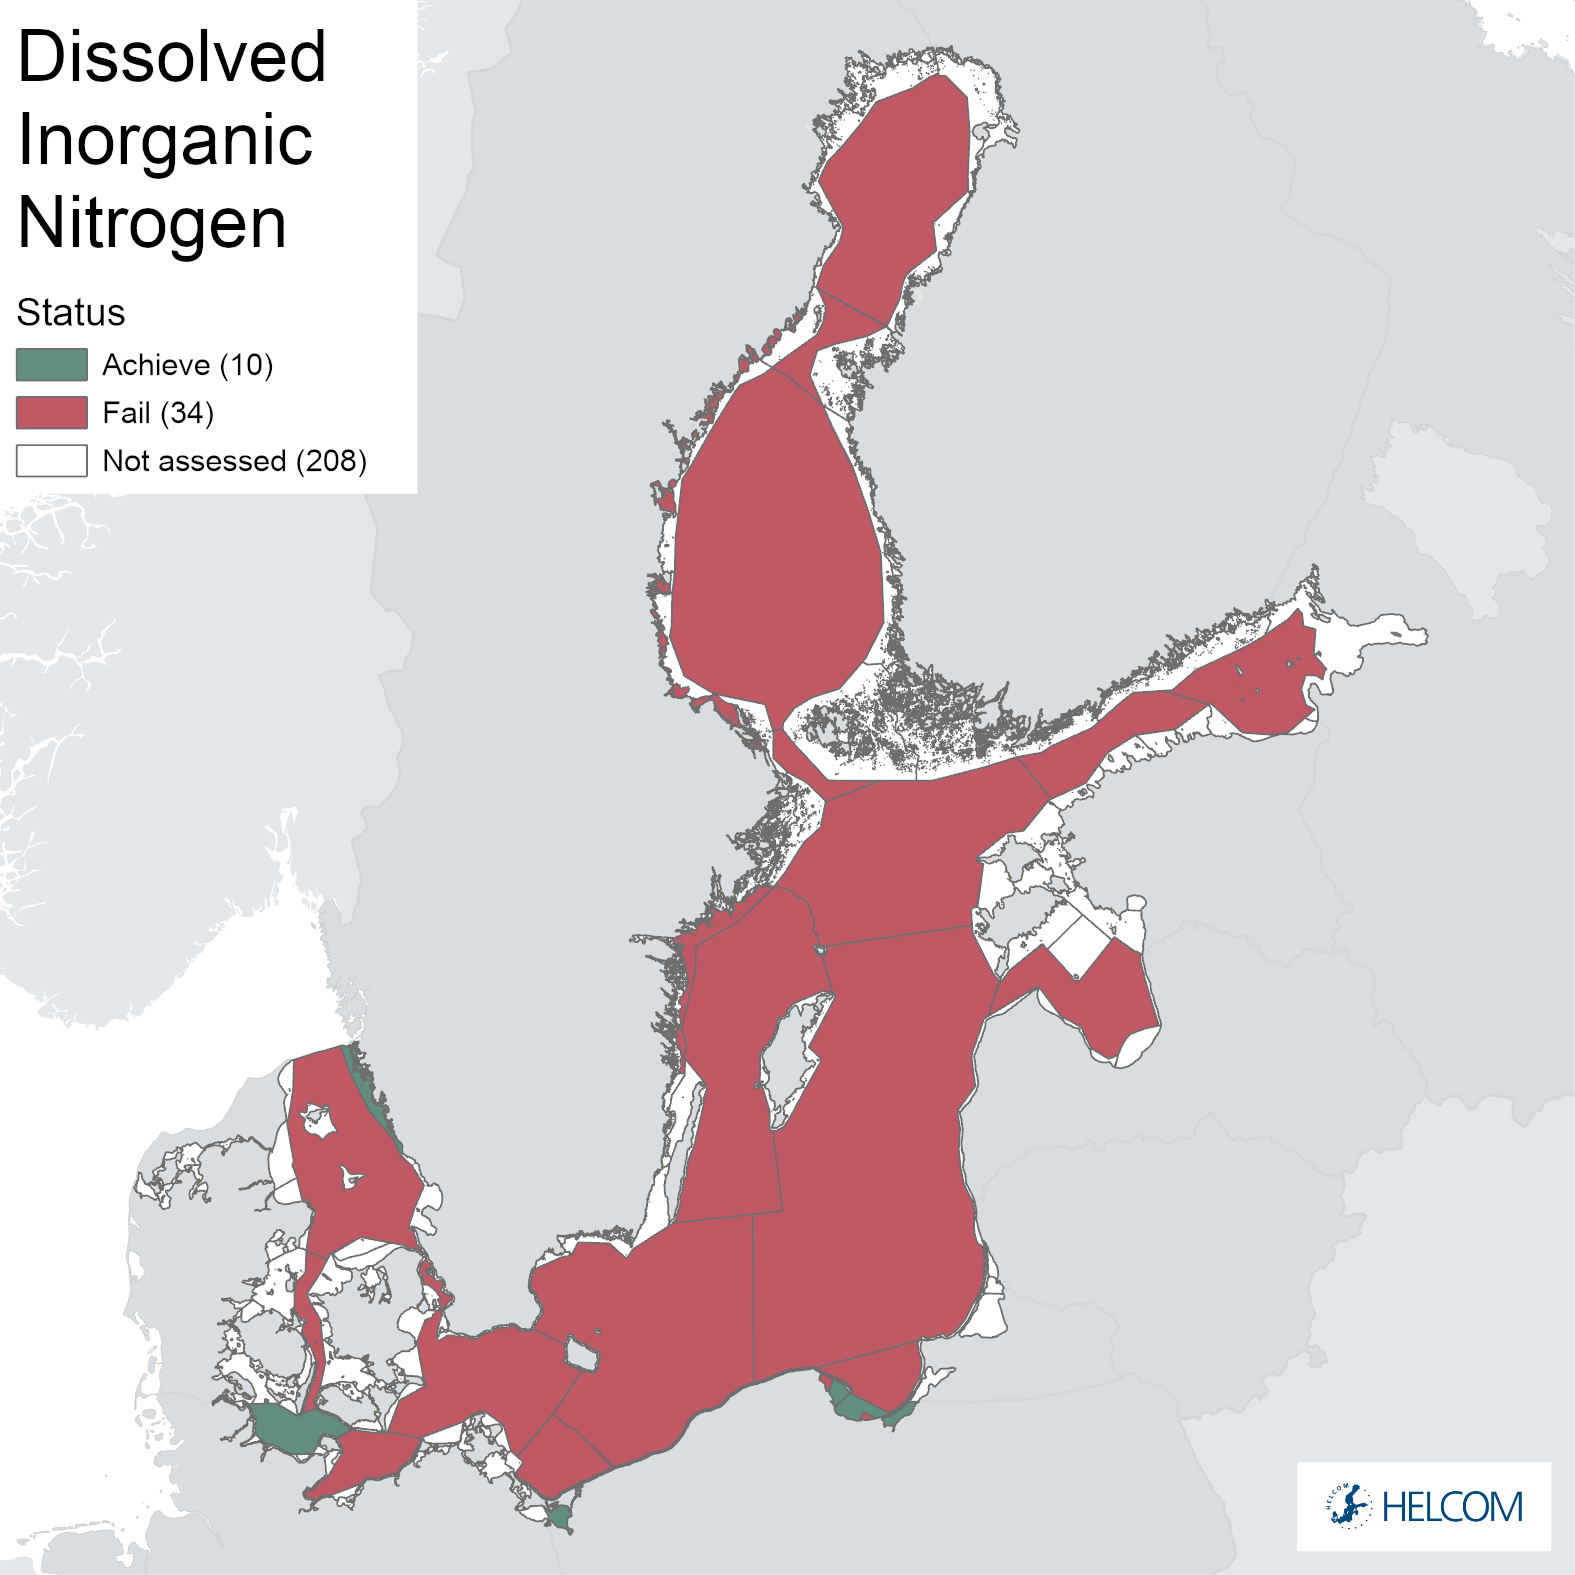
A concentration of DIN below the threshold was achieved only in the assessment unit Kiel Bay (Figure 4 and Table 4). Accordingly, the scaled Ecological quality ratio (EQRS) was 0.76 for Kiel Bay, resulting in achieving good status. In the remaining 18 sub-basins the threshold value was failed, resulting in a not good status. The Kattegat and Bay of Mecklenburg showed a very minor exceedance of the threshold value (<10%) with EQRS values of 0.58, while the Great Belt showed a minor exceedance (10-15%) with an EQRS value of 0.52. In The Sound, Gdansk Basin, Eastern and Western Gotland Basin and Northern Baltic Proper DIN concentrations exceeded the threshold by more than 50%, with EQRS values below 0.30, indicating poor or even bad status. Even larger exceedances of >100% were found in the Gulf of Finland Western, Gulf of Riga and Bornholm Basin and in the Pomeranian Bay the exceedance was larger than 400% (EQRS 0.14). Hence the Central Baltic Sea, Gulf of Finland and Gulf of Riga require the largest reductions in DIN concentrations, while the Western Baltic Sea basins approach good status, or, in case of Kiel Bay, have already achieved it.
The variability of the DIN concentrations between the individual assessment years is shown in Figure 5. The variability was largest in the Pomeranian Bay, indicating the strong influence of the Odra river plume and its variability in nitrogen loads. In general, smaller assessment units that are more strongly influenced by riverine nutrient inputs and have higher DIN concentrations were showing a larger variability of DIN concentrations between the years. In Kiel Bay DIN concentrations still exceeded the threshold value in 2016, but were well below the threshold from 2017 to 2020 and very close to the threshold in 2021.
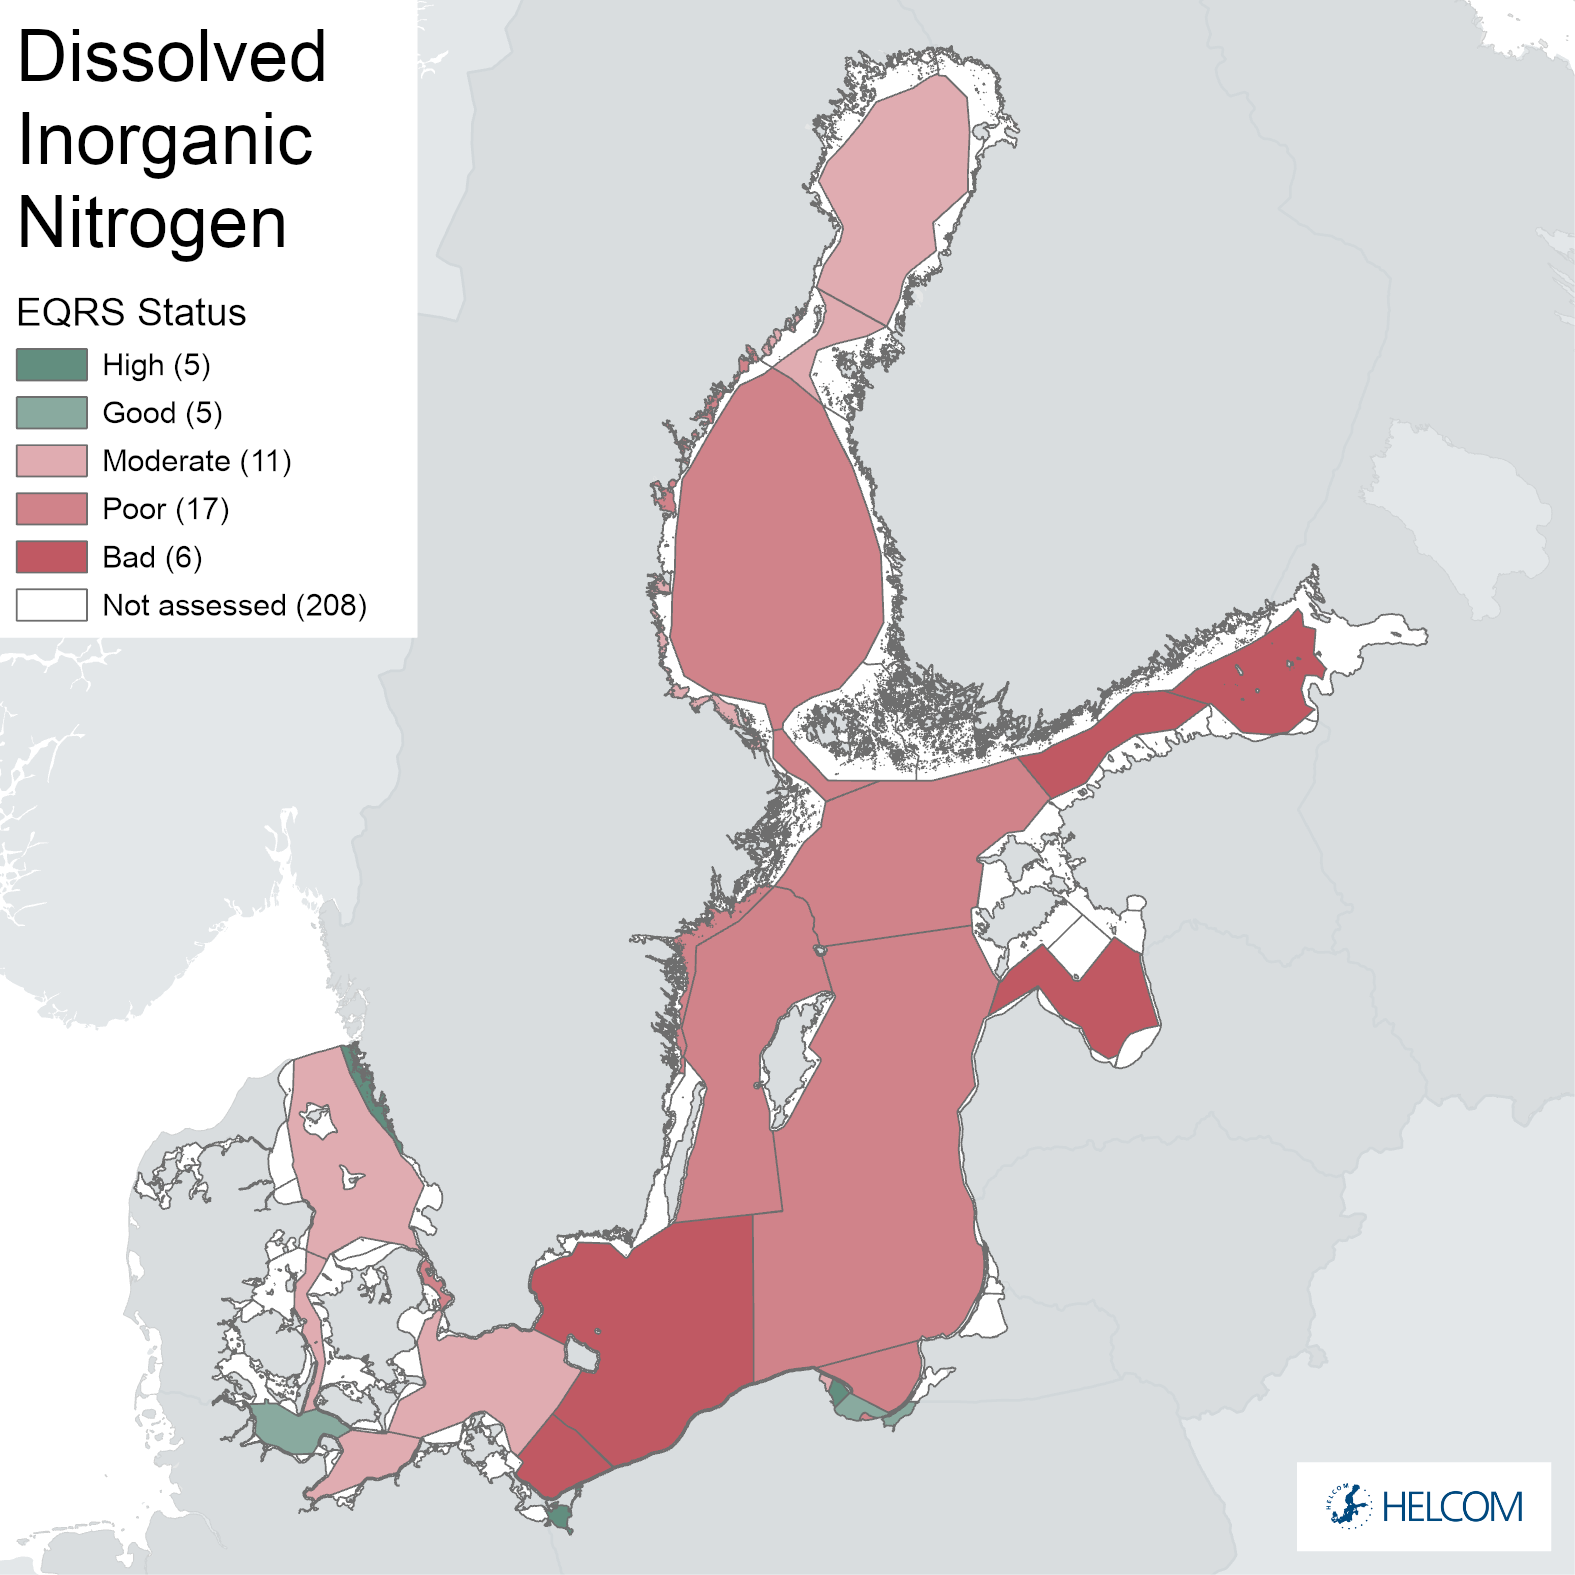
Figure 4. Detailed Dissolved Inorganic Nitrogen (DIN) assessment with the ecological quality ratio scaled (EQRS). EQRS of DIN being split into 5 classes to show a more differentiated picture than the 2-class division used in the key message figures. EQRS is calculated as the ratio of the average concentration during assessment period and the reference value, decreasing along with increasing eutrophication. When EQRS ≥ 0.6 good status is achieved.
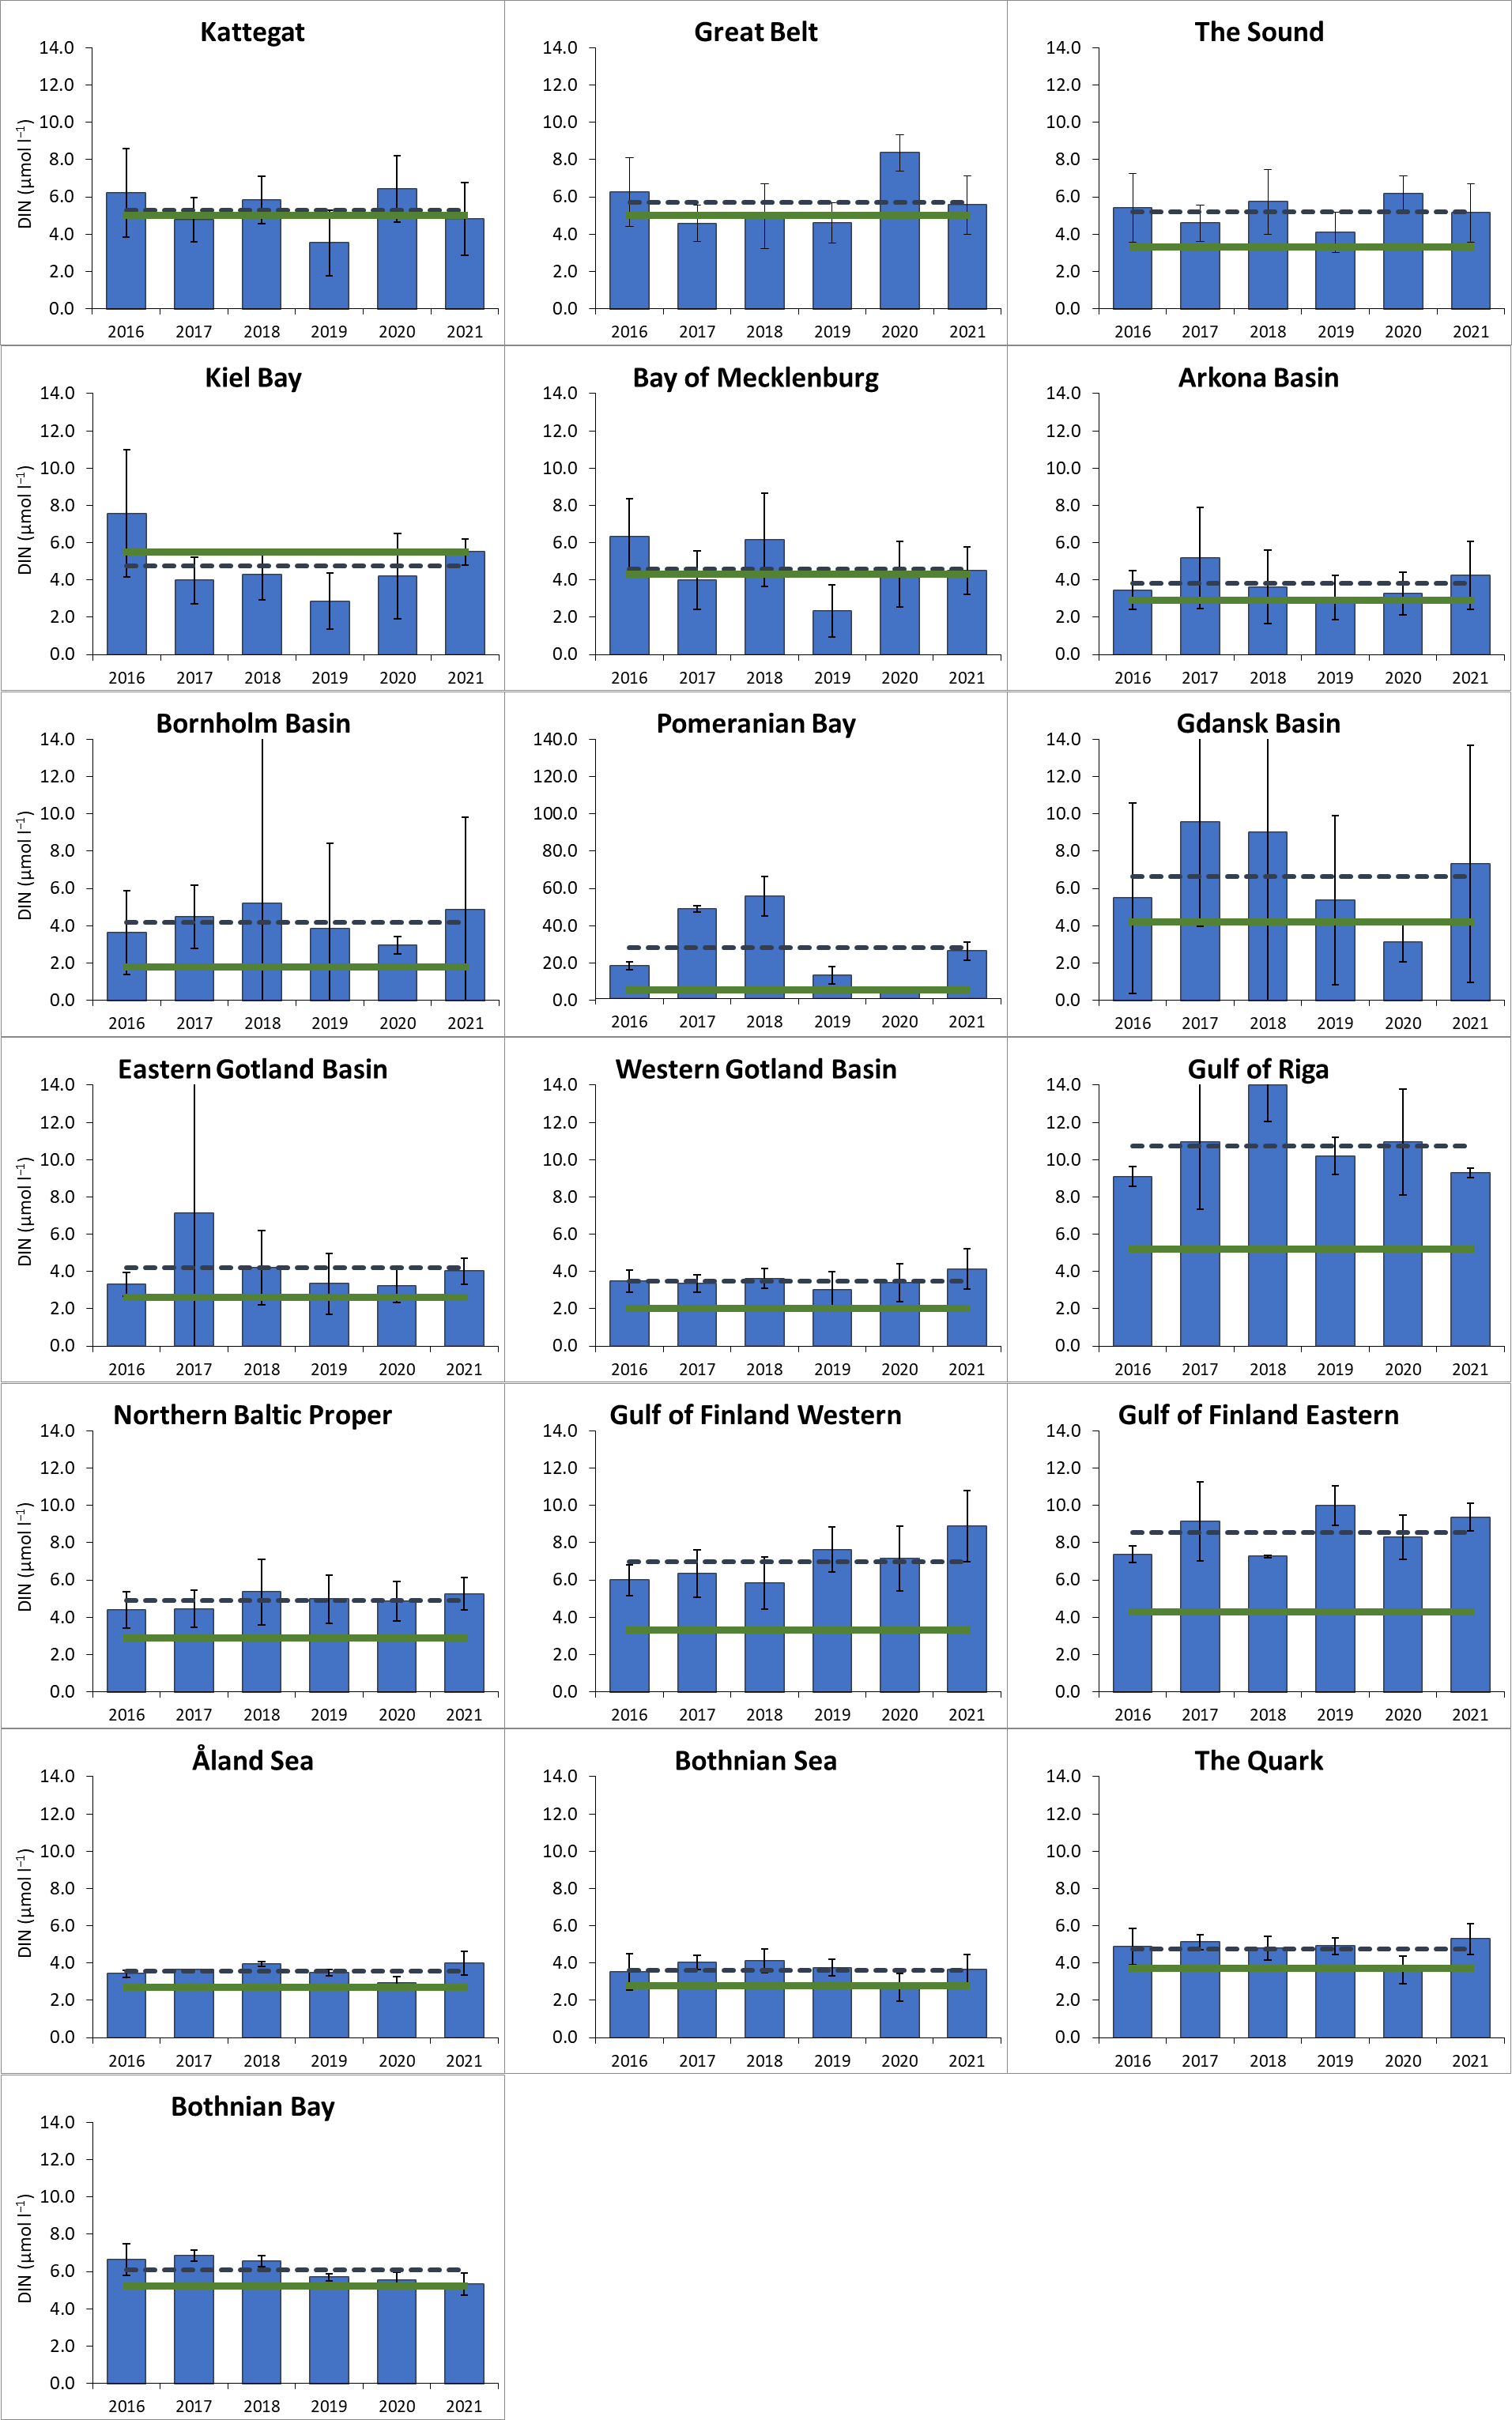
Figure 5. Winter Dissolved Inorganic Nitrogen (DIN) concentrations (dashed dark blue line; average for 2016-2021) in µmol L-1 and threshold levels as agreed by HELCOM HOD 39-2012 (green line) for assigned Assessment Units (AU). Note that the Pomeranian Bay uses a different scale than the other graphs.
Table 4. Threshold values, present concentration (as average 2016-2021), Ecological quality ratio scaled (EQRS) and status of dissolved inorganic nitrogen in the open-sea basins. EQRS is calculated as the ratio of the average concentration during the assessment period and the reference value.
| Assessment unit (open sea) | Threshold value (μmol l-1) | Average 2016-2021 (μmol l-1) | Ecological quality ratio (scaled) (EQRS) | STATUS (fail/achieve threshold value) |
| Kattegat | 5.00 | 5.26 | 0.58 | Fail |
| Great Belt | 5.00 | 5.72 | 0.52 | Fail |
| The Sound | 3.30 | 5.19 | 0.27 | Fail |
| Kiel Bay | 5.50 | 4.73 | 0.76 | Achieve |
| Bay of Mecklenburg | 4.30 | 4.60 | 0.58 | Fail |
| Arkona Basin | 2.90 | 3.80 | 0.40 | Fail |
| Bornholm Basin | 1.80 | 4.16 | 0.16 | Fail |
| Pomeranian Bay | 5.53 | 28.31 | 0.14 | Fail |
| Gdansk Basin | 4.20 | 6.64 | 0.36 | Fail |
| Eastern Gotland Basin | 2.60 | 4.20 | 0.31 | Fail |
| Western Gotland Basin | 2.00 | 3.50 | 0.21 | Fail |
| Gulf of Riga | 5.20 | 10.74 | 0.17 | Fail |
| Northern Baltic Proper | 2.90 | 4.88 | 0.23 | Fail |
| Gulf of Finland Western | 3.30 | 6.97 | 0.17 | Fail |
| Gulf of Finland Eastern | 4.30 | 8.57 | 0.18 | Fail |
| Åland Sea | 2.70 | 3.57 | 0.38 | Fail |
| Bothnian Sea | 2.80 | 3.63 | 0.40 | Fail |
| The Quark | 3.70 | 4.76 | 0.40 | Fail |
| Bothnian Bay | 5.20 | 6.10 | 0.47 | Fail |
Concerning the coastal waters DIN was assessed only in 19 Polish and four Swedish water bodies, since most Contracting Parties assess total nitrogen instead of DIN under the Water Framework Directive. In the Swedish coastal waters only one water body situated in the Kattegat achieved good status, while in Polish coastal waters seven water bodies situated in the Gdansk Basin, Bornholm Basin and Eastern Gotland Basin achieved good status. There were a number of cases where a good status of coastal water bodies was assessed adjacent to open sea basins that had a moderate or worse status. This could be due to a lack of alignment of threshold values between coastal waters and open sea basins (Annex – Table 1).
4.2 Trends
Long-term trends
Long-term temporal trends allow to evaluate the actual six-year assessment period in its annual changes compared to previous evaluation periods and to previous decades. Moreover, they provide an impression of what can be expected for the near future and perhaps when thresholds will be met or concentrations fall below the thresholds in the future. Data of DIN winter concentration are presented for all assessment units for the extended time period of 50 years in Results figure 3, with the exception of the Gulf of Riga, where DIN data are only available since 1990, and considerable data gaps in the Pomeranian Bay before 1985. Significant improving trends (decreasing DIN concentrations) since the 1990s were documented for 11 assessment units (Great Belt, The Sound, Kiel Bay, Bay of Mecklenburg, Arkona Basin, Eastern Gotland Basin, Western Gotland Basin, Gulf of Finland eastern, Bothnian Sea, Bothnian Bay and The Quark). Gulf of Riga, Gdansk Basin and Pomeranian Bay showed high inter-annual variability. None of the assessment units showed a significantly deteriorating trend (increasing DIN concentrations). These trends indicate that DIN concentrations are mainly improving in the Western and Northern Baltic Sea areas while concentrations are either stable or highly variable in the central Baltic Sea.
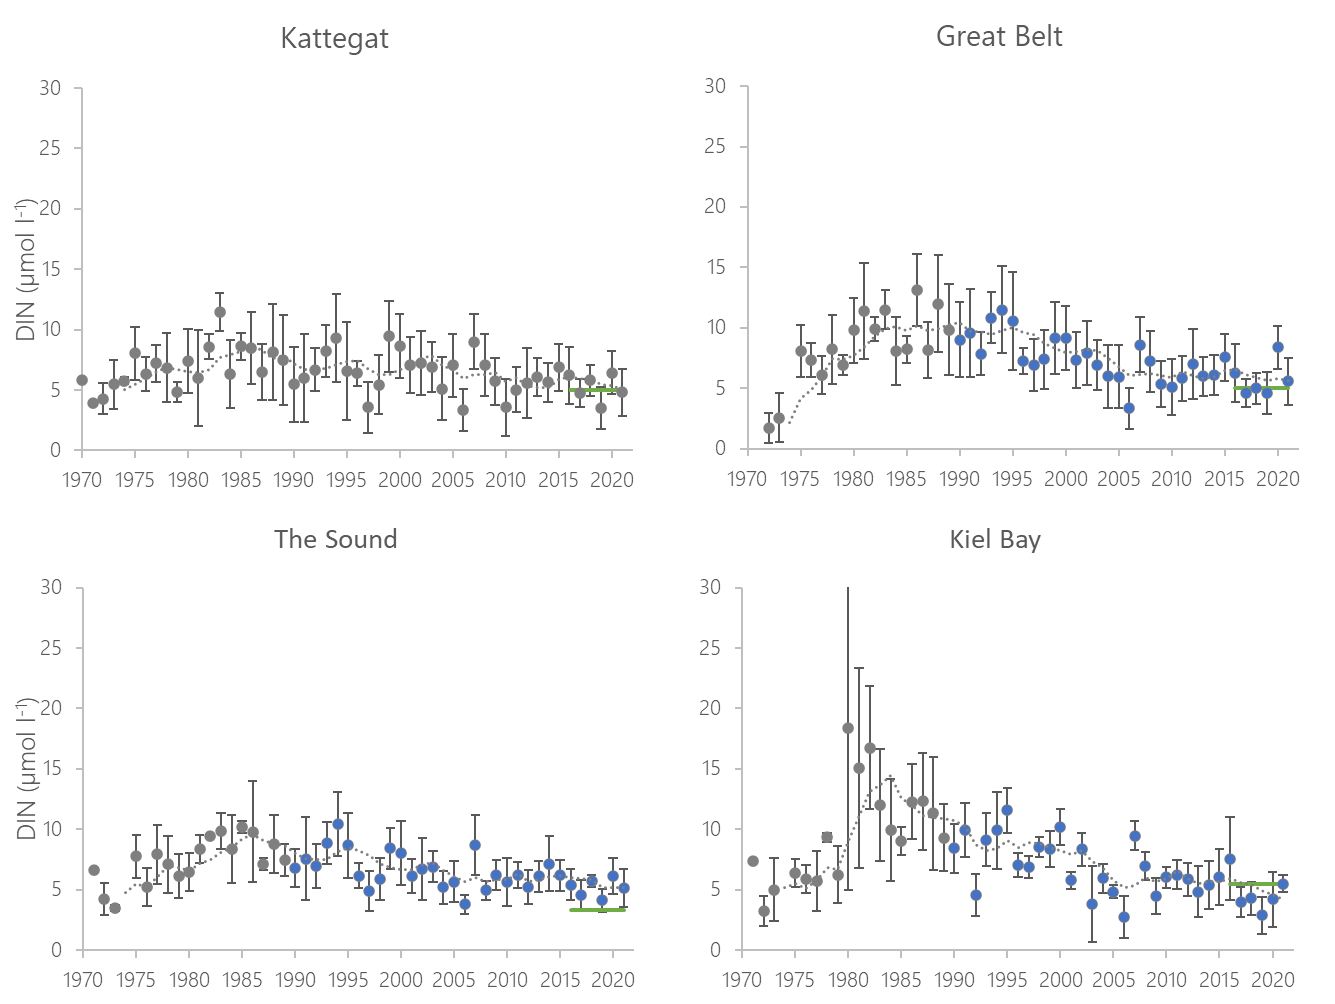
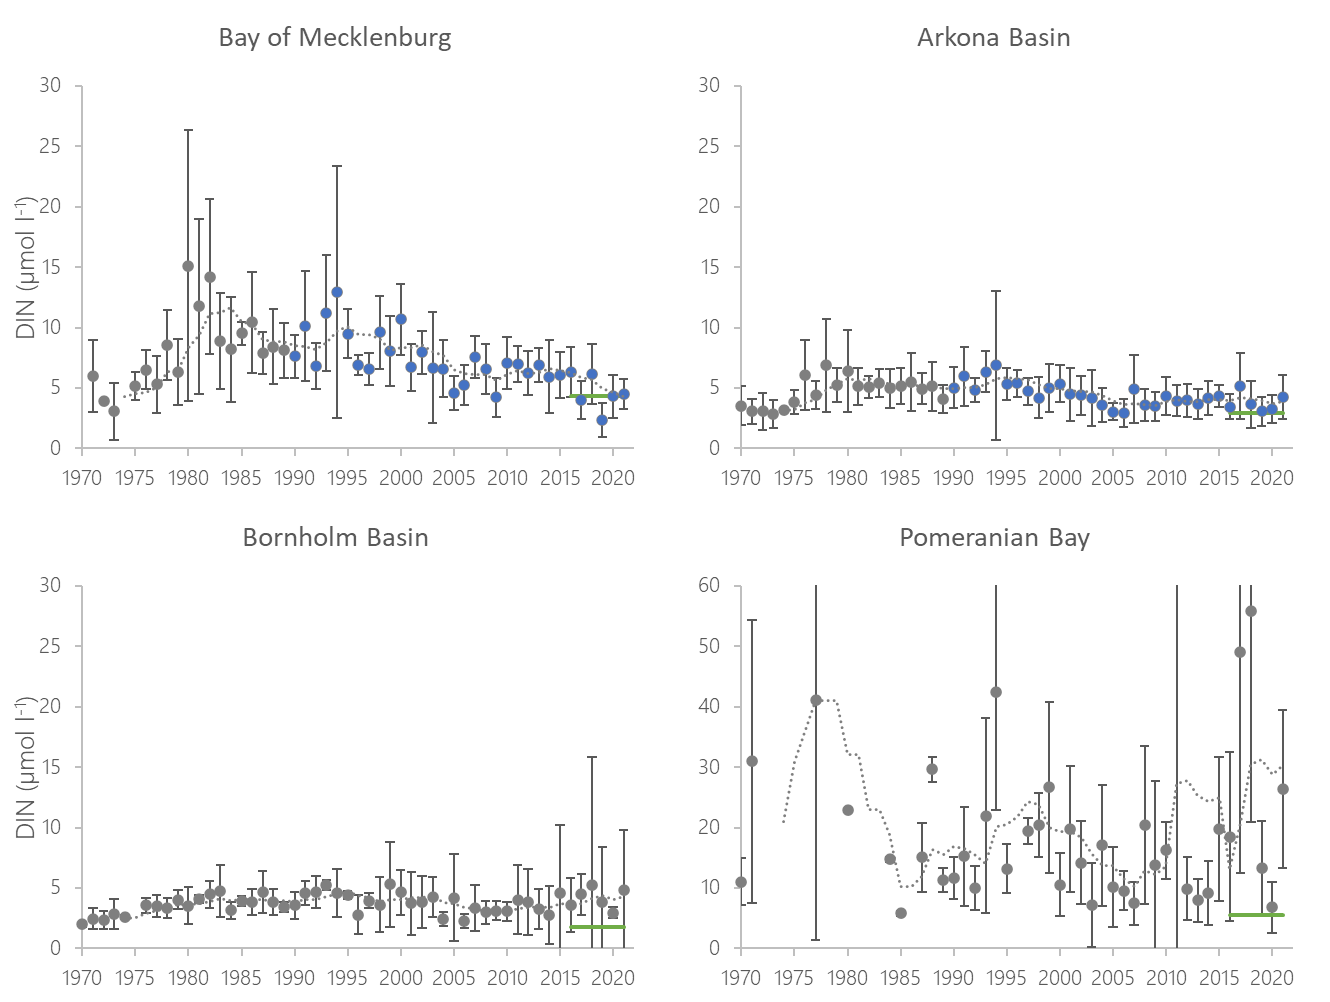
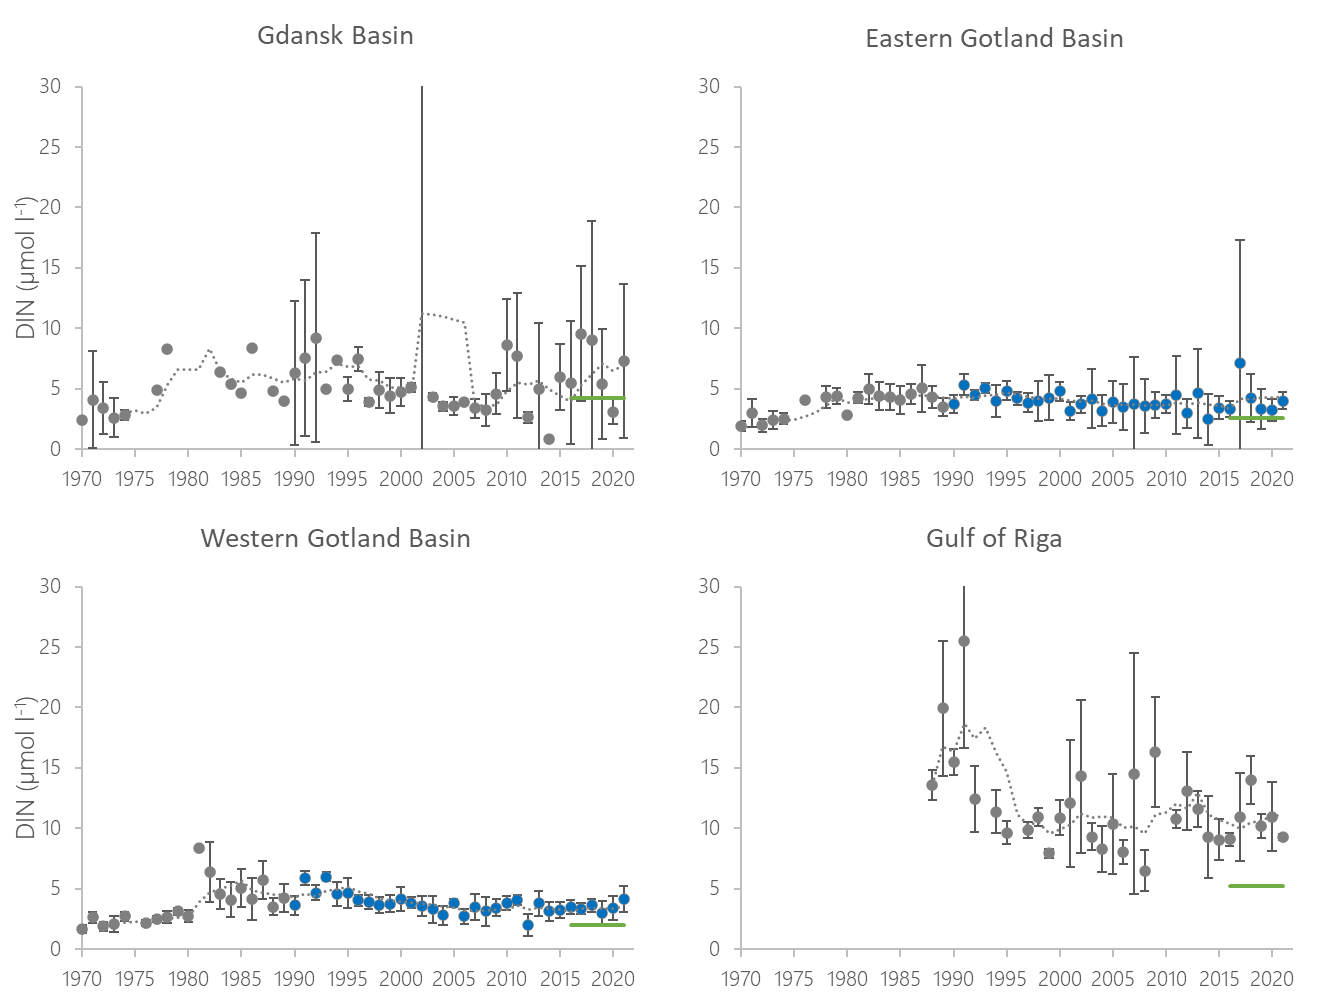
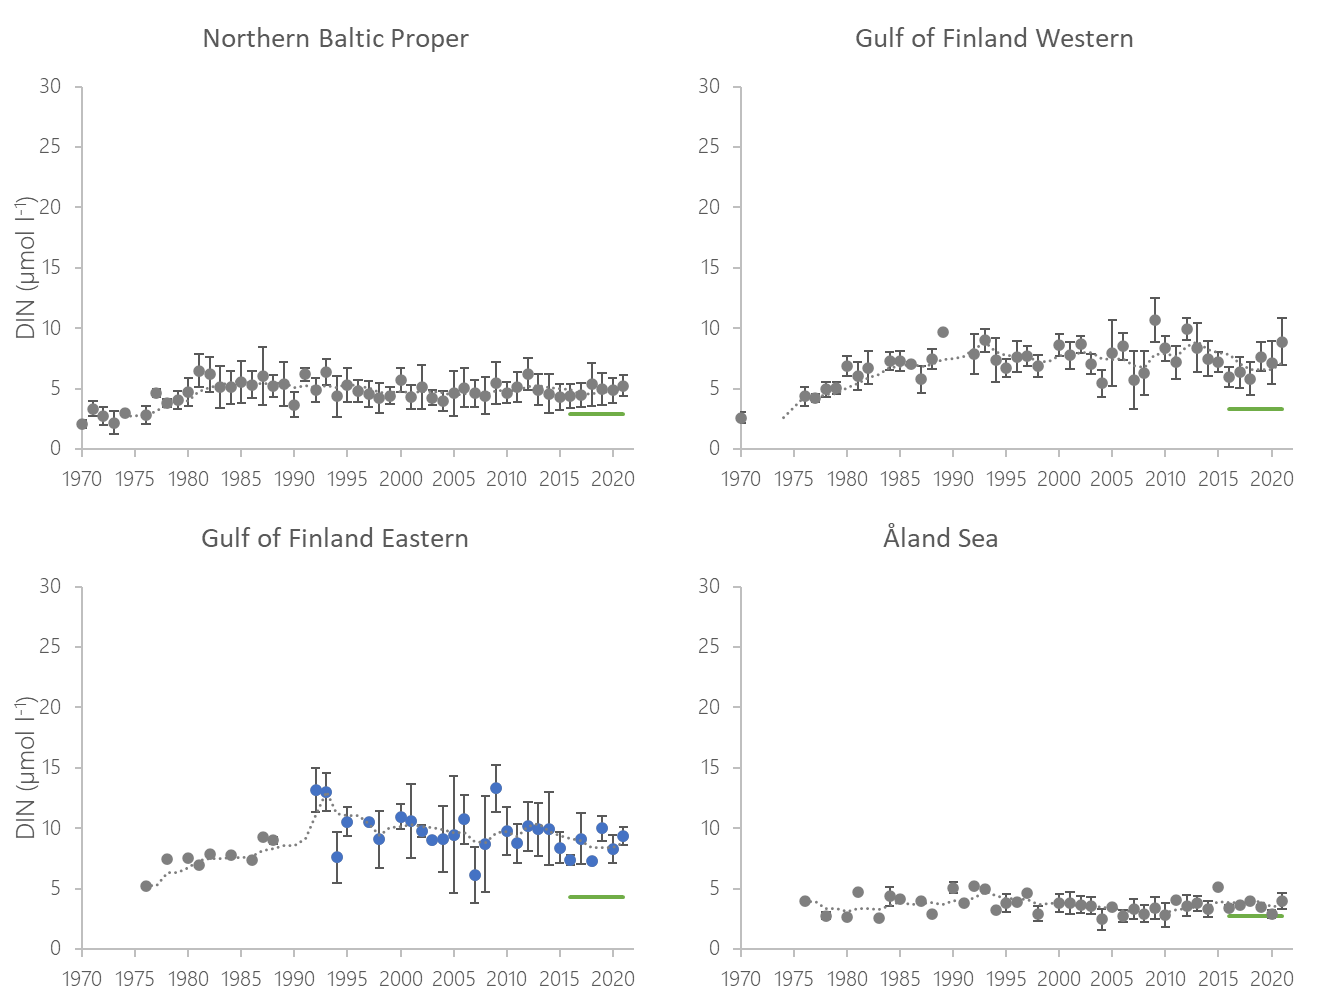
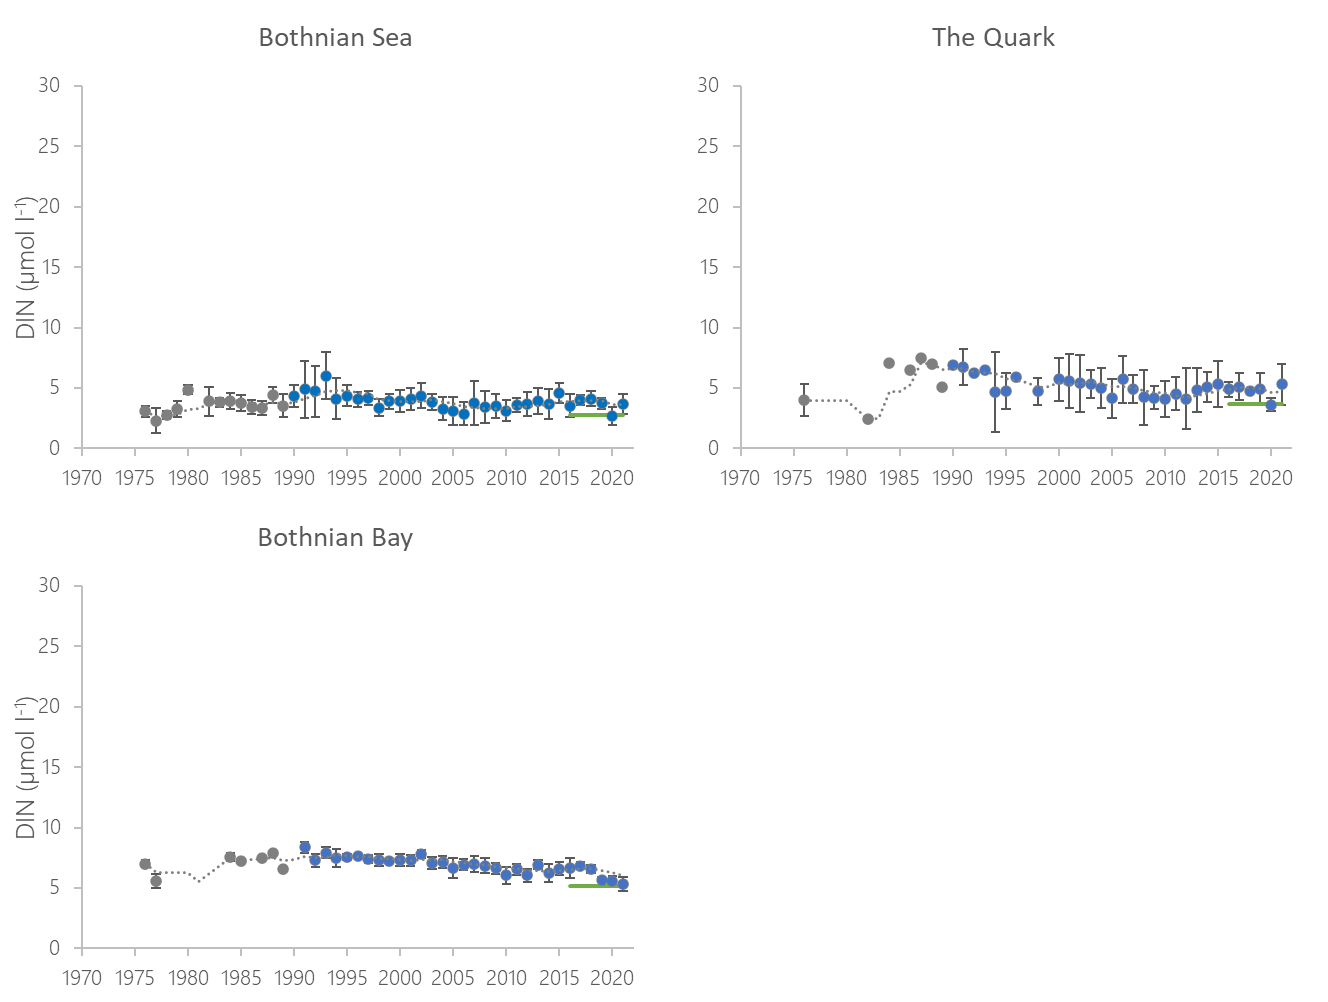
Figure 6. Temporal development of winter dissolved inorganic nitrogen (DIN) concentrations in the open-sea assessment units in 1970-2021. Dashed lines show the five-year moving averages and error bars the standard deviation. Green lines denote the indicator threshold. Significance of trends was assessed with Mann-Kendall non-parametric tests for the period from 1990-2021. Significant (p<0.05) improving trends are indicated with blue data points. No significant deteriorating trends were detected. Note that the Pomeranian Bay Y-axis is doubled that of the others.
4.3 Discussion text
Assessment results for DIN concentrations (as EQRS values) were compared between the latest two assessments of HOLAS II and HOLAS 3 (Table 5). Kiel Bay was the only basin that changed its status from failing good status in HOLAS II to achieving good status in HOLAS 3. Four Western Baltic Sea basins showed an improving status with increasing EQRS values (i.e. decreasing DIN concentrations meaning further improvement) (Kattegat, Great Belt, The Sound, Bay of Mecklenburg), while 11 basins showed a stable status (within 15% change between HOLAS II and HOLAS 3). The status was deteriorating with decreasing EQRS values in three basins –Gdansk Basin and Western and Eastern Gotland Basin.
Concerning trend assessments it can be summarised that the Western Baltic Sea shows significant improvements, with Kiel Bay having already achieved good status and the other basins approaching it. In the Northern Baltic Sea, there are significantly improving long-term trends but since 2011 DIN concentrations have remained stable and although they are close to good status it is not certain whether it can be reached soon. The status of DIN remains problematic in the central Baltic Sea, with many assessment areas having DIN concentrations well above the threshold values and with no significant long-term trends and a deterioration between the latest two assessments and altogether a high inter-annual variability of DIN concentrations probably reflecting the varying influence of nutrient-rich river plumes.
Table 5. Comparison of DIN EQRS values between HOLAS II and HOLAS 3 (colored red or green depending on whether the assessment unit achieves or fails to achieve good status) and a description of the trend observed (distinct change when >15%).
| HELCOM Assessment Unit name | HOLAS II 2011-2016 (EQRS) | HOLAS 3 2016-2021 (EQRS) | Distinct trend between current and previous assessment. |
| Kattegat | 0.46 | 0.58 | Distinct improving change |
| Great Belt | 0.40 | 0.52 | Distinct improving change |
| The Sound | 0.20 | 0.27 | Distinct improving change |
| Kiel Bay | 0.54 | 0.76 | Distinct improving change |
| Bay of Mecklenburg | 0.29 | 0.58 | Distinct improving change |
| Arkona Basin | 0.36 | 0.40 | No distinct change |
| Bornholm Basin | 0.18 | 0.16 | No distinct change |
| Pomeranian Bay | 0.16 | 0.14 | No distinct change |
| Gdansk Basin | 0.56 | 0.36 | Distinct deteriorating change |
| Eastern Gotland Basin | 0.39 | 0.31 | Distinct deteriorating change |
| Western Gotland Basin | 0.28 | 0.21 | Distinct deteriorating change |
| Gulf of Riga | 0.18 | 0.17 | No distinct change |
| Northern Baltic Proper | 0.23 | 0.23 | No distinct change |
| Gulf of Finland Western | 0.15 | 0.17 | No distinct change |
| Gulf of Finland Eastern | 0.17 | 0.18 | No distinct change |
| Åland Sea | 0.33 | 0.38 | No distinct change |
| Bothnian Sea | 0.35 | 0.40 | No distinct change |
| The Quark | 0.39 | 0.40 | No distinct change |
| Bothnian Bay | 0.41 | 0.47 | No distinct change |
5 Confidence
The overall confidence of the indicator is based on the temporal confidence, spatial confidence and accuracy of the monitoring data for the assessment period 2016-2021 carried out in the HEAT tool. In general, the aspect of temporal coverage of monitoring data considers the confidence of the indicator in terms of its year-to-year variation and the continuity of observations during the indicator-specific assessment seasons (winter, growing season). The general temporal confidence (GTC) is assessed based on the number of annual observations during the assessment period, whereas for the specific temporal confidence (STC) the number of missing months in the respective assessment seasons of the different indicators determines the classification. The specific spatial confidence (SSC) evaluates the spatial representability of the monitoring data and is based on a gridded approach. Lastly, the accuracy confidence (ACC) indicates how certain the assessment is in relation to the variability of the data to estimate the probability of correct classification in terms of failing or achieving good status. To combine the different confidence assessments GTC and STC are averaged to an overall result for temporal confidence and this result is then averaged with SSC and subsequently combined with ACC to obtain a result for the indicator.
The overall confidence of the indicator status evaluation in open sea areas, based on the spatial and temporal coverage of data and the accuracy of the classification results was high in the Kattegat, Kiel Bay, Bay of Mecklenburg, Arkona Basin, Bornholm Basin, Eastern Gotland Basin, Northern Baltic Proper and Bothnian Sea. The overall confidence was low in the Gulf of Riga, Gulf of Finland Eastern and the Åland Sea and it was moderate in The Sound, Great Belt, Pomeranian Bay, Gdansk Basin, Western Gotland Basin, Gulf of Finland Western, Bothnian Bay and The Quark (Figure 7). Looking at the different components of the overall confidence assessment separately, the accuracy of the assessment was high for all assessment units indicating correct classifications with a probability >90% even for those basins that were close to the threshold value. Selected assessment units showed a moderate to low temporal confidence and the spatial confidence was overall assessed to be worst, with a larger number of assessment units showing a moderate or low spatial confidence, necessitating an increase and better spread of monitoring stations (see Figure 8). High spatial confidence was only achieved in the Kattegat, Bay of Mecklenburg, Arkona Basin and Bornholm Basin. Confidence was assessed in all open sea assessment units, but not in coastal waters.
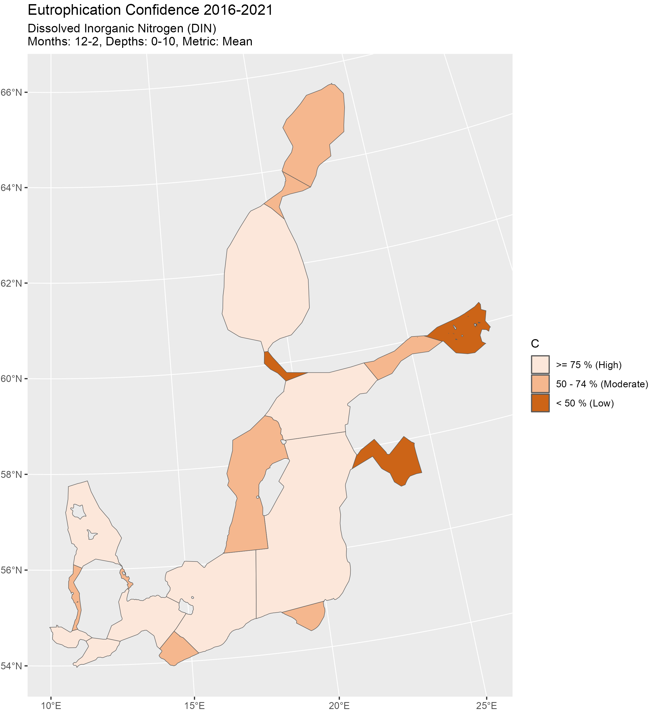
Figure 7. Overall indicator confidence, determined by combining information on data availability and the accuracy of the classification for failing or achieving good status. Low indicator confidence calls for increase in monitoring.
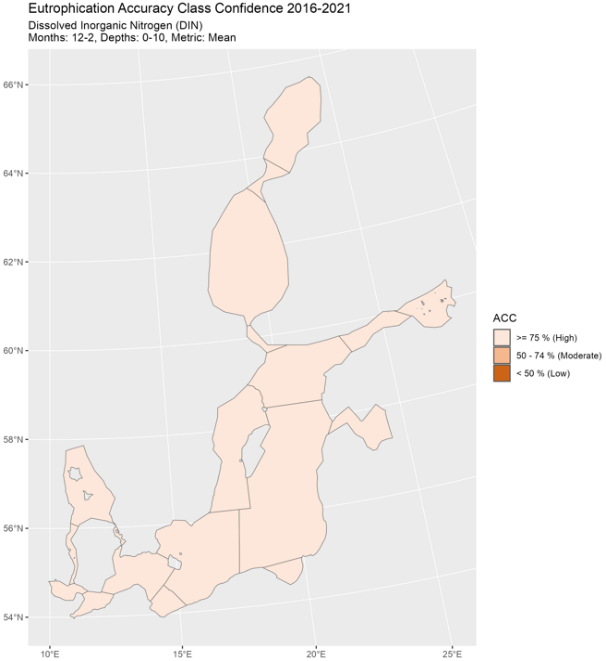
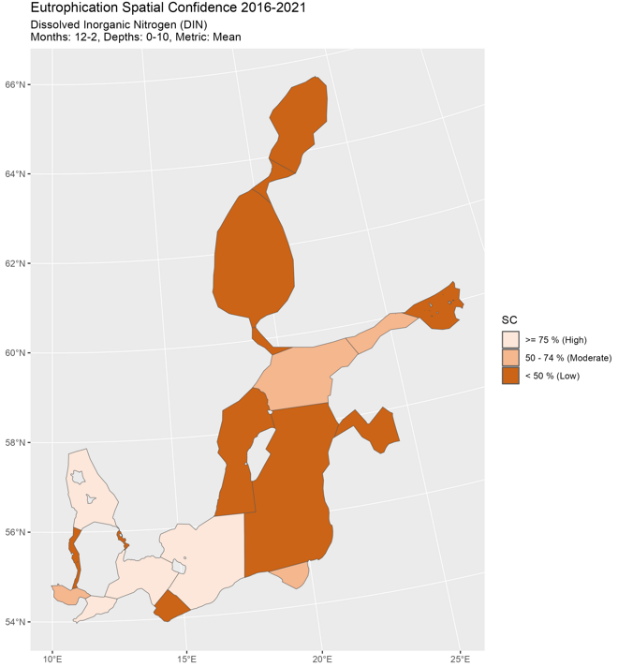
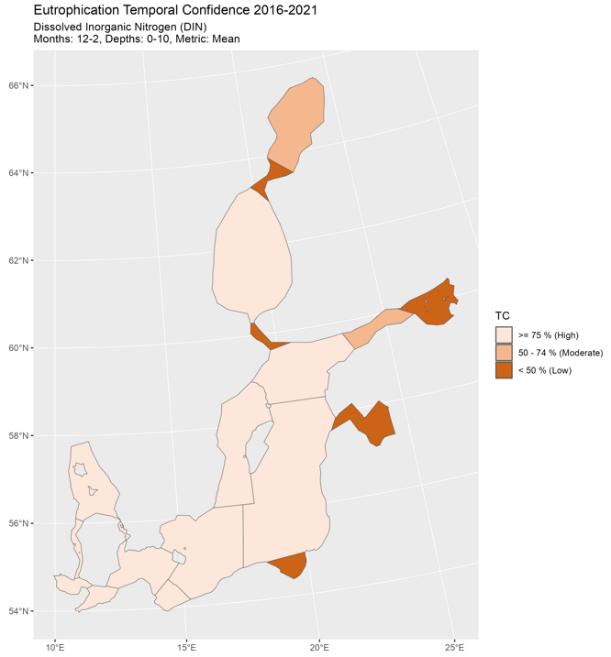
Figure 8: Confidence maps for accuracy class confidence (ACC), spatial confidence (SC) and temporal confidence (TC).
6 Drivers, Activities, and Pressures
For HOLAS 3 initial work has been carried out to explore Drivers (and driver indicators) to evaluate how such information can be utilised within such management frameworks as DAPSIM. Although it is recognised as only addressing a small portion of the drivers (via proxies) of relevance for eutrophication wastewater treatment (Drivers and driver indicators for Wastewater Treatment) and agriculture (Drivers and driver indicators for Agricultural Nutrient Balance) have been explored in these pilot studies for HOLAS 3.
Nutrient concentrations in the water column are affected by increased anthropogenic nutrient loads from land and air. Diffuse sources constitute the highest proportion of total nitrogen (nearly 50%) inputs to the Baltic Sea (HELCOM 2022). For total nitrogen, atmospheric deposition on the sea has the second highest share (24%) followed by natural background loads (20%) and point sources (9%). Point sources include activities such as municipal wastewater treatment plants, industrial plants and aquacultural plants and diffuse sources consist of anthropogenic sources such as agriculture, managed forestry, scattered dwellings, storm water etc.
A significant reduction of nutrients input has been achieved for the whole Baltic Sea. The normalized total input of nitrogen was reduced by 12% between the reference period (1997-2003) and 2020 (HELCOM 2023). The maximum allowable input (MAI) of nitrogen in this period was fulfilled in the Bothnian Bay, Bothnian Sea, Danish Straits and Kattegat. This has, however, not yet resulted in a good status of DIN concentrations in these basins, as demonstrated in this indicator assessment, indicating the delay in recovery processes from eutrophication and possibly the effects of internal nitrogen loads (Gustafsson et al 2012).
Further developing an overview of such components and the relevant data to be able to better quantify the linkages within a causal framework provide the opportunity for more informed management decisions, for example targeting of measures, and can thereby support the achievement of Good Environmental Status. This indicator itself addresses the status and a number of other status indicators as well as an indicator for the input of nutrients to the Baltic Sea (i.e. pressures) exist, thus an improved understanding of the relevant components related to drivers and activities (their data sources and how to evaluate them) can significantly improve the overall understanding of eutrophication and appropriate management of the issue.
Table 6. Brief summary of relevant pressures and activities with relevance to the indicator.
| | General | MSFD Annex III, Table 2a |
| Strong link | Substances, litter and energy
– Input of nutrients – diffuse sources, point sources, atmospheric deposition |
|
| Weak link |
7 Climate change and other factors
The current knowledge of the effects of climate change to eutrophication is summarized in the HELCOM climate change fact sheet (HELCOM and Baltic Earth 2021). The effect of climate change on the nutrient pools is not yet separable from the other pressures, and the future nutrient pools will dominantly be affected by the development of nutrient loading. The phytoplankton growth season has already prolonged due to changes in cloud cover and stratification. Climate change is, with medium confidence, considered to increase the stratification, further deteriorate near-bottom oxygen conditions, and increase the internal nutrient loading (Gustafsson et al. 2012). Climate change also leads to a higher variability in riverine nutrient inputs, with an increase of floods and droughts. Such extreme events might have a direct impact on the nutrient concentrations in the Baltic Sea.
8 Conclusions
The status evaluation fails to achieve good status in all assessed sub-basins except for Kiel Bay.
8.1 Future work or improvements needed
A better harmonisation of the thresholds for DIN between coastal waters and the open Baltic Sea Basins might be necessary in the future, in particular in areas where coastal waters are already assessed as achieving good status while the open basins still fail to achieve good status, since such a gradient would not be expected to occur assuming that high nutrient concentrations are mainly caused by riverine nutrient inputs. In addition, a better understanding needs to be developed on how winter nutrient concentrations react to ongoing climate change and how they are influenced by extreme hydrological events (floods, droughts). Lastly, the interlinkages between nitrogen inputs and nitrogen concentrations in the sea also need to be better understood.
9 Methodology
9.1 Scale of assessment
The core indicator is applicable in the 19 open sea assessment units (at least one nautical mile seawards from the baseline). In the coastal units, the indicator is assessed using comparable indicators developed nationally for the purposes of assessments under the EU Water Framework Directive, including their respective threshold values.
The assessment units are defined in the HELCOM Monitoring and Assessment Strategy Annex 4.
9.2 Methodology applied
For the open sea assessment, this core indicator is updated using data reported by Contracting Parties to the HELCOM COMBINE database hosted by ICES, using the algorithms developed for the eutrophication assessment work flow. The values are achieved using indicators specifications shown in Table 7 (see HELCOM Eutrophication assessment manual).
Table 7. Specifications for the DIN indicator.
| Indicator | DIN | ||||||||||||||||||||||||||||
| Response to eutrophication | Positive | ||||||||||||||||||||||||||||
| Parameters | DIN = NO2 + NO3 + NH4 concentration (μmol/) | ||||||||||||||||||||||||||||
| Data source | Monitoring data provided by the HELCOM Contracting Parties, and kept in the HELCOM COMBINE database, hosted by ICES (www.ices.dk) | ||||||||||||||||||||||||||||
| Assessment period (test assessment) | 2016-2021 | ||||||||||||||||||||||||||||
| Assessment season | Winter = December + January + February | ||||||||||||||||||||||||||||
| Depth | Surface = average in the 0 – 10 m layer | ||||||||||||||||||||||||||||
| Removing outliers | No outliers removed | ||||||||||||||||||||||||||||
| Removing close observations | No close observations removed | ||||||||||||||||||||||||||||
| Indicator level | Average of winter average values, in which the months are grouped by winter season (Most recent concentrations included are those of January and February of 2021). | ||||||||||||||||||||||||||||
| Eutrophication Quality Ratio (EQR) | EQR = BEST/ ES,
where BEST= ET / (1 + ACDEV / 100) ET= threshold (table 1) ACDEV= acceptable deviation: 50 % for DIN. The final EQR values are scaled after normalisation to five classes of 0.2 width and a Scaled Eutrophication Quality Ratio is obtained (EQRS). |
||||||||||||||||||||||||||||
| Indicator confidence | The confidence assessment for eutrophication indicators is included in HEAT, and includes aspects of temporal, spatial and accuracy confidence. The general methodology of the confidence assessment is described in Document 4.2 of IN-Eutrophication 16-2020 and updates are described in documents 4J-80 of State & Conservation 14-2021 and 4-2 of EG-EUTRO 20-2021. The R-code is available via https://github.com/ices-tools-prod/HEAT.
The aspect of temporal coverage of monitoring data considers the confidence of the indicator in terms of its year-to-year variation and the continuity of observations during the indicator-specific assessment season (annual/summer). The general temporal confidence (GTC) is assessed based on the number of annual observations during the assessment period, whereas for the specific temporal confidence (STC) the number of missing months in the respective assessment season (annual/summer) determines the classification. The specific spatial confidence (SSC) evaluates the spatial representability of the monitoring data and is based on a gridded approach. Lastly, the accuracy confidence (ACC) indicates how certain the assessment is in relation to the variability of the data to estimate the probability of correct classification for failing or achieving good status. To combine the different confidence assessments GTC and STC are averaged to an overall result for temporal confidence and this result is then averaged with SSC and subsequently combined with ACC to obtain a result for the indicator. The evaluation criteria for general and specific temporal confidence are given in the table below.
If the specific temporal confidence is high (100) for at least half of the assessed years, it is set as high (100) for the assessment period. The total temporal confidence is the average of the general and specific temporal confidence aspects. The evaluation criteria for spatial confidence are given in the table below.
The accuracy aspect assesses the probability of correct classification (the classification being below or above the threshold for good status). The evaluation criteria for accuracy aspect are given in table below.
|
||||||||||||||||||||||||||||
| Indicator threshold value confidence | MODERATE |
9.3 Monitoring and reporting requirements
Monitoring methodology
Monitoring of nitrogen concentrations by the Contracting Parties of HELCOM is described on a general level in the HELCOM Monitoring Manual in the sub-programme Nutrients.
Monitoring guidelines specifying the sampling strategies for nitrate, nitrite and ammonium are adopted and published.
Current monitoring
The monitoring activities relevant to the indicator, as currently carried out by HELCOM Contracting Parties, are described in the HELCOM Monitoring Manual sub-programme Nutrients monitoring concepts table.
Description of optimal monitoring
Regional monitoring of dissolved inorganic nitrogen is considered sufficient to support the indicator evaluation. Increased temporal and spatial monitoring in certain areas would further improve the confidence in future assessments.
10 Data
The data and resulting data products (e.g. tables, figures and maps) available on the indicator web page can be used freely given that it is used appropriately and the source is cited.
Result: Dissolved inorganic nitrogen
Data source: The average for 2016-2021 was estimated using monitoring data provided by the HELCOM Contracting Parties, and kept in the HELCOM COMBINE database, hosted by ICES (www.ices.dk). Nominated members of HELCOM State & Conservation Working Group were given the opportunity to review the data, and to supply any missing monitoring observations, in order to achieve a complete dataset.
Description of data: The data include the sum of in-situ nitrate and nitrite samples, determined using colorimetric methods, as explained in the HELCOM COMBINE manual. DIN is the sum of the concentrations of ammonium, nitrate and nitrite in a water sample. The ammonium component in marine surface waters is generally very small however, so where these data are missing, DIN is calculated as the sum of nitrite + nitrate only. In the assessment, only surface water measurements at depths of 0-10 m are reported.
Geographical coverage: The observations are distributed in the sub-basins according to the HELCOM monitoring programme, added occasionally with data from research cruises.
Temporal coverage: The raw data includes observations throughout the year, during the assessment period 2016-2021.
Data aggregation: The 2016-2021 averages for each sub-basin were produced as inter-annual winter (December-February) estimates.
11 Contributors
Birgit Heyden1, Wera Leujak2, Joachim Kuss3, Theodor Hüttel4, Joni Kaitaranta4, HELCOM Expert Group on Eutrophication (EG Eutro)
1 AquaEcology, Germany
2 German Environment Agency, Germany
3 Leibniz Institute for Baltic Sea Research Warnemünde (IOW), Germany
4 Secretariat of the Helsinki Commission
12 Archive
This version of the HELCOM core indicator report was published in April 2023:
The current version of this indicator (including as a PDF) can be found on the HELCOM indicator web page.
Earlier versions of the core indicator report are available:
Dissolved inorganic nitrogen DIN HELCOM core indicator 2018 (pdf)
HOLAS II component – Core indicator report – web-based version July 2017 (pdf)
DIN concentrations 2007-2011 (pdf)
Nutrient concentrations 2003-2007 – HELCOM Core Indicator Report (pdf)
13 References
Directive 2008/56/EC of the European Parliament and of the Council. 17 June 2008. Establishing a Framework for Community Action in the Field of Marine Environmental Policy. Marine Strategy Framework Directive. 22p.
Directive 200/60/EC of the European parliament and of the council of 23 October 2000 establishing a framework for community action in the field of water policy. Official Journal of the European Communities L 327/1.
Gustafsson, B.G.; Schenk, F.; Blenckner, T.; Eilola, K. et al (2012): Reconstructing the Development of Baltic Sea Eutrophication 1850–2006. Ambio 41, pages 534-548
HELCOM (2009) Eutrophication in the Baltic Sea – An Integrated Thematic Assessment of the Effects of Nutrient Enrichment and Eutrophication in the Baltic Sea Region. Balt. Sea Environ. Proc. No. 115B, 148.
HELCOM (2013) Approaches and Methods for Eutrophication Target Setting in the Baltic Sea Region. Balt. Sea Environ. Proc. No. 133.
HELCOM (2021) “Baltic Sea Action Plan. 2021 Update.” https://helcom.fi/wp-content/uploads/2021/10/Baltic-Sea-Action-Plan-2021-update.pdf.
HELCOM (2022) Assessment of sources of nutrient inputs to the Baltic Sea in 2017.” https://helcom.fi/wp-content/uploads/2022/12/PLC-7-Assessment-of-sources-of-nutrient-inputs-to-the-Baltic-Sea-in-2017.pdf
HELCOM (2023) “Inputs of Nutrients to the Sub-Basins (2020). HELCOM Core Indicator Report. Online.” 2023.
HELCOM and Baltic Earth (2021) Climate Change in the Baltic Sea. 2021 Fact Sheet. Baltic Sea Environment Proceedings N°180. https://doi.org/ISSN: 0357-2994.
14 Other relevant resources
HELCOM: First version of the ‘State of the Baltic Sea’ report – June 2017, Baltic Marine Environment Protection Commission – HELCOM, Helsinki, Finland, 197, 2017.
Eutrophication status of the Baltic Sea 2007-2011 – A concise thematic assessment (2014)
Approaches and methods for eutrophication target setting in the Baltic Sea region (2013)
HELCOM core indicators. Final report of the HELCOM CORESET project (2013)
Development of tools for assessment of eutrophication in the Baltic Sea (2006)
The table below provides an overview of coastal data.
14 Annex providing an overview of additional coastal evaluations reported by Contracting Parties
Annex table 1. Results for national coastal winter DIN indicators by coastal WFD water type/water body. The table includes information on the assessment unit (CODE, defined in the HELCOM Monitoring and Assessment Strategy Annex 4) and description, assessment period (start year and/or end year), average concentration during assessment period (ES) in μmol/l for IndicatorID 8001 and mg/L for Indicator ID 7001, with standard deviation (SD), Ecological Quality Ratio (EQR) and Ecological Quality Ratio Scaled (EQRS). EQRS shows the present concentration in relation to the reference value, decreasing along with increasing eutrophication. EQRS_class estimates the ecological status based on the EQRS value.
| IndicatorID | Name | Period | Unit ID | HELCOMID | HELCOM ID description | Assessment Unit | ET | ES | SD | EQR | EQRS | EQRS Class |
| 7001 | Dissolved Inorganic Nitrogen | 20162021 | 7001 | POL-001 | PL TW I WB 9 very sheltered, fully mixed, substratum: silt/sandy silt/silty sand; ice cover >90 days, water residence time 52 days | Bornholm Basin | 1.05 | 0.73 | 0.22 | 0.89 | 0.87 | High |
| 7001 | Dissolved Inorganic Nitrogen | 20162021 | 7002 | POL-002 | PL TW I WB 8 very sheltered, fully mixed, substratum: silt/sandy silt/silty sand; ice cover >90 days, water residence time 52 days | Bornholm Basin | 1.05 | 0.77 | 0.22 | 0.88 | 0.86 | High |
| 7001 | Dissolved Inorganic Nitrogen | 20162021 | 7003 | POL-003 | PL TW I WB 1 very sheltered, fully mixed, substratum: silt/sandy silt/silty sand; ice cover >90 days, water residence time 52 days | Gdansk Basin | 0.38 | 0.42 | 0.19 | 0.68 | 0.62 | Good |
| 7001 | Dissolved Inorganic Nitrogen | 20162021 | 7004 | POL-004 | PL TW II WB 2 very sheltered, fully mixed, substratum: lagoonal fine snd medium grained sand/silty sand; residence time 138 day, ice cover >90 days | Gdansk Basin | 0.03 | 0.04 | 0.02 | 0.57 | 0.47 | Moderate |
| 7002 | Dissolved Inorganic Nitrogen | 20162021 | 7005 | POL-005 | PL TW III WB 3 partly protected, partly stratified, substratum: medium grained sand/pebbles/marine silty sand; ice-incidental | Gdansk Basin | 0.15 | 0.04 | 0.02 | 1.00 | 1.00 | High |
| 7002 | Dissolved Inorganic Nitrogen | 20162021 | 7006 | POL-006 | PL TW IV WB 4 partly stratified, moderately exposed, substratum: sand/silt; ice – incidental | Gdansk Basin | 0.15 | 0.14 | 0.11 | 0.71 | 0.64 | Good |
| 7002 | Dissolved Inorganic Nitrogen | 20162021 | 7007 | POL-007 | PL TW V WB 6 river mouth, partly stratified, partly sheltered, substratum: medium grained sand/silty sand | Bornholm Basin | 0.18 | 0.49 | 0.24 | 0.33 | 0.23 | Poor |
| 7002 | Dissolved Inorganic Nitrogen | 20162021 | 7008 | POL-008 | PL TW V WB 5 river mouth, partly stratified, partly sheltered, substratum: medium grained sand/silty sand | Gdansk Basin | 0.23 | 0.96 | 0.69 | 0.34 | 0.30 | Poor |
| 7002 | Dissolved Inorganic Nitrogen | 20162021 | 7009 | POL-009 | PL TW V WB 7 river mouth, partly stratified, partly sheltered, substratum: medium grained sand/silty sand | Bornholm Basin | 0.32 | 0.78 | 0.53 | 0.40 | 0.31 | Poor |
| 7002 | Dissolved Inorganic Nitrogen | 20162021 | 7010 | POL-010 | PL CWI WB2 coastal waters, moderately exposed, fully mixed, substratum:sand/fine sand | Gdansk Basin | 0.10 | 0.08 | 0.06 | 0.83 | 0.78 | Good |
| 7002 | Dissolved Inorganic Nitrogen | 20162021 | 7011 | POL-011 | PL CWI WB1 coastal waters, moderately exposed, fully mixed, substratum:sand/fine sand | Gdansk Basin | 0.15 | 0.50 | 0.68 | 0.48 | 0.38 | Poor |
| 7002 | Dissolved Inorganic Nitrogen | 20162021 | 7012 | POL-012 | PL CWI WB3 coastal waters, moderately exposed, fully mixed, substratum:sand/fine sand | Gdansk Basin | 0.10 | 0.12 | 0.11 | 0.61 | 0.53 | Moderate |
| 7002 | Dissolved Inorganic Nitrogen | 20162021 | 7013 | POL-013 | PL CW II WB 8 central Polish coast, coastal waters, exposed, fully mixed, substratum: sand/pebbles/gravel | Bornholm Basin | 0.10 | 0.34 | 0.19 | 0.26 | 0.15 | Bad |
| 7002 | Dissolved Inorganic Nitrogen | 20162021 | 7014 | POL-014 | PL CW II WB 6W central Polish coast, coastal waters, exposed, fully mixed, substratum: sand/pebbles/gravel | Bornholm Basin | 0.10 | 0.42 | 0.30 | 0.33 | 0.27 | Poor |
| 7002 | Dissolved Inorganic Nitrogen | 20162021 | 7015 | POL-015 | PL CW II WB 6E central Polish coast, coastal waters, exposed, fully mixed, substratum: sand/pebbles/gravel | Bornholm Basin | 0.10 | 0.27 | 0.18 | 0.39 | 0.31 | Poor |
| 7002 | Dissolved Inorganic Nitrogen | 20162021 | 7016 | POL-016 | PL CWII WB5 central Polish coast, coastal waters, exposed, fully mixed, substratum: sand/pebbles/gravel | Eastern Gotland Basin | 0.10 | 0.08 | 0.02 | 0.79 | 0.76 | Good |
| 7002 | Dissolved Inorganic Nitrogen | 20162021 | 7017 | POL-017 | PL CWII WB4 central Polish coast, coastal waters, exposed, fully mixed, substratum: sand/pebbles/gravel | Gdansk Basin | 0.10 | 0.11 | 0.02 | 0.62 | 0.54 | Moderate |
| 7002 | Dissolved Inorganic Nitrogen | 20162021 | 7018 | POL-018 | PL CW III WB 9 central Polish coast, coastal waters, exposed, fully mixed, substratum: sand/pebbles/gravel | Bornholm Basin | 0.23 | 0.44 | 0.24 | 0.46 | 0.36 | Poor |
| 7002 | Dissolved Inorganic Nitrogen | 20162021 | 7019 | POL-019 | PL CW III WB 7 central Polish coast, coastal waters, exposed, fully mixed, substratum: sand/pebbles/gravel | Bornholm Basin | 0.10 | 0.24 | 0.14 | 0.36 | 0.23 | Poor |
| 8001 | Dissolved Inorganic Nitrogen | 20182018 | 8001 | SWE-001 | 1s West Coast inner coastal water | Kattegat | 6.72 | 2.12 | NA | 2.12 | 1.00 | High |
| 8001 | Dissolved Inorganic Nitrogen | 20182018 | 8002 | SWE-003 | 4 West Coast outer coastal water, Kattegat | Kattegat | 6.72 | 1.87 | NA | 2.41 | 1.00 | High |
| 8001 | Dissolved Inorganic Nitrogen | 20172017 | 8013 | SWE-014 | 14 Östergötland outer coastal water | Western Gotland Basin | 2.99 | 5.15 | NA | 0.39 | 0.33 | Poor |
| 8001 | Dissolved Inorganic Nitrogen | 20182018 | 8015 | SWE-016 | 16 South Bothnian Sea,inner coastal water | Bothnian Sea | 4.43 | 11.38 | NA | 0.26 | 0.41 | Moderate |
| 8001 | Dissolved Inorganic Nitrogen | 20182018 | 8017 | SWE-018 | 18 North Bothnian Sea, Höga kusten, inner | Bothnian Sea | ### | 9.59 | NA | 0.95 | 0.27 | Poor |
| 8001 | Dissolved Inorganic Nitrogen | 20172017 | 8019 | SWE-020 | 20 North Quark inner coastal water | The Quark | 6.27 | 14.41 | NA | 0.29 | 0.55 | Moderate |