 Fishery Operations
Key message
Commercial fish are a vital component of Baltic Sea ecosystems, and overall, nearly 90% of the total fish catch consists of herring, sprat, cod, and flounder. Fisheries contribute substantially to coastal economies and are central in the cultural heritage of the Baltic Sea. In 2019 the Baltic Sea commercial fishing sector employed an estimated 4068 full time equivalent people and created a gross value added of 122 million euros. The overall objective of the Baltic Sea fisheries is to ensure economically, environmentally, and socially sustainable use of fisheries resources in alignment with the ecosystem-based approach. However, the Baltic Sea fish stocks have been affected by fishing activity. Therefore, several measures have been implemented in the Baltic Sea region in order to protect marine ecosystems and regulate interactions between ecosystems and fishery activity.
Strict regulations such as catch quotas and fleet reduction initiatives, and the economic consequences of these regulatory actions have influenced the fishery operations and fleet characteristics in the Baltic Sea. Further, technology adoption in fishery operations have been a significant driver in increasing catch amounts and reducing the human workforce. Macroeconomic conditions, mainly fuel prices, also drive the viability of the fishing fleet of Baltic Sea countries. Baltic Sea countries operate with fewer and older fishing vessels, fishing effort and number of fishing enterprises have decreased drastically in the last decade. However, this reduction in fleet capacity did not result in lower catch quantities.
Citation
The data and resulting data products (e.g. tables, figures and maps) available on the indicator web page can be used freely given that it is used appropriately and the source is cited. The indicator should be cited as follows:
HELCOM (2023). Fishery operations. HELCOM driver indicator report. Online. [Date Viewed], [Web link].
ISSN 2343-2543
Background
Commercial fish are a vital component of Baltic Sea ecosystems and provide critical goods and services for the region’s human population. Approximately one hundred fish species live in the Baltic Sea. However, the major commercial fish species of high value in the Baltic Sea are cod, herring, and sprat. Flatfish species like flounder and plaice are also utilized, especially in the southern part of the Baltic Sea. Overall, nearly 90% of the total fish catch consists of herring, sprat, cod, and flounder (Figure 1). Fisheries contribute to coastal economies and are important in the cultural heritage of the Baltic Sea. In 2019 the Baltic Sea commercial fishing sector employed an estimated 4068 full time equivalent people and created a gross value added of 122 million euros (STECF 2020).
The overall objective of the Baltic Sea fisheries is to ensure economically, environmentally and socially sustainable use of fisheries resources in alignment with the ecosystem-based approach (HELCOM 2018). According to HOLAS 2 indicator results for species removal by fishing and hunting pressure; herring, sprat and cod stocks failed to achieve the reference point. To ensure that fish stocks are capable of producing a maximum sustainable yield (MSY), several measures are in place (e.g., total allowable catch, protected areas).
The characteristics of the fishing industry in the Baltic Sea countries have changed during the last decade due to several factors. For instance, fishing effort has been decreased 18% between 2008 and 2019, while the average vessel age in the fleet of Baltic Sea countries increased from 26 to 31 years (Eurostat 2022). Despite having older vessels and less fishing effort, commercial fisheries catch levels (weight of landings) in the Baltic Sea have increased 18% between 2008 and 2018 (FAO FishStat Database). To understand the root causes of these changes, underlying drivers should be analysed in a holistic perspective.
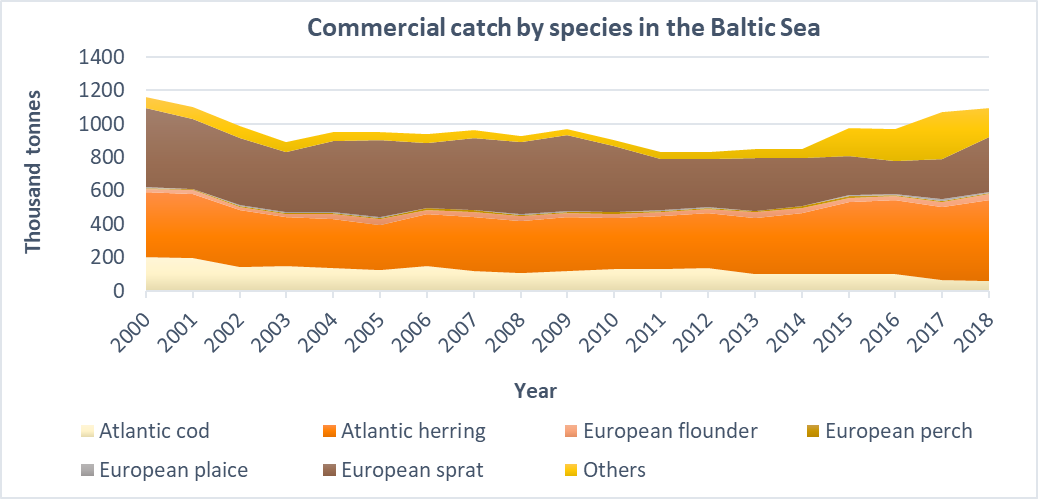
Figure 1: Commercial catch by fish species in Baltic Sea countries between 2001-2020. Chart does not include data from Russia or any non-HELCOM countries. (FAO FishStat Database).
Drivers
Various drivers determine the extent and efficiency of fishery operations in the Baltic Sea region. Strict regulations such as catch quotas and fleet reduction initiatives, and the economic consequences of these regulatory actions have influenced the fishery operations and fleet characteristics in the Baltic Sea. Further, technology adoption in fishery operations have been a significant driver in increasing catch amounts and reducing the human workforce. Macroeconomic conditions, mainly fuel prices, also drive the viability of the fishing fleet of Baltic Sea countries.
A brief summary of relevant drivers of relevance to this topic are provided below and a more detailed overview of these can be found in the HOLAS 3 Thematic Assessment of Economic and Social Analyses.
Regulations
To protect marine ecosystems and regulate interactions between ecosystems and fisheries, several measures have been implemented in the Baltic Sea region. These regulations are the main driver influencing fishery activity and defining the characteristics of the fishing fleet in the Baltic Sea countries. All Baltic coastal states, except Russia, are members of the European Union, with their fishing activities regulated by the EU Common Fisheries Policy (CFP). The CFP is a set of rules for sustainably managing European fishing fleets and conserving fish stocks. Conserving resources by adjusting fishing capacity to fishing opportunities is one of the priorities of the CFP (EC 2013). In Part 4 Article 22 (i.e., Adjustment and management of fishing capacity), the CFP mandates the Member States implementing measures to adjust the fishing capacity of their fleet to their fishing opportunities over time, taking into account trends and based on best scientific advice. If the fishing capacity is not effectively balanced with fishing opportunities, the Member State shall prepare an action plan for the fleet segments with identified structural overcapacity. In practical level, European Maritime and Fisheries Fund (EMFF) has been used by the Member States to realize these capacity reductions and to support fishermen affected by the poor condition of certain fish stocks in the Baltic Sea to leave the fishing sector.
Further, the exploitation of living marine biological resources must restore and maintain populations of harvested species above levels which can produce the maximum sustainable yield (MSY). A significant measure in this respect, Total Allowable Catch (TAC), is a catch limit set for a particular fish stock, for a year or a fishing season, and TACs are annually defined for commercially important fish stocks of the Baltic Sea (cod, herring, sprat, salmon and plaice). Every year, Baltic TACs are published in Baltic specific Council regulations and the European Commission’s original proposals and ICES advices are published on the Commission’s webpage: TACs and quotas.
These regulations have clear economic and social consequences, such as less employment opportunities (CEC 2009). Strict quotas create risks to the social and employment structure of the coastal communities that are closely tied to the income of the fishing industry (Borges et al. 2018). Considering the size of existing fishing fleet, limited resources and volatile oil prices, it is very challenging to adapt to change and restore the economic viability of the sector (CEC 2009). In the last decade, fishing effort has decreased by 13% (i.e., the vessel engine power (kW) multiplied by the days spent at sea, summed over the fleet) and number of fishing enterprises has decreased more than 40%.
Technology adoption
Commercial fisheries constantly adopt new technologies to remain economically competitive, enhance the performance of their equipment, increase the value of their catch, decrease costs, aid navigation, and to improve safety at sea (Tietze et al. 2005). Among these motives, catch increase and reduction of non-fishing time at sea were the most important targets for technology investments for fishermen. Further, adoption of ever-improving fisheries models improves both fishery management and management of the sector as a whole. Most of the investments are related to gears and electronics (Marchal, 2006). Technology adoption in fishery includes both distinct investments in new technology on board individual vessels (e.g., the purchase of sonar, gear sensors or new navigation systems), as well as gradual improvements to the existing vessel technology or gear (e.g., netting materials, trawl panels designs, hook and long line designs or deck equipment and its arrangement) (Eigaard et al. 2014).
Therefore, technology adoption is an important driver for fishery management and efficiency in the Baltic Sea. In the last decade, the number of employees in fishery in most Baltic Sea states has decreased very significantly (STECF 2020). Many full-time fishermen moved to part-time positions or gave up the occupation completely. Further, number of vessels in fishing fleet of Baltic Sea countries has been decreasing over the past 10 years. However, this reduction in fleet capacity did not result in lower catch quantities, because the remaining fishermen improved their technology and the overall fishing effort remained almost unchanged. Since 1990s, engine power had increased greatly due to new technology engines, numerous cutters were replaced with electronic fish locating technology and more efficient trawl nets, and the average trawl duration rose from five to seven hours per day (Eigaard et al. 2014). Automation in several processes in fishery operations (e.g., automation of catch sorting trays) also decreased the required number of employees (Eigaard et al. 2014).
Macroeconomic conditions
A significant portion of fishing fleets worldwide are suffering from low economic performance (Sumaila et al., 2010; Cheilari et al., 2013). Among other drivers, macroeconomic conditions influence fishery operations and viability of the fishing fleet of Baltic Sea countries. According to STECF report (EC 2020), total revenue of the Baltic Sea countries fishing fleet decreased over the last 10 years. Overall, three Member States’ fleets (Denmark, Germany and Finland) suffered net losses in 2019 in the region. One of the main expenditure items for the fishing fleet was energy costs, especially for trawlers. The importance of fuel in the total costs has been stressed in several studies (Sumaila et al., 2008). The increase in fuel price was observed in the recent years, which substantially increased operational costs of vessels.
Driver Indicators
Fishery operations and fleet characteristics is a stand-alone driver indicator set. It has high clarity of impact and can be linked to a variety of relevant drivers. This indicator can be used as a quantified proxy for the drivers of regulations, technology adoption and macroeconomic conditions. In this driver indicator set; number of fishing vessels, total vessel tonnage of fishing vessels, full-time equivalent employees, gross value of landings (GVA) and weight of landings data for the Baltic Sea countries fleets were utilized. An overview of relevant data trends and information is provided below.
Fishery operations and fleet characteristics
Data show that the number of vessels in the fishing fleets of Baltic Sea countries have been decreasing over the past years (20% between 2008 and 2019) (Figure 3). Except for Estonia and Finland, the number of vessels in the fleets of each Baltic Sea country decreased dramatically. Latvia (62%), Denmark (57%), Lithuania (42%), and Germany (29%) have shown the largest reductions by percentage among Baltic Sea countries during this period.
Similar to number of vessels, vessel tonnage (cargo-carrying capacity) of Baltic Sea countries’ fishing fleets decreased 21% between 2008 and 2019 (Figure 4). Capacity reductions resulted mainly from decommissioning programmes implemented in Latvia (after EU accession) and Poland, the introduction of an ITQ system in the Swedish pelagic fisheries in 2009, and the introduction of entry restrictions to the Swedish eel fishery (EC 2020). Latvia (53%), Sweden (40%) and Lithuania (34%) have shown the highest reductions among Baltic Sea countries by percentage.
Like the number and tonnage of vessels, full time equivalent employment in the Baltic Sea fisheries has also been decreasing (36% between 2008 and 2019) (Figure 5). Employment in fisheries decreased in each Baltic Sea country. Latvia (61%), Estonia (53%) and Denmark (52%) have shown the highest reductions among Baltic Sea countries during this period.
Reduced employment in the region resulted in higher labour productivity, for example gross value of landings per full time equivalent employee was 28% higher than the 2008 – 2019 moving average (Figure 6). Similarly, gross weight of landings increased while the employment level decreased in the last 10 years (Figure 7).
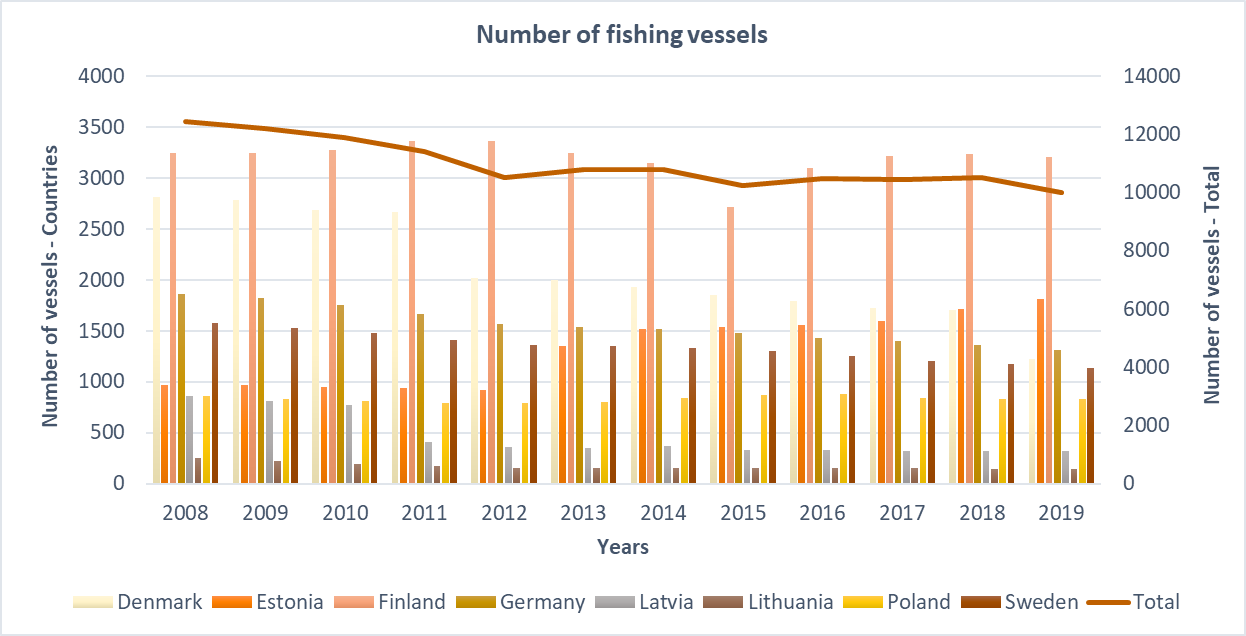
Figure 3: Number of fishing vessels in Baltic Sea countries between 2001-2020. Chart does not include data from Russia or any non-HELCOM countries. (STECF – The 2021 Annual Economic Report on the EU Fishing Fleet (STECF 21-08))
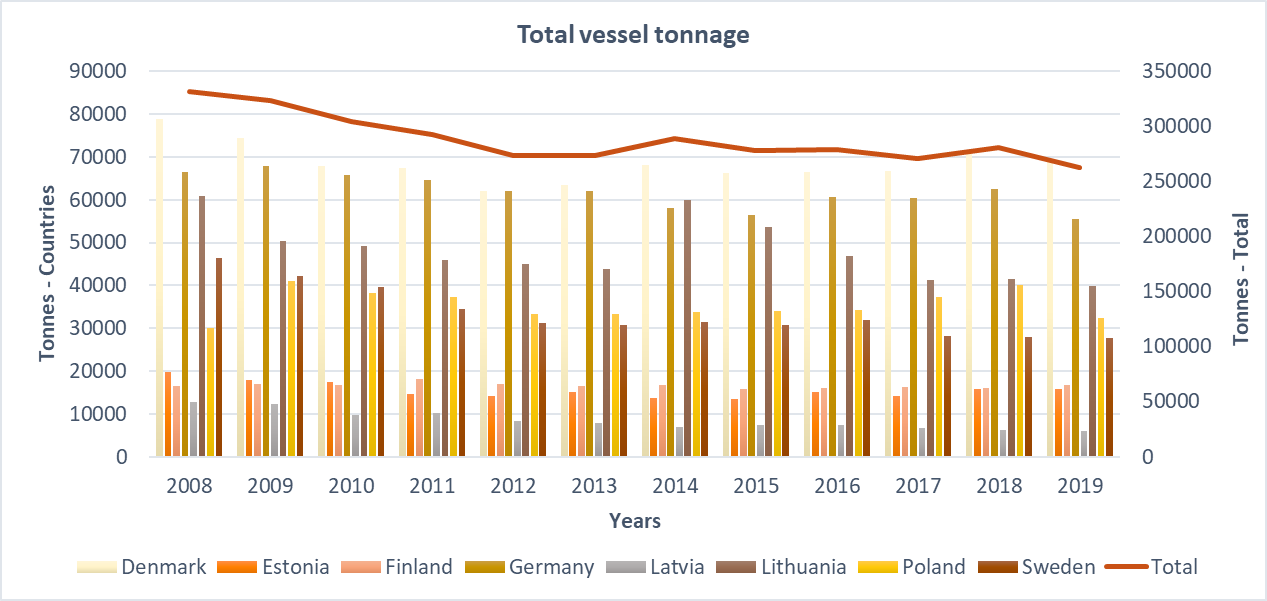
Figure 4: Total vessel tonnage of fishing vessels in Baltic Sea countries between 2001-2020. Chart does not include data from Russia or any non-HELCOM countries. (STECF – The 2021 Annual Economic Report on the EU Fishing Fleet (STECF 21-08))
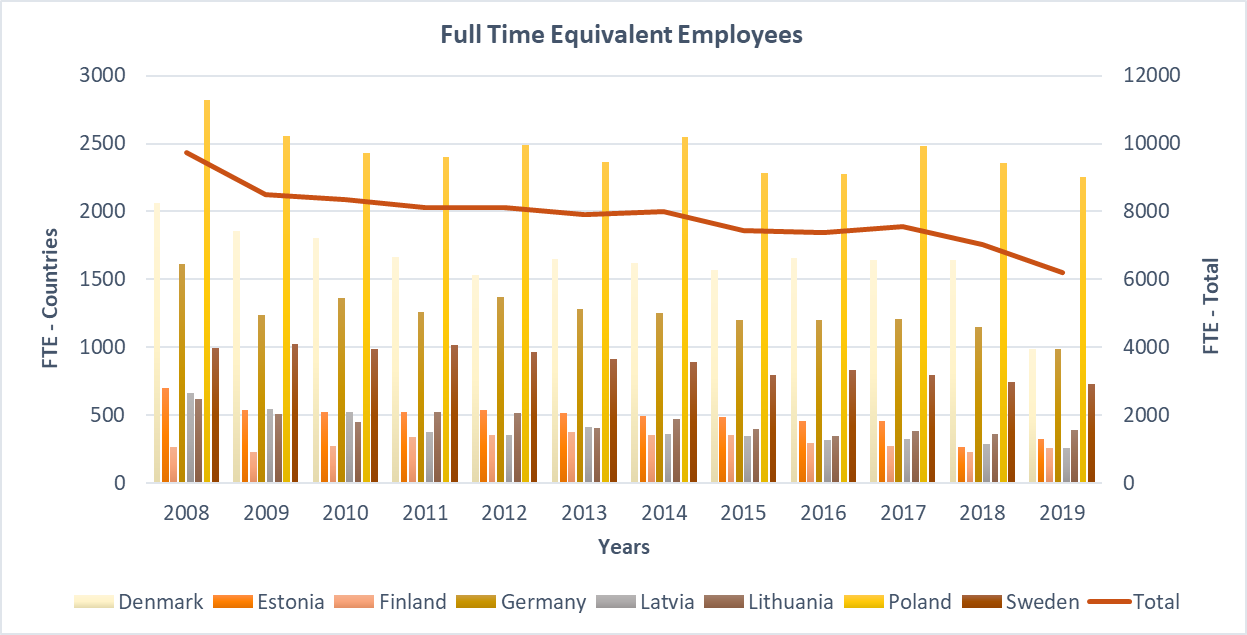
Figure 5: Full-time equivalent employees in fishing fleets in Baltic Sea countries between 2001-2020. Chart does not include data from Russia or any non-HELCOM countries. (STECF – The 2021 Annual Economic Report on the EU Fishing Fleet (STECF 21-08))
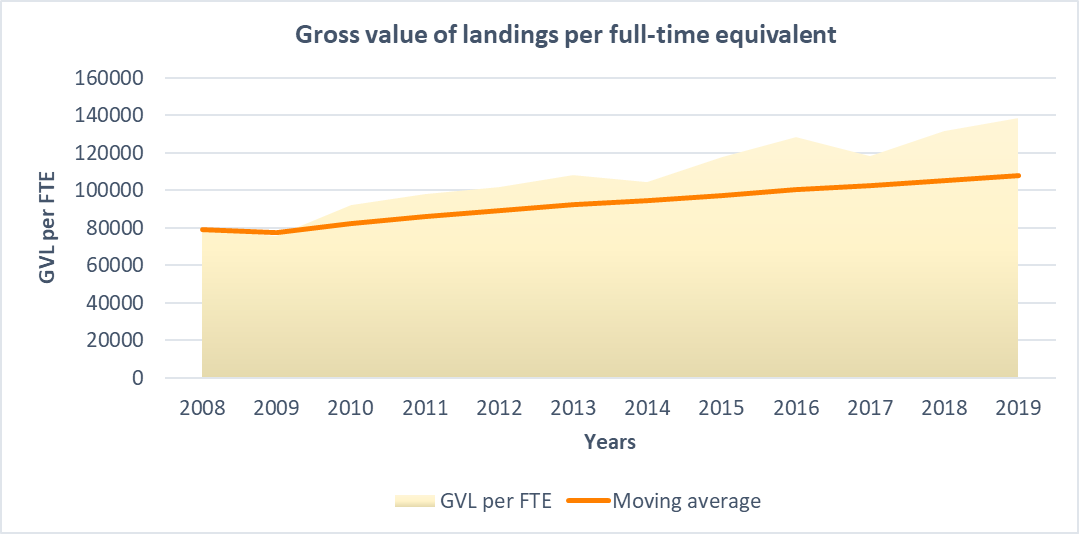
Figure 6: Gross value of landings (GVA) per full-time equivalent employee (FTE) in fishing fleets in Baltic Sea countries between 2008-2019. Orange line shows the moving average value since 2008. Chart does not include data from Russia or any non-HELCOM countries. (STECF – The 2021 Annual Economic Report on the EU Fishing Fleet (STECF 21-08))
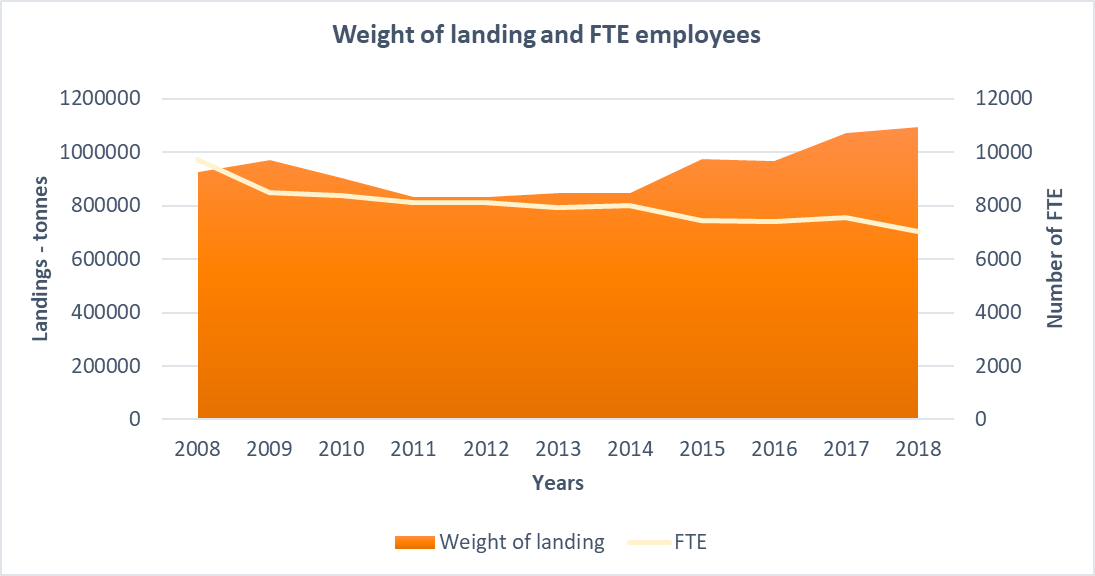
Figure 7: Weight of landings (tonnes) and full-time equivalent employees in fishing fleets in Baltic Sea countries between 2008-2018. Chart does not include data from Russia or any non-HELCOM countries. (STECF – The 2021 Annual Economic Report on the EU Fishing Fleet (STECF 21-08))
Confidence
Historical data of fishing fleet and performance was found for each Baltic Sea country except Russia, between 2001-2020. Data is publicly available on STECF website and reports. Thus, overall, the indicator evaluation has high confidence.
Conclusions
Various drivers determine the extent and efficiency of fishery operations in the Baltic Sea region. Among others, strict regulations such as catch quotas and fleet reduction initiatives, technology adoption and macroeconomic conditions have influenced the fishery operations and fleet characteristics in Baltic Sea.
Due to regulations mandating fleet capacity reductions and catch limits, the characteristics of the fishing industry in the Baltic Sea countries have changed during the last decade. Measures on fishing capacity adjustments and catch limits for particular stocks can be associated with the results of this driver indicator. Baltic Sea countries started to operate with less and older fishing vessels, and this is mainly due to structural changes in the small-scale fishery. Further, fishing effort and fishing enterprises have decreased. However, these changes did not result in lower catch quantities due to improved technology adoption such as new technology engines, electronic fish locating technology and more efficient trawl nets. Although full-time equivalent employment decreased in the region, reduced employment resulted in higher labour productivity.
In conclusion, the fishing fleet of Baltic Sea countries is in transformation due to regulations, and economic income trends suggest the long-term viability of fishery activity is improving. Data shows that technological adoptions can compensate for reduced human power, however, the social consequences of these changes should not be disregarded.
Links to society and environment (DAPSIM)
Activities
Pressures
The following pressure assessments are carried out through indicator evaluations:
Status
The following status assessments are carried out through indicator evaluations:
Each of these indicators can be considered to have a direct possible relationship with the driver(s) described in this report, in particular on the potential to achieve a state representative of good environmental status (GES). In addition, there are ecological impacts of nutrient concentration increases that are reflected by the distance to achievement (i.e. the distance to threshold value in the state evaluations), as well as indirect eutrophication impacts such as increased algal blooms or reduced water clarity. Aspects such as contaminant impacts, or load can also influence the status as well as commercial opportunities. Furthermore, such impacts may also be transferred through Baltic Sea food webs and have consequences for biodiversity components. Other relevant indicators are available on the HELCOM indicator web page.
Impacts
Impacts on society as a consequence of the distance from GES can also be evaluated, where losses of potential benefits or disruption of human activities can be considered. In addition, the direct consequences of overexploitation on ecosystem function can also be addressed. Either or both of these impacts may catalyse the need for measures.
Measures
Several measures are in place in the Baltic Sea related to fishery operations. Primarily, the fishing activities of EU member states are regulated by the EU Common Fisheries Policy (CFP). In Part 4 Article 22 (i.e., Adjustment and management of fishing capacity), the CFP mandates the Member States implementing measures to adjust the fishing capacity of their fleet to their fishing opportunities over time, taking into account trends and based on best scientific advice. If the fishing capacity is not effectively balanced with fishing opportunities, the Member State shall prepare an action plan for the fleet segments with identified structural overcapacity. Further, there are certain catch limits set for particular fish stocks. Results in this driver indicator can be associated with the measures of fishing capacity.Related measures were listed below:
The CFP is a set of rules for sustainably managing European fishing fleets and conserving fish stocks. Originally part of the common agricultural policy (CAP), the common fisheries policy (CFP) started with the same objectives: to increase productivity, to stabilise the markets, to provide a source of healthy food and to ensure reasonable prices for consumers.
Council agreement on 2023 catch limits in the Baltic Sea
The Council of the European Union adopted the Commission proposal for fishing opportunities for 2023 for the Baltic Sea (Proposal for a Council Regulation fixing for 2023 the fishing opportunities for certain fish stocks and groups of fish stocks applicable in the Baltic Sea). Based on this agreement, EU countries will determine how much fish can be caught in the sea basin, for what concerns the most important commercial species.
Related Baltic Sea Action Plan (BSAP) actions
- S40: Identify by 2024 fish species for which there is a need for better data for identified purposes, such as setting threshold levels. Utilise dedicated programmes and projects to facilitate recording and reporting of data for these species by 2025 to support the identification and implementation of measures to achieve good environmental status
- S50: Competent authorities to jointly further develop protective measures for Baltic Sea salmon to support the development of a new regional salmon management plan, and nationally establish salmon management plans by 2023, where appropriate. These management plans should be implemented by 2025 to achieve the set targets, including but not limited to smolt production, genetic diversity and distribution throughout the river habitat. In addition, nationally ensure that granting permits for activities in and near rivers does not compromise the ability to reach set river-specific fish population targets.
- S51: Competent authorities to improve data related to sea trout stocks and to improve populations of sea trout stocks by implementing national measures at the latest by 2025 with a view to achieving good ecological condition in sea trout streams.
- S52: Define necessary complementary measures by 2024 in relevant policy (fisheries, environment etc.) areas to improve the size/age structure for fish stocks, including cod.
- S53: Implement measures to restore coastal fish communities, including establishment of no-take areas, seasonal closures and catch regulations, as appropriate by 2026 for the specific coastal area.
- S54: Share information among Contracting Parties, the Baltic Sea Fisheries Forum (BALTFISH) and Baltic Sea Advisory Council (BSAC) on non-lethal mitigation measures or other ways to manage seals-fisheries interactions and implement those measures by 2025, as appropriate.
Related HELCOM Recommendations
HELCOM Recommendation 32-33-1 Conservation of Baltic Salmon (Salmo salar) and Sea Trout (Salmo trutta) populations by the restoration of their river habitats and management of river fisheries
Future development
Future development of this indicator may be relevant to bring in more data or more suitable information to build stronger conceptual links within the DAPSIM conceptual management framework. Such developments, as well as the development of other relevant driver indicators associated with the topic, if relevant, may support a better overall understanding processes and thus increase the potential for clear management action. It is recommended to review the confidence or limitation of the STECF data on the fishery industry in the future application of this work. Further, future work should take different fishery segments into account and the analysis should be performed at a lower level of aggregation since results are mainly showing the fishery activity by pelagic fisheries.
Beyond HOLAS 3, it is recommended to discuss the relationship between measures and driving forces. Future work should focus on what extent the existing measures address driving forces and how driver indicators can be used to identify required measures.
Methodology
The indicator and report focus on utilizing available data and information to provide an overview of trends in drivers (or proxies indicative of such drivers) that can be informative in a causal framework (i.e., DAPSIM, as applied in HELCOM).
The work carried out represents an initial step towards addressing drivers in HELCOM work and at this stage focusses on selected aspects where 1) experts identified valid potential, and 2) where suitable data were available. The following text describes how such data were handled and utilized.
An overview of the methodology applied can be found in the HOLAS 3 Thematic Assessment of Economic and Social Analyses.
Proposed driver indicators:
While the concept of Drivers in any DAPSI(W)R(M)-based framework is well established, the statistics used to generate indicators of a driver do not necessarily neatly correspond to one of the DAPSI(W)R(M) elements. A driver indicator may very closely represent a driver (for example total population is a direct representation of the demographics driver), closely represent another DAPSI(W)R(M) element (for example the number of fishing days at sea is a direct representation of the Activity of commercial fishing), or not clearly fall into a single DAPSI(W)R(M) element at all (for example agricultural nutrient balance). Additionally, simple proximity to the targeted driver does not make a driver indicator informative. Operating subsidies in commercial fishing are a direct measure of the Subsidy and Regulation Driver but without extensive knowledge about what the operating subsidies are used for, who they target, the tax regime the operator exists in, etc., it is unclear what effect an increase or decrease in the level of operating subsidies would have. On the other hand, despite not being particularly close to any Driver, agricultural nutrient balance is excellent at capturing the cumulative impact of numerous drivers and can be used as tool for illustrating the impact of observed changes in drivers. This multi-dimensional ambiguity was difficult to understand without a way of tracking these topics.
To explore these relationships for proposed potential driver indicators (both for implemented driver indicators and driver indicators rejected for various reasons), quadrant charts were developed. These figures were utilized to explain the proximity to drivers (y-axis) and the clarity of impact (x-axis) for each investigated driver indicator. It is important to highlight that these figures are development tools and can only reflect the information the researchers had at the time of the analysis. Further, the points were qualitatively placed by the Secretariat based on subjective criteria. Differences of opinion are certain to exist. Small changes in the position of points on the chart should be disregarded.
Clarity of impact (x-axis): This axis demonstrates the explanatory power of the driver indicator in capturing the relationship between the Driver and the chosen Activity-Pressure pair (Agriculture-Input of nutrients, Fishing-Fish extraction, Urban uses-Input of nutrients). Changes in the level of data (for example regional vs global population) will affect the clarity of the driver indicator. Indicators with very low clarity of impact were placed on the left side of the chart, while indicators with high clarity of impact were placed on the right side of the chart.
Proximity to driver (y-axis): This axis demonstrates the proximity of indicator to the explained driver. Indicators which were very closely related to driver itself were placed higher on the chart, while indicators which are closer to Activities or Pressures were placed lower on the chart. Points placed closer to the middle were not direct measurements of any particular DAPSI(W)R(M) element and instead capture aspects from multiple elements.
Based on these characteristics, driver indicators were shown in four general categories:
- Optimal driver indicators: Closely related to drivers with high clarity of impact.
- Opaque driver indicators: Closely related to drivers with low clarity of impact.
- Alternate driver indicators: Not closely related to drivers but with high clarity of impact.
- Not useful as driver indicator: Not closely related to drivers and with low clarity of impact.
All driver indicators that were not placed in the “Not useful as a driver indicator” were considered for full development. However, not all these driver indicators were eventually developed due to insufficient time or resources, insufficient data, or the presence of multiple more informative driver indicators.
The charts present a quick overview of the perceived status of investigated driver indicators and suggest potential directions for further development.
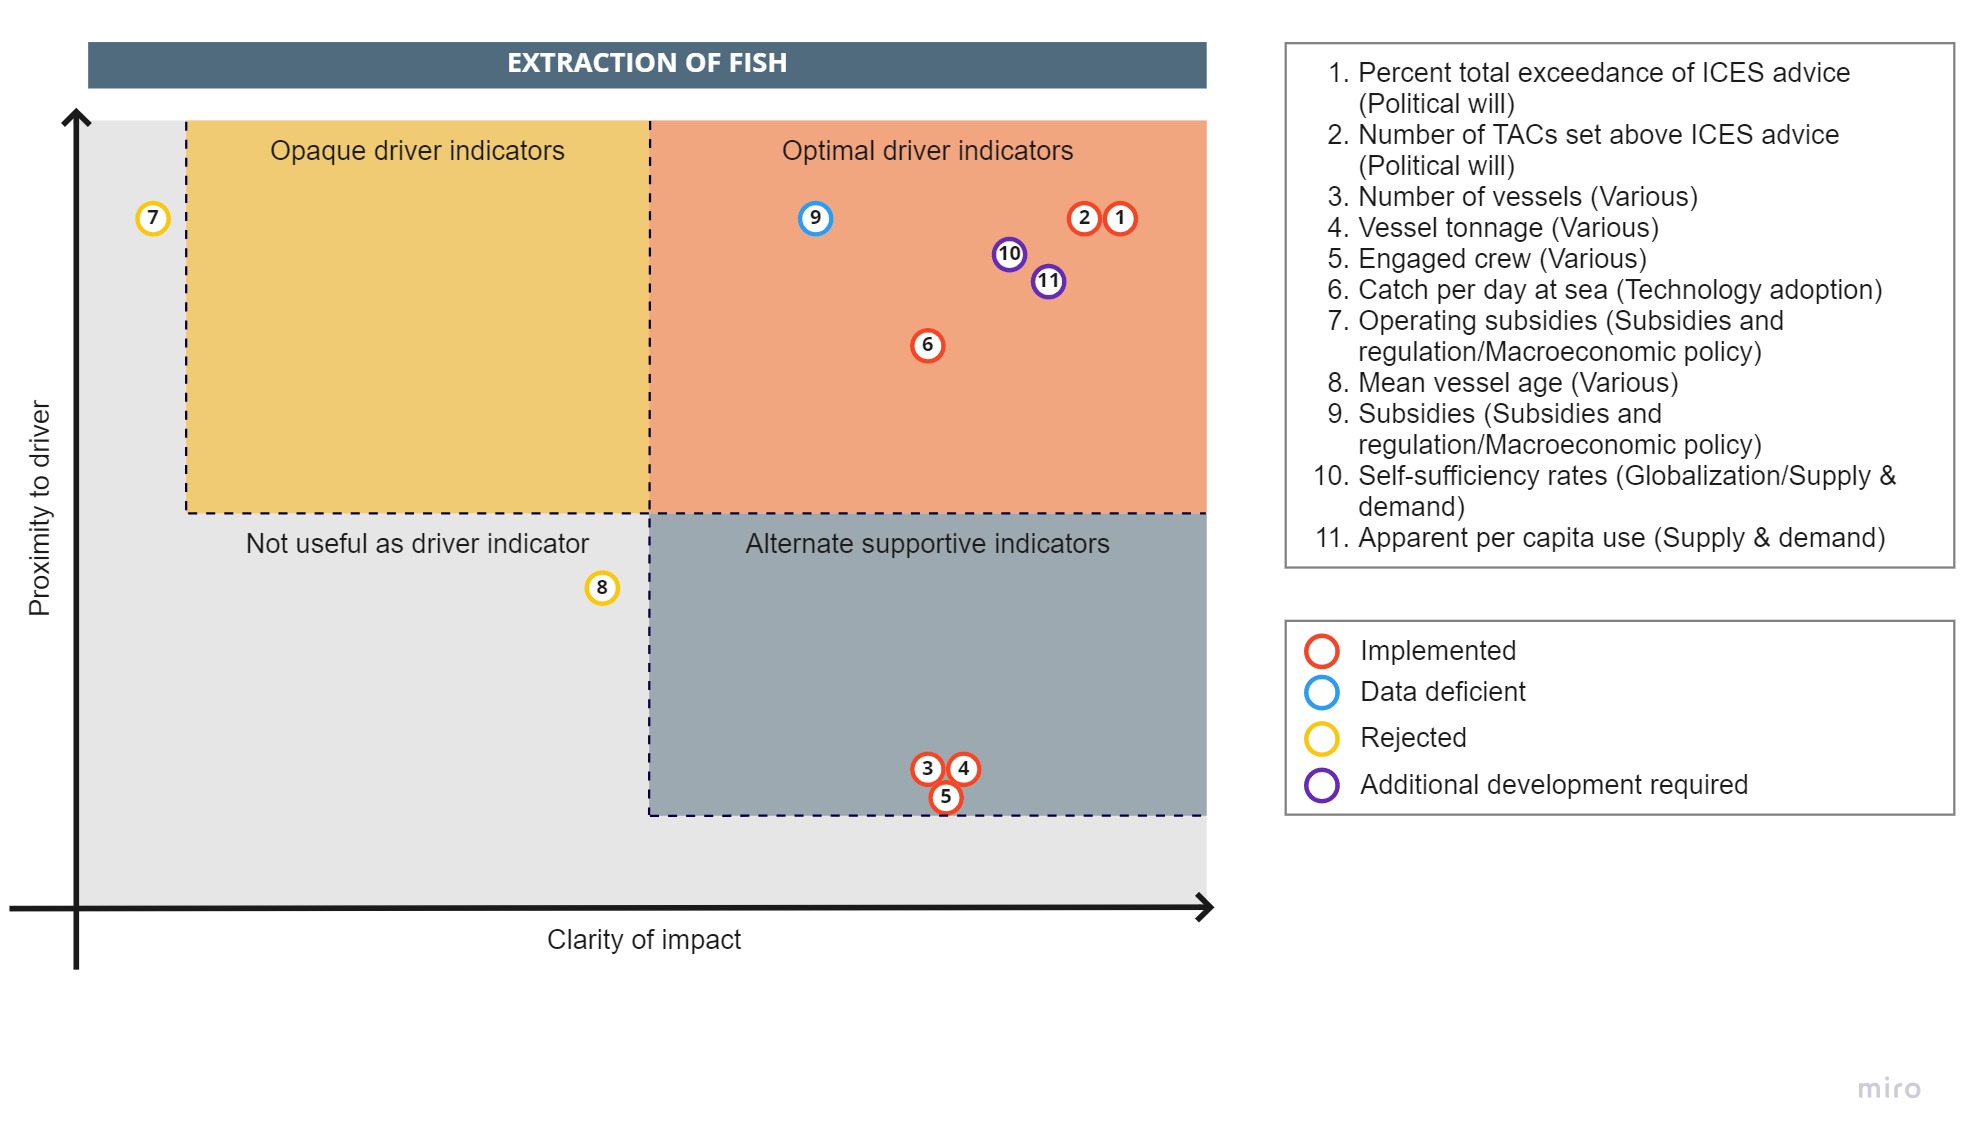
Figure 8: Driver indicators relevant for extraction of fish – fishery pressure – activity pair, their proximity to drivers and clarity of impact. Driver indicators were subjectively categorized under opaque driver indicators, optimal driver indicators, not useful as driver indicator and alternate supportive driver indicators categories.
Data processing
Data was used as it was provided STECF website.
Data
STECF – The 2021 Annual Economic Report on the EU Fishing Fleet (STECF 21-08)
Contributors
Kemal Pinarbaşi, Luke Dodd, Owen Rowe, Jannica Haldin.
Acknowledgements: EG ESA, State and Conservation WG, GEAR WG and participants of workshops leading to this development.
Archive
This current version of the indicator is the first iteration. Future updates or evolution of the indicator document will be provided online, and older versions will be archived via a link in this section of the document.
References
Borges, L (2018). Setting of total allowable catches in the 2013 EU common fisheries policy reform: possible impacts. Marine Policy, 91(), 97–103. doi:10.1016/j.marpol.2018.01.026
Carpenter, G. & Heisse, C. (2019). Landing the Blame: Overfishing in the Baltic Sea 2020. London: New Economics Foundation. Retrieved from: https://neweconomics.org/2019/12/landing-the-blame-overfishing-in-the-baltic-sea-2020
CEC. Green Paper on the Reform of the Common Fisheries Policy. Commission of the European Communities, COM (2009) 163 final, 2009. pp. 27.
HELCOM (2018) Abundance of key coastal fish species, HELCOM core indicator reports. https://www.helcom.fi/wp-content/uploads/2019/08/Abundance-of-key-coastal-fish-species-HELCOM-core-indicator-2018.pdf
Cheilari, A., Guillen, J., Damalas, D. and Barbas, T. 2013. Effects of the Fuel Price Crisis on the Energy Efficiency and the Economic Performance of the European Union Fishing Fleets. Marine Policy, 40: 18-24. doi:10.1016/j.marpol.2012.12.006.
Eigaard O.R., Marchal P., Gislason H. & Rijnsdorp A. D. (2014) Technological Development and Fisheries Management, Reviews in Fisheries Science & Aquaculture, 22:2, 156-174, DOI: 10.1080/23308249.2014.899557
European Commission (2013) The Common Fisheries Policy. Retrieved from https://ec.europa.eu/fisheries/cfp_en
European Commission, Joint Research Centre, Scientific, Technical and Economic Committee for Fisheries, The 2020 annual economic report on the EU fishing fleet (STECF 20-06), Carvalho, N.(editor), Guillen, J.(editor), Prellezo, R.(editor), Publications Office, 2020, https://data.europa.eu/doi/10.2760/500525
Marchal, P. (Editor) Technological developments and tactical adaptations of important EU fleets (TECTAC No. QLK5-2001-01291). Final project report (2006).
Sumaila, U. R., Teh, L., Watson, R., Tyedmers, P., and Pauly, D. 2008. Fuel price increase, subsidies, overcapacity, and resource sustainability. – ICES Journal of Marine Science, 65: 832–840.
Sumaila, U.R., Khan, A., Teh, L., Watson, R., Tyedmers, P. and Pauly, D. 2010. Subsidies to high seas bottom trawl fleets and the sustainability of deep-sea demersal fish stocks. Marine Policy, 34(3): 495-97. doi:10.1016/j.marpol.2009.10.004.
Tietze, U., Thiele, W., Lasch, R., Thomsen, B., Rihan, D. Economic performance and fishing efficiency of marine capture fisheries. FAO Fisheries Technical Paper No. 482, 68 pp. (2005)