 Grey seal abundance
2.1 Ecological relevance
The population trends and abundance of seals reflect changes in the number of marine top predators in the Baltic Sea. Being top predators of the marine ecosystem, marine mammals are good indicators of the state of food webs, levels of hazardous substances and direct human disturbance. Seals are exposed to bottom-up effects of ecosystem changes at lower trophic levels, but also to variations in climate (length of seasons and ice conditions) and pressures and impacts from human activities. These pressures can affect seals indirectly through e.g., decline of fish stocks, levels of harmful substances, or reproductive success in addition to causing direct mortality by hunting or by-catch. The vulnerability of seals to these pressures makes them good indicators for measuring the environmental status of ecosystems.
The growth rate of a population is the result of age-specific mortality rates and age-specific fecundity rates. It is therefore a sensitive parameter signalling if mortality or fecundity rates change. Depleted, undisturbed grey seal populations are expected to grow by 10% per year. Significantly decreasing growth rates can be a sign of density-dependence for example due to limiting food or other resources (Svensson et al. 2011) and the functional factors of carrying capacity. However, decreasing growth can also indicate impaired health caused by contaminants or diseases, as well as excessive hunting or high levels of by-catches.
2.2 Policy relevance
Table 1. Overview of policy relevance for this indicator.
| Baltic Sea Action Plan (BSAP) | Marine Strategy Framework Directive (MSFD) | |
| Fundamental link | Segment: Biodiversity
Goal: “Baltic Sea ecosystem is healthy and resilient”
|
Descriptor 1 Species groups of birds, mammals, reptiles, fish and cephalopods.
|
| Complementary link | Segment: Biodiversity
Goal: “Baltic Sea ecosystem is healthy and resilient”
Segment: Hazardous substances and litter goal Goal: “Baltic Sea unaffected by hazardous substances and litter”
|
Descriptor 1 Species groups of birds, mammals, reptiles, fish and cephalopods.
Descriptor 4 Ecosystems, including food webs.
Descriptor 8 Concentrations of contaminants are at levels not giving rise to pollution effects.
|
| Other relevant legislation: |
|
|
The core indicator(s) on the population trends and abundance of Baltic seals addresses the Baltic Sea Action Plan (BSAP 2021) Biodiversity segment goal of a “Baltic Sea ecosystem that is healthy and resilient”. The ecological objectives under this goal are also clearly relevant: ‘Viable populations of all native species’, ‘Natural distribution, occurrence and quality of habitats and associated communities’, and ‘Functional, healthy and resilient food webs’.
The HELCOM Recommendation 27/28-2 Conservation of seals in the Baltic Sea area outlines the conservation goals of seals agreed on at HELCOM. The recommendation is implemented to reach the BSAP goals. The recommendation conservation goals are used as the basis for defining this indicator’s threshold value.
The indicator also has clear relevance for the EU Marine Strategy Framework Directive (MSFD) (European Commission 2008), for those Contracting Parties that are also EU Member States. In particular the relevance is high fro MSFD Descriptor 1 that addresses species and habitats and also for Descriptor 4 that addresses ecosystems, including food webs. A summary overview of policy linkages is provided in Table 1.
In some Contracting Parties, the indicator also has potential relevance for implementation of the EU Water Framework Directive (WFD) and Habitats Directive. The WFD includes status categories for coastal waters as well as environmental and ecological objectives. The EU Habitats Directive (European Commission 1992) specifically states that long-term management objectives should not be influenced by socio-economic considerations, although they may be considered during the implementation of management programmes provided the long-term objectives are not compromised. All seals in Europe are also listed under the EU Habitats Directive Annex II, and member countries are obliged to monitor the status of seal populations.
The indicator is also relevant for Sustainable Development Goal 14.
2.3 Relevance for other assessments
The status of biodiversity is assessed using several core indicators. Each indicator focuses on one important aspect of a complex issue. In addition to providing an indicator-based evaluation of the population trends and abundance of seals, this indicator will also contribute to the overall biodiversity assessment, along with the other biodiversity core indicators.
The results are utilised in the HELCOM Biodiversity integrated assessment (BEAT tool) to support an overall evaluation of marine mammals.
Status for the population trends and abundance of seals in the Baltic Sea is determined by comparing population data with threshold values that have been defined based on concepts developed for the conservation of seals, in particular the HELCOM Recommendation 27/28-2 ‘Conservation of seals in the Baltic Sea area’, which states that the population size is to be managed with the long-term objective of allowing seal populations to recover towards carrying capacity.
Good status for abundance is achieved in a management unit if the population is above the Limit Reference Level (LRL). HELCOM set a LRL of 10,000 individuals for all the Baltic seal species for each ecologically and genetically isolated population. The LRL corresponds to the safe biological level and minimum viable population size. For grey seals the LRL is evaluated understanding that the results of the moult surveys represent a haul-out fraction of approximately 70%. The LRL of 10,000 implies a population with approximately 5,000 adult seals (and thus 2,500 adult female seals). LRL has been calculated based on estimates of minimum viable population sizes based on different extinction risk levels (1, 3, 5 and 10%) for genetically and ecologically isolated populations.
The growth rate aspect of the threshold value is evaluated separately for populations at and below the TRL. TRL is the level where the growth rate starts to level off and the population asymptotically approaches the current carrying capacity level.
- For populations that have reached the TRL, good status is defined as ‘No decline in population size exceeding 10% occurred over a period up to 10 years’
- For populations below TRL, good status is defined as 3% below the maximum rate of increase for seal species, i.e. 7% annual rate of increase for grey seals.
The approach, methods and data used to define the threshold values for abundance and growth rates are explained in detail in the previous indicator report Population trends and abundance of seals HELCOM core indicator 2018 (pdf).
The results of the indicator evaluation that underlie the key message map and information are provided below.
4.1 Status evaluation
The grey seal population of the Baltic Sea is evaluated as a single management unit covering the whole HELCOM area. The evaluations for Population trends are based on data from 2003-2021. For reliable trend calculations this longer time-series is needed, but the most recent data from the assessment period 2016-2021 is used to assess Population abundance.
Population abundance evaluation: Approximately 42 000 grey seals were counted during the surveys in 2021 (Result Figure 1). Assuming a haulout-fraction of 70%, the total population estimate would be around 60 000 animals. Thus, the grey seal population abundance considerably exceeds the LRL of 10 000 and achieve good environmental status in respect to abundance.
Grey seal counts in the Kattegat amount to approximately 100 animals, of which a majority are found at Læsø, Anholt, Bosserne and Varberg and pupping occurs irregularly on Læsø and Anholt but also other sites (Härkönen et al. 2007, Galatius et al. 2020). A few tens of animals are seen all along the Swedish west coast during harbour seal surveys in August. The grey seals in Kattegat here come both from the Baltic Sea and the Atlantic populations (Fietz et al. 2016), thus this area is not included in the evaluation.
4.2 Trends
Population trend evaluation: In HOLAS II (2011-2016), expert judgment, based on data from the aerial surveys, indicated that the population approached carrying capacity, due to a levelling of the growth rate, particularly in 2015 and 2016. Thus, the evaluation was conducted using the threshold of “no decrease greater than 10% during up to a 10-year period.” However, since the last evaluation the grey seal population continued to increase steadily (Figure 1), indicating that the population may still be under TRL. The TRL is the level where the growth rate starts to level off and the population asymptotically approaches the current carrying capacity level. It is difficult to establish if the observed growth is exponential or asymptotic as the difference around the inflection point is subtle. This illustrates the difficulty of identifying the TRL and emphasizes the need for high quality long-term data series for detecting changes in the growth rate. In this evaluation, it was judged based on the most recent data that the population is still growing and grey seals were therefore evaluated as being under TRL.
The annual population growth rate during 2003-2021 was 5.1%. A Bayesian analysis shows 80% support for a growth rate value of ≥4.7% (Figure 1). Looking at a shorter time-series from 2008-2021 with the current geographical coverage and coordinated timing of the aerial surveys, the annual growth rate was 5.2%, indicating that the growth rate has not levelled off. The growth rate from 2003 to 2021 is well below the threshold value (7%) therefore the grey seals do not achieve good environmental status for the population trend evaluation.
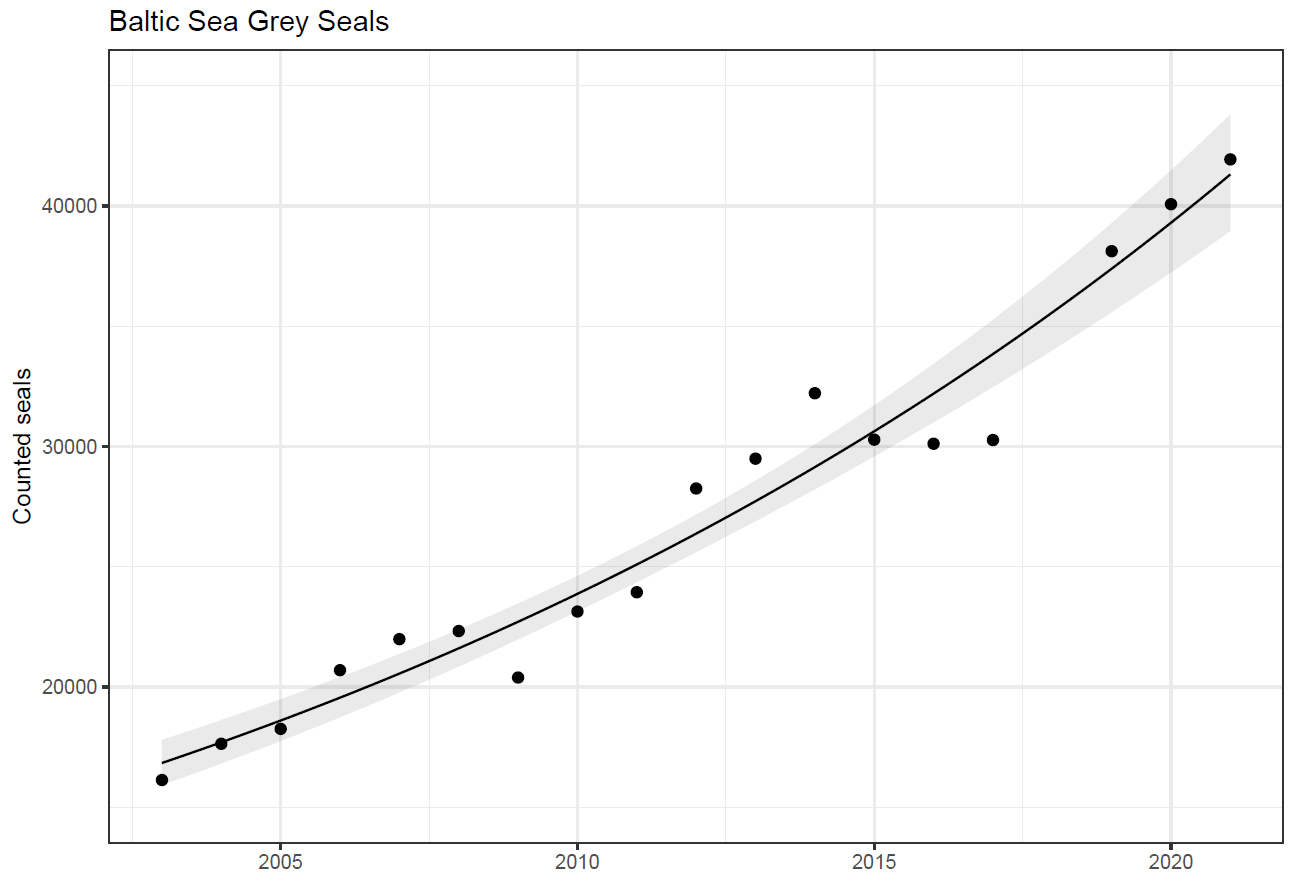
Figure 1. The annual number of hauled-out grey seals in the Baltic counted during the moulting surveys 2003-2021 in the Baltic Sea. The hauled-out fraction is estimated to be around 70% of the total population. The annual growth rate of Baltic grey seals during the assessment period 2003-2021 was 5.1 %. According to Bayesian statistics there 80% support for a growth rate ≥4.7%. This is well below the threshold value for good status at 7%. The trend is not showing signs of levelling off, indicating that density-dependent factors are not limiting the population growth and the abundance is still under the TRL. Modelled count index and 95% confidence interval around index are provided with a black line and grey area.
4.3 Discussion text
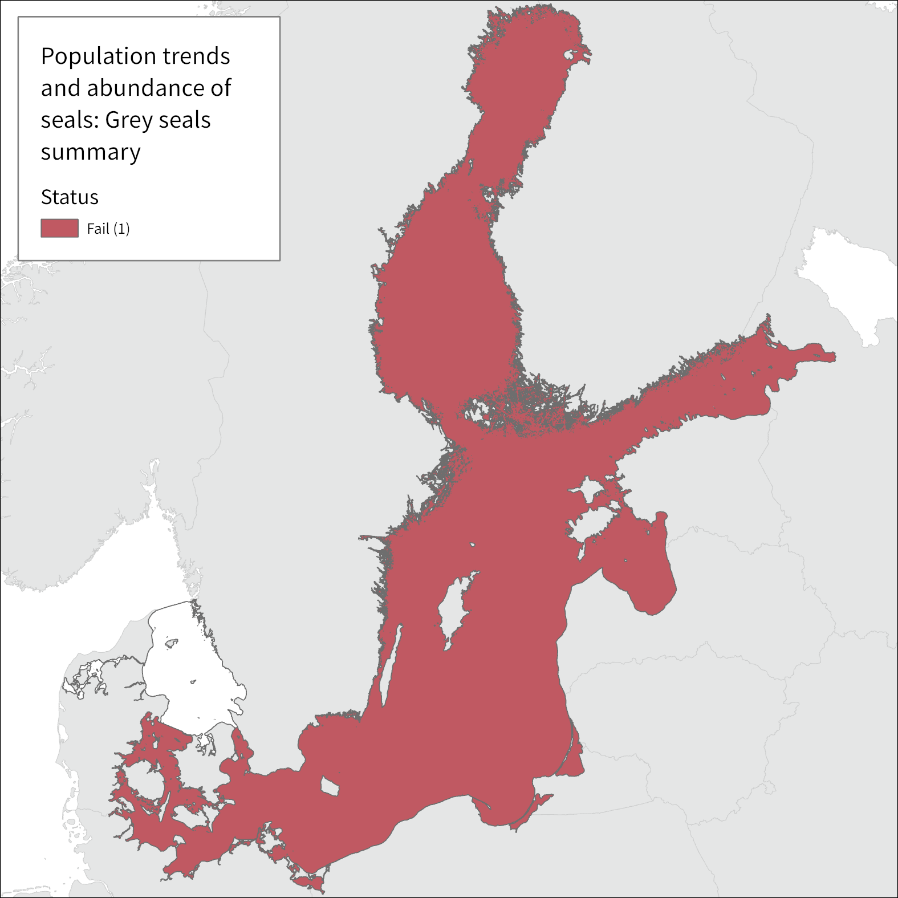
Overall evaluation: Based on the one-out-all-out -concept the evaluation for the management unit Baltic grey seals does not achieve good environmental status (Figure 2).

Figure 2. Overall, Baltic grey seals failed good status with regard to population growth rate, while their abundance is considerably above the threshold of LRL of 10,000. Kattegat, where a limited number of grey seals come from both Baltic and Atlantic populations, is not included in the evaluation.
Table 1. Overview of evaluation outcomes and comparison with previous evaluations.
| HELCOM Assessment unit name (and ID) | Threshold value achieved/failed in HOLAS II | Threshold value achieved/failed in HOLAS 3 | Distinct trend between current and previous evaluation. | Description of outcomes |
| Baltic Sea | Failed | Failed | The grey seal population abundance is estimated around 60 000 animals, considerably exceeding the LRL of 10 000, however the population trend is not showing signs of levelling off, indicating that density-dependent factors are not limiting the population growth and the abundance is still under the TRL. | Overall, Baltic grey seals failed good status with regard to population growth rate. The annual population growth rate during 2003-2021 was 5.1%, well below the threshold value (7%), while their abundance is considerably above the threshold of LRL of 10,000. |
Confidence of the indicator evaluation is considered to be moderate for the Baltic grey seal, due to the difficulty of determining if the population is at or below TRL. Detecting a change in the trend, particularly as an indication of approaching carrying capacity, is challenging. It is important to note that even if a change in the trend would be seen, it is complex to identify if this change is due to density dependence factors or due to anthropogenic pressures (e.g. increased hunting, bycatch, etc.). Given the variation in the survey results caused by weather, changes in hunting pressure and other disturbance, a long data-series is needed. Coupled with variation in both quality and quantity of food and other potential factors altering the carrying capacity, complicates the evaluation of whether the population abundance is approaching the carrying capacity. During the current assessment period the population trend indicates a growing trend, but also cannot strongly refute density-dependence. It is also difficult to disentangle the effects that anthropogenic pressures such as hunting have on the population from those of naturally occurring factors such as density dependence. Therefore the confidence of the evaluation is moderate.
Monitoring activities are currently carried out at a high spatial resolution and temporal frequency. Historical data on population sizes of seals in all management units are available. The main pressures affecting seals, such as hunting and by-catches, diminishing ice fields and effects of contaminants are well known on a qualitative level, but more work is needed to quantify those pressures.
Survey data are available considered comparable for grey seals in the entire Baltic Sea since 2003 and the methodology by means of coordinated timing and geographical coverage of the surveys has been standardized since 2008. For grey seals there are also data from Sweden two decades before this time.
Table 1. Brief summary of relevant pressures and activities with relevance to the indicator.
| General | MSFD Annex III, Table 2a | |||
| Strong link | The main pressures affecting the abundance and growth rate of Baltic seal populations include hunting, by-catches, and disturbance by human activities. | Biological disturbance:
-selective extraction of species, including incidental non-target catches (i.e. by commercial and recreational fishing) |
||
| Weak link |
|
Contamination by hazardous substance:
– introduction of synthetic compounds – introduction of non-synthetic substances and compounds |
Historically, hunting of seals has been a major human pressure on all the seal species in the Baltic Sea. A coordinated international campaign was initiated in the beginning of the 20th century with the aim of exterminating the seals (Anon. 1895). Bounty systems were introduced in Denmark, Finland and Sweden over the period 1889-1912, and very detailed bounty statistics provide detailed information on the hunting pressure. The original population sizes were about 80,000 for Baltic grey seals and were estimated by a model based on hunting statistics.
The hunting pressure resulted in extirpation of grey and harbour seals in Germany and Poland in 1912, and grey seals were also extirpated from the Kattegat by the 1930s. Baltic grey seals were reduced to about 20,000 in the 1940s (Harding & Härkönen 1999).
In the beginning of the 1970s Baltic grey seals were observed aborting near full term foetuses (Helle 1980). Investigations showed a linkage to a disease syndrome including reproductive disorder, caused by organochlorine pollutions (Bergman & Olsson 1985). The reduced fertility resulted in population crashes, where numbers of grey seals dwindled to approximately 3,000 in the beginning of the 1980s (Harding & Härkönen 1999).
General hunting of grey seals was prohibited in 1974 and protective hunting in 1986. This, combined with a ban on PCBs and DDTs stopped the decline of the seal populations and promoted growth. Recent samples show that fertility is normal in grey seals (Bäcklin et al. 2011; Bäcklin et al. 2013). Protective hunting related to fishing activities was resumed again in 1997 in Finland and in 2001 In Sweden. Sweden introduced licence hunting for grey seals in 2020 and in Finland grey seal hunt has been run by regional quota since 2014. Numbers of grey seals that have been allowed to be hunted with these varying regulations in Sweden and Finland have increased from c. 500 seals in the early 2000’s to c. 3500 in 2022. Although the quota is rarely filled, the increased hunting, coupled with poorly known bycatch rates has the potential to impact the growth rate of the population to the extent that the grey seal population does not achieve good environmental status. This was confirmed by a model looking at potential growth rates in the absence of hunting and by-catch, parameterized with data from grey seal growth rates based on inventories from 2003-2020 and reproduction rates, age-structure and hunting statistics from the same time-period (Sköld 2021
Whilst the hunting statistics are well documented, the current knowledge on the level of incidental catches of Baltic seal species is limited to a few dedicated studies which suggest that this factor can be substantial. An analysis of reported incidentally caught grey seals showed that approximately 2,000 grey seals are caught annually in the Baltic fisheries (Vanhatalo et al. 2014).
Most haul-out sites of Baltic seals are protected during the breeding and moulting season when they are most vulnerable to disturbance. This is especially important for grey seals, where access to undisturbed land breeding sites delimit the expansion of grey seals in the Southern Baltic Sea. However, the land-breeding sites in the Baltic have not been fully identified. They differ somewhat from the haul-out sites during moulting.
Climate change poses a pressure on species breeding on ice because shorter and warmer winters lead to more restricted areas of suitable ice fields (Meier et al. 2004). Grey seals are facultative ice breeders and their breeding success is considerably greater when they breed on ice as compared with land (Jüssi et al. 2008). Consequently, grey seals are predicted to be negatively affected by a warmer climate. However, effects of climate change should not be included in evaluations according to the Habitat Directive.
The Baltic grey seal abundance considerably exceeds the LRL of 10 000. As the population showed being in an increase phase and thus under the TRL, it was evaluated against the threshold of 7% annual growth rate. The population growth rate of 5.1% got 80% support for ≥4.7% from the Bayesian analysis and thus remained under the threshold. As a result, Baltic grey seal population has not achieved good environmental status for the indicator population trends and abundance. It should however be noted that there is difficult to determine if the population is at or below TRL as detecting a change in the trend, particularly as an indication of approaching carrying capacity, is challenging.
8.1 Future work or improvements needed
Monitoring during the moulting time remains at high quality and coverage. However, there is no coordinated effort to monitor land pupping sites in the Baltic, only a few countries (Sweden, Estonia, Denmark) are currently conducting monitoring or have up-to-date inventories of on land pupping sites. These sites are likely to become of increasing importance in the future when the extent of the sea ice decreases.
There is ongoing work to define the Precautionary Approach Level for grey seals in order to gain a better understanding of when seals approach carrying capacity.
9.1 Scale of assessment
This core indicator evaluates the population trends and abundance of seals using HELCOM assessment unit scale 2 (division of the Baltic Sea into 17 sub-basins). The assessment units are defined in the HELCOM Monitoring and Assessment Strategy Annex 4.
The existing management units of seals are based on the distribution of seal populations. The management units typically encompass a handful of HELCOM scale 2 assessment units. Evaluations are therefore done by grouping HELCOM assessment units to align with the management units defined for each seal population.
The Baltic grey seal is evaluated as a single management unit, although genetic data show spatial structuring (Fietz et al. 2016). Coordinated aerial surveys encompassing the entire Baltic started in 2000, but the area covered with the aerial surveys still developed until 2008. Until then some areas were covered by boat and land based surveys, which may have given somewhat lower results. Data from 2003 onwards has been considered comparable enough to be used in the trend-analyses.
9.2 Methodology applied
This core indicator evaluates whether good status is achieved by determining the growth rate of the population as well as the population size over a specified time period. The data collected and used in this indicator are based on national aerial surveys described in the HELCOM Monitoring guidelines for seal abundance and distribution.
Each assessment unit is evaluated against two threshold values, for population growth rate and the Limit Reference Level (LRL). The overall status of seals in each management unit only achieves good status if both threshold values are met.
Time series of data are used as input values in Bayesian analysis with uninformative priors, where it is evaluated whether observed data support the set threshold value. In this process, 80% support for a growth rate ≥ the threshold value is required. If the unit fails to achieve good status, the probability distribution is used to evaluate the confidence of the evaluation. The package ‘bayesm’ in the program R has been used for the analysis.
9.3 Monitoring and reporting requirements
Monitoring methodology
HELCOM common monitoring relevant for the seal population trends is documented on a general level in the HELCOM Monitoring Manual under the sub-programme: Seal abundance.
HELCOM monitoring guidelines for seals were adopted in 2014 and updated in 2018.
The Baltic grey seals are monitored at their haul-outs during their annual moulting, with the aim of estimating the abundance and trends (moulting counts). In most areas, the monitoring is performed using aerial surveys, where the seal haul-outs are photographed in areas where there is a significant occurrence of seals. The methodology does not provide a total abundance but and abundance index. Based on the assumption that the same fraction of seals are observed hauled-out during the surveys this measure is reliable especially for monitoring the long-term trend of the abundance.
Detailed descriptions of the survey methodology and analysis of results are given in the HELCOM monitoring manual.
Current monitoring
The monitoring activities relevant to the indicator that are currently carried out by HELCOM Contracting Parties are described in the HELCOM Monitoring Manual Sub-programme: Seal Abundance: Monitoring Concept Table
Current monitoring covers all haul-out sites presently used by seals in the Baltic Sea and is considered to be sufficient to cover the needs of the indicator except for southern ringed seals. See description in the Assessment Requirements of the HELCOM Monitoring Manual.
Description of optimal monitoring:
The current monitoring with mostly repeated coordinated surveys within a two-week period is optimal for monitoring the trend of grey seal abundance (HELCOM monitoring guidelines for seals).
The data and resulting data products (e.g. tables, figures and maps) available on the indicator web page can be used freely given that it is used appropriately and the source is cited. The indicator should be cited as following:
HELCOM (2018) Population trends and abundance of seals. HELCOM core indicator report. Online. [Date Viewed], [Web link]. ISSN: 2343-2543
Result: Population trends and abundance of seals – Grey seal
This indicator report for HOLAS 3 was prepared by Markus Ahola, Anders Galatius and Anja Carlsson. The assessment principles, methodology and background information are largely based on the previous evaluation report by Tero Härkönen, Anders Galatius, Morten Tange Olsen, Markus Ahola, Karin Hårding, Olle Karlsson, Mervi Kunnasranta, Lena Avellan, Petra Kääriä, Minna Pyhälä.
HELCOM Secretariat: Jannica Haldin, Florent Nicolas, Owen Rowe.
This version of the HELCOM core indicator report was published in April 2023:
The current version of this indicator (including as a PDF) can be found on the HELCOM indicator web page.
Earlier versions of the indicator report are available:
Population trends and abundance of seals HELCOM core indicator 2018 (pdf)
Core indicator report – web-based version 2015 (pdf)
Extended core indicator report – outcome of CORESET II project (pdf)
Population growth rate, abundance and distribution of marine mammals 2013 (pdf)
Anon. (1895) Svensk fiskeritidskrift 1895.
Bäcklin, B.-M., Moraeus, C., Roos, A., Eklöf, E., Lind, Y. (2011) Health and age and sex distributions of Baltic grey seals (Halichoerus grypus) collected from bycatch and hunt in the Gulf of Bothnia. ICES Journal of Marine Science 68: 183-188.
Bäcklin, B.-M., Moraeus, C., Kauhala, K., Isomursu, M. (2013) Pregnancy rates of the marine mammals – Particular emphasis on Baltic grey and ringed seals. HELCOM web portal.
Bergman, A., Olsson, M. (1985) Pathology of Baltic grey seal and ringed seal females with special reference to adrenocortical hyperplasia: Is environmental pollution the cause of a widely distributed disease syndrome. Finnish Game Res. 44: 47-62.
European Commission (1992) Council Directive 92/43/EEC of 21 May 1992 on the conservation of natural habitats and of wild fauna and flora (Habitats Directive). Off. J. Eur. Union 206: 7–50.
European Commission (2008) Directive 2008/56/EC of the European Parliament and the Council establishing a framework for community action in the field of marine environmental policy (Marine Strategy Framework Directive). Off. J. Eur. Union L 164: 19-40.
Fietz, K., Graves, J.A., Olsen, M.T. (2013) Control Control Control: A Reassessment and Comparison of GenBank and Chromatogram mtDNA Sequence Variation in Baltic Grey Seals (Halichoerus grypus). PLoS ONE 8(8): e72853. doi:10.1371/journal.pone.0072853.
Fietz, K., Galatius, A., Teilmann, J., Dietz, R., Frie, A.K., Klimova, A., Palsbøll, P.J., Jensen, L.F., Graves, J.A., Hoffman, J.I. & Olsen, M.T. (2016) Shift of grey seal subspecies boundaries in response to climate, culling and conservation. Molecular Ecology 25(17):4097-4112. doi:10.1111/mec.13748
Galatius, A., Ahola, M., Härkönen, T., Jüssi, I., Jüssi, M., Karlsson, O., Verevkin, M. (2014) Guidelines for seal abundance monitoring in the HELCOM area 2014. Available at: http://helcom.fi/Documents/Action%20areas/Monitoring%20and%20assessment/Manuals%20and%20Guidelines/Guidelines%20for%20Seal%20Abundance%20Monitoring%20HELCOM%202014.pdf
Galatius A., Teilmann J., Dähne M., Ahola M., Westphal L., Kyhn LA., Pawliczka I., Olsen MT., Dietz R. (2020) Grey seal Halichoerus grypus recolonisation of the southern Baltic Sea, Danish Straits and Kattegat. Wildlife Biology 4, wlb.00711.
Harding, K.C., Härkönen, T.J. (1999) Development in the Baltic grey seal (Halichoerus grypus) and ringed seal (Phoca hispida) populations during the 20th century. Ambio 28: 619-627.
Härkönen, T., Brasseur, S., Teilmann, J., Vincent, C., Dietz, R., Reijnders, P., Abt, K. (2007) Status of grey seals along mainland Europe, from the Baltic to France. NAMMCO Scientific Publications 6: 57-68.
Härkönen, T., Harding, K., Rasmussen, T.D., Teilmann, J., Dietz, R. (2007) Age- and Sex-specific Mortality Patterns in an Emerging Wildlife Epidemic: the Phocine Distemper in European Harbour Seals. PLoS ONE 2(9): e887. doi: 10.1371/journal.pone.0000887.
Helle, E. (1980) Lowered reproductive capacity in female ringed seals (Pusa hispida) in the Bothnian Bay, northern Baltic Sea, with special reference to uterine occlusions. Annales Zoologica Fennici 17: 147-158.
Jüssi, M., Härkönen, T., Jüssi, I., Helle, E. (2008) Decreasing ice coverage will reduce the reproductive success of Baltic grey seal (Halichoerus grypus) females. Ambio 37: 80–85.
Meier, H.E.M., Döscher, R., Halkka, A. (2004) Simulated distributions of Baltic Sea-ice in the warming climate and consequences for the winter habitat of the Baltic Ringed Seal. Ambio 33: 249–256.
Sköld, M. (2021) Effect of hunting and by-catches on the observed rate of growth of the Baltic sea grey seal population. Internal report, Swedish Museum of Natural History.
Svensson, C.J., Hansson, A., Harkonen, T., Harding, K. (2011) Detecting density dependence in growing seal populations. Ambio (2011) 40: 52–59. DOI 10.1007/s13280-010-0091-7.
Vanhatalo, J., Vetemaa, M., Herrero, A., Aho, T., Tiilikainen, R. (2014) By-Catch of Grey Seals (Halichoerus grypus) in Baltic Fisheries—A Bayesian Analysis of Interview Survey. PLoS ONE 9(11): e113836. doi:10.1371/journal.pone.0113836.
Harding, K.C., Härkönen, T., Caswell, H. (2002) The 2002 European seal plague: epidemiology and population consequences. Ecology Letters 5: 727-732.
Harding, K.C., Härkönen, T., Pineda, J. (2003) Estimating quasi-extinction risk of European harbour seals: a reply to Lonergan and Harwood. Ecology Letters 6: 894-897.
Härkönen, T., Harding, K.C. (2001) Spatial structure of harbour seal populations and the implications thereof. Can. J. Zool. 79: 2115-2127.
Harkonen, T., Harding, K.C. (2011) Predicting recurrent PDV epidemics in European harbour seals. NAMMCO Scientific Publications 8: 275-284.
Heide-Jørgensen, M.-P., Härkönen, T. (1992) Epizootiology of seal disease. J. Appl. Ecol. 29: 99-107.
Heide-Jørgensen, M.-P., Härkönen, T., Dietz R., Thompson, P. (1992) Retrospective of the 1988 European seal epizootic. Diseases of Aquatic Organisms 13: 37-62.
Mortensen, P., Bergman, A., Bignert, A., Hansen, H.J., Härkönen, T., Olsson, M. (1992) Prevalence of skull lesions in harbour seals Phoca vitulina in Swedish and Danish museum collections during the period 1835-1988. Ambio 21: 520-524.
Palo, J.U., Mäkinen, H.S., Helle, E., Stenman, O., Väinölä, R. (2001) Microsatellite variation in ringed seals (Phoca hispida): genetic structure and history of the Baltic Sea population. Heredity 86: 609–617. doi: 10.1046/j.1365-2540.2001.00859.x.