 Harbour porpoise distribution
2. Relevance of the indicator
The qualitative evaluation signals changes in the abundance and distributional range of a top predator in the Baltic Sea. As a top predator in the marine ecosystem, the harbour porpoise is a good indicator of the state of food webs, levels of hazardous substances, and the degree of human disturbance on the ecosystem. Given the critically endangered status of the Baltic Proper population (IUCN and HELCOM) (Hammond et al., 2008a; HELCOM, 2013), and the fact that all indicators for this population (and species) are still under development within HELCOM, this qualitative evaluation is necessary for the population to be included in HOLAS 3 as a key component of the ecosystem.
2.1 Ecological relevance
Harbour porpoises are likely to have played an important role in the past functioning of the Baltic Sea ecosystem. However, it is highly unlikely that they fulfil this role currently, due to the low population abundance and critically endangered status, which means that the Baltic Proper harbour porpoise is in practice ecologically extinct. The presence of top predators allows for natural control of the distribution, abundance, diversity, and health of their prey species, with harbour porpoises likely previously playing an important role in maintaining a natural balance in the Baltic Sea ecosystem. Being a highly mobile species both horizontally over space and vertically over depth, harbour porpoises also likely played an important role in nutrient transfer across the Baltic Sea region. If not severely reduced, the species can also act as a good indicator of changes in the Baltic Sea ecosystem, as they are sensitive to changes at lower levels in the ecosystem and human induced pressures.
One of the strongest threats to harbour porpoises is the risk of being bycaught in fishing gear, which results in direct mortality (e.g. ICES, 2019; IMR-NAMMCO, 2019). Survival and fecundity can also be reduced by exposure to contaminants (Beineke et al., 2007a, 2007b; Jepson et al., 2005; Murphy et al., 2015). Additionally, both impulsive and continuous underwater noise have negative influences on porpoises, ranging from behavioural disturbance that reduces the efficiency of foraging and communication, through to permanent injury and death (e.g. Hermannsen et al., 2014; Lucke et al., 2009; Sarnocińska et al., 2020; Siebert et al., 2022; Wisniewska et al., 2018). Harbour porpoises have high-energy requirements and must feed almost continuously to meet energy demands (e.g. MacLeod et al., 2014; Spitz et al., 2012; Wisniewska et al., 2016). This makes the species particularly susceptible to negative impacts from resource depletion and disturbance from human presence. In populations that are healthy and not exposed to high levels of pressures, harbour porpoises have shown population increases of 9-10% per year (Forney et al., 2020). As the abundance of the Baltic Proper population is critically low, it is not influenced by density dependence issues. A level of growth (or a decline) significantly lower than the level of known possible population growth for the species indicates that there is likely something within the ecosystem that is restricting the population, and that human pressures may be causing an issue in the natural state of the Baltic Sea.
2.2 Policy relevance
The indicator on the distribution of harbour porpoise addresses the 2021 Baltic Sea Action Plan’s (BSAP 2021) overall goal of achieving a good environmental status of Baltic Sea, specifically the ecological objective of ‘Viable populations of all species’. Under the theme ‘Conservation of species’, this indicator is related to action B8:
- ‘By 2022 at the latest, specify knowledge gaps on all threats to the Baltic Proper harbour porpoise population, and by 2023 for the western Baltic population, including by-catch and areas of high by-catch risk, underwater noise, contaminants and prey depletion. Knowledge gaps related to areas of high by-catch risk are to be addressed and by 2028 at the latest additional areas of high by-catch risk for both Baltic Sea populations are to be determined. To strengthen the Baltic harbour porpoise population, by 2025 identify possible mitigation measures for threats other than by-catch and implement such measures as they become available.’
The indicator has relevance to the HELCOM Recommendation 17/2 (HELCOM, 2020) on protection of harbour porpoise in the Baltic Sea and HELCOM Recommendation 37/2 on the protection of species classified as threatened on the HELCOM Red List.
Other BSAP 2021 ecological objectives of ‘Natural distribution, occurrence and quality of habitats and associated communities’ and ‘Functional, healthy and resilient food webs’ towards achieving the biodiversity segment goal of a “Baltic Sea ecosystem [that] is healthy and resilient”.
The indicator also addresses the following qualitative descriptors of the MSFD for determining good environmental status (European Commission 2008), further elaborated under Commission Decision (EU) 2017/848 that lays down criteria and methodological standards on good environmental status of marine waters (see also Table 1):
- Descriptor 1: Species groups of birds, mammals, reptiles, fish and cephalopods
- Descriptor 4: Ecosystems, including food webs;
- Descriptor 8: Concentrations of contaminants are at levels not giving rise to pollution effects and
- Descriptor 11: ‘Introduction of energy, including underwater noise, is at levels that do not adversely affect the marine environment’.
The indicator is also highly relevant to the implementation of the Habitats Directive (HD, 92/43/EEC). Additionally, the indicator is of relevance to the ASCOBANS Recovery Plan for Baltic Harbour Porpoises (ASCOBANS 2016), Jastarnia Plan, and ASCOBANS Resolution 9.2 on the Baltic Proper harbour porpoise (ASCOBANS, 2020). There is also some relevance of this indicator to the EU Delegated Regulation regarding measures to reduce incidental catches of the resident population of the Baltic Proper harbour porpoise (Phocoena phocoena) in the Baltic Sea (2022/303), the EU Regulation on the conservation of fisheries resources and the protection of marine ecosystems through technical measures (2019/1241), the EU Common Fisheries Policy (1380/2013), and the EU Maritime Spatial Planning Directive (2014/89/EU).
Table 1. Policy relevance for this HELCOM indicator.
| Baltic Sea Action Plan (BSAP) | Marine Strategy Framework Directive (MSFD) | |
| Fundamental link |
Segment: Biodiversity
Goal: “Baltic Sea ecosystem is healthy and resilient”
|
Descriptor 1 Species groups of birds, mammals, reptiles, fish and cephalopods.
|
| Complementary link
|
Segment: Biodiversity
Goal: “Baltic Sea ecosystem is healthy and resilient”
Segment: Hazardous substances and litter goal Goal: “Baltic Sea unaffected by hazardous substances and litter”
Segment: Sea-based activities Goal: “Environmentally sustainable sea-based activities”
|
Descriptor 1 Species groups of birds, mammals, reptiles, fish and cephalopods.
Descriptor 4 Ecosystems, including food webs.
Descriptor 8 Concentrations of contaminants are at levels not giving rise to pollution effects.
Descriptor 11 Introduction of energy, including underwater noise, is at levels that do not adversely affect the marine environment.
|
| Other relevant legislation: |
|
|
2.3 Relevance for other assessments
The status of biodiversity is assessed using several HELCOM indicators, generally integrated or evaluated by key trophic or species groups. Each indicator focuses on one important aspect of the complex issue. In addition to providing an indicator-based evaluation of the distribution of harbour porpoises, this indicator will also contribute to the overall thematic assessment of biodiversity as part of HOLAS 3, in association with the other biodiversity indicators.
3 Threshold values
Distribution of harbour porpoises
The metric to be used for a distributional indicator for this species is yet to be defined. Determining a distribution indicator for a highly mobile marine species is challenging, as the animals are difficult to observe in the field, have seasonal movement patterns, and their distribution may vary between years due to natural cycles and anthropogenic pressures. As a result, for this qualitative evaluation, good environmental status is achieved when the distributional range and frequency of harbour porpoise records in the Baltic Sea are the same as those recorded historically (in the early 1900s), taking confounding factors into account (see Confidence of the qualitative evaluation).
3.1 Setting the threshold value(s)
No quantitative threshold value exist at this stage, but the HOLAS 3 evaluation on the distribution of harbour porpoise in the Baltic Proper is an expert-based evaluation. Based on the spatiotemporal distribution of the records compiled it is evident that the harbour porpoise was commonly occurring in the entire Baltic Sea in the beginning of the 1900s. A contraction of the range, resulting in more irregular observations and very few encountered dead animals in the Gulf of Bothnia and the Gulf of Finland in more recent years, likely occurred around the mid-1900s (HELCOM 2022).
More advanced threshold value setting approaches are expected to be developed in the future to facilitate quantitative evaluations, though extensive further work to achieve this is needed.
4 Results and discussion
The results of the indicator evaluation that underlie the key message map and information are provided below.
4.1 Status evaluation
The two populations are addressed separately below.
Baltic Proper harbour porpoise population
As only one dedicated survey has been carried out to evaluate the distribution of the Baltic Proper harbour porpoise population (within the SAMBAH project, preceding the HOLAS 3 period), the results of this indicator describe the recent distribution pattern based on all available collated information, but cannot be used for a status evaluation per se (i.e. not against a quantitative threshold value). The SAMBAH project identified two main areas with high probability of harbour porpoise detection during the reproductive season. One of those areas, situated on and around the offshore banks Hoburg’s Bank and the Northern and Southern Midsea Banks, is clearly separated from the known distribution range of the Belt Sea population during breeding season, suggesting this is an important breeding ground for the Baltic Proper population. This separation led to the identification of a south-western management border during May – October for the Baltic Proper harbour porpoise population stretching from Hanö Bay in south-eastern Sweden to a point on the Polish coast close to Słupsk (Carlén et al., 2018).
Due to the lack of appropriate data, as well as the absence of threshold values for a robust quantitative abundance evaluation, an expert-based qualitative evaluation on the distribution of the Baltic Proper harbour porpoise was carried out. The qualitative evaluation, supported by extensive observation data, considered the population’s currently known distribution in relation to the distribution and frequency of historical records of harbour porpoises within the May-October management range (Carlén et al., 2018).
In 2011-2013, the abundance of the Baltic Proper harbour porpoise population was estimated to 71-1105 individuals (95% CI, point estimate 491; Amundin et al., 2022). The number of historical records, the number of animals observed in the rare events of animals believed to have suffocated under sea ice (Ekman, 1938; Johansen, 1929; Lönnberg, 1940; Tägström, 1940), and data on catches from Polish fisheries statistics (Psuty, 2013), demonstrate that the abundance of harbour porpoises within the presently known management range of the Baltic Proper population (Carlén et al., 2018) was much higher up to year 1940 than today, likely several orders of magnitudes greater. The report on 48 bycaught animals by Swedish fishermen primarily using driftnet for salmon in 1961 (Lindroth, 1962), indicate that the abundance was at least an order of magnitude greater at that time.
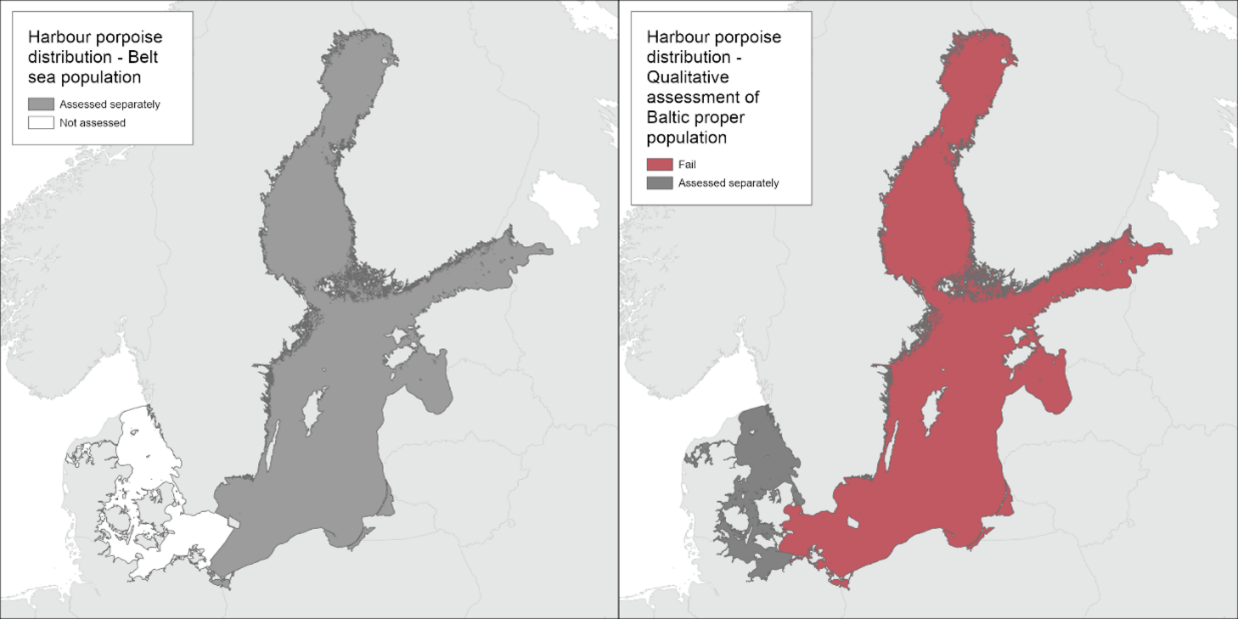
Based on the spatiotemporal distribution of the records compiled, it is evident that the harbour porpoise was commonly occurring in the entire Baltic Sea in the beginning of the 1900s. A contraction of the range, resulting in more irregular observations and very few encountered dead animals in the Gulf of Bothnia and the Gulf of Finland, likely occurred around the mid-1900s. The species was regularly reported up until and including the 1930s, but due to confounding factors, it is not possible to determine more accurately when the contraction took place. Due to the contraction in range, the distribution of the Baltic Proper harbour porpoise is evaluated to not achieve GES (Figure 2).
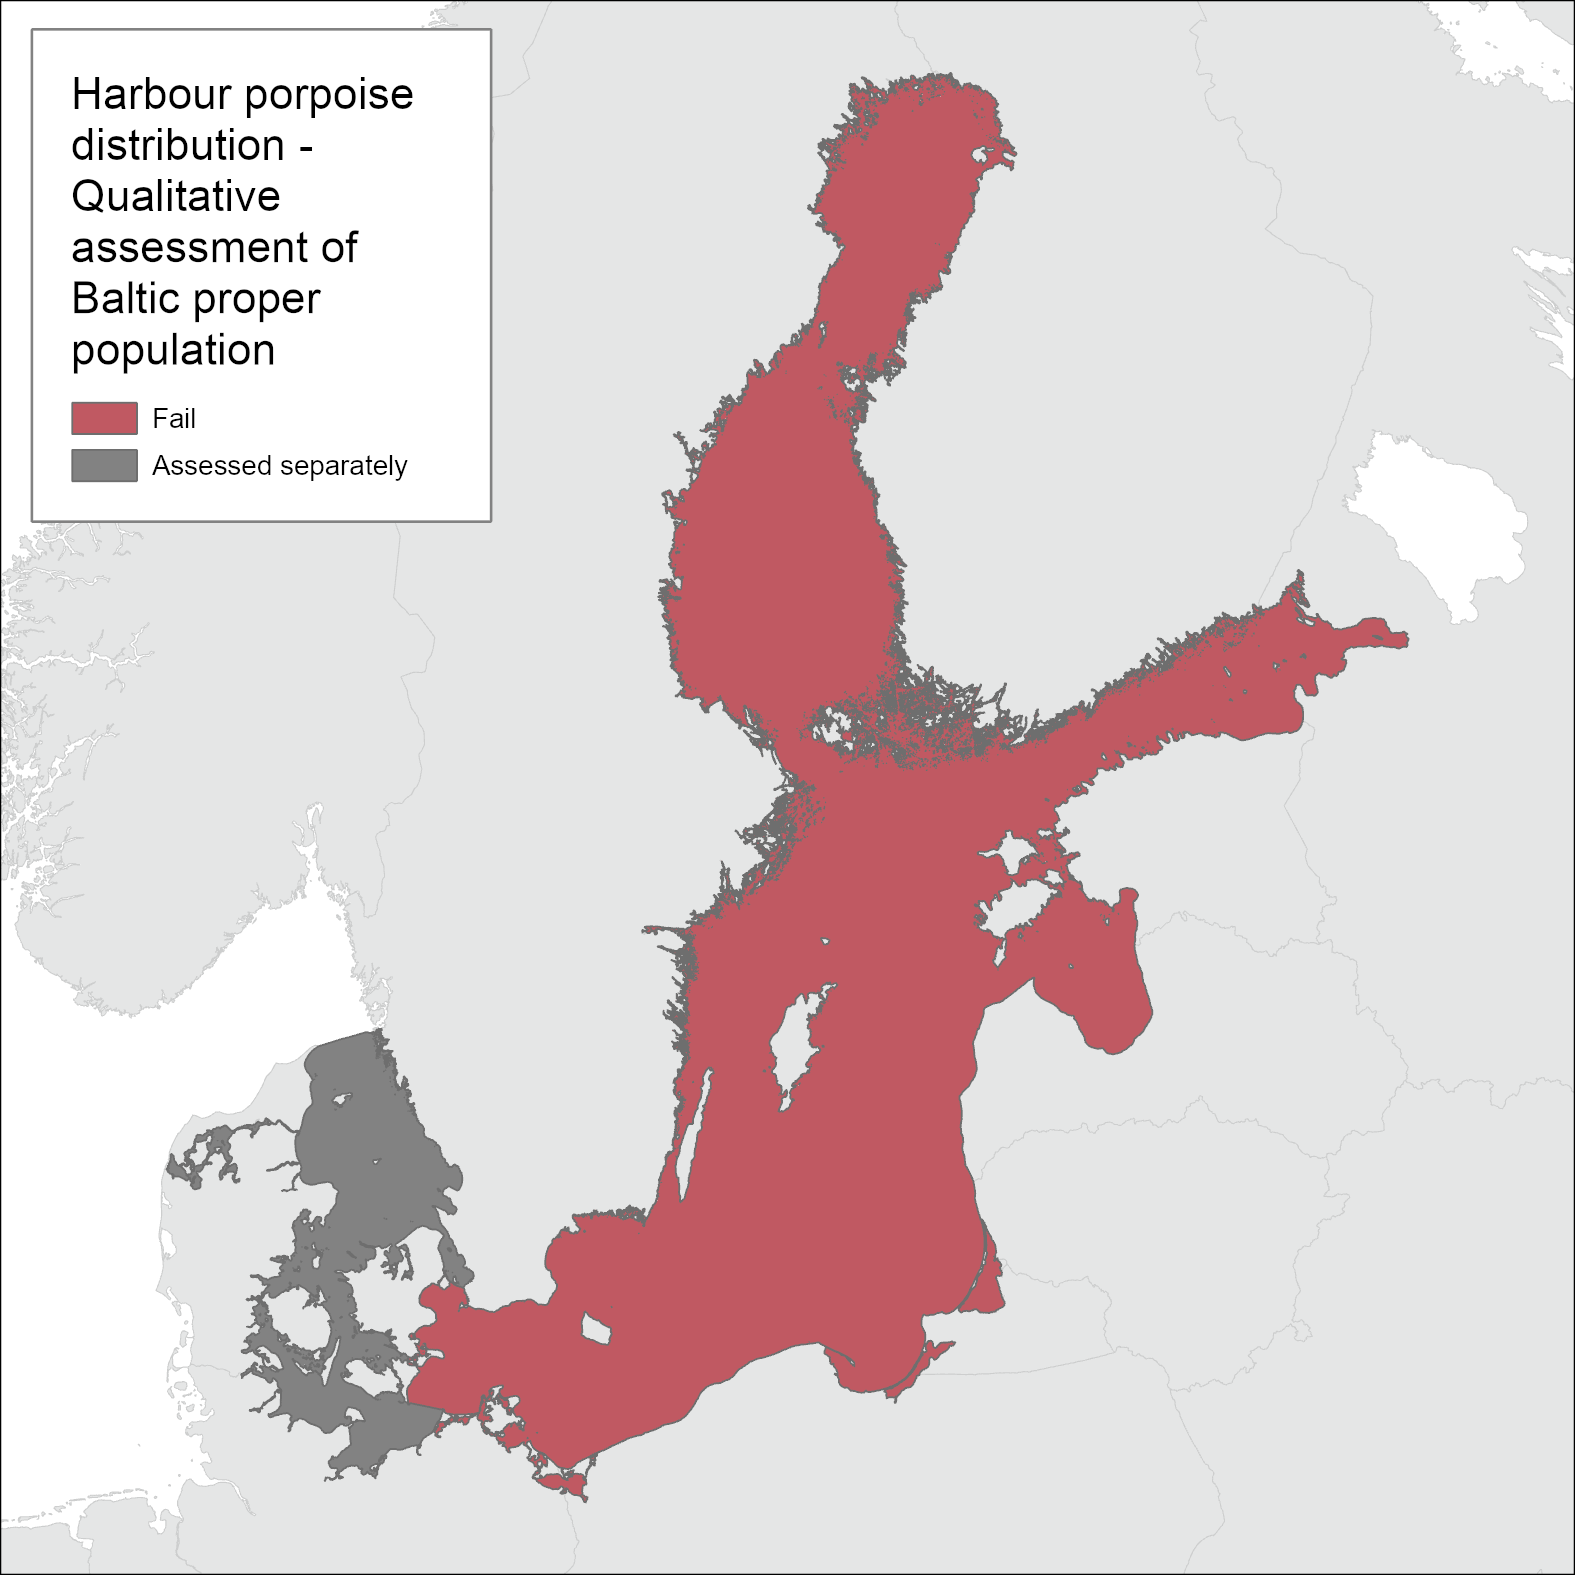
Figure 2. The Baltic Proper harbour porpoise does not achieve good environmental status with regard to distribution. Only one dedicated survey has been carried out in 2011-2013, and no threshold has been set, but the currently known distribution is drastically reduced in comparison to opportunistic records before 1950.
Belt Sea harbour porpoise population
No evaluation on distribution is currently applied for the Belt Sea harbour porpoise population. Ongoing work aims to achieve this for future evaluations.
4.2 Trends
This qualitative evaluation, for use in HOLAS 3, is the first time an evaluation of the distribution of the harbour porpoise population has been conducted (Table 2). Accordingly, no trend in comparison to a previous evaluation (e.g., HOLAS II) is available. Trends in the data utilised to support the qualitative evaluation are presented in the discussion text below.
Table 2: Assessment unit specific evaluation result summary and comparison. Please note that the table only presents qualitative values, as no quantitative threshold values exist.
| HELCOM Assessment unit name (and ID) | Threshold value achieved/failed | Distinct trend between current and previous evaluation. | Description of outcomes, if pertinent. |
| Belt Sea population
(SEA-001 – SEA-005) |
Not yet evaluated | Not applicable, first iteration of this indicator. | NA |
| Baltic Proper population
(SEA-006 – SEA-017) |
Failed (qualitative) | Not applicable, first iteration of this indicator. | Expert-based qualitative evaluation determines the Baltic Proper population to be far from achieving Good Environmental Status due to a severe reduction in distribution, based on collated historical records. |
4.3 Discussion
Records of harbour porpoise observations
Of the 11,492 records (bycatch, hunted or killed, stranded, incidental sightings, effort sightings, and reports with unknown type) in the HELCOM/ASCOBANS harbour porpoise database (HELCOM, 2022), 508 were identified as being within the May-October management range of the Baltic Proper population (see Methodology below for area description and data inclusion protocol), and included in this qualitative evaluation. Additionally, a total 281 records within the management range that were not previously in the HELCOM/ASCOBANS harbour porpoise database were identified. An overview of years from which records with a geographical position located east of the May-October management range of the Baltic Proper harbour porpoise population (Carlén et al., 2018) were compiled, divided per country, is shown in Figure 3. Despite that absence data are not known, the overview clearly shows a gap in Swedish records from 1907 until the late 1900s, and that Polish data with geographical information is missing before 1950. No data with a geographical position is available from the Danish waters within the area of concern.
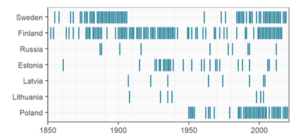
Figure 3. Overview of years from which records on harbour porpoises (bycatch, hunted or killed, stranded, incidental sightings, effort sightings, and reports with unknown type observations) with a geographical position located east of the May-October management border of the Baltic Proper harbour porpoise (Carlén et al., 2018) were compiled, divided per country.
The analysis was carried out over four regions (Gulf of Bothnia, Gulf of Finland, Gulf of Riga, and the Baltic Proper) to ease interpretation, with the results for each region discussed individually below. A summary for the population level then follows.
Spatial distribution of harbour porpoise records over time
All records with a geographical position are shown in Figure 4. Each record may be of one or more individuals, and records with the same geographical position are only shown as one position. Positions of animals primarily encountered dead (bycatch, stranding, and incidental sightings of dead animals) are shown separately from those primarily encountered alive (incidental sightings not noted to be dead, and hunted or killed animals). With the exception of acoustic monitoring data not included here, no effort sighting with a geographical position was found within the area of concern. Figure 4 also shows the borders of the four regions for which data were compiled; the Gulf of Bothnia (Bothnian Bay, The Quark, and Bothnian Sea), the Gulf of Finland, the Gulf of Riga, and the Baltic Proper (Åland Sea, Northern Baltic Proper, Western Gotland Basin, Eastern Gotland Basin, Gdansk Basin, and the eastern part of Bornholm Basin. The southwestern border of the Baltic Proper region follows the May-October management border of the Baltic Proper harbour porpoise population (Carlén et al., 2018), while the other regional borders follow delimitations of HELCOM Scale 2 HELCOM assessment units. The records are divided into three time periods: before 1950, 1950-1990, and after 1990 (see Methodology for justification).
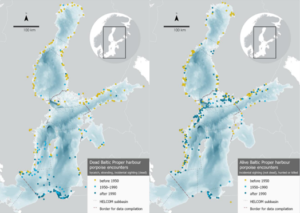
Figure 4. Maps showing the geographical positions of all records for which this was found or could be assigned, and the borders of the four regions for which data were compiled; the Gulf of Bothnia (Bothnian Bay, The Quark, and Bothnian Sea), the Gulf of Finland, the Gulf of Riga, and the Baltic Proper (Åland Sea, Northern Baltic Proper, Western Gotland Basin, Eastern Gotland Basin, Gdansk Basin, and the eastern part of Bornholm Basin). The southwestern border of the Baltic Proper region follows the May-October management border of the Baltic Proper harbour porpoise population (Carlén et al., 2018), while the other regional borders follow delimitations of HELCOM Scale 2 HELCOM assessment units. Left: Animals primarily encountered dead (bycatch, stranding, and incidental sightings of dead animals). Right: Animals primarily encountered alive (incidental sightings of animals not noted to be dead, and hunted or killed animals). Bathymetry database © BSHC.
The spatial distribution of animals primarily encountered dead during the three time periods show that in the Gulf of Bothnia and the Gulf of Finland, the vast majority (90 and 85%) of records are from before 1950. In the Baltic Proper region, records from before 1950 dominate in the north, most records during 1950-1990 are in the central and southern parts of the region, while records after 1990 dominate in the south. In the Gulf of Riga, there is a small number of records from all three time periods and no spatial trend can be seen over time.
Also, for animals primarily encountered alive, records from before 1950 dominate in the Gulf of Bothnia (85%). In the Gulf of Finland, about half are before 1950 (45%). However, after 1990, there are more records of animals primarily encountered alive than dead. In the Baltic Proper region, there are very few records during 1950-1990, and records before and after this period are spatially mixed, with the exception of the southern coast where records from after 1990 dominate. Again, there is a small number of records from all time periods in the Gulf of Riga, and no spatial trend can be seen over time.
Temporal distribution of harbour porpoise numbers within summary regions
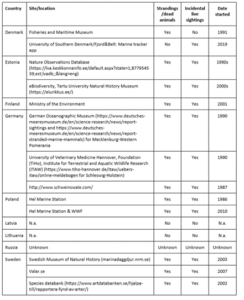
Histograms of the number of geographically positioned observed animals per year within the Gulf of Bothnia and the Gulf of Finland is shown in Figure 5. The bars show the total number of animals recorded, and they may be from one or more records. Animals primarily encountered dead are shown separately from those primarily encountered alive.
In the Gulf of Bothnia, the numbers of records of both dead and alive animals peaked in the late 1800s and early 1900s (Figure 5). From the late 1870s to 1906, the species was recorded almost every year. During the 1910s-1930s, animals primarily encountered dead were recorded in eight years, and animals primarily encountered alive in seven years, at the most seven dead and nine alive in a year. The highest recorded number of animals primarily encountered dead in any year was eight (year 1902), and alive 28 (year 1891). During 1940-1999, there were a total of eight records of animals primarily encountered dead, and one alive. During 2000-2019, there is not a single dead animal, but records of 1-11 primarily alive animals per year, during 15 of these 20 years. The temporal pattern reflects that the compilation of historical records in Swedish waters only reaches to year 1906 (note that the last years are not complete), and that sightings schemes were established in both Finland and Sweden in the early 2000s (see methodology and Table 5). However, despite these shortcomings of the opportunistically collected data, it is obvious that the frequency of sightings and number of observed animals is significantly lower during recent decades than in the late 1800s and early 1900s. The pattern is most striking for animals primarily encountered dead, which also is a more reliable category than animals observed alive, with very few records after 1940.
In the Gulf of Finland, the general temporal pattern is similar to that in the Gulf of Bothnia, although the number of animals is smaller and there are fewer records before 1906 (Figure 5). The majority of the primarily dead animals were recorded up to the 1930s, and the last dead animal was recorded in 1992. The pattern for animals primarily encountered alive is not as clear, and the first year with a higher number of primarily alive animals in modern times was 1990. The highest number of primarily dead animals in one year was 22 (1916), and the highest number of primarily alive animals in one year was 16 (1913). Similar to the Gulf of Bothnia, the establishment of strandings programmes and reporting systems (Estonia in the 1990s, Finland in 2001; see methodology and Table 5) is likely to have influenced the number of animals primarily encountered alive since then (more than the number primarily encountered dead as only a small proportion of animals that die at sea are washed ashore, and the species identification is more reliable of dead animals), and the temporal pattern of animals primarily encountered dead shows a significant decrease since 1940.
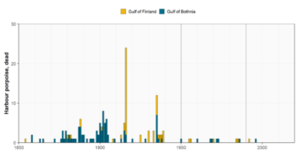
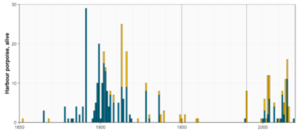
Figure 5. Number of geographically positioned observed animals per year within the Gulf of Bothnia (Bothnian Bay, The Quark, and Bothnian Sea) and the Gulf of Finland. Top panel: Animals primarily encountered dead (bycatch, stranding, and incidental sightings of dead animals); bottom panel: animals primarily encountered alive (incidental sightings not noted to be dead, and hunted or killed animals). The vertical lines show the time periods used in Figure 3.
In the Baltic Proper (Åland Sea, Northern Baltic Proper, Western Gotland Basin, Eastern Gotland Basin, Gdansk Basin, and the eastern part of Bornholm Basin) and in the Gulf of Riga, there are overall fewer historical records than in the Gulf of Bothnia and Gulf of Finland. In the Baltic Proper during 1880-1979, there are 37 years with records of primarily encountered dead animals and 27 years with records of animals primarily encountered alive (Figure 6). The majority of these records are from 1880-1906, i.e. coinciding with the time period when the number of records peaked in the Gulf of Finland. From 1910 and onwards, there are sporadic records of both animals primarily encountered dead and alive. Most commonly single animals were recorded, but in 1961 the number of animals primarily encountered dead is outstanding: 48. This record is from Lindroth (1962), who asked Swedish fishermen to collect bycaught harbour porpoises, primarily in drift nets for salmon (Salmo salar), for analysis of stomach contents. In the 1980s, the number of recorded animals primarily encountered dead increased; during 1984-2019, a total of 193 animals primarily encountered dead were recorded, resulting in an average of 5.3 animals per year. The increase in records of animals primarily encountered alive comes a decade later, in the 1990s, and even more from year 2000 and onwards. The highest numbers of animals primarily encountered alive in any year before 1980 were 23 and 22 (1885 and 1886), and the highest number after 1980 was 47 (2009) (Figure 6).
The lower rate of historical records in the Baltic Proper compared to the Gulf of Bothnia, with the exception of 1961, is believed to reflect that the species was relatively common and therefore observations were not recorded. Still the impact by the digitally searchable database in Sweden with records available until 1906 can be seen in the records, with more frequent observations and higher numbers per year until then. The outstanding number of animals primarily encountered dead recorded in 1961 confirms that the species indeed was frequently encountered at that time. The increase in animals primarily encountered dead in the 1980s is likely a result of increased efforts of carcass collections for studies of environmental pollutants (e.g. Berggren et al., 1999), and increased awareness of the species’ decline. The increase in records of animals primarily encountered alive, beginning in the 1990s and reaching the highest annual averages from year 2000, coincides with the time periods for when strandings programmes and reporting systems were established and became more common (see methodology and Table 5).
In the Gulf of Riga, the number of records is small, and no temporal trend can be seen (Figure 6). The last record of an animal likely encountered dead was in 2003, and of an animal likely encountered alive in 2006.
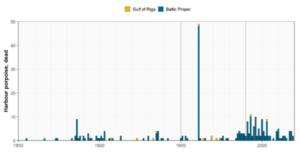
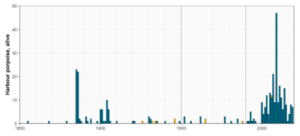
Figure 6. Number of geographically positioned observed animals per year within the Baltic Proper region (Åland Sea; Northern Baltic Proper; Western Gotland Basin; Eastern Gotland Basin; Gdansk Basin; eastern part of Bornholm Basin) and the Gulf of Riga. Top panel: Animals primarily encountered dead (bycatch, stranding, and incidental sightings of dead animals); bottom panel: animals primarily encountered alive (incidental sightings not noted to be dead, and hunted or killed animals). The vertical lines show the time periods used in Figure 3.
5 Confidence
Baltic Proper harbour porpoise population
Despite the lack of quantified thresholds, the confidence of the evaluations is high. All accessible historical records have been reviewed carefully, and only those that have been identified as probable harbour porpoise observations have been included. The description of the locations, on which the geographical positions of the observations were often based on, were overall accurate. Additionally, the time given for the observations was in most cases on the exact day or week. For only 14 of the 281 new records, the information on time was less accurate than year: 3 with a latest year of encounter (e.g. date of donation to a museum, but not the original observation date), 6 with only the decade known, and 5 specified as “some years ago” or with a margin of ±1 year. The level of detail of this information does not reduce the confidence of the qualitative evaluation, as it is based on a broad spatial scale (four large regions covering HELCOM sub-basins) and a historical time perspective (decades).
Possible confounding factors of the evaluation are that the observation effort and the interest in reporting opportunistic records is unknown. The effort is likely to have varied over time due to factors such as: 1) the number and distribution of people at sea, 2) fishing effort and practices, and 3) the methods available to report an observation. For example, there are in general few records during World War I and II. In contrast, as the human population has increased and motorised recreational vessels become readily available, more people are spending time at sea. Also, the fishing effort and the number of active fishers have varied considerably with technical developments, fishing regulations, and varying profitability. The establishment of online reporting systems during the last decades (see methodology and Table 5) has facilitated reporting and data storage.
The willingness of reporting an observation is likely to have varied due to factors such as 1) how “newsworthy” the observation is, 2) awareness of the conservation status of the species, and 3) fear of negative consequences by the reports. For example, before 1950, there were more records in the Gulf of Bothnia than in the Baltic Proper, because an observation in the Gulf of Bothnia was a rarer event than in the Baltic Proper. Also, when the harbour porpoise population was not assessed as endangered, information on direct and incidental catches were shared as exciting stories by the newspapers and caught or bycaught animals were sometimes advertised and put on public display, while in recent times direct reports by fishers are very rare. Contrary, the general public’s interest in reporting opportunistic observations, and the scientific efforts in collecting carcasses, have increased when the species has become rarer. For Swedish records, yet another confounding factor is that most of the newspapers only are digitally searchable until around 1906.
Belt Sea harbour porpoise population
Not applicable, since a qualitative evaluation has not been done for the Belt Sea population distribution.
6 Drivers, Activities, and Pressures
Human pressures linked to the indicator
There are a number of human pressures listed in Annex III of the MSFD that are linked to the qualitative evaluation of the Baltic Proper harbour porpoise population (see also Table 4). These include:
Biological features:
A description of the population dynamics, natural and actual range and status of species of marine mammals and reptiles occurring in the marine region or sub-region. For harbour porpoises, this relates to porpoise distribution and abundance.
Information on the structure of fish populations, including the abundance, distribution and age/size structure of the populations. For harbour porpoises, this relates to prey availability and quality.
Biological disturbance: selective extraction of species, including incidental non-target catches (e.g. by commercial and recreational fishing). For harbour porpoises, this relates to two distinct issues:
1) bycatch of the porpoises themselves resulting in direct mortality, and
2) reduction in the quality and quantity of prey resources due to competition with fisheries. – Other physical disturbance: Underwater noise (e.g. from shipping, underwater acoustic equipment), and marine litter. For harbour porpoises, this includes both impulsive noise (short and powerful noise from sources such as seismic surveys, pile driving, and underwater explosions) as well as continuous noise (from sources such as shipping and wind farm operation).
Marine litter (plastic) is also an issue for marine mammals that often results in mortality or reduced health. Ghost nets (lost or discarded fishing gear) can also result in direct mortality when animals become entangled.
Contamination by hazardous substances- Introduction of synthetic compounds and introduction of non-synthetic substances and compounds. For harbour porpoises, high levels of contaminants have been shown to result in decreased fertility and increased mortality, particularly in calves that receive high levels of contaminants from their mother.
Physical and chemical features: annual and seasonal temperature regime and ice cover, current velocity, upwelling, wave exposure, mixing characteristics, turbidity, residence time. For harbour porpoises this can relate to the influence of climate change resulting in warmer water and more dead zones in the Baltic Sea.
Table 4. Brief summary of relevant pressures and activities with relevance to the indicator.
| | General | MSFD Annex III, Table 2a |
| Strong link | The main pressures affecting the distribution of Baltic harbour populations include, by-catches, physical disturbance via underwater noise, and contamination by hazardous substances. | Biological
Substances, litter and energy
Pressures by substances, litter and energy:
|
| Weak link | For harbour porpoises this can relate to the influence of climate change resulting in warmer water and more dead zones in the Baltic Sea.
Fishery and food availability |
Pressures by substances, litter and energy:
|
7 Climate change and other factors
The expected change in temperature and stratification, prey distribution, quality and quantity will affect all marine mammals, including Harbour Porpoises, but aggregated effects on their abundance and distribution are unpredictable (HELCOM/Baltic Earth 2021). It is furthermore predicted more maritime traffic in the Baltic Sea, leading to more underwater noise, which are relating to injuries and displacement from habitats. Implications of this also extents to the disturbance of behaviour of harbour porpoises due to the underwater noise affecting the functionality of echolocation. Changes in ecosystem structure and function could compound issues for already vulnerable populations.
8 Conclusions
Based on the spatiotemporal distribution of the records compiled, it is evident that the harbour porpoise was commonly occurring in the entire Baltic Sea in the beginning of the 1900s. A contraction of the range, resulting in more irregular observations and very few encountered dead animals in the Gulf of Bothnia and the Gulf of Finland in present days, likely occurred around the mid-1900s. The species was regularly reported up until and including the 1930s, but due to confounding factors (see Confidence of the qualitative evaluation below), it is not possible to determine more accurately when the contraction took place. Due to the contraction in range, the distribution of the Baltic Proper harbour porpoise is evaluated to not achieve GES.
8.1 Future work or improvements needed
While the current evaluation is a significant step forward to provides an initial evaluation there is need for significant further work to improve future evaluations. There is currently a lack of harmonisation in the passive acoustic monitoring used to monitor harbour porpoises and this issue needs to be addressed to advance future evaluations. There is variation in the filtering and processing methods used by different countries, and some variation in the device used. This prevents comparability between countries. There is a need for future harmonisation to facilitate population level evaluations of indicators, particularly for the critically endangered Baltic Proper population. In addition, further work is needed to establish a full and working understanding of relevant conservation objectives to support the development and agreement on quantifiable threshold values against which future evaluations can be applied. This process will also require the application of relevant methodologies to achieve the establishment of such threshold values and require suitable monitoring to be implemented to achieve the needed data sets for the evaluations. These aspects all require designated resourcing for progress to be made.
9 Methodology
9.1 Scale of assessment
This qualitative evaluation evaluates the abundance and distribution of the Baltic Proper harbour porpoise population using HELCOM assessment unit scale 2 (division of the Baltic Sea into 17 sub-basins) as its base, with these assessment units aggregated to relevant management areas. The assessment units are defined in the HELCOM Monitoring and Assessment Strategy Attachment 4.
9.2 Methodology applied
The review was completed by the Swedish Museum of Natural History as a part of the HELCOM BLUES project, with assistance on data sources from many experts around the Baltic Sea. Harbour porpoise records from the late 17th century until 2019 were reviewed in the waters of all countries around the Baltic Sea. These records could include bycatch, animals that were killed or hunted, incidental sightings, effort sightings, strandings, and reports of unknown type.
In addition to data available through the HELCOM/ASCOBANS harbour porpoise database, data were also compiled from published sources such as newspaper articles, scientific papers, reports, and museum records. Contacts were made with countries from which data access has been limited or unknown.
More specifically, data were compiled from the following sources: Denmark: Historical data on catches of dead animals in the Bornholm area during winter have been compiled from a published report (Johansen, 1929). Estonia: Data have been compiled from a review of harbour porpoise observations in Estonian waters. The review consisted of searches through newspaper articles, museum records and interviews with coastal people, and all records were geographically positioned (Jüssi and Liivak, 2005). Finland: All data, including historical records, were available in the HELCOM/ASCOBANS harbour porpoise database. Germany: TiHo and DMM confirmed they are not aware of any additional records that have not been submitted to the HELCOM/ASCOBANS database. We were directed to www.schweinswale.com that collected records between 1987 to 2014, and as far as we understand these data were already included in the HELCOM/ASCOBANS harbour porpoise database. Latvia: We were informed by the Nature Conservation Agency of the Latvian Government that all information from Latvia is already in the HELCOM/ASCOBANS database, and that there may be additional records in online newspapers. This site only includes newspaper records back until 1990. Lithuania: Data have been compiled from a review of harbour porpoise observations made for a protection plan and a summary of an action plan for harbour porpoises (Lithuanian Ministry of Environment, 2012). We identified geographical positions based on the written descriptions of the record. Poland: Data on historical observations have been compiled from published articles on observations of harbour porpoises, including records from bounty schemes (Psuty, 2013; Skóra et al., 1988). Russia: Data have been compiled from a report for a project reviewing the harbour porpoise presence in Russian territorial waters of the Baltic Sea (Guschin and Fedorov, 2011). This review consisted of questionnaires to sea users, searches through museum records, and field observations (including beach searches). We identified geographical positions based on the written descriptions of the records. Sweden: We compiled data from historical newspaper articles using a national database with a search for the word ‘tumlare’ (porpoise in Swedish) and ‘pyöriäinen’ (porpoise in Finnish). These records consisted of newspaper accounts up until 1906, with new records added over time. The digitisation process for the national database is still ongoing, and all records up to and including 1906 is planned to be available in January 2023. From 1907 and onwards, only the major newspapers will be digitised and searchable. This made a full review of all accounts impossible, but all records that were publicly available online at the time for the Swedish coastal counties ranging from the border to Finland in the north to Blekinge county in the southeast were compiled, i.e. the coastal stretch approximately within the May-October management range of the Baltic Proper harbour porpoise population.
We quality controlled the records for species and determined a geographical position for the record based on the written description. Further, we compiled data on historical observations on the occurrence of harbour porpoises from published reports and articles (Tägström, 1940; Ekman, 1938; Lindroth, 1962; Lönnberg, 1940). All data were compiled in a standardised format to facilitate upload to the HELCOM/ASCOBANS harbour porpoise database. In addition to compiling data on harbour porpoise records, information was also collated on the existence and start date of any strandings programme and reporting system for opportunistic harbour porpoise observations in the countries around the Baltic Sea.
The data on harbour porpoise records were divided into three time periods: before 1950, 1950-1990, and after 1990. These time periods were chosen based on the approximate time for when modern fishing methods were introduced (around 1950), and when strandings programmes and reporting systems for harbour porpoise observations were established (around 1990). Geographically, data were divided into four regions: the Gulf of Bothnia (Bothnian Bay, The Quark, and Bothnian Sea), the Gulf of Finland, the Gulf of Riga, and the Baltic Proper (Åland Sea, Northern Baltic Proper, Western Gotland Basin, Eastern Gotland Basin, Gdansk Basin, and the eastern part of Bornholm Basin). Maps and histograms for the four regions were produced to visualise changes in abundance and distribution over time. Historical data were compared to current information, including the most recent information on distribution and abundance from the SAMBAH project (Amundin et al., 2022; Carlén et al., 2018), and any published information from national monitoring programmes.
As there is no clear spatial separation between the Belt Sea and Baltic Proper harbour porpoise populations during November-April (Carlén et al., 2018), the review focused on data east of the May-October management range for the Baltic Proper harbour porpoise population (Carlén et al., 2018). The results were applied on all HELCOM sub-basins ranging from Arkona Basin and eastwards, i.e. the twelve sub-basins overlapping with the tentative management range of the population during November-April, also including the sub-basins overlapping with the May-October management range.
Methodology applied to the Baltic Proper harbour porpoise population
In the SAMBAH project, passive acoustic monitoring and species distribution models were used to describe the spatial and seasonal distribution of harbour porpoises in the Baltic Proper (Carlén et al., 2018). Porpoise click detectors were deployed over a systematic grid of 304 stations in eight countries and data collected from April 2011 through June 2013 were analysed. Generalized additive models (GAMs) were used to describe the monthly probability of detecting porpoise clicks as a function of spatially-referenced covariates and time.
The qualitative evaluation of the distribution of the Baltic Proper harbour porpoise was completed by the Swedish Museum of Natural History as a part of the HELCOM BLUES project, with assistance on data sources from many experts around the Baltic Sea. Harbour porpoise records from the late 17th century until 2019 were reviewed in the waters of all countries around the Baltic Sea. These records could include bycatch, animals that were killed or hunted, incidental sightings, effort sightings, strandings, and reports of unknown type.
Data were compiled from published sources such as newspaper articles, scientific papers, reports, museum records, as well as the HELCOM/ASCOBANS harbour porpoise database. Additionally, contacts were made with countries from which data access has been limited or unknown.
The data on harbour porpoise records were divided into three time periods: before 1950, 1950-1990, and after 1990. These time periods were chosen based on the approximate time for when modern fishing methods were introduced (around 1950), and when strandings programmes and reporting systems for harbour porpoise observations were established (around 1990). Geographically, data were divided into four regions: the Gulf of Bothnia (Bothnian Bay, The Quark, and Bothnian Sea), the Gulf of Finland, the Gulf of Riga, and the Baltic Proper (Åland Sea, Northern Baltic Proper, Western Gotland Basin, Eastern Gotland Basin, Gdansk Basin, and the eastern part of Bornholm Basin).
As there is no clear spatial separation between the Belt Sea and Baltic Proper harbour porpoise populations during November-April (Carlén et al., 2018), the review focused on data east of the May-October management range for the Baltic Proper harbour porpoise population (Carlén et al., 2018). The results were applied on all HELCOM sub-basins ranging from Arkona Basin and eastwards, i.e. the twelve sub-basins overlapping with the tentative management range of the population during November-April, also including the sub-basins overlapping with the May-October management range.
9.3 Monitoring and reporting requirements
Information on strandings programme and reporting system for harbour porpoise observations in the countries around the Baltic Sea is shown in Table 5.
Table 5. Overview of strandings programmes and reporting systems for harbour porpoise observations in the countries around the Baltic Sea.
Monitoring methodology
The current monitoring carried out in HELCOM is not directly relevant to the qualitative evaluation applied for HOLAS 3. The development of optimal and harmonised monitoring is underway and will be vital or future development of this indicator.
Monitoring of the distribution of harbour porpoises in the Contracting Parties of HELCOM is described on a general level in the HELCOM Monitoring Manual in the Harbour porpoise abundance sub-programme.
10 Data
Access and use
All data compiled for the qualitative evaluation will be made available for the HELCOM/ASCOBANS harbour porpoise database and HELCOM Biodiversity Database.
The data and resulting data products (e.g. tables, figures and maps) available on the indicator web page can be used freely given that it is used appropriately and the source is cited.
11 Contributors
Julia Carlström, Swedish Museum of Natural History, Sweden
Kylie Owen, Swedish Museum of Natural History, Sweden
Pia Eriksson, Swedish Museum of Natural History, Sweden
Data contributors and people who have provided assistance: Carl C. Kinze, Seals and Whales of Denmark, Denmark; Signe Sveegaard, Aarhus University, Denmark; Ivar Jüssi, ProMare, Estonia; Aleksander Klauson, TalTech, Estonia; Elo Rasmann, Ministry of the Environment, Estonia; Olli Louisa, Turku University of Applied Sciences, Finland; Anja Gallus, German Oceanographic Museum, Germany; Michael Dähne, German Oceanographic Museum, Germany; Anita Gilles, University of Veterinary Medicine Hannover, Germany; Saulius Karalius, Lithuanian Sea Museum, Lithuania; Aistė Kubiliūtė, Environmental Protection Agency, Lithuania; Airita Brenča, University of Latvia, Latvia; Iwona Pawliczka, University of Gdansk, Poland; Irina Trukhanova, Baltic Fund for Nature, Russia
HELCOM Secretariat: Jannica Haldin, Owen Rowe, Jana Wolf
Project: HELCOM BLUES
12 Archive
This version of the HELCOM core indicator report was published in April 2023:
The current version of this indicator (including as a PDF) can be found on the HELCOM indicator web page.
This version of the HELCOM pre-core indicator report was published in 2023 and is the first iteration of this indicator, thus no prior version is available.
13 References
Amundin, M., Carlström, J., Thomas, L., Carlén, I., Koblitz, J., Teilmann, J., Tougaard, J., Tregenza, N., Wennerberg, D., Loisa, O., Brundiers, K., Kosecka, M., Kyhn, L.A., Tiberi Ljungqvist, C., Sveegaard, S., Burt, M.L., Pawliczka, I., Jussi, I., Koza, R., Arciszewski, B., Galatius, A., Jabbusch, M., Laaksonlaita, J., Lyytinen, S., Niemi, J., Šaškov, A., MacAuley, J., Wright, A.J., Gallus, A., Blankett, P., Dähne, M., Acevedo-Gutiérrez, A., Benke, H., 2022. Estimating the abundance of the critically endangered Baltic Proper harbour porpoise (Phocoena phocoena) population using passive acoustic monitoring. Ecol. Evol. 12, e8554. https://doi.org/10.1002/ece3.8554
ASCOBANS, 2016. ASCOBANS Recovery Plan for Baltic Harbour Porpoises: Jastarnia Plan (2016 Revision). Agreement on the Conservation of Small Cetaceans in the Baltic, North East Atlantic, Irish and North Seas (ASCOBANS
ASCOBANS, 2020. The Baltic Proper harbour porpoise. UNEP/ASCOBANS/Res.9.2.
Beineke, A., Siebert, U., Müller, G., Baumgärtner, W., 2007a. Increased blood interleukin-10 mRNA levels in diseased free-ranging harbor porpoises (Phocoena phocoena). Vet. Immunol. Immunopathol. 115, 100–106. https://doi.org/10.1016/j.vetimm.2006.09.006
Beineke, A., Siebert, U., Stott, J., Müller, G., Baumgärtner, W., 2007b. Phenotypical characterization of changes in thymus and spleen associated with lymphoid depletion in free-ranging harbor porpoises (Phocoena phocoena). Vet. Immunol. Immunopathol. 117, 254–265. https://doi.org/10.1016/j.vetimm.2007.03.009
Berggren, P., Ishaq, R., Zebühr, Y., Näf, C., Bandh, C., Broman, D., 1999. Patterns and levels of organochlorines (DDTs, PCBs, non-ortho PCBs and PCDD/Fs) in male harbour porpoises (Phocoena phocoena) from the Baltic Sea, the Kattegat-Skagerrak Seas and the west coast of Norway. Mar. Pollut. Bull. 38, 1070–1084. https://doi.org/10.1016/S0025-326X(99)00098-3
Carlén, I., Thomas, L., Carlström, J., Amundin, M., Teilmann, J., Tregenza, N., Tougaard, J., Koblitz, J.C., Sveegaard, S., Wennerberg, D., Loisa, O., Dähne, M., Brundiers, K., Kosecka, M., Kyhn, L.A., Ljungqvist, C.T., Pawliczka, I., Koza, R., Arciszewski, B., Galatius, A., Jabbusch, M., Laaksonlaita, J., Niemi, J., Lyytinen, S., Gallus, A., Benke, H., Blankett, P., Skóra, K.E., Acevedo-Gutiérrez, A., 2018. Basin-scale distribution of harbour porpoises in the Baltic Sea provides basis for effective conservation actions. Biol. Conserv. 226, 42– 53. https://doi.org/10.1016/j.biocon.2018.06.031
Ekman, S. 1938. Tumlaren. Brehm, A.: Djurens liv. Del 1. Stockholm.
Forney, K. A., Moore, J. E., Barlow, J., Carretta, J. V., Benson, S. R. (2020). A multidecadal Bayesian trend analysis of harbor porpoise (Phocoena phocoena) populations off California relative to past fishery bycatch. Marine Mammal Science, 37(2), 546–560. 10.1111/csp2.468
Guschin A., Fedorov V. 2011. Project Report: Inventories of harbour porpoise Phocaena phocaena presence in Russian territorial waters of the Baltic Sea. Under project agreement No SSFA / ASCOBANS / 2010 / 1. Submitted to the 19 the ASCOBANS Advisory Committee Meeting (AC19/Doc.6-03 (S)), Galway, Ireland, 2022 March 2012.
Hammond, P.S., Bearzi, G., Bjørge, A., Forney, K., Karczmarski, L., Kasuya, T., Perrin, W.F., Scott, M.D., Wang, J.Y., Wells, R.S., Wilson, B., 2008a. Phocoena phocoena (Baltic Sea subpopulation) ((errata version published in 2016) The IUCN Red List of Threatened Species 2008: e.T17031A6739565
HELCOM, 2013. HELCOM Red List of Baltic Sea species in danger of becoming extinct. Balt. Sea Environ. Proc. No. 140.
HELCOM, 2016. Conservation of Baltic Sea species categorized as threatened according to the 2013 HELCOM Res List. HELCOM Recommendation 37/2. Adopted 10 March 2016.
HELCOM, 2020. Protection of harbour porpoise in the Baltic Sea area. HELCOM Recommendation 17/2. Adopted 12 March 1996 and amended 4 March 2020.
HELCOM, 2021. HELCOM Baltic Sea Action Plan – 2021 update. HELCOM BSAP 2021.
HELCOM, 2022. Harbour porpoise observations of type bycatch, hunted or killed, stranded, incidental sightings, effort sightings, or unknown. Database: HELCOM/ASCOBANS harbour porpoise database. Available from: https://maps.helcom.fi/website/biodiversity/ (downloaded on 16 June 2022).
HELCOM/Baltic Earth (2021) Climate Change in the Baltic Sea. 2021 Fact Sheet. Baltic Sea Environment Proceedings n°180
Hermannsen, L., Beedholm, K., Tougaard, J., Madsen, P.T., 2014. High frequency components of ship noise in shallow water with a discussion of implications for harbor porpoises (Phocoena phocoena). J. Acoust. Soc. Am. 136, 1640–1653. https://doi.org/10.1121/1.4893908
ICES, 2019. Working Group on Marine Mammal Ecology (WGMME). ICES Sci. Rep. 1:22, 131.
Jepson, P.D., Bennett, P.M., Deaville, R., Allchin, C.R., Baker, J.R., Law, R.J., 2005. Relationships between polychlorinated biphenyls and health status in harbor porpoises (Phocoena phocoena) stranded in the United Kingdom. Environ. Toxicol. Chem. 24, 238248. https://doi.org/10.1897/03-663.1
Johansen, A.C., 1929. Om Dødeligheden blandt Marsvin, Fisk og større Krebsdyr i Farvandene omkring Danmark under strenge Vintre. Beret. Til Minist. Søfart Og Fisk. Fra Den Dan. Biol Stn. 35, 60–89.
Jüssi, I., Liivak, A. 2005. Historical distribution of harbour porpoises (Phocoena phocoena) in Estonian coastal waters. Poster presentation at the 16th biennial conference of the Society for Marine Mammalogy, San Diego, CA, USA, 12-16 Dec.
Lucke, K., Siebert, U., Lepper, P.A., Blanchet, M.-A., 2009. Temporary shift in masked hearing thresholds in a harbor porpoise (Phocoena phocoena) after exposure to seismic airgun stimuli. J. Acoust. Soc. Am. 125, 4060–4070. https://doi.org/10.1121/1.3117443
Lindroth, A., 1962. Baltic salmon fluctuations 2: Porpoise and salmon. Rep. Inst. Freshw. Res. Drottningholm 105–112.
Lithuanian Ministry of Environment. 2012. Order on the approval of a protection plan and a summary of an action plan for Phocoena Phocoena. Available: https://eseimas.lrs.lt/portal/legalAct/lt/TAD/TAIS.423171?jfwid=j9ohh8nks (last accessed 29 June 2021).
Lönnberg, E. 1940. Massdöd av tumlare, Phocaena communis. Fauna och Flora 35: 284.
MacLeod, C., MacLeod, R., Learmonth, J., Cresswell, W., Pierce, G., 2014. Predicting population-level risk effects of predation from the responses of individuals. Ecology 95, 2006–2015. https://doi.org/10.1890/131795.1
Murphy, S., Barber, J.L., Learmonth, J.A., Read, F.L., Deaville, R., Perkins, M.W., Brownlow, A., Davison, N., Penrose, R., Pierce, G.J., Law, R.J., Jepson, P.D., 2015. Reproductive failure in UK harbour porpoises Phocoena phocoena: Legacy of pollutant exposure? PLoS ONE 10, e0131085. https://doi.org/10.1371/journal.pone.0131085
NAMMCO-IMR, 2019. Report of the Joint IMR/NAMMCO International Workshop on the Status of Harbour Porpoises in the North Atlantic. Tromsø Nor. 236.
Owen, K., Sveegaard, S., Gilles, A., Dähne, M., Carlén, I., Pawliczka, I., Loisa, O., Authier, M., Carter, M., Adler, S., Carlström, J., 2022. Personal communication with experts on progress on the distribution and habitat quality indicators for harbour porpoises from April 2022.
Psuty, I., 2013. Records of harbour porpoises (Phocoena phocoena) in fishing nets during the interwar period in Poland: verification of archival materials. Aquat. Mamm. 39, 270–281.
Sarnocińska, J., Teilmann, J., Balle, J.D., van Beest, F.M., Delefosse, M., Tougaard, J., 2020. Harbor porpoise (Phocoena phocoena) reaction to a 3D seismic airgun survey in the North Sea. Front. Mar. Sci. 6, 824. https://doi.org/10.3389/fmars.2019.00824
Siebert, U., Stürznickel, J., Schaffeld, T., Oheim, R., Rolvien, T., Prenger-Berninghoff, E., Wohlsein, P., Lakemeyer, J., Rohner, S., Aroha Schick, L., Gross, S., Nachtsheim, D., Ewers, C., Becher, P., Amling, M., Morell, M., 2022. Blast injury on harbour porpoises (Phocoena phocoena) from the Baltic Sea after explosions of deposits of World War II ammunition. Environ. Int. 159, 107014. https://doi.org/10.1016/j.envint.2021.107014
Skóra, K.E., Pawliczka, I., Klinowska, M., 1988. Observations of the Harbour Porpoise (Phocoena phocoena) on the. Aquat. Mamm. 14, 113–119.
Spitz, J., Trites, A.W., Becquet, V., Brind’Amour, A., Cherel, Y., Galois, R., Ridoux, V., 2012. Cost of living dictates what whales, dolphins and porpoises eat: The importance of prey quality on predator foraging strategies. PLoS ONE 7, e50096. https://doi.org/10.1371/journal.pone.0050096
Sveegaard, S., Galatius, A., Dietz, R., Kyhn, L., Koblitz, J.C., Amundin, M., Nabe-Nielsen, J., Sinding, M.-H.S., Andersen, L.W., Teilmann, J., 2015. Defining management units for cetaceans by combining genetics, morphology, acoustics and satellite tracking. Glob. Ecol. Conserv. 3, 839–850.
Tägström, B. (ed). 1940. Massdöd bland tumlarna i södra Östersjön. Svensk Fiskeritidskrift 49: 207-208.
Wisniewska, D.M., Johnson, M., Teilmann, J., Rojano-Doñate, L., Shearer, J., Sveegaard, S., Miller, L.A., Siebert, U., Madsen, P.T., 2016. Ultra-high foraging rates of harbor porpoises make them vulnerable to anthropogenic disturbance. Curr. Biol. 26, 1441–1446. https://doi.org/10.1016/j.cub.2016.03.069
Wisniewska, D.M., Johnson, M., Teilmann, J., Siebert, U., Galatius, A., Dietz, R., Madsen, P.T., 2018. High rates of vessel noise disrupt foraging in wild harbour porpoises (Phocoena phocoena). Proc R Soc B 285, 20172314. https://doi.org/10.1098/rspb.2017.2314
14 Other relevant resources
No additional information is provided at this stage.