 Harbour porpoises abundance
2 Relevance of the indicator
The indicator ‘Abundance and population trends of harbour porpoises’ signals changes in the abundance/density of a marine top predator in the Baltic Sea. Being top predators of the marine ecosystem, harbour porpoises are good indicators of the state of food webs, levels of hazardous substances, direct human disturbance and incidental removal.
2.1 Ecological relevance
Harbour porpoises are likely to have played an important role in the past functioning of the Baltic Sea ecosystem. However, at present they cannot fulfil this role in the Baltic Proper, due to the low population abundance and critically endangered status of the Baltic Proper population. This means that the Baltic Proper harbour porpoise is in fact ecologically extinct. The presence of top predators allows for natural control of the distribution, abundance, diversity, and health of their prey species, with harbour porpoises likely previously playing an important role in maintaining natural balance in the Baltic Sea ecosystem. Being a highly mobile species both horizontally over space and vertically over depth, harbour porpoises also likely played an important role in nutrient transfer across the Baltic Sea region. If not severely reduced, the species can also act as a good indicator of changes in the Baltic Sea ecosystem, as they are sensitive to changes at lower levels in the ecosystem and human induced pressures. One of the strongest threats to harbour porpoises is the risk of being incidentally bycaught in fishing gear, which results in direct mortality of individuals. Survival and fecundity can also be reduced by exposure to contaminants. Additionally, both impulsive and continuous underwater noise have negative influences on porpoises, ranging from behavioural disturbance that reduces the efficiency of foraging and communication, through to permanent injury and death. Harbour porpoises have high-energy requirements and must feed almost continuously to meet energy demands. This makes the species particularly susceptible to negative impacts from resource depletion and disturbance from human presence. In populations that are healthy and not exposed to high levels of pressures, harbour porpoises have shown population increases of 9-10% per year. As the abundance of the Baltic Proper population is critically low, it is not influenced by density dependence issues. A level of growth (or a decline) significantly lower than the level of known possible population growth for the species indicates that there is likely something within the ecosystem that is restricting the population, and that human pressures may be causing an issue in the natural state of the Baltic Sea.
2.2 Policy relevance
The indicator on the abundance of harbour porpoise addresses the 2021 Baltic Sea Action Plan’s (BSAP 2021) overall goal of achieving a good environmental status of Baltic Sea, specifically the ecological objective of ‘Viable populations of all species’. Under the theme ‘Conservation of species’, this indicator is related to action B8:
- ‘By 2022 at the latest, specify knowledge gaps on all threats to the Baltic Proper harbour porpoise population, and by 2023 for the western Baltic population, including by-catch and areas of high by-catch risk, underwater noise, contaminants and prey depletion. Knowledge gaps related to areas of high by-catch risk are to be addressed and by 2028 at the latest additional areas of high by-catch risk for both Baltic Sea populations are to be determined. To strengthen the Baltic harbour porpoise population, by 2025 identify possible mitigation measures for threats other than by-catch and implement such measures as they become available.’
The indicator has relevance to the HELCOM Recommendation 17/2 on protection of harbour porpoise in the Baltic Sea and HELCOM Recommendation 37/2 on the protection of species classified as threatened on the HELCOM Red List.
Other BSAP 2021 ecological objectives of ‘Natural distribution, occurrence and quality of habitats and associated communities’ and ‘Functional, healthy and resilient food webs’ towards achieving the biodiversity segment goal of a “Baltic Sea ecosystem [that] is healthy and resilient”.
The indicator also addresses the following qualitative descriptors of the MSFD for determining good environmental status (European Commission 2008), further elaborated under Commission Decision (EU) 2017/848 that lays down criteria and methodological standards on good environmental status of marine waters (see also Table 1):
- Descriptor 1: Species groups of birds, mammals, reptiles, fish and cephalopods
- Descriptor 4: Ecosystems, including food webs;
- Descriptor 8: Concentrations of contaminants are at levels not giving rise to pollution effects and
- Descriptor 11: ‘Introduction of energy, including underwater noise, is at levels that do not adversely affect the marine environment’.
The indicator is also highly relevant to the implementation of the Habitats Directive (HD, 92/43/EEC). Additionally, the indicator is of relevance to the ASCOBANS Recovery Plan for Baltic Harbour Porpoises (Jastarnia Plan), and ASCOBANS Resolution 9.2 on the Baltic Proper harbour porpoise (. There is also some relevance of this indicator to the EU Delegated Regulation regarding measures to reduce incidental catches of the resident population of the Baltic Proper harbour porpoise (Phocoena phocoena) in the Baltic Sea (2022/303), the EU Regulation on the conservation of fisheries resources and the protection of marine ecosystems through technical measures (2019/1241), the EU Common Fisheries Policy (1380/2013), and the EU Maritime Spatial Planning Directive (2014/89/EU).
Table 1. Policy relevance of this specific HELCOM indicator.
| Baltic Sea Action Plan (BSAP) | Marine Strategy Framework Directive (MSFD) | |
| Fundamental link
|
Segment: Biodiversity
Goal: “Baltic Sea ecosystem is healthy and resilient”
|
Descriptor 1 Species groups of birds, mammals, reptiles, fish and cephalopods.
|
| Complementary link
|
Segment: Biodiversity
Goal: “Baltic Sea ecosystem is healthy and resilient”
Segment: Hazardous substances and litter goal Goal: “Baltic Sea unaffected by hazardous substances and litter”
Segment: Sea-based activities Goal: “Environmentally sustainable sea-based activities”
|
Descriptor 1 Species groups of birds, mammals, reptiles, fish and cephalopods.
Descriptor 4 Ecosystems, including food webs.
Descriptor 8 Concentrations of contaminants are at levels not giving rise to pollution effects.
Descriptor 11 Introduction of energy, including underwater noise, is at levels that do not adversely affect the marine environment.
|
| Other relevant legislation: |
|
|
2.3 Relevance for other assessments
The status of biodiversity is assessed using several HELCOM indicators, generally integrated or evaluated by key trophic or species groups. Each indicator focuses on one important aspect of the complex issue. In addition to providing an indicator-based evaluation of the distribution of harbour porpoises, this indicator will also contribute to the overall thematic assessment of biodiversity as part of HOLAS 3, in association with the other biodiversity indicators.
3 Threshold values
Abundance of harbour porpoises
To establish quantitative threshold values to evaluate harbour porpoise abundance further work is required. GES for abundance is achieved when each of the two Baltic harbour porpoise population is above the Limit Reference Level (LRL), and there is a positive trend towards the Target Reference Level (TRL; Figure 2). The LRL is the minimum number of animals required for the population to sustain itself over time. TRL is the level where the growth rate starts to level off and the population asymptotically approaches the current carrying capacity level. No definitions have yet been set for LRL, TRL, carrying capacity, or thresholds for trend. There is also no estimate available of the historic population size.
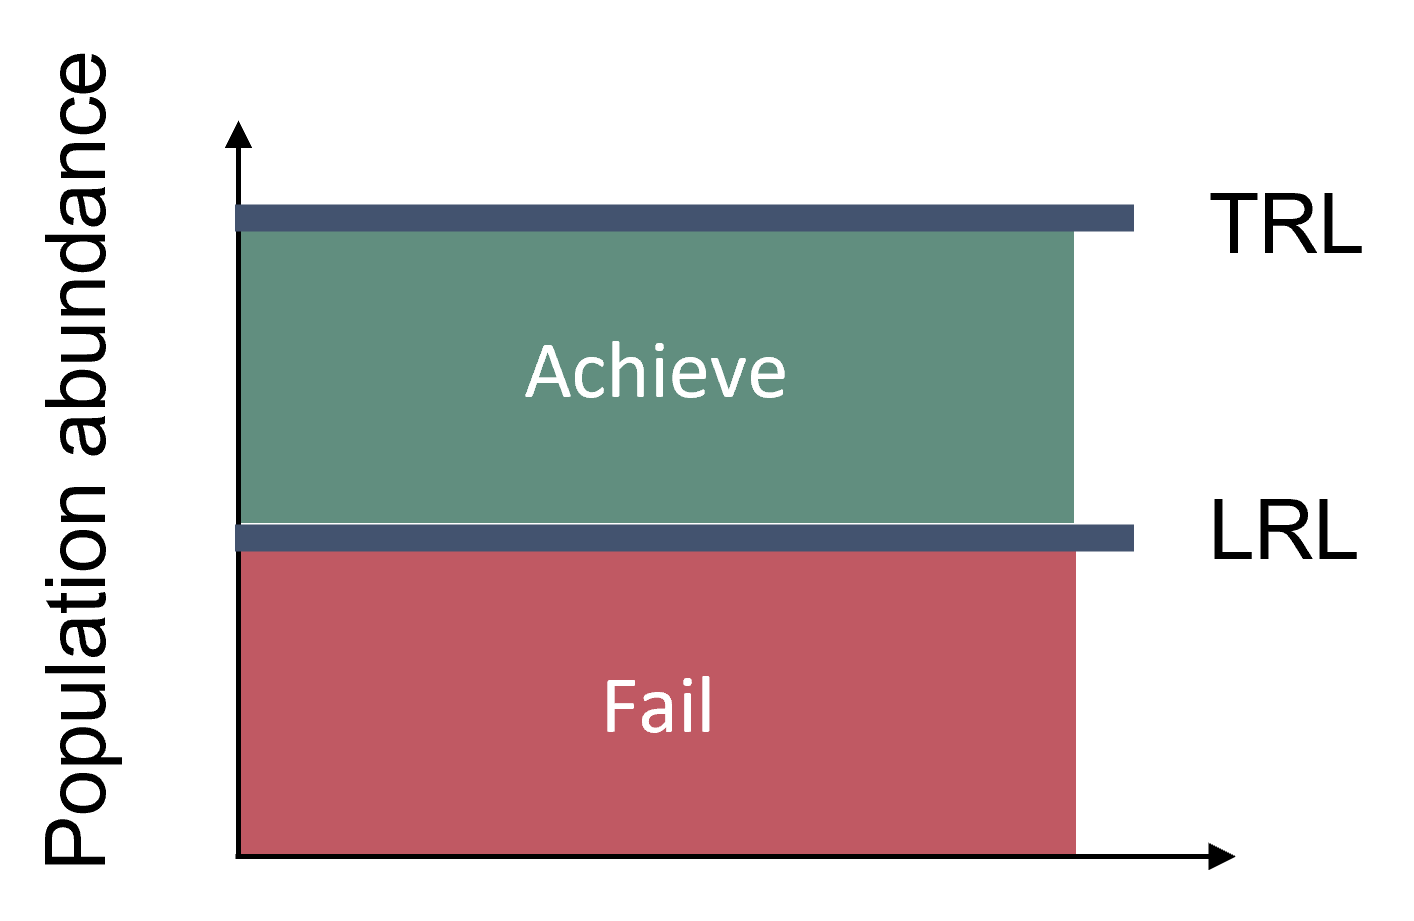
Figure 2. Conceptual presentation of potential future assessment approach. Good environmental status is reached when the population abundance is above the population-specific lower reference value (LRL) and has a yet to be defined positive trend towards the population-specific target reference level (TRL). The LRL and TRL have also yet to be defined for both harbour porpoise population.
3.1 Setting the threshold value(s)
No quantitative threshold value exists at this stage, therefore the HOLAS 3 evaluation on the abundance of harbour porpoise in the Baltic Sea are expert-based evaluations. Based on the spatiotemporal distribution and abundance records compiled for the range of the Baltic Proper population it is evident, that the harbour porpoise was commonly occurring in the entire Baltic Proper Sea in the beginning of the 1900s. A contraction of the range, resulting in more irregular observations and very few encountered dead animals in the Gulf of Bothnia and the Gulf of Finland in more recent years, likely occurred around the mid-1900s. More advanced analytical approaches were applied in the Belt Sea population, but statistical trends were not possible based on the currently available data not covering a three-generation period (22.5 yrs; assuming 7.5 years as generation length for European porpoises) (OSPAR, 2021). The latest estimate of the abundance of the Belt Sea population is 17,301 animals (95% CI: 11,695-25,688; CV: 0.20) (Unger et al., 2021), is anticipated to be compared to the population-specific LRL once resources are secured in future projects (e.g. from SAMBAH II), thus confirming the results of the two trend analysis.
More advanced threshold value setting approaches are expected to be developed in the future to facilitate quantitative evaluations, though extensive further work to achieve this is needed.
4 Results and discussion
The results of the indicator evaluation that underlie the key message map and information are provided below.
4.1 Status evaluation
Belt Sea harbour porpoise population abundance and trends in abundance
Due to the lack of sufficient data as well as thresholds for a robust quantitative abundance evaluation, a qualitative evaluation was carried out for the Belt Sea population, taking both the trend in abundance and the absolute abundance into consideration.
For the absolute abundance, the latest abundance estimate of 17,301 harbour porpoises (95% CI = 11,695-25,688; CV: 0.20) from 2020 was evaluated. Here, it was decided to assess the abundance against a threshold of 10,000 mature individuals. This threshold was originally suggested by the IUCN, in their Red List of Threatened Species, to define a population to be ‘Vulnerable’ (IUCN 2012). In 2014, ICES recommended in an advice to OSPAR to consider IUCN quantitative criteria when implementing the Marine Strategy Framework Directive (MSFD) for marine mammals (ICES, 2014) and in 2021, OSPAR adopted this approach (OSPAR, 2021). We assume that the number of mature animals in the Belt Sea population is below 10,000 individuals, as the majority of animals in the population are unlikely to have reached sexual maturity (Kesselring et al. 2017). Additionally, the depletion of the Belt Sea population likely started much earlier than the first abundance survey, with hunting beginning in the 1870s-1890s, and continuing into the early 1900s and during both World Wars. In the 1960s when fishing was modernised, and environmental pollutants increased, there was likely further declines. Thus, the absolute abundance is assessed not to have achieved GES.
Two methods were used to assess trends in abundance were applied for the Belt Sea population, using available conventional distance sampling (CDS) estimates from four population-wide surveys (SCANS and MiniSCANS surveys, 2005-2020) and a Bayesian trend analysis on the same available survey data. These two methodologies showed no trend and a negative trend, respectively. However due to large confidence intervals and wide credibility intervals in the results from the two approaches, likely due to the confidence and precision in earlier survey data, it was not possible to assign a magnitude of decline or a statistically significant trend. This potential decline are assessed against a threshold described as “For each assessment unit, maintain harbour porpoise population size at or above baseline levels, with no decrease of ≥30% over a three generation period (22.5 yrs)“ (OSPAR, 2021). This corresponds to a maximum annual decline of -1.6%. Since abundance estimates covering a period of 22.5 years is not available, this method cannot be fully applied, but it does indicate that the trend may have achieved GES as it is not declining by >1.6% per year.
In conclusion, both methods showed no statistically significant trend in abundance for the Belt Sea population of harbour porpoises indicating that the trend in abundance has achieved GES. Therefore, the absolute abundance failed GES but the trend in abundance achieved GES. However, when integrating the two evaluation, the One-Out-All-Out rule applies, and thus overall qualitative evaluation of the Belt Sea harbour porpoise population indicates that is does not achieve good environmental status (Figure 3)
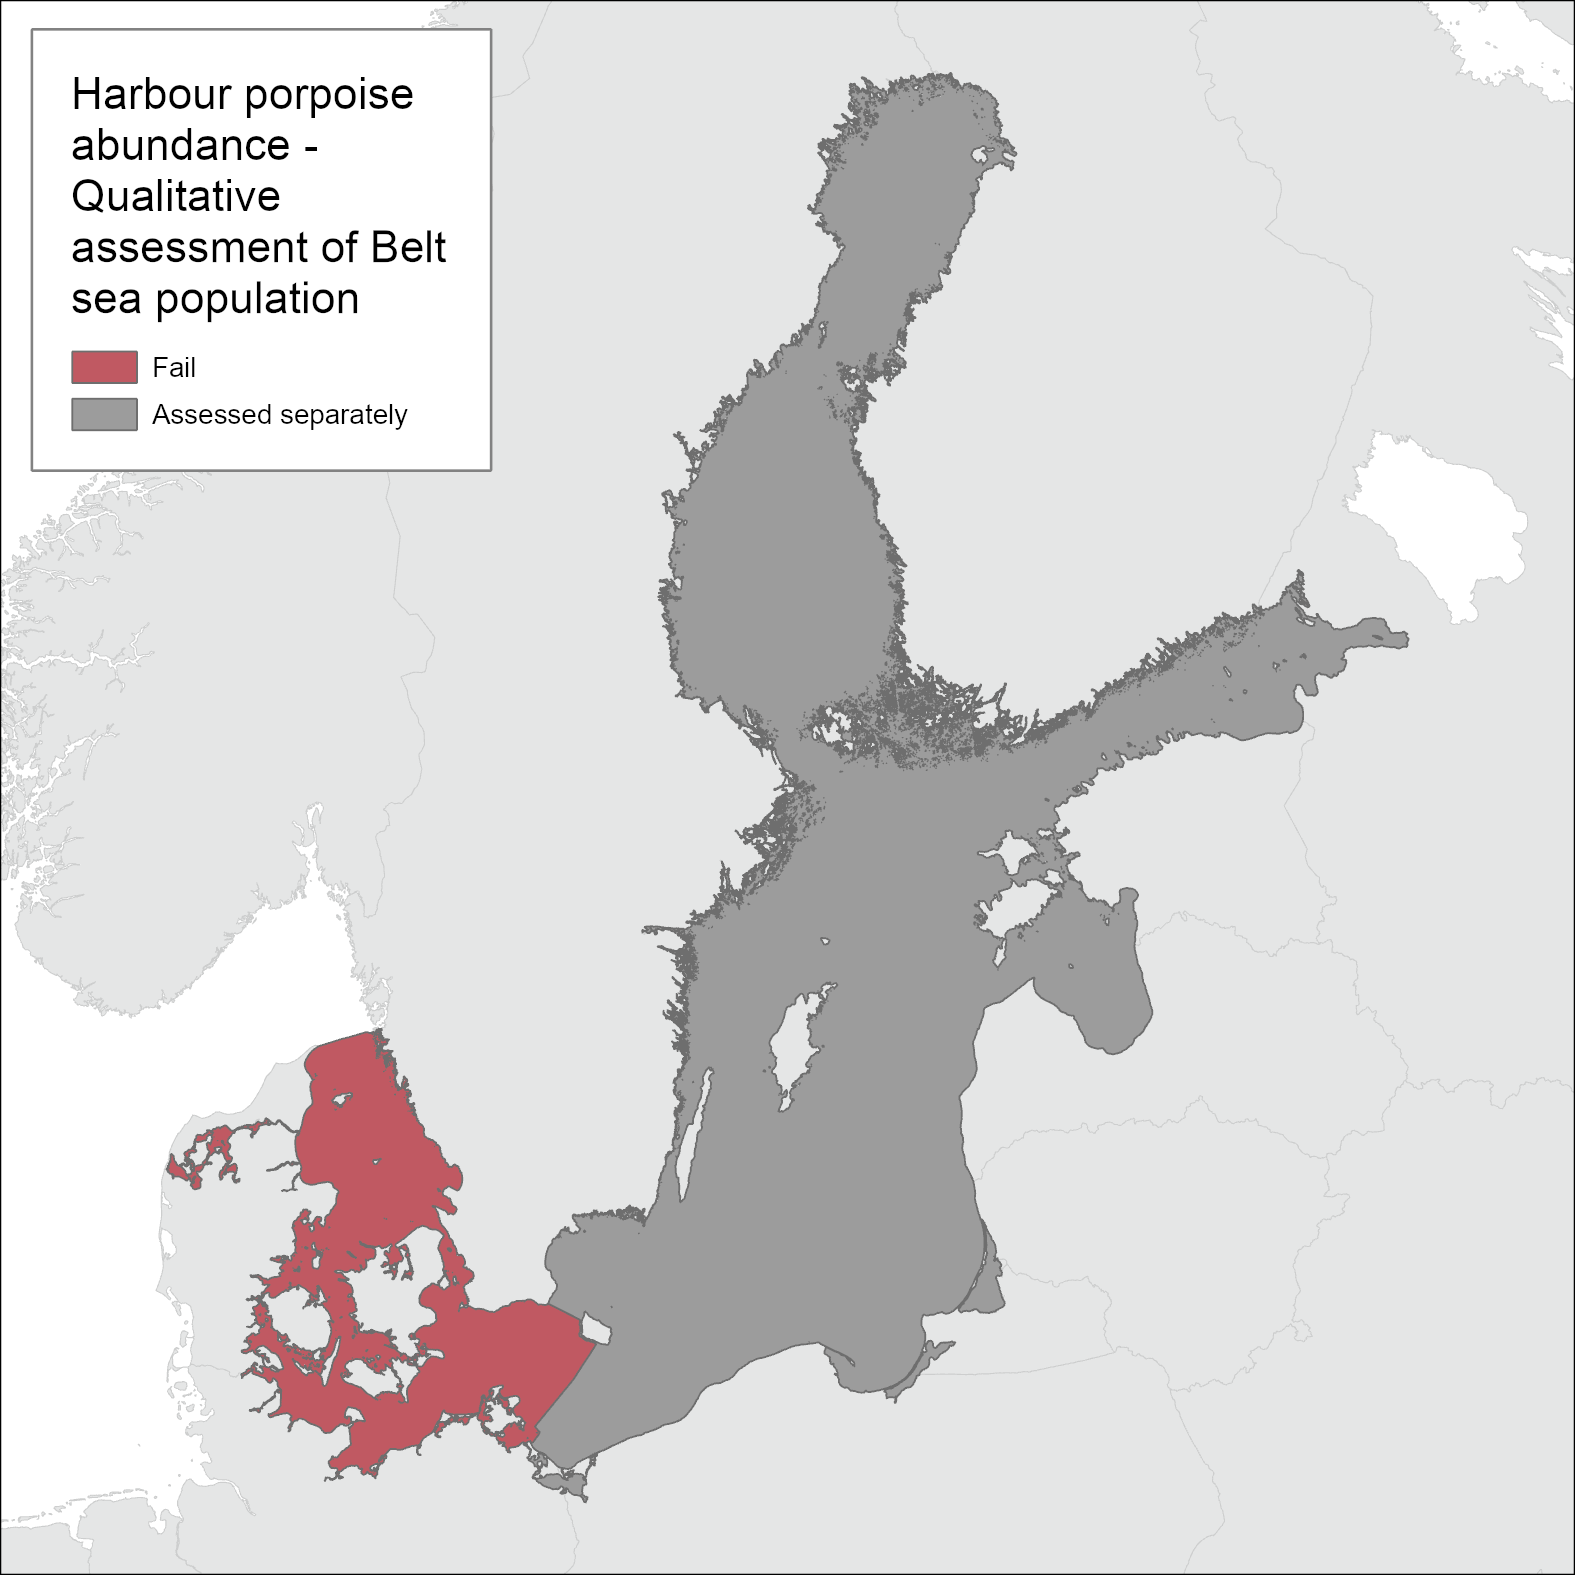
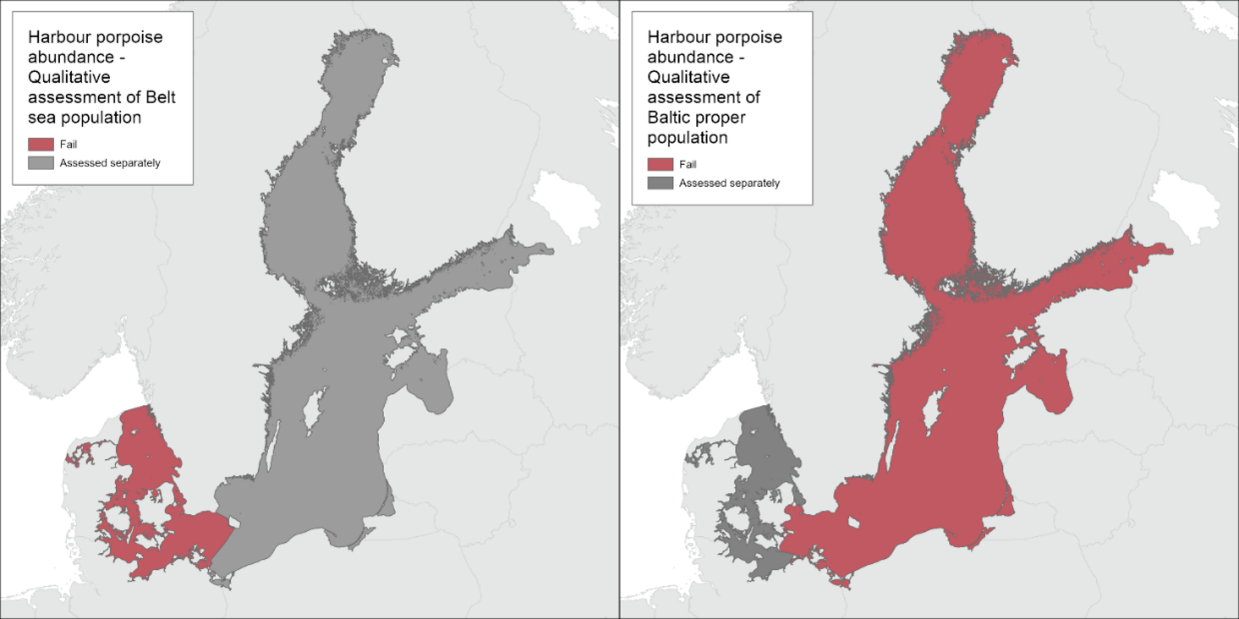
Figure 3. Expert-based qualitative evaluation on abundance of the Belt Sea harbour porpoise population. The population is evaluated to not achieve good environmental status (sub-GES) based on an expert evaluation of the trend in abundance and the absolute abundance.
Baltic Proper harbour porpoise population
In 2011-2013, the abundance of the Baltic Proper harbour porpoise population was estimated to 71-1105 individuals (95% CI, point estimate 491; Amundin et al., 2022). The number of historical records, the number of animals observed in the rare events of animals believed to have suffocated under sea ice (Ekman, 1938; Johansen, 1929; Lönnberg, 1940; Tägström, 1940), and data on catches from Polish fisheries statistics (Psuty 2013), demonstrate that the abundance of harbour porpoises within the presently known management range of the Baltic Proper population (Carlén et al., 2018) was much higher up to year 1940 than today, likely several orders of magnitudes greater. The report on 48 bycaught animals by Swedish fishermen primarily using driftnet for salmon in 1961 (Lindroth, 1962), indicate that the abundance was at least an order of magnitude greater at that time. Based on very small current abundance estimate in combination with drastic reduction in occurrence inferred from the historical records, the abundance of the Baltic Proper harbour porpoise is assessed to not achieve GES (Figure 4).
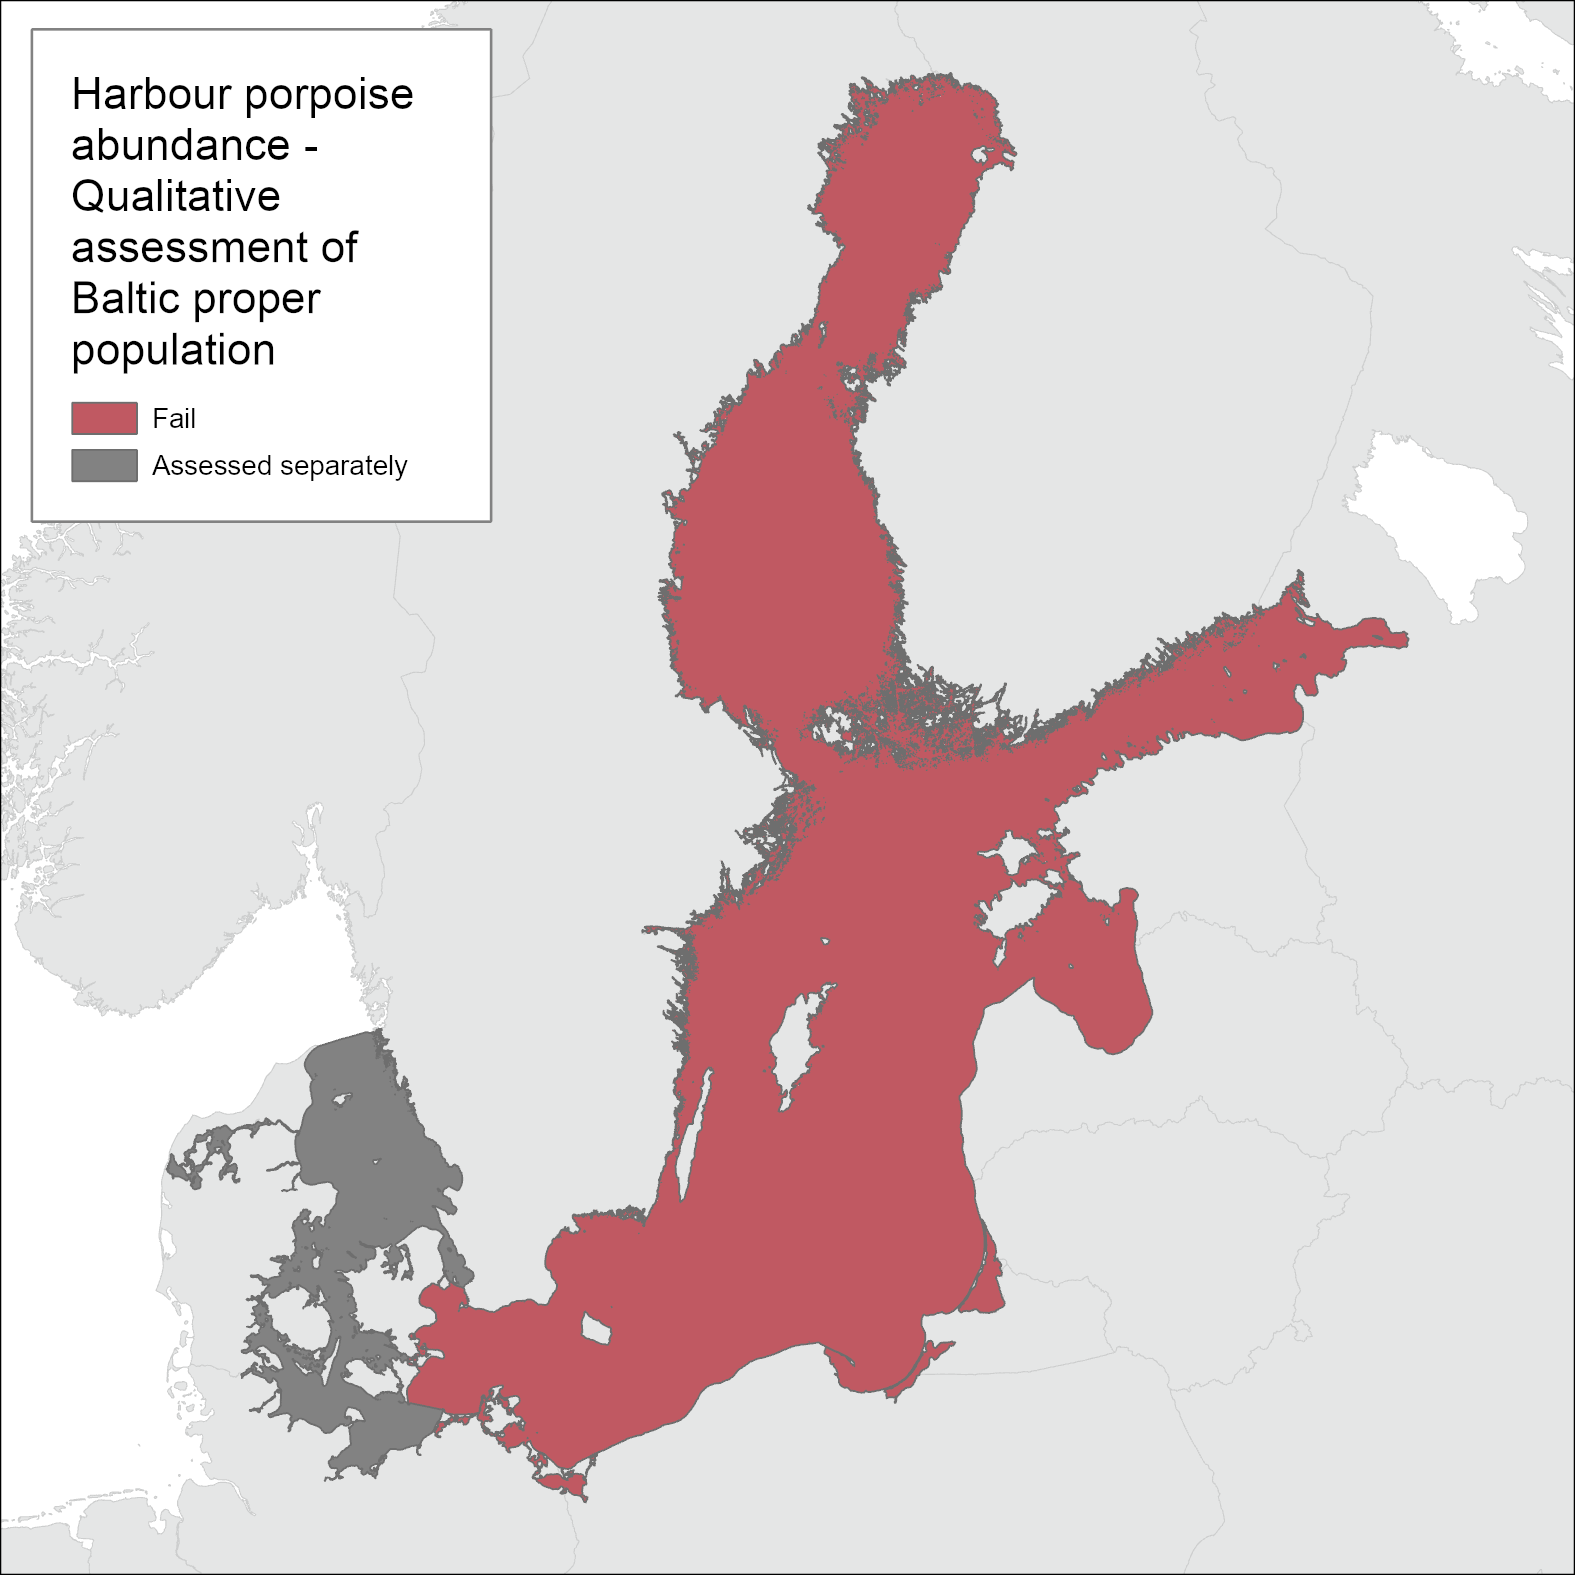
Figure 4. Expert-based qualitative evaluation of the Baltic Proper harbour porpoise population. The population is evaluated to not achieve good environmental status (sub-GES), based on an expert evaluation of the recent abundance estimate in combination with a drastic decline in numbers during the 1900s inferred from historical records of occurrence.
4.2 Trends
This qualitative evaluation, for use in HOLAS 3, is the first time an evaluation of the abundance of the harbour porpoise populations has been conducted (Table 2). Accordingly, no trend in comparison to a previous evaluation (e.g., HOLAS II) is available. Trends in the data utilised to support the qualitative evaluation are presented in the discussion text below.
Table 2. Assessment unit specific evaluation result summary and comparison. Please note that the table only presents qualitative values, as no quantitative threshold values exist.
| HELCOM Assessment unit name (and ID) | Threshold value achieved/failed | Distinct trend between current and previous evaluation. | Description of outcomes, if pertinent. |
| Belt Sea population
(SEA-001- SEA-005) |
Failed (qualitative) | Not applicable, first iteration of this indicator. | Expert-based qualitative evaluation determines the Belt Sea population to not achieve Good Environmental Status based on the available absolute abundance and abundance trend data available. |
| Baltic Proper population
(SEA-006 – SEA-017) |
Failed (qualitative) | Not applicable, first iteration of this indicator. | Expert-based qualitative evaluation determines the Baltic Proper population to be far from achieving Good Environmental Status due to a severe reduction in abundance, based on collated historical records. |
4.3 Discussion text
Belt Sea harbour porpoise population abundance and trends in abundance
Two methods to assess trends in abundance were applied (see Methodology section). The first method using a simulation approach by Authier et al (2020) and available conventional distance sampling (CDS) estimates from four population-wide surveys (SCANS and MiniSCANS surveys, 2005-2020) showed no trend over the study period of 15 years, likely due to less precision and associated large confidence intervals of the earlier surveys. It was possible to calculate a trend, but the data do not provide sufficient power to detect a change. The second approach used the same available survey data; however, a Bayesian trend analysis was used. The results of the second method showed a negative trend (-1.2% p.a.; 95% CI: -3.8% – 4.4%) (Figure 5) but associated with a wide credibility interval and 68.5% probability (Figure 6); meaning it revealed uncertainty in the magnitude of the decline, but the data supported a decline with a higher probability compared to no decline. In conclusion, both methods showed no statistically significant trend in abundance for the Belt Sea population of harbour porpoises which indicates that the trend in abundance has achieved GES.
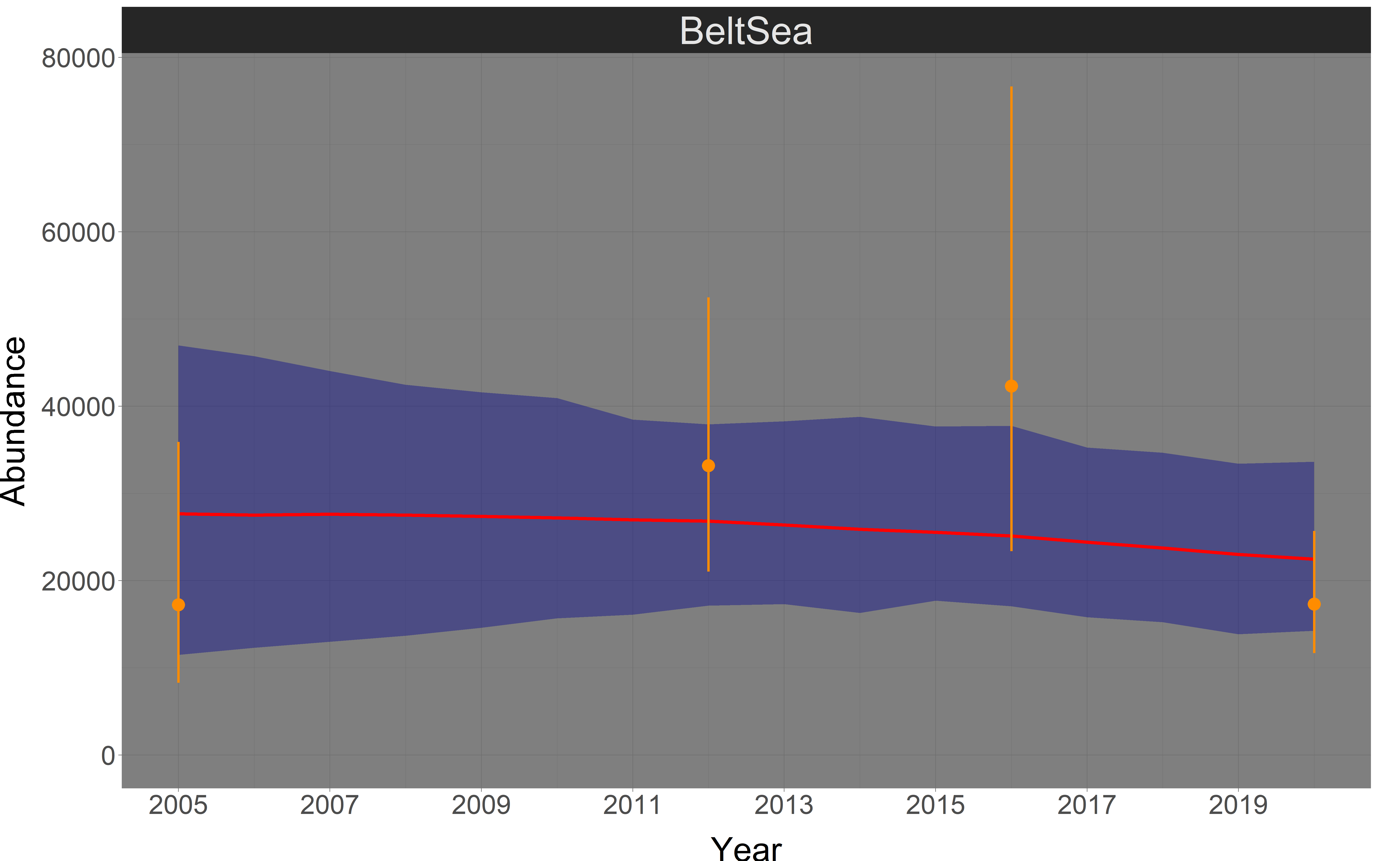
Figure 5. Bayesian abundance trend analysis for harbour porpoises in the Belt Sea management area, based on post-stratified visual survey abundance estimates from 2005 to 2020. Orange dots illustrate stratum-based abundance estimates and orange lines associated 95% CI. The red line shows the median of the posteriori distribution of the calculated ‘true’ abundances from the Bayesian model, the blue shaded area displays the corresponding 95% credibility intervals.
As an extension to further bring results into context, the results of all German aerial surveys completed since 2002 in the south-western Baltic Sea, including parts of Danish waters, were examined for a trend using the Bayesian method above for both the western (Kiel and Flensburg Bight) and eastern (Fehmarn Belt) sections of surveys (Gilles et al., 2022). This analysis shows high variability and dynamic in porpoise abundance and indicates no change in the western area and a slight increasing usage around Fehmarn (2). These additional data, thus, support the result of the trend analysis for the Belt Sea population.
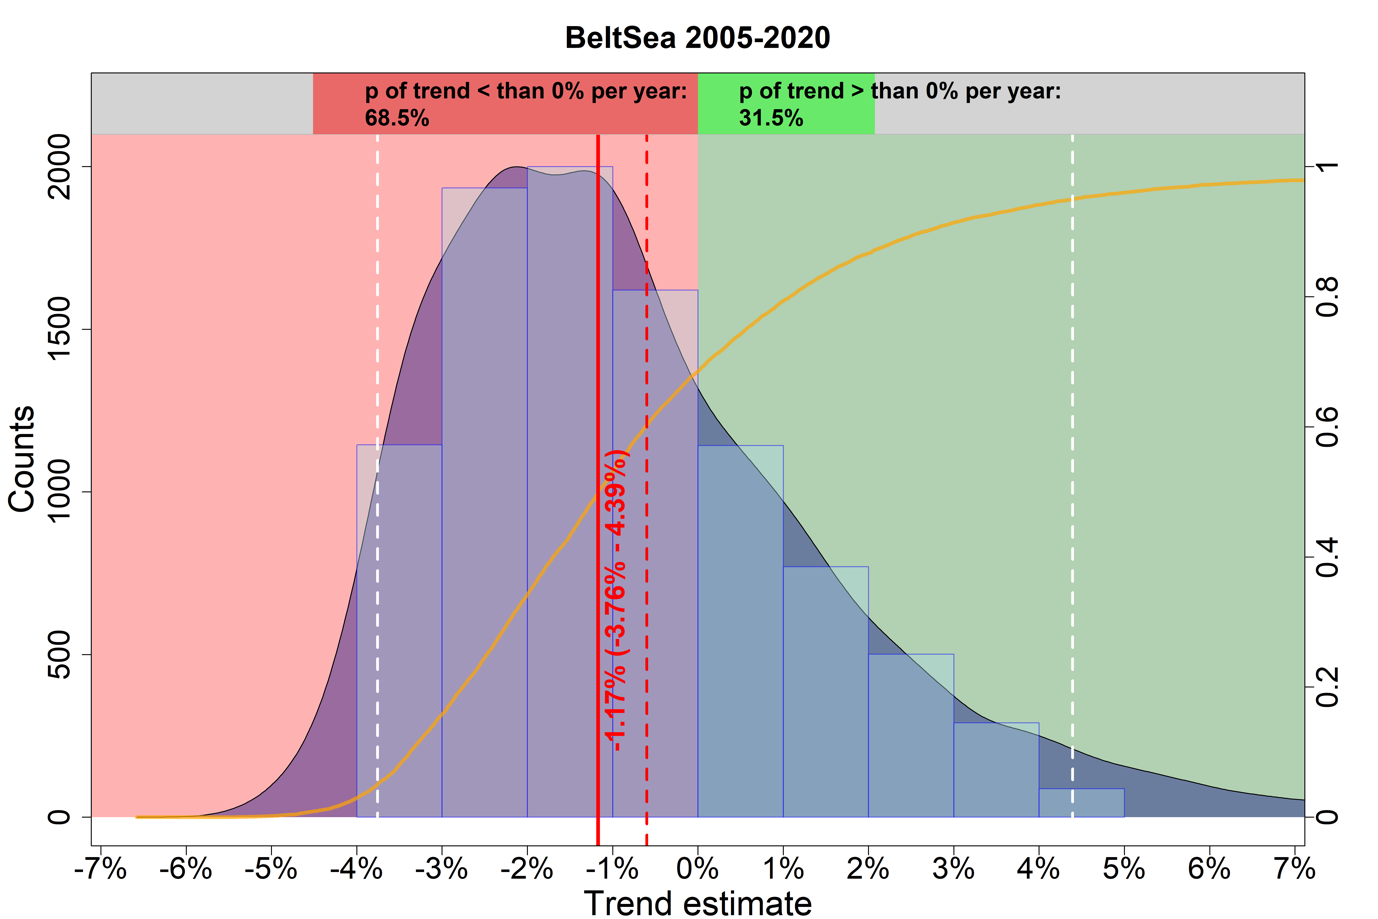
Figure 6. Estimated trends in harbour porpoise abundance in the Belt Sea management area, between 2005 and 2020. The light blue histogram and the blue shaded density curve show the distribution of the trend estimates (relative change in abundance) between 2005 and 2020 (x-axis); the median is indicated by the solid red vertical line. The mean is shown by the vertical red dashed line, while the white dashed lines represent the upper and lower 95% credibility intervals of the trend estimate. The red coloured area corresponds to an area with a negative trend, whereas the green coloured area represents a positive trend. The orange solid line illustrates the empirical cumulative distribution function of the trend estimates, giving the probability of a trend estimate at a specified value (e.g., 0%). The upper bar chart hence indicates how likely it is that the trend is either negative (i.e., p < 0%; red) or positive (i.e., p > 0%; green).
Baltic Proper – Records of harbour porpoise observations
Of the 11,492 records (bycatch, hunted or killed, stranded, incidental sightings, effort sightings, and reports with unknown type) in the HELCOM/ASCOBANS harbour porpoise database (HELCOM,2022), 508 were identified as being within the May-October management range of the Baltic Proper population (see Methodology section below for area description and data inclusion protocol), and included in this qualitative evaluation. Additionally, a total 281 records within the management range that were not previously in the HELCOM/ASCOBANS harbour porpoise database were identified. An overview of years from which records with a geographical position located east of the May-October management range of the Baltic Proper harbour porpoise population (Carlén et al., 2018) were compiled, divided per country, is shown in Figure 7. Despite that absence data are not known, the overview clearly shows a gap in Swedish records from 1907 until the late 1900s, and that Polish data with geographical information is missing before 1950. No data with a geographical position is available from the Danish waters within the area of concern.
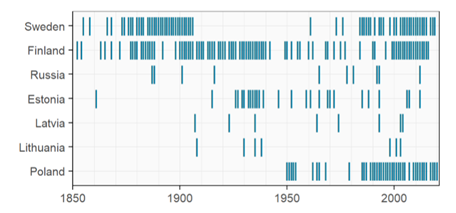
Figure 7. Overview of years from which records on harbour porpoises (bycatch, hunted or killed, stranded, incidental sightings, effort sightings, and reports with unknown type observations) with a geographical position located east of the May-October management border of the Baltic Proper harbour porpoise (Carlén et al., 2018) were compiled, divided per country.
The analysis was carried out over four regions (Gulf of Bothnia, Gulf of Finland, Gulf of Riga, and the Baltic Proper) to ease interpretation, with the results for each region discussed individually below. A summary for the population level then follows.
Baltic Proper – Spatial distribution of harbour porpoise records over time
All records with a geographical position are shown in Figure 8. Each record may be of one or more individuals, and records with the same geographical position are only shown as one position. Positions of animals primarily encountered dead (bycatch, stranding, and incidental sightings of dead animals) are shown separately from those primarily encountered alive (incidental sightings not noted to be dead, and hunted or killed animals). With the exception of acoustic monitoring data not included here, no effort sighting with a geographical position was found within the area of concern. Figure 8 also shows the borders of the four regions for which data were compiled; the Gulf of Bothnia (Bothnian Bay, The Quark, and Bothnian Sea), the Gulf of Finland, the Gulf of Riga, and the Baltic Proper (Åland Sea, Northern Baltic Proper, Western Gotland Basin, Eastern Gotland Basin, Gdansk Basin, and the eastern part of Bornholm Basin. The southwestern border of the Baltic Proper region follows the May-October management border of the Baltic Proper harbour porpoise population (Carlén et al., 2018), while the other regional borders follow delimitations of HELCOM Scale 2 HELCOM assessment units. The records are divided into three time periods: before 1950, 1950-1990, and after 1990 (see Methodology section for justification).
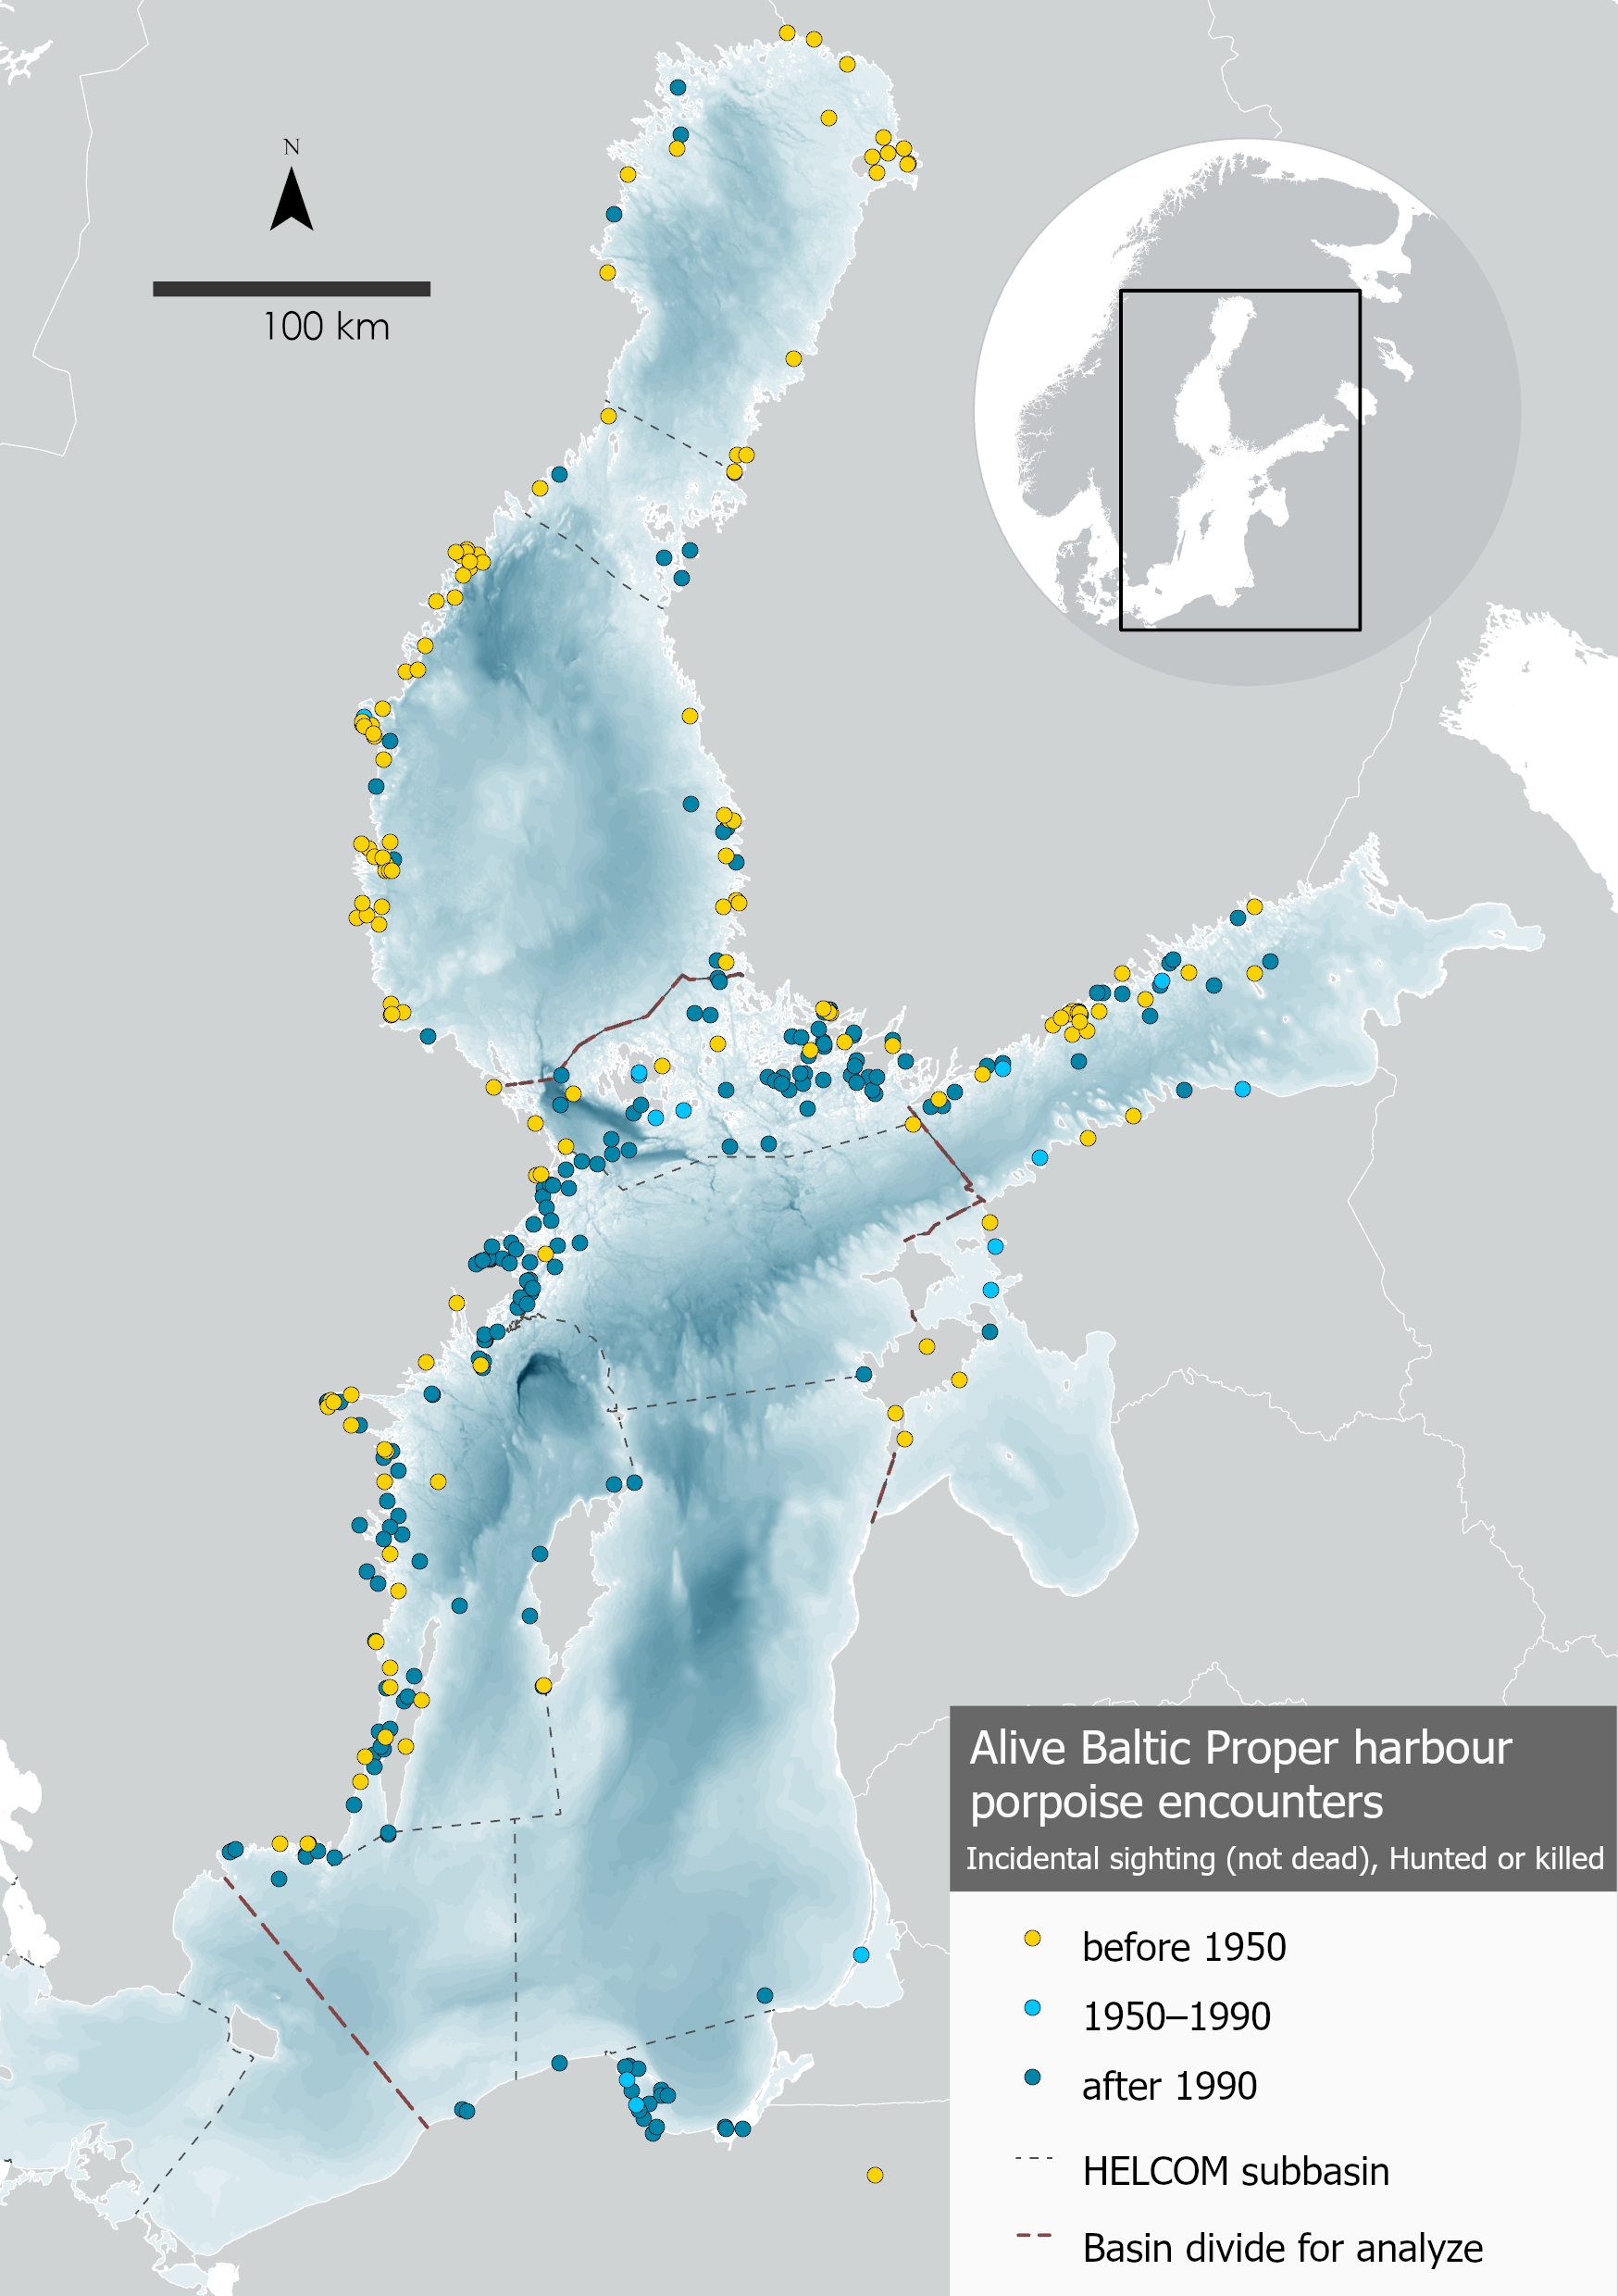
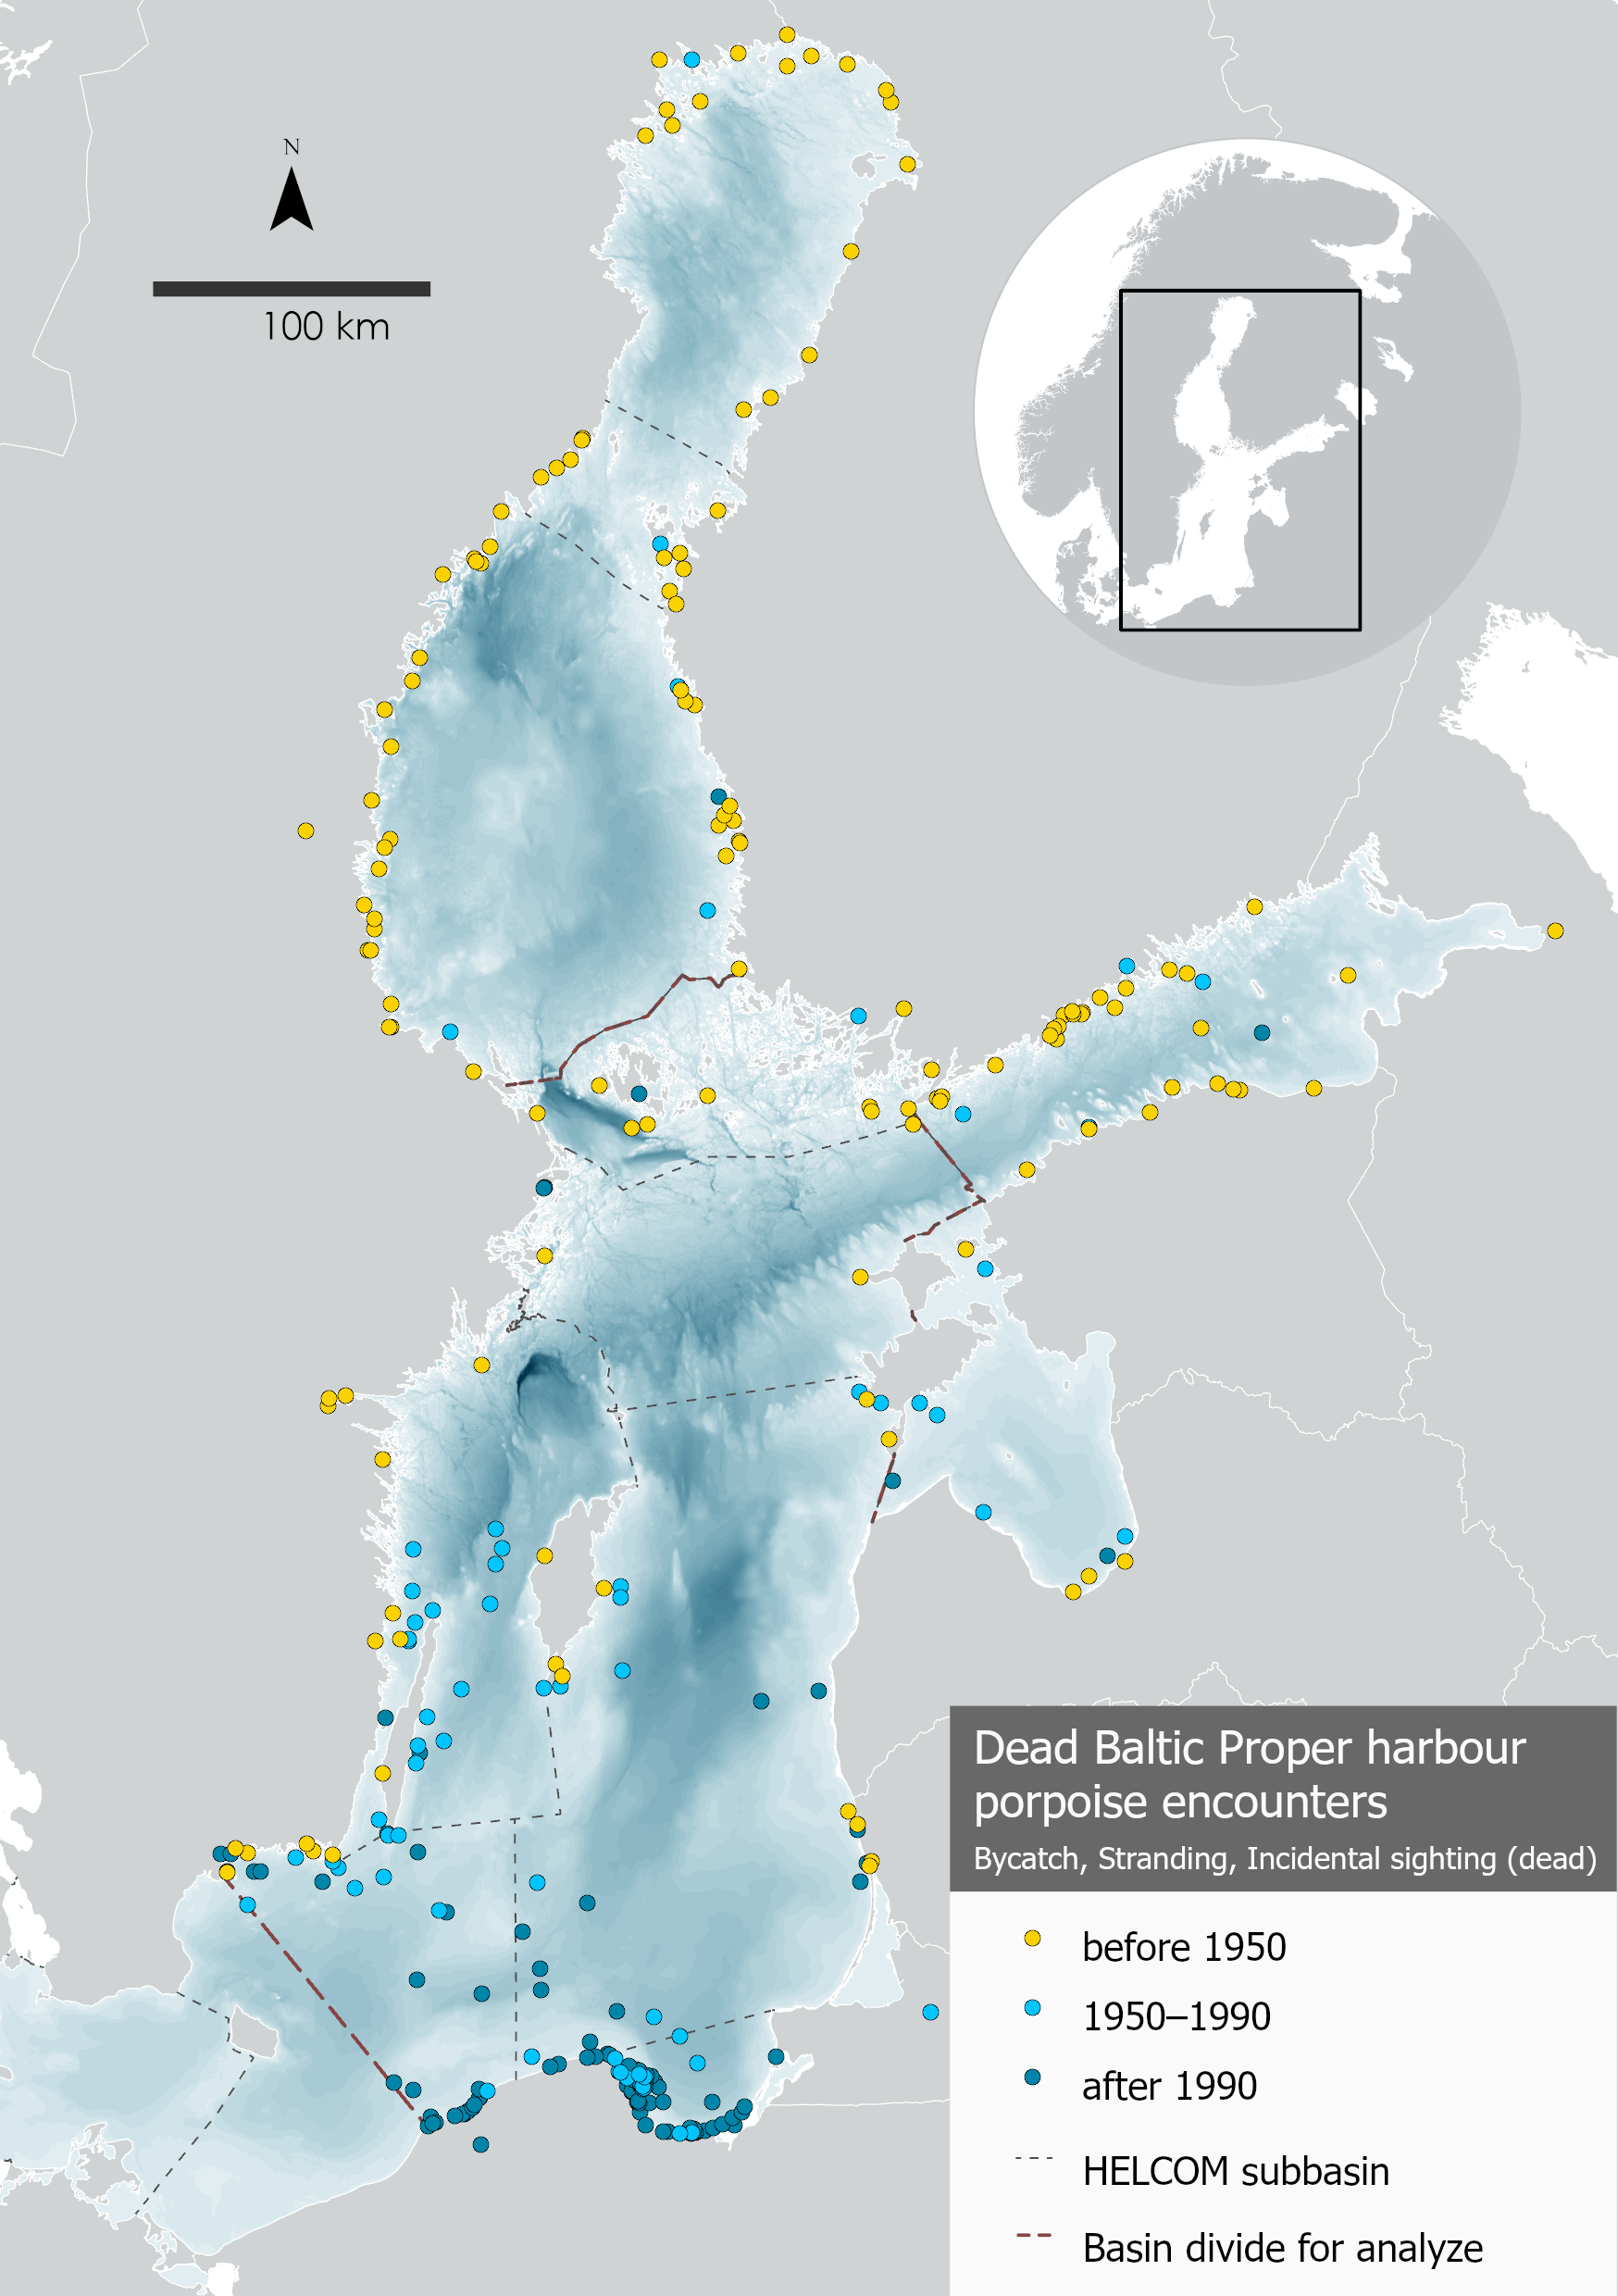
Figure 8. Maps showing the geographical positions of all records for which this was found or could be assigned, and the borders of the four regions for which data were compiled; the Gulf of Bothnia (Bothnian Bay, The Quark, and Bothnian Sea), the Gulf of Finland, the Gulf of Riga, and the Baltic Proper (Åland Sea, Northern Baltic Proper, Western Gotland Basin, Eastern Gotland Basin, Gdansk Basin, and the eastern part of Bornholm Basin). The southwestern border of the Baltic Proper region follows the May-October management border of the Baltic Proper harbour porpoise population (Carlén et al., 2018), while the other regional borders follow delimitations of HELCOM Scale 2 HELCOM assessment units. Left: Animals primarily encountered dead (bycatch, stranding, and incidental sightings of dead animals). Right: Animals primarily encountered alive (incidental sightings of animals not noted to be dead, hunted or killed animals). Bathymetry database © BSHC.
The spatial distribution of animals primarily encountered dead during the three time periods show that in the Gulf of Bothnia and the Gulf of Finland, the vast majority (90 and 85%) of records are from before 1950. In the Baltic Proper region, records from before 1950 dominate in the north, most records during 1950-1990 are in the central and southern parts of the region, while records after 1990 dominate in the south. In the Gulf of Riga, there is a small number of records from all three time periods and no spatial trend can be seen over time.
Also, for animals primarily encountered alive, records from before 1950 dominate in the Gulf of Bothnia (85%). In the Gulf of Finland, about half are before 1950 (45%). However, after 1990, there are more records of animals primarily encountered alive than dead. In the Baltic Proper region, there are very few records during 1950-1990, and records before and after this period are spatially mixed, with the exception of the southern coast where records from after 1990 dominate. Again, there is a small number of records from all time periods in the Gulf of Riga, and no spatial trend can be seen over time.
Baltic Proper – Temporal distribution of harbour porpoise numbers within summary regions
Histograms of the number of geographically positioned observed animals per year within the Gulf of Bothnia and the Gulf of Finland is shown in Figure 9. The bars show the total number of animals recorded, and they may be from one or more records. Animals primarily encountered dead are shown separately from those primarily encountered alive.
In the Gulf of Bothnia, the numbers of records of both dead and alive animals peaked in the late 1800s and early 1900s (Figure 9). From the late 1870s to 1906, the species was recorded almost every year. During the 1910s-1930s, animals primarily encountered dead were recorded in eight years, and animals primarily encountered alive in seven years, at the most seven dead and nine alive in a year. The highest recorded number of animals primarily encountered dead in any year was eight (year 1902), and alive 28 (year 1891). During 1940-1999, there were a total of eight records of animals primarily encountered dead, and one alive. During 2000-2019, there is not a single dead animal, but records of 1-11 primarily alive animals per year, during 15 of these 20 years. The temporal pattern reflects that the compilation of historical records in Swedish waters only reaches to year 1906 (note that the last years are not complete), and that sightings schemes were established in both Finland and Sweden in the early 2000s (see Table 4). However, despite these shortcomings of the opportunistically collected data, it is obvious that the frequency of sightings and number of observed animals is significantly lower during recent decades than in the late 1800s and early 1900s. The pattern is most striking for animals primarily encountered dead, which also is a more reliable category than animals observed alive, with very few records after 1940.
In the Gulf of Finland, the general temporal pattern is similar to that in the Gulf of Bothnia, although the number of animals is smaller and there are fewer records before 1906 (Figure 9). The majority of the primarily dead animals were recorded up to the 1930s, and the last dead animal was recorded in 1992. The pattern for animals primarily encountered alive is not as clear, and the first year with a higher number of primarily alive animals in modern times was 1990. The highest number of primarily dead animals in one year was 22 (1916), and the highest number of primarily alive animals in one year was 16 (1913). Similar to the Gulf of Bothnia, the establishment of strandings programmes and reporting systems (Estonia in the 1990s, Finland in 2001; see Table 4) is likely to have influenced the number of animals primarily encountered alive since then (more than the number primarily encountered dead as only a small proportion of animals that die at sea are washed ashore, and the species identification is more reliable of dead animals), and the temporal pattern of animals primarily encountered dead shows a significant decrease since 1940.
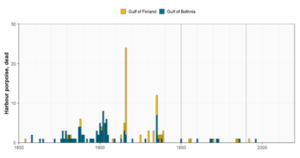
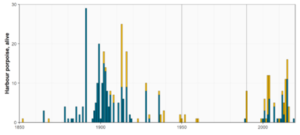
Figure 9. Number of geographically positioned observed animals per year within the Gulf of Bothnia (Bothnian Bay, The Quark, and Bothnian Sea) and the Gulf of Finland. Top panel: Animals primarily encountered dead (bycatch, stranding, and incidental sightings of dead animals); bottom panel: animals primarily encountered alive (incidental sightings not noted to be dead, and hunted or killed animals). The vertical lines show the time periods used in Figure 7.
In the Baltic Proper (Åland Sea, Northern Baltic Proper, Western Gotland Basin, Eastern Gotland Basin, Gdansk Basin, and the eastern part of Bornholm Basin) and in the Gulf of Riga, there are overall fewer historical records than in the Gulf of Bothnia and Gulf of Finland. In the Baltic Proper during 1880-1979, there are 37 years with records of primarily encountered dead animals and 27 years with records of animals primarily encountered alive (Figure 10). The majority of these records are from 1880-1906, i.e. coinciding with the time period when the number of records peaked in the Gulf of Finland. From 1910 and onwards, there are sporadic records of both animals primarily encountered dead and alive. Most commonly single animals were recorded, but in 1961 the number of animals primarily encountered dead is outstanding: 48. This record is from Lindroth (1962), who asked Swedish fishermen to collect bycaught harbour porpoises, primarily in drift nets for salmon (Salmo salar), for analysis of stomach contents. In the 1980s, the number of recorded animals primarily encountered dead increased; during 1984-2019, a total of 193 animals primarily encountered dead were recorded, resulting in an average of 5.3 animals per year. The increase in records of animals primarily encountered alive comes a decade later, in the 1990s, and even more from year 2000 and onwards. The highest numbers of animals primarily encountered alive in any year before 1980 were 23 and 22 (1885 and 1886), and the highest number after 1980 was 47 (2009) (Figure 10).
The lower rate of historical records in the Baltic Proper compared to the Gulf of Bothnia, with the exception of 1961, is believed to reflect that the species was relatively common and therefore observations were not recorded. Still the impact by the digitally searchable database in Sweden with records available until 1906 can be seen in the records, with more frequent observations and higher numbers per year until then. The outstanding number of animals primarily encountered dead recorded in 1961 confirms that the species indeed was frequently encountered at that time. The increase in animals primarily encountered dead in the 1980s is likely a result of increased efforts of carcass collections for studies of environmental pollutants (e.g. Berggren et al., 1999), and increased awareness of the species’ decline. The increase in records of animals primarily encountered alive, beginning in the 1990s and reaching the highest annual averages from year 2000, coincides with the time periods for when strandings programmes and reporting systems were established and became more common (see Table 4).
In the Gulf of Riga, the number of records is small, and no temporal trend can be seen (Figure 10). The last record of an animal likely encountered dead was in 2003, and of an animal likely encountered alive in 2006.
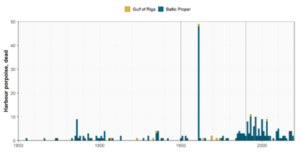
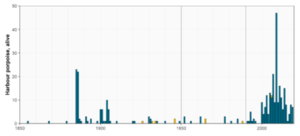
Figure 10. Number of geographically positioned observed animals per year within the Baltic Proper region (Åland Sea; Northern Baltic Proper; Western Gotland Basin; Eastern Gotland Basin; Gdansk Basin; eastern part of Bornholm Basin) and the Gulf of Riga. Top panel: Animals primarily encountered dead (bycatch, stranding, and incidental sightings of dead animals); bottom panel: animals primarily encountered alive (incidental sightings not noted to be dead, and hunted or killed animals). The vertical lines show the time periods used in results figure 7.
Baltic Proper – Rare observations of large numbers of animals
There are data on large numbers of catches from a Polish bounty scheme, and a few records of large numbers of encountered dead harbour porpoises believed to have been trapped by sea ice in winter. As the total numbers of these records are uncertain and the events are rare, they are not included above, but described here.
In Polish waters, data on historical catches of harbour porpoises in Polish waters have been compiled by Psuty (2013) and Skóra et al. (1988). Psuty (2013) investigated archival material including Polish fisheries inspectors’ reports, monthly and annual reports by the Polish Marine Fisheries Office (MFO), correspondence, and published fisheries statistics from 1922 to 1939. The data are from the fishing villages ranging from Dębki on the northern shore of Poland, via Hel Peninsula and Puck Bay, down to Kolibki in the western Gulf of Gdansk, i.e. all well within the May-October management area of the Baltic Proper harbour population (Carlén et al., 2018). Skóra et al. (1988) compiled information from scientific literature, personal conversations with fishermen, own field observations, and questionnaires from 1922 to 1987. Here we use the data from Psuty (2013) for the years 1920-1939, data from) for Skóra et al. (1988) 1939-1987, and the HELCOM/ASCOBANS harbour porpoise database for 1986-2019 (data for 1990-1999 published in Skóra and Kuklig, 2002). A histogram of the number of all animals observed (bycatch, hunted or killed, stranded, incidental sightings, effort sightings, and reports with unknown type) in Polish waters east of the May-October management border of the Baltic Proper harbour porpoise per decade is shown in Figure 11. In the 1930s, the total number of about 750 is uncertain, due to incomplete records in 1934-1935. However, it is more likely to be an under- than an overestimation. For 1934, Psuty (2013) found that bounties were paid for nearly 200 individuals, which was said to be barely half of the number caught as all fishers did not claim bounties. For 1935, the number of harbour porpoises caught was said to be comparable to that of the previous year. Psuty (2013) thereby gave a rough estimation of about 400 individuals caught each of these years, while we have used the more conservative estimate of 200 individuals for each of these years. Regardless of which of these numbers that is correct, they show that harbour porpoises were several orders of magnitude more common in the southeastern Baltic Sea in the 1930s than they are today.
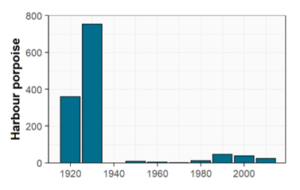
Figure 11. Number of harbour porpoises observed (bycatch, hunted or killed, stranded, incidental sightings, effort sightings, and reports with unknown type) in Polish waters east of the May-October management border of the Baltic Proper harbour porpoise from 1920 to 2019. Data for the years 1920-1930 are minimum numbers from P8) and 1986-2019 from the HELCOM/ASCOBANS harbour porpoise database.
In Danish waters, there is a record of a large number of dead harbour porpoises caught in bottom trawls for European place (Pleuronectes platessa) and flounder (Platichthys flesus) east of Bornholm in March and April 1929, after the ice was gone (Johansen, 1929). Most animals were taken in an area 22-24 nautical miles east of the village Nexö in waters of 90-100 m depth. One fishing vessel got 14 harbour porpoises in one day, and during six weeks, several hundreds were reported to have been taken by the fleet of about 40 vessels. In the beginning the carcasses were quite fresh, but over time, they got looser until they fell apart in pieces when they were taken up. Occasional animals were also taken 10-12 nautical miles from northeast to southeast of Nexö in waters of 60-80 m depth. The animals were assumed to have drowned under the sea ice that reached a maximum in late March 1929, but (Johansen, 1929) finds the number surprising as harbour porpoises were not that commonly observed around Bornholm. He speculates that the animals could have been from the Belt Sea, and had moved into the Baltic Sea, where the ice froze later and trapped the animals.
From Sweden, there is a note that during a winter in the 1920s, possibly 1925, a large number of harbour porpoises died in the bay of Kappelshamn on northern Gotland. The animals were assumed to have been pushed by the drift ice into the wide bay, got trapped and died (Ekman, 1938; Lönnberg, 1940). From spring 1940, there are two records of large numbers of dead harbour porpoises washed ashore, assumed to have been trapped by ice during the winter. Lönnberg, 1940 reports that on the island of Fårö just north of Gotland, “the winter has caused a real mass death of harbour porpoises”, and that “dead harbour porpoises are seen everywhere”. Tagström (1940) reports on high numbers of dead harbour porpoises along the east coast of Scania during the last weeks of May 1940. He writes that one or a few dead specimens may always be washed ashore now and then, but this year dead harbour porpoises are encountered almost everywhere above the wave action zone of the beaches, and fishermen at sea have seen them floating around. Along a short coastal stretch north of Simrishamn over 20 carcasses were counted, and along the coast below Tjörnedala, between Baskemölla and Vik, even more were found. The cause is said to be that easterly winds dominated during May, and when it changed to westerly at the end of the month, some carcasses were washed out at sea again.
Even though the carcasses found near Bornholm or washed ashore along the coast of Scania may have been a mix of Belt Sea animals forced eastwards and Baltic Proper animals forced southwards by the ice, it is most likely that the majority of those caught in and close to Puck Bay, or died on northern Gotland were Baltic Proper animals. There is no indication of that these waters are used to a high degree by Belt Sea animals in recent times (Mikkelsen et al., 2016).
5 Confidence
Belt Sea harbour porpoise population
The confidence of the qualitative abundance evaluation of the Belt Sea harbour porpoise population is low.
At present only the strata of the SCANS-III (2016) and the MiniSCANS-II (2020) surveys were fully aligned with the management unit (Sveegaard et al., 2015), estimating an abundance of 42,324 porpoises in 2016 (CV=0.30, 95% CI: 23,368-76,658; (Hammond et al., 2021)) and 17,301 porpoises (CV=0.20, 95% CI: 11,695-25,688) in 2020. Prior to these surveys, three large-scale surveys have been carried out covering parts of or more than the management range of the Belt Sea population, namely SCANS (1994) (Hammond et al., 2002), SCANS-II (2005) (Hammond et al., 2013) and MiniSCANS (2012) (Viquerat et al., 2014)). Following the evaluation of the effort coverage, the trend could only be assessed over a relatively short period of 15 years (2005-2020) since SCANS 1994 did not completely cover the distributional range of the population and missed out a large part (30%) of the area in the east (Figure 12). Such a short-term trend is hard to put into context ecologically, as it does not cover three generations for the species (assuming 7.5 as generation length for harbour porpoises).
In the case of the harbour porpoise population in the Belt Sea, no trend was observed over the study period of 15 years, which is likely due to the large confidence intervals of the earlier surveys and the fact that the 1994 data could not be incorporated due to lack in geographical overlap. It was possible to calculate a trend, but the few data points that are available (4) do not provide sufficient power to detect a change. In the Bayesian trend analysis, the abundance estimate from 2016 (SCANS-III) got less influence on the estimated trend since it is also the estimate with the lowest precision. In this sense, the model took the estimate into account but down-weighted its influence on the trend because of its low precision. Further, this analysis revealed uncertainty in the magnitude of the decline, but the data supported a decline with a higher probability (68.5%) compared to no decline (Figure 6).
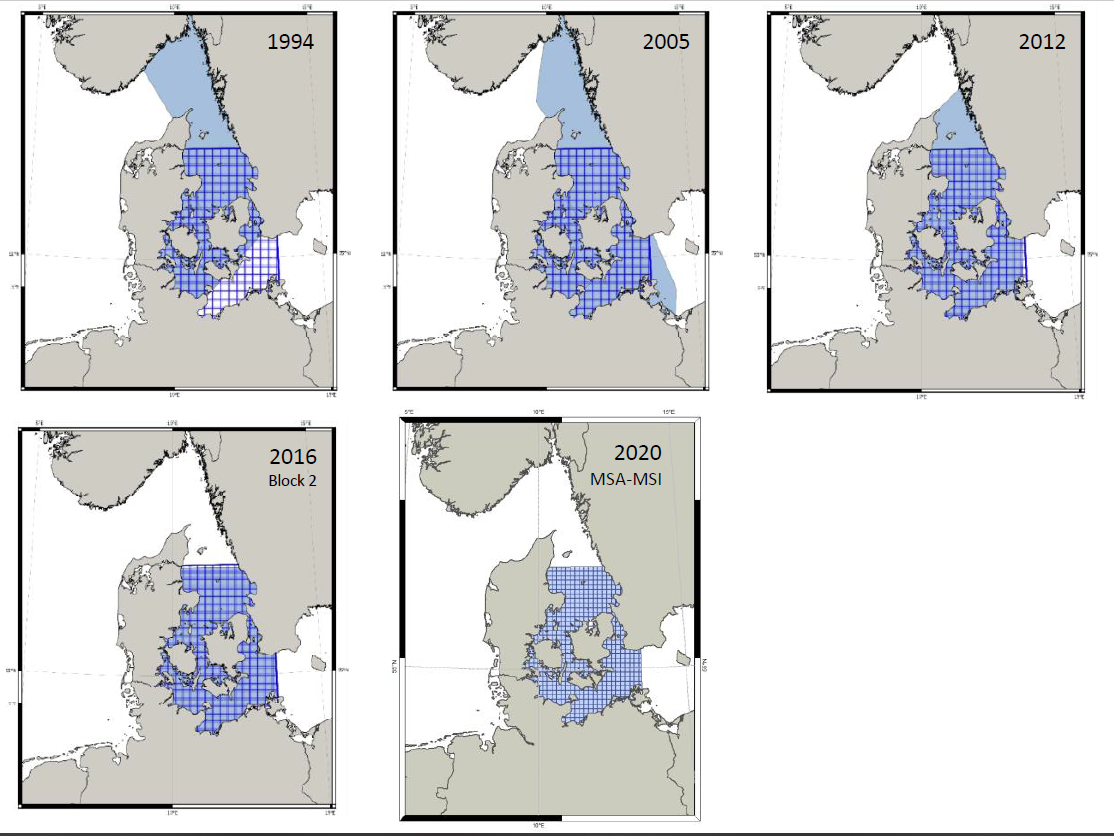
Figure 12. Areas covered during the three SCANS surveys (1994, 2005, 2016; H1) and the MiniSCANS survey in 2012 4) and MiniSCANS-II in 2020 () in the Skagerrak/Kattegat/Belt Seas (coloured light blue) compared with the area believed to represent the harbour porpoise Belt Sea population management area (cross-hatched dark blue from Sveegaard et al. 2015).
Baltic Proper harbour porpoise population
The confidence of the qualitative abundance evaluation of the Baltic Proper harbour porpoise population is high.
Despite the wide confidence interval of the abundance estimate of the Baltic Proper harbour porpoise population from the SAMBAH project (point estimate 491 animals, 95% CI: 71-1105; Amundin et al., 2022), the very small estimate clearly shows that the abundance does not achieve GES.
Furthermore, all new records compiled for the quantitative evaluation were carefully reviewed with regards to species, location and date. Records with dubious species descriptions were left out. Overall, the spatiotemporal information was detailed and the small proportion of approximate data (e.g. decade instead of year) does not reduce the confidence of the evaluation due to the large spatial scale (four large regions covering HELCOM sub-basins) and the historical time perspective (decades). Further, to account for bias due to survey effort, information on harbour porpoise reporting systems in the countries around the Baltic Sea was compiled, and other confounding effects of observation effort and the interest in reporting records was reviewed.
6 Drivers, Activities, and Pressures
Human pressures linked to the indicator
There are a number of human pressures listed in Annex III of the MSFD that are linked to the qualitative evaluation of the Baltic Proper harbour porpoise population (see also Table 3). These include:
Biological features:
A description of the population dynamics, natural and actual range and status of species of marine mammals and reptiles occurring in the marine region or sub-region. For harbour porpoises, this relates to porpoise distribution and abundance.
Information on the structure of fish populations, including the abundance, distribution and age/size structure of the populations. For harbour porpoises, this relates to prey availability and quality.
Biological disturbance: selective extraction of species, including incidental non-target catches (e.g. by commercial and recreational fishing). For harbour porpoises, this relates to two distinct issues:
1) bycatch of the porpoises themselves resulting in direct mortality, and
2) reduction in the quality and quantity of prey resources due to competition with fisheries. – Other physical disturbance: Underwater noise (e.g. from shipping, underwater acoustic equipment), and marine litter. For harbour porpoises, this includes both impulsive noise (short and powerful noise from sources such as seismic surveys, pile driving, and underwater explosions) as well as continuous noise (from sources such as shipping and wind farm operation).
Marine litter (plastic) is also an issue for marine mammals that often results in mortality or reduced health. Ghost nets (lost or discarded fishing gear) can also result in direct mortality when animals become entangled.
Contamination by hazardous substances- Introduction of synthetic compounds and introduction of non-synthetic substances and compounds. For harbour porpoises, high levels of contaminants have been shown to result in decreased fertility and increased mortality, particularly in calves that receive high levels of contaminants from their mother.
Physical and chemical features: annual and seasonal temperature regime and ice cover, current velocity, upwelling, wave exposure, mixing characteristics, turbidity, residence time. For harbour porpoises this can relate to the influence of climate change resulting in warmer water and more dead zones in the Baltic Sea.
Table 3. Brief summary of relevant pressures and activities with relevance to the indicator.
| | General | MSFD Annex III, Table 2a |
| Strong link | The main pressures affecting the abundance of Baltic harbour populations include, by-catches, physical disturbance via underwater noise, and contamination by hazardous substances. | Biological
Substances, litter and energy
Pressures by substances, litter and energy:
|
| Weak link | For harbour porpoises this can relate to the influence of climate change resulting in warmer water and more dead zones in the Baltic Sea.
Fishery and food availability |
Pressures by substances, litter and energy:
|
7 Climate change and other factors
The expected change in temperature and stratification, prey distribution, quality and quantity will affect all marine mammals, including harbour porpoises, but aggregated effects on their abundance and distribution are unpredictable (HELCOM/Baltic Earth 2021). It is furthermore predicted more maritime traffic in the Baltic Sea, leading to more underwater noise, which are relating to injuries and displacement from habitats. Implications of this also extents to the disturbance of behaviour of harbour porpoises due to the underwater noise affecting the functionality of echolocation. Changes in ecosystem structure and function could compound issues for already vulnerable populations.
8 Conclusions
Due to the lack of appropriate data as well as thresholds for a robust quantitative abundance evaluation, a qualitative evaluation was carried out for both harbour porpoise populations in the Baltic Sea.
Taking both the trend in abundance and the absolute abundance into consideration, trends in abundance were assessed for the Belt Sea population of harbour porpoises applying different analytical approaches (Gilles et al., 2022). The qualitative evaluation indicates that the Belt Sea harbour porpoise population does not achieve good environmental status
For the Baltic Proper population, an evaluation based on the absolute abundance estimate from SAMBAH in combination with historical records on harbour porpoise occurrence within the May-October management range was performed. The qualitative evaluation shows that the abundance of the Baltic Proper harbour porpoise population does not achieve good environmental status.
8.1 Future work or improvements needed.
While the current evaluation is a significant step forward to provide an initial evaluation there is need for significant further work to improve future evaluations. There is currently a lack of harmonisation in the passive acoustic monitoring used to monitor harbour porpoises and this issue needs to be addressed to advance future evaluations. There is variation in the filtering and processing methods used by different countries, and some variation in the device used. This prevents comparability between countries. There is a need for future harmonisation to facilitate population level evaluations of indicators, particularly for the critically endangered Baltic Proper population. In addition, further work is needed to establish a full and working understanding of relevant conservation objectives to support the development and agreement on quantifiable threshold values against which future evaluations can be applied (please see section 3 on threshold values for more details). This process will also require the application of relevant methodologies to achieve the establishment of such threshold values (for example Limit Reference Values, LRL, and Target Reference Limits, TRL) and require suitable monitoring to be implemented to achieve the needed data sets for the evaluations. These aspects all require designated resourcing for progress to be made.
In the case of the harbour porpoise population in the Belt Sea, no trend was observed over the study period of 15 years, which is likely due to the large confidence intervals of the earlier surveys and the fact that the 1994 data could not be incorporated due to lack in geographical overlap. Additional work resources are needed to evaluate how these survey data could be (spatially) extrapolated and, thus, included in the trend analysis, which would be extremely valuable for the trend evaluation as we would then have 26 years of data, i.e. more than three generations (=22.5 yrs).
9 Methodology
9.1 Scale of assessment
This qualitative assessment evaluates the abundance and trend of the Belt Sea and Baltic Proper harbour porpoise population using HELCOM assessment unit scale 2 (division of the Baltic Sea into 17 sub-basins) as its base, with these assessment units aggregated to relevant management areas. The assessment units are defined in the HELCOM Monitoring and Assessment Strategy Attachment 4.
9.2 Methodology applied
The two populations are addressed using different methodologies due to the inherent differences in available data and information. These methodologies are set out in the sections below.
Belt Sea harbour porpoise population
A joint HELCOM/OSPAR workshop on abundance indicators and trend-based evaluation for harbour porpoises was held in April 2021 as part of the HELCOM BLUES project (HELCOM, 2021, HELCOM BLUES WS 2.4.1-2021). The applicability of approaches harmonised with OSPAR (OSPAR M4 indicator – Cetacean abundance and distribution) on the Belt Sea harbour porpoise was discussed. Two methods to assess trends in abundance were subsequently applied. The first method followed a simulation approach (Authier et al., 2020) using available conventional distance sampling (CDS) estimates from four population-wide surveys (SCANS and MiniSCANS surveys, 2005-2020). Since the three SCANS and two MiniSCANS surveys covered the management area of the Belt Sea population to varying extents, the estimates from surveys prior to 2016 were post-stratified. This was accomplished by scaling the CDS estimates, as well as the 95% confidence intervals, to the size of the management area, assuming that the average density was unbiased. The second approach used the same available survey data; however, a Bayesian trend analysis was used following the approach as recently completed for harbour porpoises in the North Sea (Nachtsheim et al., 2021). This approach represents a more in depth and fine-scaled approach by incorporating all sources of uncertainty and gets a closer representation of the trend by estimating its whole distribution instead of only using the point estimate (as done in Authier et al., 2020).
As an extension to further bring results into context, the results of all German aerial surveys completed since 2002 in the south-western Baltic Sea, including parts of Danish waters, were examined for a trend using the Bayesian method above for both the western (Kiel and Flensburg Bight) and eastern (Fehmarn Belt) sections of surveys (Gilles et al., 2022).
An additional intersessional workshop was held in May 2022 to conclude on the expert-based qualitative evaluation for the Belt Sea population (Owen et. al. 2022). In order to complete a qualitative evaluation of the abundance of the Belt Sea population of harbour porpoises, both the trend in abundance and the absolute abundance were taken into consideration. A “one out all out” rule was applied, where both components of abundance needed to be in good environmental status, for the overall evaluation to be good environmental status. This is aligned to the planned method for the indicator once thresholds are set in future, which is based on the method used for other species (e.g. seals and cetaceans and as also applied in the OSPAR region).
Baltic Proper harbour porpoise population
In the SAMBAH project, passive acoustic monitoring and species distribution models were used to describe the spatial and seasonal distribution of harbour porpoises in the Baltic Proper. Porpoise click detectors were deployed over a systematic grid of 304 stations in eight countries and data collected from April 2011 through June 2013 were analysed. Generalized additive models (GAMs) were used to describe the monthly probability of detecting porpoise clicks as a function of spatially-referenced covariates and time.
The qualitative evaluation of the abundance of the Baltic Proper harbour porpoise was completed by the Swedish Museum of Natural History as a part of the HELCOM BLUES project, with assistance on data sources from many experts around the Baltic Sea. Harbour porpoise records from the late 17th century until 2019 were reviewed in the waters of all countries around the Baltic Sea. These records could include bycatch, animals that were killed or hunted, incidental sightings, effort sightings, strandings, and reports of unknown type.
Data were compiled from published sources such as newspaper articles, scientific papers, reports, museum records, as well as the HELCOM/ASCOBANS harbour porpoise database. Additionally, contacts were made with countries from which data access has been limited or unknown.
More specifically, data were compiled from the following sources: Denmark: Historical data on catches of dead animals in the Bornholm area during winter have been compiled from a published report (Johansen, 1929) . Estonia: Data have been compiled from a review of harbour porpoise observations in Estonian waters. The review consisted of searches through newspaper articles, museum records and interviews with coastal people, and all records were geographically positioned (Jüssi and Liivak, 2005). Finland: All data, including historical records, were available in the HELCOM/ASCOBANS harbour porpoise database. Germany: TiHo and DMM confirmed they are not aware of any additional records that have not been submitted to the HELCOM/ASCOBANS database. We were directed to www.schweinswale.com that collected records between 1987 to 2014, and as far as we understand these data were already included in the HELCOM/ASCOBANS harbour porpoise database. Latvia: We were informed by the Nature Conservation Agency of the Latvian Government that all information from Latvia is already in the HELCOM/ASCOBANS database, and that there may be additional records in online newspapers. This site only includes newspaper records back until 1990. Lithuania: Data have been compiled from a review of harbour porpoise observations made for a protection plan and a summary of an action plan for harbour porpoises (Lithuanian Ministry of Environment, 2012). We identified geographical positions based on the written descriptions of the record. Poland: Data on historical observations have been compiled from published articles on observations of harbour porpoises, including records from bounty schemes (Psuty, 2013; Skóra et al., 1988). Russia: Data have been compiled from a report for a project reviewing the harbour porpoise presence in Russian territorial waters of the Baltic Sea (Guschin and Fedorov, 2011). This review consisted of questionnaires to sea users, searches through museum records, and field observations (including beach searches). We identified geographical positions based on the written descriptions of the records. Sweden: We compiled data from historical newspaper articles using a national database with a search for the word ‘tumlare’ (porpoise in Swedish) and ‘pyöriäinen’ (porpoise in Finnish). These records consisted of newspaper accounts up until 1906, with new records added over time. The digitisation process for the national database is still ongoing, and all records up to and including 1906 is planned to be available in January 2023. From 1907 and onwards, only the major newspapers will be digitised and searchable. This made a full review of all accounts impossible, but all records that were publicly available online at the time for the Swedish coastal counties ranging from the border to Finland in the north to Blekinge county in the southeast were compiled, i.e. the coastal stretch approximately within the May-October management range of the Baltic Proper harbour porpoise population.
We quality controlled the records for species, and determined a geographical position for the record based on the written description. Further, we compiled data on historical observations on the occurrence of harbour porpoises from published reports and articles (Tägström, 1940; Ekman, 1938; Lindroth, 1962; Lönnberg, 1940). All data were compiled in a standardised format to facilitate upload to the HELCOM/ASCOBANS harbour porpoise database. In addition to compiling data on harbour porpoise records, information was also collated on the existence and start date of any strandings programme and reporting system for opportunistic harbour porpoise observations in the countries around the Baltic Sea.
The data on harbour porpoise records were divided into three time periods: before 1950, 1950-1990, and after 1990. These time periods were chosen based on the approximate time for when modern fishing methods were introduced (around 1950), and when strandings programmes and reporting systems for harbour porpoise observations were established (around 1990). Geographically, data were divided into four regions: the Gulf of Bothnia (Bothnian Bay, The Quark, and Bothnian Sea), the Gulf of Finland, the Gulf of Riga, and the Baltic Proper (Åland Sea, Northern Baltic Proper, Western Gotland Basin, Eastern Gotland Basin, Gdansk Basin, and the eastern part of Bornholm Basin). Maps and histograms for the four regions were produced to visualise changes in abundance and distribution over time. Historical data were compared to current information, including the most recent information on distribution and abundance from the SAMBAH project (Amundin et al., 2022; Carlén et al., 2018), and any published information from national monitoring programmes.
As there is no clear spatial separation between the Belt Sea and Baltic Proper harbour porpoise populations during November-April (Carlén et al., 2018), the review focused on data east of the May-October management range for the Baltic Proper harbour porpoise population (Carlén et al., 2018). The results were applied on all HELCOM sub-basins ranging from Arkona Basin and eastwards, i.e. the twelve sub-basins overlapping with the tentative management range of the population during November-April (ICES, 2020), also including the sub-basins overlapping with the May-October management range.
9.3 Monitoring and reporting requirements
There is currently a lack of harmonisation in the passive acoustic monitoring used to monitor harbour porpoises by the Contracting Parties. There is variation in the filtering and processing methods used by different countries, and some variation in the device used. This prevents comparability between countries. There is a need for future harmonisation to facilitate population level evaluations of indicators, particularly for the critically endangered Baltic Proper population.
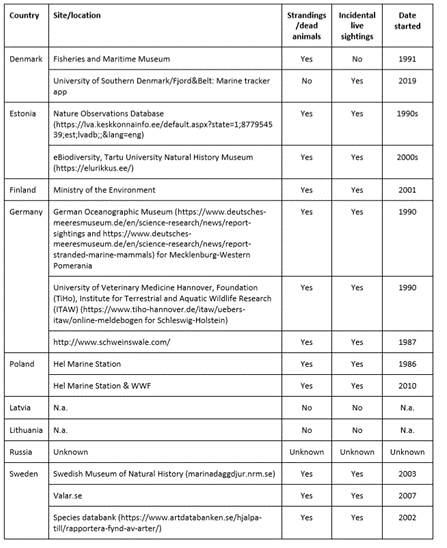
Information on strandings programme and reporting system for harbour porpoise incidental observations in the countries around the Baltic Sea is shown in Table 4.
Table 4. Overview of strandings programmes and reporting systems for harbour porpoise observations in the countries around the Baltic Sea.
The visual surveys for assessing population-wide abundance, as well as surveys on a national level, are standardised and well harmonised within the Contracting Parties in the range of the Belt Sea population.
Monitoring methodology
The current monitoring carried out in HELCOM is not directly relevant to the qualitative evaluation applied for HOLAS 3. The development of optimal and harmonised monitoring is underway and will be vital or future development of this indicator.
Monitoring of the abundance of harbour porpoises in the Contracting Parties of HELCOM is described on a general level in the HELCOM Monitoring Manual in the Harbour porpoise abundance sub-programme available here: https://helcom.fi/action-areas/monitoring-and-assessment/monitoring-manual/.
10 Data
Access and use
All data compiled for the qualitative evaluation will be made available for the HELCOM/ASCOBANS harbour porpoise database and HELCOM Biodiversity Database.
The data and resulting data products (e.g. tables, figures and maps) available on the indicator web page can be used freely given that it is used appropriately and the source is cited.
11 Contributors
The indicator “Abundance and population trends of harbour porpoises” is co-led by Germany (responsible expert: Anita Gilles) and Sweden (responsible expert: Julia Carlström). Further contributors: Ida Carlén, Michael Dähne, Pia Eriksson, Olli Loisa, Dominik Nachtsheim, Kylie Owen, Iwona Pawliczka, Signe Sveegaard
Data contributors and people who have provided assistance: Carl C. Kinze, Seals and Whales of Denmark, Denmark; Signe Sveegaard, Aarhus University, Denmark; Ivar Jüssi, ProMare, Estonia; Aleksander Klauson, TalTech, Estonia; Elo Rasmann, Ministry of the Environment, Estonia; Olli Louisa, Turku University of Applied Sciences, Finland; Anja Gallus, German Oceanographic Museum, Germany; Michael Dähne, German Oceanographic Museum, Germany; Anita Gilles, University of Veterinary Medicine Hannover, Germany; Saulius Karalius, Lithuanian Sea Museum, Lithuania; Aistė Kubiliūtė, Environmental Protection Agency, Lithuania; Airita Brenča, University of Latvia, Latvia; Iwona Pawliczka, University of Gdansk, Poland; Irina Trukhanova, Baltic Fund for Nature, Russia
HELCOM Secretariat: Jannica Haldin, Owen Rowe, Jana Wolf
Project: HELCOM BLUES
12 Archive
This version of the HELCOM core indicator report was published in April 2023:
The current version of this indicator (including as a PDF) can be found on the HELCOM indicator web page.
This version of the HELCOM pre-core indicator report was published in 2023 and is the first iteration of this indicator, thus no prior version is available.
13 References
Amundin, M., Carlström, J., Thomas, L., Carlén, I., Koblitz, J., Teilmann, J., Tougaard, J., Tregenza, N., Wennerberg, D., Loisa, O., Brundiers, K., Kosecka, M., Kyhn, L.A., Tiberi Ljungqvist, C., Sveegaard, S., Burt, M.L., Pawliczka, I., Jussi, I., Koza, R., Arciszewski, B., Galatius, A., Jabbusch, M., Laaksonlaita, J., Lyytinen, S., Niemi, J., Šaškov, A., MacAuley, J., Wright, A.J., Gallus, A., Blankett, P., Dähne, M., Acevedo-Gutiérrez, A., Benke, H., 2022. Estimating the abundance of the critically endangered Baltic Proper harbour porpoise (Phocoena phocoena) population using passive acoustic monitoring. Ecol. Evol. 12, e8554. https://doi.org/10.1002/ece3.8554
ASCOBANS, 2020. The Baltic Proper harbour porpoise. UNEP/ASCOBANS/Res.9.2.
Authier, M., Galatius, A., Gilles, A., & Spitz, J. (2020). Of power and despair in cetacean conservation: estimation and detection of trend in abundance with noisy and short time-series. PeerJ, e9436. doi:10.7717/peerj.9436
Carlén, I., Thomas, L., Carlström, J., Amundin, M., Teilmann, J., Tregenza, N., Tougaard, J., Koblitz, J.C., Sveegaard, S., Wennerberg, D., Loisa, O., Dähne, M., Brundiers, K., Kosecka, M., Kyhn, L.A., Ljungqvist, C.T., Pawliczka, I., Koza, R., Arciszewski, B., Galatius, A., Jabbusch, M., Laaksonlaita, J., Niemi, J., Lyytinen, S., Gallus, A., Benke, H., Blankett, P., Skóra, K.E., Acevedo-Gutiérrez, A., 2018. Basin-scale distribution of harbour porpoises in the Baltic Sea provides basis for effective conservation actions. Biol. Con. 226, 42-53. https://doi.org/10.1016/j.biocon.2018.06.031
Ekman, S. 1938. Tumlaren. Brehm, A.: Djurens liv. Del 1. Stockholm.
Gilles, A., Nachtsheim, D., Authier, M., Siebert, U., 2022. Report on HELCOM BLUES Subtask 2.4.2: Assessing trends in abundance for assessment of the Belt Sea population. University of Veterinary Medicine Hannover, Foundation. 18 pp.
Guschin A., Fedorov V. 2011. Project Report: Inventories of harbour porpoise Phocoena phocoena presence in Russian territorial waters of the Baltic Sea. Under project agreement No SSFA / ASCOBANS / 2010 / 1. Submitted to the 19 the ASCOBANS Advisory Committee Meeting (AC19/Doc.6-03 (S)), Galway, Ireland, 20-22 March 2012. Hammond, P.S., Berggren, P., Benke, H., Borchers, D.L., Collet, A., Heide-Jørgensen, M.P., Heimlich, S., Hiby, A.R., Leopold, M.F., Øien, N., 2002. Abundance of harbour porpoise and other cetaceans in the North Sea and adjacent waters. J. Appl. Ecol. 39, 361–376.
Hammond, P.S., Berggren, P., Benke, H., Borchers, D.L., Collet, A., Heide-Jørgensen, M.P., Heimlich, S., Hiby, A.R., Leopold, M.F., Øien, N., 2002. Abundance of harbour porpoise and other cetaceans in the North Sea and adjacent waters. J. Appl. Ecol. 39, 361–376.
Hammond, P.S., Macleod, K., Berggren, P., Borchers, D. L., Burt, L., Cañadas, A., Desportes, G., Donovan, G. P., Gilles, A., Gillespie, D., Gordon, J., Hiby, L., Kuklik, I., Leaper, R., Lehnert, K., Leopold, M., Lovell, P., Øien, N., Paxton, C. G. M., Ridoux, V., Rogan, E., Samarra, F., Scheidat, M., Sequeira, M., Siebert, U., Skov, H., Swift, R., Tasker, M. L., Teilmann, J., Van Canneyt, O., Vázquez, J.A., 2013. Cetacean abundance and distribution in European Atlantic shelf waters to inform conservation and management. Biol. Con., 164, 107–122. doi:10.1016/j.biocon.2013.04.010
Hammond, P. S., Lacey, C., Gilles, A., Viquerat, S., Börjesson, P., Herr, H., Macleod, K., Ridoux, V., Santos, M. B., Scheidat, M., Teilmann, J., Vingada, J., & Øien, N. (2021). Estimates of cetacean abundance in European Atlantic waters in summer 2016 from the SCANS-III aerial and shipboard surveys. Revised version (June 2021). https://scans3.wp.st-andrews.ac.uk/files/2021/06/SCANS-III_design-based_estimates_final_report_revised_June_2021.pdf
HELCOM, 2021. Outcome of the First Meeting of the HELCOM BLUES project on improved harmonisation between HELCOM and OSPAR regarding indicators for Harbour porpoise (HELCOM BLUES WS 2.4.1- 2021). First Workshop on the HELCOM BLUES project on indicators for harbour porpoise Online, 26-27 April 2021. Accessed 29 March 2022. Available at https://portal.helcom.fi/meetings/HELCOM%20BLUES%20WS%202.4.1-2021-886/MeetingDocuments/Outcome%20of%20HELCOM%20BLUES%20WS%202.4.1-2021.pdf
HELCOM, 2022. Harbour porpoise observations of type bycatch, hunted or killed, stranded, incidental sightings, effort sightings, or unknown. Database: HELCOM/ASCOBANS harbour porpoise database. Available from: https://maps.helcom.fi/website/biodiversity/ (downloaded 16 June 2022).
HELCOM/Baltic Earth 2021. “Climate Change in the Baltic Sea. 2021 Fact Sheet. Baltic Sea Environment Proceedings n°180.
ICES, 2014. General advice on OSPAR request on implementation of MSFD for marine mammals. ICES advice 2014, Book 1: 1.6.6.1. https://www.ices.dk/sites/pub/Publication%20Reports/Advice/2014/Special%20Requests/OSPAR_Implemen tation_of_MSFD_for_marine_mammals.pdf
Johansen, A.C., 1929. Om Dødeligheden blandt Marsvin, Fisk og større Krebsdyr i Farvandene omkring Danmark under strenge Vintre. Beret. Til Minist. Søfart Og Fisk. Fra Den Dan. Biol Stn. 35, 60–89.
Jüssi, I., Liivak, A. 2005. Historical distribution of harbour porpoises (Phocoena phocoena) in Estonian coastal waters. Poster presentation at the 16th biennial conference of the Society for Marine Mammalogy, San Diego, CA, USA, 12-16 Dec.
Lindroth, A., 1962. Baltic salmon fluctuations 2: Porpoise and salmon. Rep. Inst. Freshw. Res. Drottningholm 105–112.
Lönnberg, E. 1940. Massdöd av tumlare, Phocaena communis. Fauna och Flora 35: 284.
Mikkelsen, L., Rigét, F.F., Kyhn, L.A., Sveegaard, S., Dietz, R., Tougaard, J., Carlström, J.A., Carlén, I., Koblitz, J.C., Teilmann, J., 2016. Comparing distribution of harbour porpoises (Phocoena phocoena) derived from satellite telemetry and passive acoustic monitoring. PloS One 11, e0158788. https://doi.org/10.1371/journal.pone.0158788
Nachtsheim, D. A., Viquerat, S., Ramírez-Martínez, N.C., Unger, B., Siebert, U., Gilles, A., 2021. Small cetacean in a human high-use area: Trends in harbor porpoise abundance in the North Sea over two decades. Front. Mar. Sci., 7, 606609. doi:10.3389/fmars.2020.606609
OSPAR, 2021. M4 cetacean abundance and distribution threshold proposal. Document submitted to BDC 2021; BDC 21/4/7 Add.4
Owen, K., Sveegaard, S. Dähne, M., Carlén, I., Carlström, J., Gilles, A. 2022. Personal communication with experts on the trend of harbour porpoise abundance: what is needed to further develop an abundance indicator for the Belt Sea population? May 2022
Psuty, I., 2013. Records of harbour porpoises (Phocoena phocoena) in fishing nets during the interwar period in Poland: verification of archival materials. Aquat. Mamm. 39, 270–281.
Skóra, K.E., Pawliczka, I., Klinowska, M., 1988. Observations of the Harbour Porpoise (Phocoena phocoena) on the. Aquat. Mamm. 14, 113–119.
Skóra, K.E., Kuklik, I., 2003. Bycatch as a potential threat to harbour porpoises (Phocoena phocoena) in Polish Baltic waters. NAMMCO Sci. Publ. 5, 303–315. https://doi.org/10.7557/3.2831
Sveegaard, S., Galatius, A., Dietz, R., Kyhn, L., Koblitz, J.C., Amundin, M., Nabe-Nielsen, J., Sinding, M.-H.S., Andersen, L.W., Teilmann, J., 2015. Defining management units for cetaceans by combining genetics, morphology, acoustics and satellite tracking. Glob. Ecol. Conserv. 3, 839–850. https://doi.org/10.1016/j.gecco.2015.04.002
Tägström, B. (ed). 1940. Massdöd bland tumlarna i södra Östersjön. Svensk Fiskeritidskrift 49: 207-208.
Unger, B., Nachtsheim, D. Ramírez Martínez, N., Siebert, U., Sveegaard, S., Kyhn, L., Balle, J.D., Teilmann, J. Carlström, J., Owen, K., Gilles, A. 2021. MiniSCANS-II: Aerial survey for harbour porpoises in the western Baltic Sea, Belt Sea, the Sound and Kattegat in 2020. Joint survey by Denmark, Germany and Sweden. Final report to Danish Environmental Protection Agency, German Federal Agency for Nature Conservation and Swedish Agency for Marine and Water Management. 28 pp. https://www.tiho-hannover.de/fileadmin/57_79_terr_aqua_Wildtierforschung/79_Buesum/downloads/Berichte/20210913_Report_MiniSCANSII_2020_revised.pdf
Viquerat, S., Herr, H., Gilles, A., Peschko, V., Siebert, U., Sveegaard, S., Teilmann, J., 2014. Abundance of harbour porpoises (Phocoena phocoena) in the western Baltic, Belt Seas and Kattegat. Mar. Biol. 161, 745–754. https://doi.org/10.1007/s00227-013-2374-6
14 Other relevant resources
No additional information is provided at this stage.