 Harbour seal abundance
2 Relevance of the indicator
2.1 Ecological relevance
The population trends and abundance of seals reflect changes in the number of marine top predators in the Baltic Sea. Being top predators of the marine ecosystem, marine mammals are good indicators of the state of food webs, levels of hazardous substances and direct human disturbance. Seals are exposed to bottom-up effects of ecosystem changes at lower trophic levels, but also to variations in climate (length of seasons and ice conditions) and human impacts. These pressures can affect seals indirectly through e.g., decline of fish stocks, levels of harmful substances, or reproductive success, in addition to causing direct mortality by hunting or by-catch. The vulnerability of seals to these pressures makes them good indicators for measuring the environmental status of ecosystems.
The growth rate of a population is the result of age-specific mortality rates and age-specific fecundity rates. It is therefore a sensitive parameter signalling if mortality or fecundity rates change. Depleted, undisturbed harbour seal populations are expected to grow by approximately 12% per year. Significantly decreasing growth rates can be a sign of density-dependence, for example due to limiting food or other resources (Svensson et al. 2011) and the functional factors of carrying capacity. However, decreasing growth can also indicate impaired health caused by contaminants or diseases, as well as excessive hunting or high levels of by-catch.
2.2 Policy relevance
The core indicator(s) on the population trends and abundance of Baltic seals addresses the Baltic Sea Action Plan (BSAP 2021) Biodiversity segment goal of a “Baltic Sea ecosystem [that] is healthy and resilient”. The ecological objectives under this goal are also clearly relevant: ‘Viable populations of all native species’, ‘Natural distribution, occurrence and quality of habitats and associated communities’, and ‘Functional, healthy and resilient food webs’.
The HELCOM Recommendation 27/28-2 Conservation of seals in the Baltic Sea area outlines the conservation goals of seals agreed on at HELCOM. The recommendation is implemented to reach the BSAP goals. The recommendation conservation goals are used as the basis for defining this indicator’s threshold value.
The indicator also has clear relevance for the EU Marine Strategy Framework Directive (MSFD), for those Contracting Parties that are also EU Member States. In particular the relevance is high fro MSFD Descriptor 1 that addresses species and habitats and also for Descriptor 4 that addresses ecosystems, including food webs.
A summary overview of policy linkages is provided in Table 1, below.
In some Contracting Parties, the indicator also has potential relevance for implementation of the EU Water Framework Directive (WFD) and Habitats Directive. The WFD includes status categories for coastal waters as well as environmental and ecological objectives. The EU Habitats Directive (European Commission 1992) specifically states that long-term management objectives should not be influenced by socio-economic considerations, although they may be considered during the implementation of management programmes provided the long-term objectives are not compromised. All seals in Europe are also listed under the EU Habitats Directive Annex II, and member countries are obliged to monitor the status of seal populations.
Table 1. Overview of policy relevance for this indicator.
| Baltic Sea Action Plan (BSAP) | Marine Strategy Framework Directive (MSFD) | |
| Fundamental link | Segment: Biodiversity
Goal: “Baltic Sea ecosystem is healthy and resilient”
|
Descriptor 1 Species groups of birds, mammals, reptiles, fish and cephalopods.
|
| Complementary link | Segment: Biodiversity
Goal: “Baltic Sea ecosystem is healthy and resilient”
Segment: Hazardous substances and litter goal Goal: “Baltic Sea unaffected by hazardous substances and litter”
|
Descriptor 1 Species groups of birds, mammals, reptiles, fish and cephalopods.
Descriptor 4 Ecosystems, including food webs.
Descriptor 8 Concentrations of contaminants are at levels not giving rise to pollution effects.
|
| Other relevant legislation: |
|
|
2.3 Relevance for other assessments
The status of biodiversity is assessed using several core indicators. Each indicator focuses on one important aspect of this complex issue. In addition to providing an indicator-based evaluation of the population trends and abundance of seals, this indicator will also contribute to the overall biodiversity assessment, along with the other biodiversity core indicators.
The results are utilised in the HELCOM Biodiversity integrated assessment (BEAT tool) to support an overall evaluation of marine mammal species/groups.
Status for the population trends and abundance of seals (all species separately) in the Baltic Sea is determined by comparing population data with threshold values that have been defined based on concepts developed for the conservation of seals, in particular the HELCOM Recommendation 27/28-2 ‘Conservation of seals in the Baltic Sea area’, which states that the population size is to be managed with the long-term objective of allowing seal populations to recover towards carrying capacity.
Good status for abundance is achieved in a management unit if the population is above the Limit Reference Level (LRL). HELCOM set a LRL of 10,000 individuals for all the Baltic seal species for each ecologically and genetically isolated population (as set out under HELOCM Recommendation 27/28-2). The LRL corresponds to the safe biological level and minimum viable population size. For harbour seals the LRL is assessed understanding that the results of the moult surveys represent a haul-out fraction of approximately 60-70%. The LRL of 10,000 implies a population with approximately 5,000 adult seals (and thus 2,500 adult female seals). LRL has been calculated based on estimates of minimum viable population sizes based on different extinction risk levels (1, 3, 5 and 10%) for genetically and ecologically isolated populations. Analyses were carried out based on these parameters and the value used to set the threshold was 1% extinction risk over 100 years.
The population trend aspect of the threshold value is assessed separately for populations at and below the Target Reference Level (TRL): TRL is the level where the growth rate starts to level off and the population asymptotically approaches the current carrying capacity level.
- For populations that have reached the TRL, good status is defined as ‘No decline in population size exceeding 10% occurred over a period up to 10 years’
- For populations below TRL, good status is defined as 3% below the maximum rate of increase for seal species, i.e. 9 % annual rate of increase for harbour seals.
Harbour seals are less mobile than grey seals and ringed seals, which is the main reason for their finer population structure in the Baltic relative to these species. In the previous evaluation, abundances of Kattegat and SW Baltic were evaluated combined as they were considered to form a meta-population. Since then, evidence suggesting a lack of connections between these areas has emerged in the scientific community, supporting the need for separate evaluations for the Kattegat and SW Baltic areas. However, even very limited gene flow might affect the LRL, because it was set to protect completely isolated populations. Thus, investigations quantifying gene flow between these areas are needed to establish a LRL for separated assessment areas, including the development of suitable threshold values that are viable and do not risk being not potentially unnecessarily conservative. Harbour seals in the Limfjord are not related (genetically) to harbour seals in other HELCOM harbour seal units, but as they are not recognised as an independent management unit under the current system applied in HELCOM, the independent evaluation of this area in this report should not be considered official.
The approach, methods and data used to define the threshold values for abundance and growth rates are explained in detail in the previous indicator report Population trends and abundance of seals HELCOM core indicator 2018 (pdf).
4 Results and discussion
The results of the indicator evaluation that underlie the key message map and information are provided below.
4.1 Status evaluation
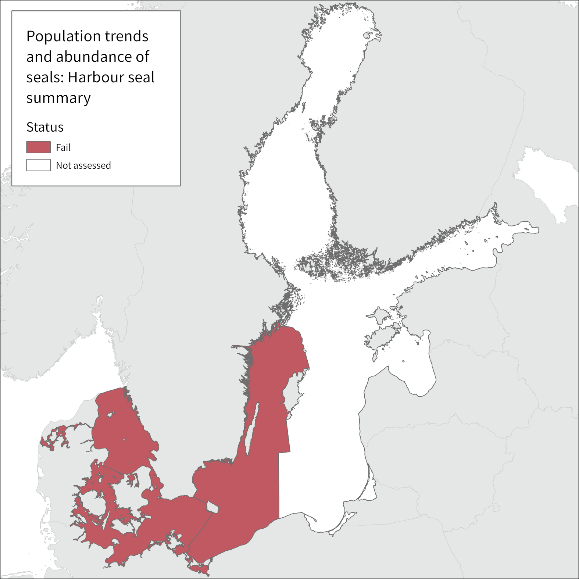
All harbour seal subpopulations fail to achieve good status in the current population abundance and trends indicator evaluation (Figure 2).
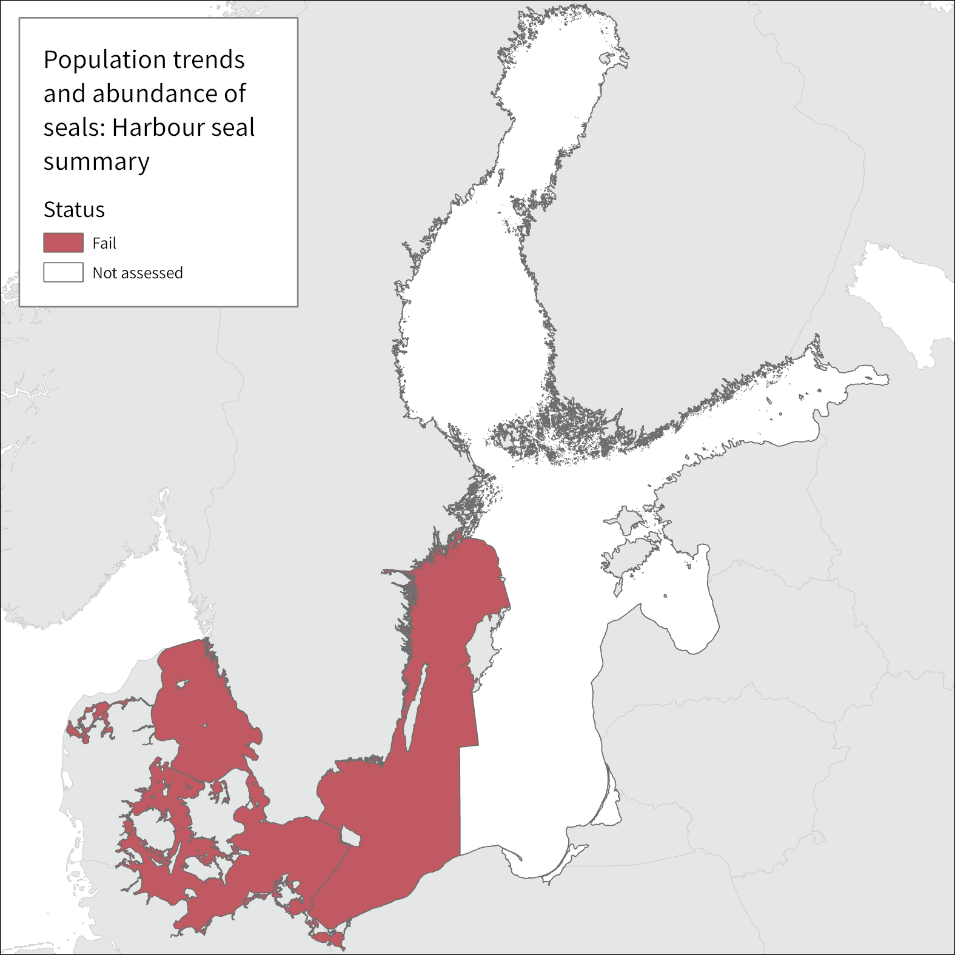
Figure 2. Harbour seals occur in two management units, where seals in the Kalmarsund do not achieve good status because of population size well below the LRL while their growth rate is only slightly below the threshold value of 9%. Harbour seals in the Kattegat and Southern Baltic do achieve good status with respect to their combined abundance, but the Southern Baltic unit does not achieve good status because the growth rate does not meet the threshold. Kattegat harbour seals do not achieve good status if evaluated against exponential growth phase or against short-time decrease in the trend. However, it is uncertain if the Kattegat unit is at or below TRL or undergoing a decline. Harbour seals in Limfjord are not listed in the HELCOM Recommendation 27/28-2 and are unofficially evaluated independently. Abundance of the subpopulation is well below LRL, but also below historical levels and growth rate has been close to zero, indicating deteriorated habitat and possibly approaching new decreased carrying capacity.
The harbour seal population in the HELCOM area is currently recognize as 2 official management units for abundance, consisting of (i) Kalmarsund, (ii) southwestern (SW) Baltic Sea (i.e. Bornholm Basin, Arkona Basin, Bay of Meklenburg, Kiel Bay, The Sound and the Southern part of the Great Belt assessment units) and the Kattegat (including the Northern part of the Great Belt assessment unit). Here we also assess a third unofficial unit, (iii) the Limfjord. Trends are assessed individually for the subpopulations within these management units, namely the SW Baltic and Kattegat are assessed individually for growth rate. There is on-going discussion as to how these populations should be managed in the future, see section 4.2, but the evaluation here follows that of HOLAS II. The evaluations for population trends are based on data from 2003-2021, since long-term time-series are needed to detect changes in population growth rates. Most recent data from the assessment period 2016-2021 is used to assess population abundance.
Kalmarsund
The harbour seal population in Kalmarsund is genetically divergent from the adjacent harbour seal populations (Goodman 1998) and experienced a severe bottle-neck in the 1970s when only some 30 seals were counted. Long-term isolation and low numbers have resulted in low genetic variation in this population (Härkönen et al. 2006).
Population Abundance evaluation: During the assessment period (2016-2021), counted numbers have increased to approximately 2 000 individuals. The value is the maximum result of repeated surveys within the survey period, which is assumed to correspond to 70% of total population size, represents an estimated total abundance of 2 900 harbour seals in the area. The current population size is still well below the LRL of 10,000 individuals, which is why this population does not achieve good status for population abundance.
Population Trend evaluation: During the period 2003-2021, the Kalmarsund population has increased on average by 9.9 % per year. A Bayesian analysis of the trend shows that there is 80% support for a growth rate of ≥8.9%, which is just below the threshold value of 9% (Figure 3), therefore this population does not achieve good status for its population trend. However, the growth rate is very close to the threshold and a variation in a single datapoint could flip the evaluation result. Considering the high inter-annual variation in inventory counts caused by weather factors this impacts on the confidence of the evaluation.
Overall evaluation: Based on the one-out-all-out concept the evaluation for the management unit of harbour seals in the Kalmarsund does not achieve good environmental status.
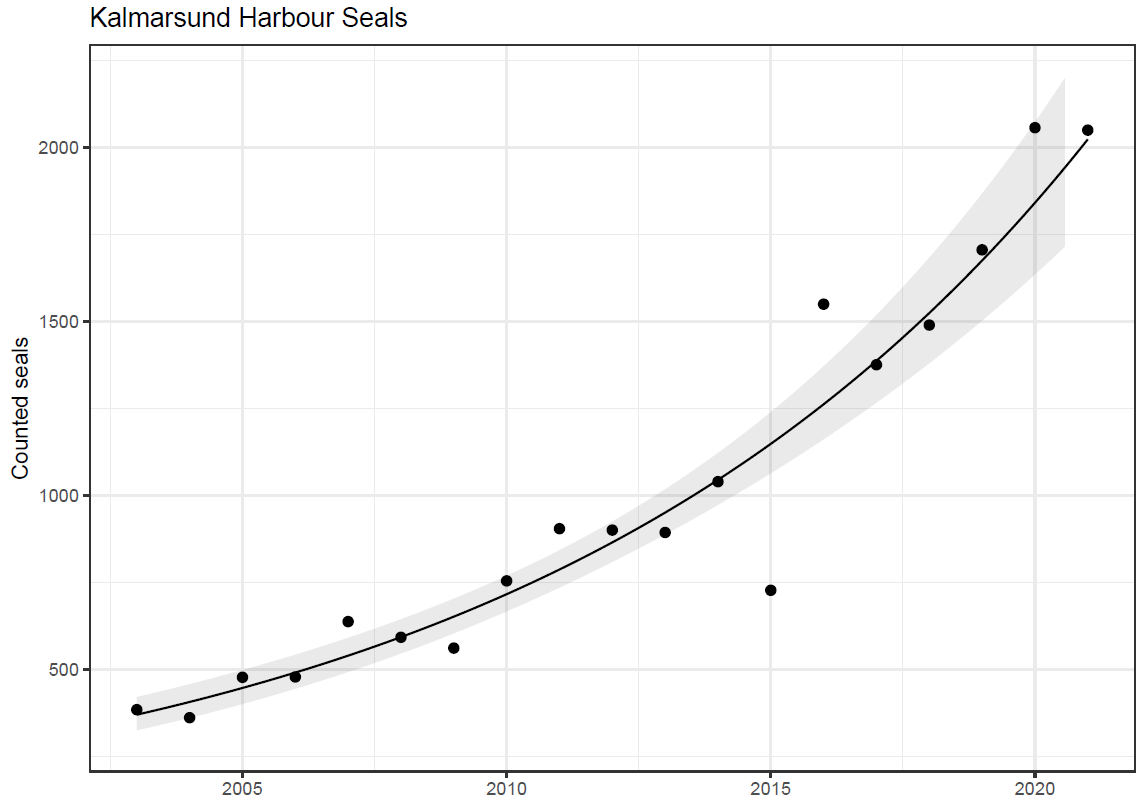
Figure 3. The annual maximum number of hauled out harbour seals counted during the moulting surveys. The annual growth rate of counted harbour seals in Kalmarsund was 9.9% during the period 2003-2021. According to Bayesian statistics there is 80% support for a growth rate ≥8.9%, which is just below the threshold value of 9%. The total number of individuals (approximately 2 900 animals) is well below the LRL of 10 000, which means that this population does not achieve good status.
Kattegat, the Danish Straits and the Southwestern Baltic Sea
Population Abundance evaluation: During the surveys an estimated 60% of the population is observed at haul-outs in this region. The mean number of seals by sea area seen during the repeated surveys are used for the abundance and trend index in this area. This is to smooth the variation between the survey days that are a result of heavy disturbance by boats and tourists during the moulting season that impact the number of seals hauling out. In HOLAS II the trimmed mean (mean of two highest counts of three) was used for the evaluation but this has changed due to a methodology change in the Danish survey where now only two replicate surveys are completed as opposed to the previous three. Thus, the trimmed mean can no longer be used.
In the SW Baltic, approximately 1200 seals have been observed hauling out in the most recent years (Figure 4), giving a total estimated population size of 2000 harbour seals. In Kattegat, the number of seals hauled out range between 7500 – 11 000 individuals during the assessment period 2016-2021 (Figure 5). As such, the lowest estimated population size for Kattegat is 12 500 individuals. Combining Kattegat and the SW Baltic gives a minimum estimated population size of 14 500 individuals in this management unit. This is above the LRL of 10 000 which means the harbour seal management unit SW Baltic combined with the Kattegat achieve good environmental status for population abundance.
Population Trend evaluation: In the SW Baltic, the average annual rate of increase during the period 2003-2021 was 6.6% (Figure 4). According to the Bayesian analysis there is 80% support for a growth rate ≥6.1%, which is below the threshold value of 9%. Thus, the SW Baltic unit does not achieve good environmental status for the population trend evaluation.
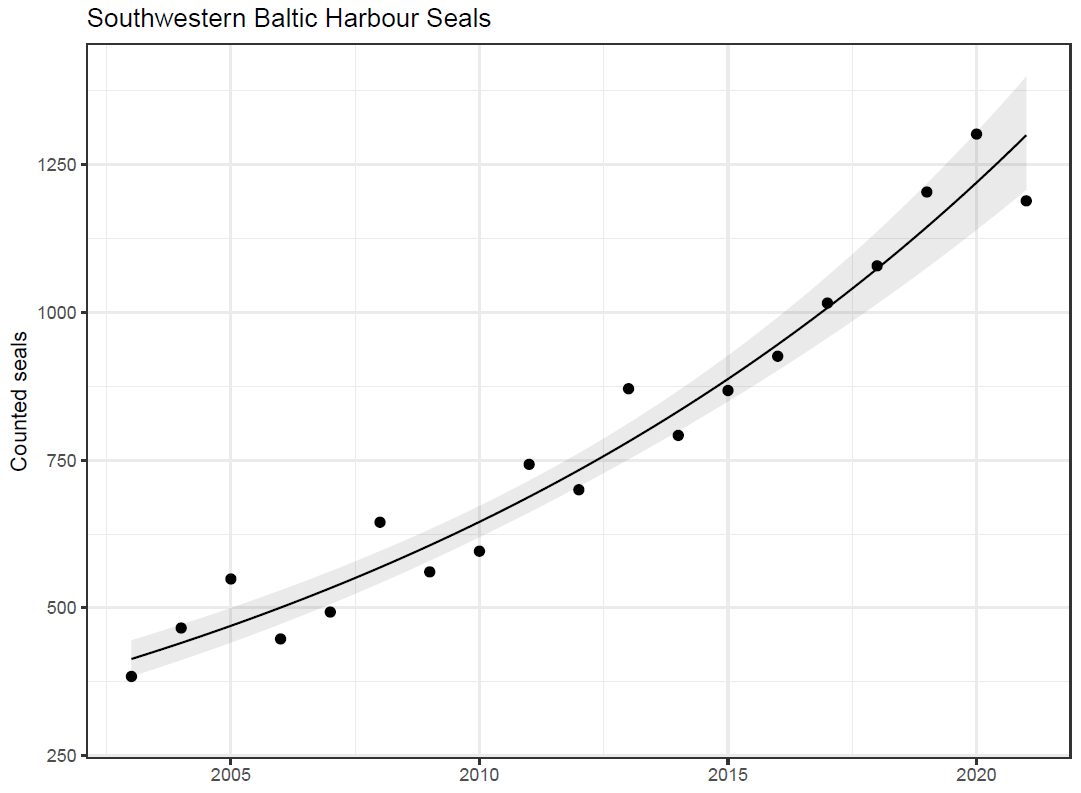
Figure 4. The mean annual number of hauled-out harbour seals counted during the moulting surveys 2003-2021.The annual growth rate of counted seals in the SW Baltic harbour seal subpopulation was 6.6% during the period 2003-2016. According to a Bayesian probability distribution, there is 80% support for a growth rate ≥5.9%, which is below the threshold value of 9%. The abundance of seals is also well below the set LRL, which means that this subpopulation on its own does not achieve good status. Modelled count index and 95% confidence interval around index are provided with a black line and grey area.
In HOLAS II (based on data until 2016) the Kattegat population was assessed as having achieved TRL. Still the population appeared to increase until 2019, with a growth rate of 5.2%. In 2020 and 2021 the counts dropped to a markedly lower level (Figure 4). In 2020 there was a heat wave with an unprecedented number of boats in the archipelago during the survey period, factors that likely lead to fewer seals hauling-out and thus a lower count. However, such extreme conditions were not observed in 2021 where the counts still remain lower than before. As such, these data cannot be considered outliers. However, more data is needed to confirm if there is a declining trend or if the growth rate is levelling off. The observed decline is mainly driven by a drop in counted seals in the Swedish waters of the Kattegat. No signs of increased mortality have been observed. As such, the Kattegat population is assessed as being below TRL with low confidence. During the period 2003-2021 the annual growth rate of counted seals in the Kattegat harbour seal population was 3.8% with a Bayesian analysis showing 80% support for Kattegat harbor seal growth rate at least 3.3% from 2003 to 2021. This is well below the threshold of 9% and the population does not achieve good environmental status for the population trend evaluation. However, the levelling off of population growth as a consequence of density dependence cannot be ruled out. If this is the case, the growth rate should be assessed according to the criterion of no decrease of >10% over a 10-year period. If the Kattegat harbour seal population was assessed as at TRL there is an 80% support that potential decline in Kattegat over last 10 years is <0.005% of abundance. However, during the last 10 years period the data shows an increase in the beginning and a decrease in the end, where a test for linear decrease fits poorly. This complicates the interpretation of the trends for this population assessed with a low confidence.
Overall evaluation: Based on the one-out-all-out concept the evaluation for the management unit of harbour seals in the SW Baltic and the Kattegat does not achieve good environmental status.
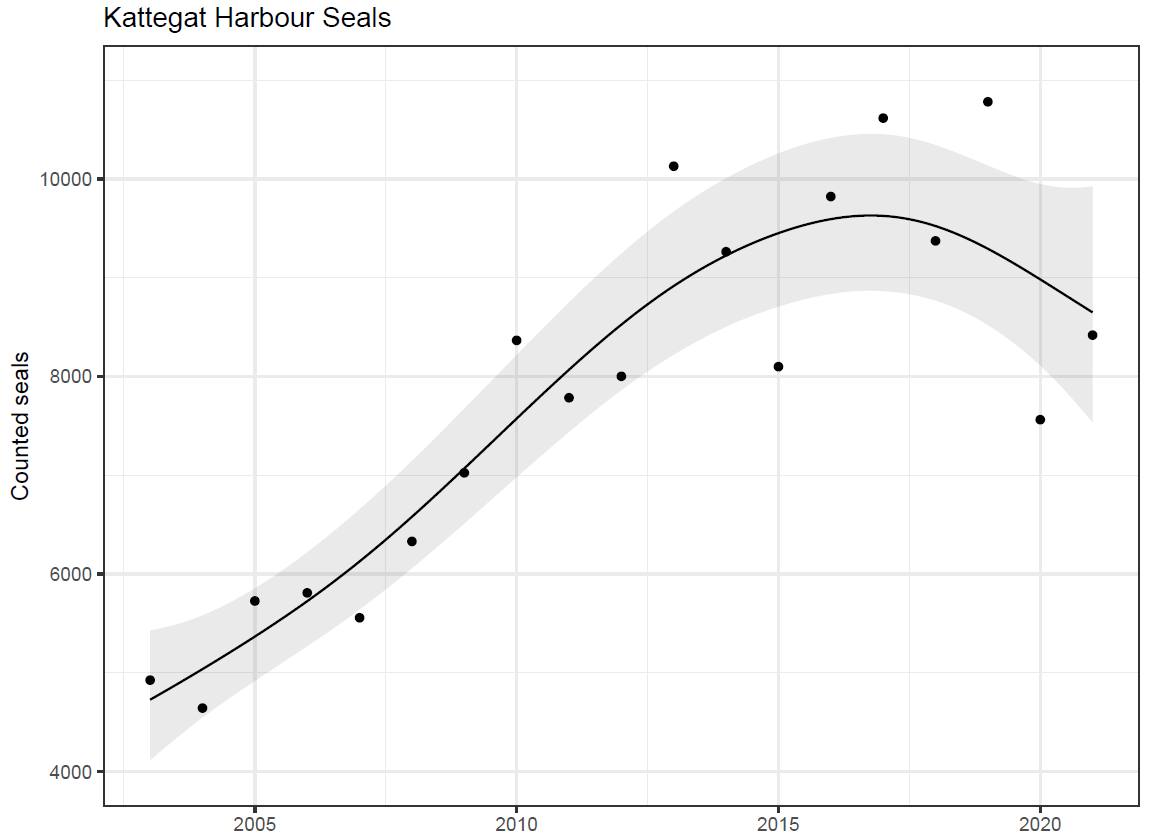
Figure 4. The annual mean number of hauled-out seals counted during the moult survey 2003-2021. The annual growth rate of counted seals in the Kattegat harbour seal subpopulation was 3.8% during the period 2003-2021 under the assumption of exponential growth. According to a Bayesian probability distribution there is 80% support for Kattegat harbour seal growth rate of ≥3.3%, which is below the threshold value of 9%. If the Kattegat harbour seal population was evaluated as at TRL there is an 80% support that potential decline in Kattegat over last 10 years is <0.005% of abundance, which is above the threshold value. However, for a period consisting of both increase and decease phases a test for linear decrease fits poorly. Modelled count index and 95% confidence interval around index are provided with a black line and grey area.
Limfjord (additional unofficial evaluation)
Population Abundance evaluation: The counted numbers in the Limfjord harbour seal population have been fluctuating well below 1 000 individuals and the total population abundance is very uncertain as the high variance of counts indicates haul-out behaviour that is different from the harbour seals in the other areas (Figure 5). The population is clearly below LRL and does not achieve good environmental status for Population abundance.
Population Trend evaluation: For the Limfjord population, the rate of increase was 2.2% during 2003-2021 and the Bayesian analysis gives 80% support for rate of >0.5%. This is significantly lower than the threshold of 9% for populations under TRL, expecting TRL to be above LRL. Although the Limfjord population is also clearly below LRL, it may nevertheless be approaching carrying capacity since the annual growth rate is very low. If the Limfjord harbour seal population was assessed as at TRL there is an 80% support that potential decline in Limfjord over last 10 years is <0.016% of abundance (threshold for MUs at TRL is no decline exceeding 10% over a period up to 10 years), in which case the population would achieve good environmental status for population trend. However, if the population is encountering density dependence, the level of abundance indicates reduced carrying capacity and potentially deteriorated habitat as the counts were significantly higher before the 2002 PDV epidemic. Recent DNA-based studies show that Limfjord harbour seals are independent from Kattegat (Olsen et al. 2014, Liu et al. 2022). However, this evaluation for Limfjord is unofficial since the unit is not specifically listed in the HELCOM Recommendation 27/28-2.
Overall evaluation: Based on the one-out-all-out concept the evaluation for the Limfjord population does not achieve good environmental status.
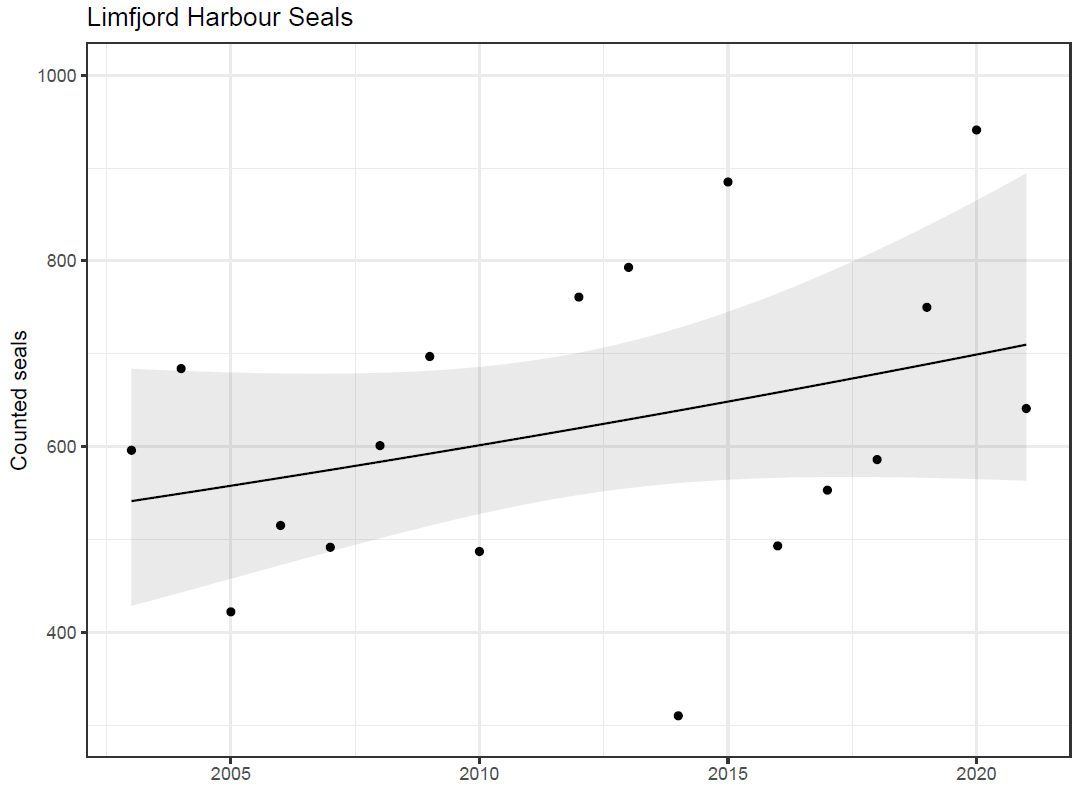
Figure 5. The annual growth rate of counted harbour seals in the Limfjord was 2.2% during the assessment period 2003-2021. According to a Bayesian probability distribution, 80% support for rate of ≥0.5%. This is significantly lower than the threshold of 9%. If the Limfjord harbour seal population was assessed as at TRL there is an 80% support that potential decline in Limfjord over last 10 years is <0.016% of abundance (threshold for MUs at TRL is no decline exceeding 10% over a period up to 10 years). Modelled count index and 95% confidence interval around index are provided with a black line and grey area.
4.2 Trends
Since the previous evaluation it appeared that there is large uncertainty as to if the Kattegat area population has reached TRL or not. In HOLAS II the population was assessed being at TRL, but in following years it continued to increase until 2019. However, the data do not strongly support if the population should be assessed as under or at TRL, demonstrating the difficulty of distinguishing natural reasons for levelling off growth from anthropogenic pressures. Trends are already an integral part of the indicator evaluation structure and thus a key component of the status evaluation.
4.3 Discussion text
HELCOM Recommendation 27-28/2 defines two harbour seal management units, namely the Kalmarsund Region and the Southwestern (SW) Baltic and Kattegat harbour seals populations combined. HELCOM EG MAMA 15-2021 reviewed the HELCOM management unit structure of harbour seals and suggested significant changes, for the full review see HELCOM document 3J-89. In brief, the Limfjord was recommended to be added as a separate management unit since it is part of the HELCOM area but the harbour seals inhabiting this area are genetically separated from nearby areas. It was also recommended that Kattegat and the SW Baltic be separated. Thus, it was recommended for HELCOM to expand the number of harbour seal management units from two to four, namely Kalmarsund, SW Baltic, Kattegat and the Limfjord. Due to a lack of time and resources to achieve this fully and appropriately within the timeframe for HOLAS 3 it was proposed that the HOLAS 3 evaluation should be carried out using the currently agreed management units. In line with this, there is also a need to review the LRL values to include the potential of limited gene-flow and subsequent adjustments to relevant Recommendation(s) which could not be achieved for the timeframe of HOLAS 3 (Intersessional work report, 2022). It has been identified that a clear work plan is needed to achieve this for HOLAS 4. A study on population genetics (Olsen et al. 2014) provides strong support for the Limfjord seals being genetically independent from seals in Kattegat. It was further suggested that Kattegat and the SW Baltic management unit should be separated. Support comes from the genetic study mentioned above that showed very limited gene flow between the areas, which is corroborated from telemetry studies where there is limited movement of seals between the SW Baltic and Kattegat with no evidence of gene flow. Furthermore, the areas have very different developments in population abundance as evidenced in this evaluation and studies have shown that there are considerable differences in contaminant profiles between the two areas (Dietz et al. 1989). Finally, the influenza A epidemic occurring in 2014 that originated in Kattegat spread to all neighbouring areas, with the exception of the SW Baltic, suggesting no contact (i.e. no disease spreading) between seals in Kattegat and SW Baltic (Bodewes et al. 2014; Zohari et al. 2014).
Aside from the above-described need for improved structures to support future evaluations the status evaluations applied within the current management units and utilising the agreed criteria result in a failure to achieve GES in all evaluated assessment units. An overview of the information and a comparison with the previous assessment period (HOLAS II, 2011-2016) is provided in results Table 2.
Table 2. Overview of evaluation outcomes and comparison with previous evaluations.
| HELCOM Assessment unit name (management areas) | Threshold value achieved/failed – HOLAS II | Threshold value achieved/failed – HOLAS 2 | Distinct trend between current and previous evaluation. | Description of outcomes, if pertinent. |
| Kalmarsund Region | Failed | Failed | Stable. No change between the two assessment periods is detected in status. The LRL is failed in both assessment periods, however the Bayesian statistical analysis for HOLAS II there was 80% support for a growth rate ≥6.9%, whereas in HOLAS 3 the equivalent value was ≥8.9%, the latter being close to the threshold value for the parameter. | The population is far below the assigned LRL value and the population growth value is just below the assigned threshold value, thus overall status fails to achieve GES. |
| Southwestern (SW) Baltic and Kattegat | Evaluated in a slightly different manner. | Failed | Stable. Although evaluated in a slightly different manner between the two periods the pattern is similar with the LRL parameter being achieved but the population growth value not achieving its threshold value. The Bayesian analysis indicates that there is 80% support for a growth rate ≥6.1% in the current period and a similar value in the prior period (circa 5.8-5.9). Uncertainty also derived from the possible achievement of TRL, but unclarity remains as longer (future) time series are required to understand the trend. | The population abundance LRL parameter achieved good status but the Bayesian analysis indicates that there is 80% support for a growth rate ≥6.1% which is below the threshold value and thus the overall evaluation fails to achieve GES. |
5 Confidence
Confidence in the evaluations of population abundance in all management units is considered high due to high quality monitoring data. Confidence of the evaluations of Population trends for SW Baltic is considered high but for Kalmarsund and Limfjord moderate and for Kattegat low. In HOLAS II the Kattegat subpopulation was assessed as at TRL. However, more recent data from 2016-2019 indicate continued growth of the population until markedly lower counts in 2020 and 2021, which complicate the evaluation. It is unclear if there is a decline or if the population is levelling off. This can only be determined with further data in coming years. There is, however, no evidence of any major mortality events. As such, it is difficult to determine the population trend and if the population is at carrying capacity or not. Here the population was assessed as being below TRL, but the confidence in the Population Trend evaluation is low for the Kattegat unit. In the future, should the data allow (through long time series are needed to evaluate carrying capacity and TRL), a high confidence evaluation that TRL is achieved would alter the evaluation as it would reflect the achievement of one of the key components of the indicator evaluation. In Limfjord, total abundance is low, with a slow, insignificant increase. The evidence points to approaching carrying capacity, which would, however, be at a lower level than in the beginning of 2000’s and significantly below the LRL. The confidence of the evaluation of Population trends in the Limfjord is therefore moderate since the carrying capacity of the environment and state of the subpopulation in relation to it are unclear. Confidence for Kalmarsund trend is considered moderate because it is very close to the threshold and therefore difficult to verify.
All species of marine mammals in the Baltic Sea were severely reduced in the beginning of the 20th century as a result of a coordinated international campaign to exterminate seals. Seal numbers in the Baltic Sea dropped by 80-90% over the period 1920-1945, resulting in extirpation of grey seals in the Kattegat in the 1930s (Heide-Jørgensen & Härkönen 1988) and grey seals and harbour seals along the Polish and German coasts (Harding & Härkönen 1999). Environmental contaminants in the 1960s and 1970s caused infertility in Baltic seals further reducing their numbers (Helle 1980). No evidence of these impacts were observed in Kattegat. The hunting pressure caused a rapid decline in the Kalmarsund harbour seal population with only c. 200 seals remaining in the 1960s, and c. 2,500 in Kattegat and Skagerrak in the late 1970s (Heide-Jørgensen & Härkönen 1988; Härkönen & Isakson 2011). The Kalmarsund population then entered a severe bottle-neck with surveys in the 1970s showing that only 10-20 pups were born per year. In the late 1970s early 80s the population numbered around 50 individuals. Long-term isolation and low numbers have resulted in low genetic variation in the Kalmarsund population (Härkönen et al. 2006). Hunting was prohibited in the 1960s and protected areas were formed in the 1970s which promoted population growth.
The harbour seal subpopulation in Kattegat and the Northern Great Belt experienced two dramatic mass mortality events due to Phocine Distemper Virus (PDV) epidemic when more than 50% of the population died in 1988 and about 30% in 2002 (Härkönen et al. 2006). Unusually large numbers also died in 2007, but the reason for this mortality remains unclear (Härkönen et al. 2007). In the spring of 2014, some seals appearing to show signs of pneumonia found in Sweden and Denmark, and also on the North Sea coast. Avian influenza H10N7 was isolated from a number of seals (Zohari et al. 2014). Population surveys in August 2014 showed lower numbers at all seal localities, suggesting a total mortality of approximately 10%. The Kalmarsund population has not been affected by these epidemics, illustrating that they are isolated from the Kattegat harbour seals.
Table 3. Brief summary of relevant pressures and activities with relevance to the indicator.
| General | MSFD Annex III, Table 2 | |||
| Strong link | The main pressures affecting the abundance and growth rate of Baltic seal populations include hunting, by-catches, and disturbance | Biological disturbance:
-selective extraction of species, including incidental non-target catches (e.g. by commercial and recreational fishing) |
||
| Weak link |
|
Contamination by hazardous substance:
– introduction of synthetic compounds – introduction of non-synthetic substances and compounds |
Incidental catches of seals in fisheries can have substantial effects on the population growth rates (Sipilä 2003). The current level of incidental catches of harbour seals in the HELCOM area is unknown.
Protective hunting of harbour seals has occurred in Swedish waters since the early 2000s and licence hunting was introduced in 2022, with a current quota of 730 harbour seals. No hunting is allowed for the Kalmarsund harbour seal population.
Climate change is expected to have significant impacts on the Baltic Sea ecosystem (HELCOM and Baltic Earth, 2021). Although climate change does not have a direct impact on seal abundance the environmental changes and changes in human activities associated with it will likely have widespread impacts on the Baltic Sea ecosystem, including on higher trophic levels. Such changes may influence status evaluation and also need to be reflected in management (e.g. potentially the need to be precautionary). Climate change impacts could include flooding of haul out sites, changed temperature, stratification, and altered prey distribution, quality and quantity, all of which, though difficult to current predict risk impacts on marine mammals. Being at the top of the marine food web, these predators are sensitive to changes throughout the ecosystem, and changes in food webs on which they rely (and for which our current understanding is poor) may be significant with potential changes in food availability and altered transfer of contaminants.
All management units of Harbour seals evaluated here fail to achieve good environmental status. The Kalmarsund population is far below the LRL value and population growth is below the regionally agree threshold value and the Southwestern (SW) Baltic and Kattegat population achieves the LRL parameter but not the growth rate parameter. The status of Population trend for the Kattegat and the Limfjord sub-populations is uncertain.8.1 Future work or improvements needed
Monitoring during the moulting time remains at high quality and coverage although Denmark has recently decreased the surveys from three to two replicates annually. In Sweden there is no annual monitoring during the pupping season. More data is needed to determine if the counts from 2020 and 2021 in the Kattegat are an indication of a decline or a levelling of the growth rate. Further work to review and, if needed revise, the management units and respective LRL values is required to make the evaluation more ecologically relevant.
9.1 Scale of assessment
This core indicator evaluates the population trends and abundance of seals using HELCOM assessment unit scale 2 (division of the Baltic Sea into 17 sub-basins). The assessment units are defined in the HELCOM Monitoring and Assessment Strategy Attachment 4.
The existing management plans for seals operate according to management units that are based on the distribution of seal populations. The management units typically encompass a handful of HELCOM scale 2 assessment units. Evaluations are therefore done by grouping HELCOM assessment units to align with the management units defined for each seal population. For recent development in regards to the management units of Harbour seals in the HELCOM area see section 4.3.
- Harbour seals in the Kalmarsund constitute a separate management unit and is the genetically most divergent of all harbour seal populations in Europe (Goodman 1998). It was founded about 8,000 years ago, and was close to extinction in the 1970s as a consequence of intensive hunting, and possibly also impaired reproduction (Härkönen et al. 2005). The genetic diversity is substantially reduced compared with other harbour seal populations.
- Harbour seals in the southwestern Baltic (Bornholm Basin, Arkona Basin, Bay of Mecklenburg, Kiel Bay, The Sound and the Southern part of the Great Belt subbasins) form a subpopulation which should be managed separately as this stock is genetically distinct from adjacent populations of harbour seals (Olsen et al. 2014). Multiple lines of evidence suggest that Kattegat and SW Baltic harbour seals are demographically independent, but since they are officially recognised as one unit under HELCOM, they will be evaluated in line with the assessment under HOLAS II: abundance will be evaluated using the combined abundance of the two areas, whereas trends will be evaluated for each area independently. Thus, different assessments are possible for subpopulations of the same metapopulation.
- Harbour seals in the Limfjord form the third management unit and are genetically distinct from the Kattegat harbour seals, but are influenced by migrants from the Wadden Sea (Olsen et al. 2014).
9.2 Methodology applied
This core indicator evaluates whether good status is achieved by determining the growth rate of the population as well as the population size over a specified time period. The data collected and used in this indicator are based on national aerial surveys described in Galatius et al. (2014).
Each assessment unit is evaluated against two threshold values, for population growth rate and the Limit Reference Level (LRL). The overall status of seals in each management unit only achieves good status if both threshold values are met.
Time series of data for each seal species and each management unit are used as input values in Bayesian analysis with uninformative priors, where it is evaluated whether observed data support the set threshold value. In this process, 80% support for a growth rate ≥ the threshold value is required. If the unit fails to achieve good status, the probability distribution is used to evaluate the confidence of the evaluation. The package ‘bayesm’ in the program R has been used for the analysis.
9.3 Monitoring and reporting requirements
The monitoring activities relevant to the indicator that are currently carried out by HELCOM Contracting Parties are described in the HELCOM Monitoring Manual in the Monitoring Concept Table.
Current monitoring covers all haul-out sites presently used by seals in the Baltic Sea and is considered to be sufficient to cover the needs of the indicator except for southern ringed seals. See description in the Assessment Requirements of the HELCOM Monitoring Manual.
HELCOM common monitoring relevant for the seal population trends is documented on a general level in the HELCOM Monitoring Manual under the sub-programme: Seal abundance.
HELCOM monitoring guidelines for seals were adopted in 2014 and currently all monitoring guidelines are being reviewed for inclusion in the Monitoring Manual.
The harbour seal (Phoca vitulina) is monitored at their haul-outs during their annual moulting and pupping seasons, with the aim of estimating the abundance and trends (moulting counts) and pup production (pupping counts). Harbour seals are counted on their land haulouts during moulting time.
Detailed descriptions of the survey methodology and analysis of results are given in the HELCOM monitoring manual (Guidelines for monitoring Seal abundance and distribution in the HELCOM area).
The data and resulting data products (e.g. tables, figures and maps) available on the indicator web page can be used freely given that it is used appropriately and the source is cited.
HELCOM (2023) Population trends and abundance of seals. HELCOM core indicator report. Online. [Date Viewed], [Web link]. ISSN: 2343-2543.
Result: Population trends and abundance of seals – Harbour seal
Data: Population trends and abundance of seals – Harbour seal
The national survey data is compiled annually by the HELCOM Seal Expert Group. A regional database was developed within BALSAM project and has been hosted by the HELCOM Secretariat since 2015. This database will be further developed to also enable evaluation of the Distribution of Baltic seals indicator. This new database will be harmonized with the OSPAR reporting format as a part of tasks given in the Baltic BOOST WP 1.2 by the end of 2016.
This new database will include detailed spatial information and is to be updated annually prior to HELCOM seal expert meetings. The database will be managed by the HELCOM Secretariat having responsibility for updating and storing data provided by the HELCOM Seal Expert Group.
Status assessments are to be accomplished by the Lead and co-Lead countries. The outcome of such assessments will be presented and discussed at the next HELCOM Seal Expert Group meeting.
The first compilations for the database have been completed and an intermediate version of the seal database can be accessed and downloaded as excel file.
During 2015-2016 work will continue to operationalize the database, e.g. including further parameters and metadata. The data collected and used in the indicator are based on national aerial surveys. The survey methodology is described in Galatius et al. (2014). This data covers only haul-out sites and not areas used e.g. as hunting grounds.
This indicator report for HOLAS III was prepared by Markus Ahola, Anders Galatius and Anja Carlsson.
The assessment principles, methodology and background information are largely based on the previous assessment report prepared and supported by Tero Härkönen, Anders Galatius, Morten Tange Olsen, Markus Ahola, Karin Hårding, Olle Karlsson, Mervi Kunnasranta, Lena Avellan, Petra Kääriä, Minna Pyhälä, Owen Rowe.
This version of the HELCOM core indicator report was published in April 2023:
The current version of this indicator (including as a PDF) can be found on the HELCOM indicator web page
Earlier versions of the indicator report are available:
Population trends and abundance of seals HELCOM core indicator 2018 (pdf)
Core indicator report – web-based version January 2016 (pdf)
Extended core indicator report – outcome of CORESET II project (pdf)
Extended core indicator report – outcome of CORESET II project (pdf)
Population growth rate, abundance and distribution of marine mammals 2013 (pdf)
Dietz, R., Heide-Jørgensen, M.-P., Härkönen, T. (1989) Mass deaths of harbour seals Phoca vitulina in Europe. Ambio 18(5): 258-264.
European Commission (1992) Council Directive 92/43/EEC of 21 May 1992 on the conservation of natural habitats and of wild fauna and flora (Habitats Directive). Off. J. Eur. Union 206: 7–50.
Galatius, A., Ahola, M., Härkönen, T., Jüssi, I., Jüssi, M., Karlsson, O., Verevkin, M. (2014) Guidelines for seal abundance monitoring in the HELCOM area 2014. Available at: http://helcom.fi/Documents/Action%20areas/Monitoring%20and%20assessment/Manuals%20and%20Guidelines/Guidelines%20for%20Seal%20Abundance%20Monitoring%20HELCOM%202014.pdf
Goodman, S.J. (1998) Patterns of extensive genetic differentiation and variation among European harbour seals (Phoca vitulina vitulina) revealed using microsatellite DNA polymorphisms. Molecular Biology and Evolution 15(2): 104-118.
Harding, K.C., Härkönen, T.J. (1999) Development in the Baltic grey seal (Halichoerus grypus) and ringed seal (Phoca hispida) populations during the 20th century. Ambio 28: 619-627.
Härkönen, T., Harding, K.C., Goodman, S., Johannesson, K. (2005) Colonization history of the Baltic harbour seals: Integrating archaeological, behavioural and genetic data. Marine Mammal Science 21: 695-716.
Härkönen, T., Dietz, R., Reijnders, P., Teilmann, J., Harding, K., Hall, A., Brasseur, S., Siebert, U., Goodman, S., Jepson, P., Dau Rasmussen, T., Thompson, P. (2006) A review of the 1988 and 2002 phocine distemper virus epidemics in European harbour seals. Diseases of Aquatic Organisms 68: 115-130.
Härkönen, T., Harding, K., Rasmussen, T.D., Teilmann, J., Dietz, R. (2007) Age- and Sex-specific Mortality Patterns in an Emerging Wildlife Epidemic: the Phocine Distemper in European Harbour Seals. PLoS ONE 2(9): e887. doi: 10.1371/journal.pone.0000887.
Härkonen, T., Isakson, E. (2011) Historical and current status of harbour seals in the Baltic proper. NAMMCO Scientific Publications 8: 71-76.
Heide-Jørgensen, M.-P., Härkönen, T. (1988) Rebuilding seal stocks in the Kattegat-Skagerrak. Marine Mammal Science 4(3): 231-246.
HELCOM and Baltic Earth, 2021. Climate Change in the Baltic Sea 2021 Fact Sheet.
Helle, E. (1980) Lowered reproductive capacity in female ringed seals (Pusa hispida) in the Bothnian Bay, northern Baltic Sea, with special reference to uterine occlusions. Annales Zoologica Fennici 17: 147-158.
Intersessional work report, 2022. Harbour seal management units and LRL (Population trends and abundance of seals HELCOM indicator) – overview of plans for needed work.
Liu, X., Rønhøj Schjøtt, S., Granquist, S. M., Rosing-Asvid, A., Dietz, R., Teilmann, J., Galatius, A., Cammen, K., O’Corry-Crowe, G., Harding, K., Härkönen, T., Hall, A., Carroll, E. L., Kobayashi, Y., Hammill, M., Stenson, G., Kirstine Frie, A., Lydersen, C., Kovacs, K. M., … Tange Olsen, M. (2022). Origin and expansion of the world’s most widespread pinniped: Range-wide population genomics of the harbour seal (Phoca vitulina). Molecular Ecology, 31, 1682– 1699. https://doi.org/10.1111/mec.16365
Olsen, M. T., Andersen, L. W., Dietz, R., Teilmann, J., Härkönen, T., & Siegismund, H. R. (2014). Integrating genetic data and population viability analyses for the identification of harbour seal (Phoca vitulina) populations and management units. Molecular Ecology, 23(4), 815-831. https://doi.org/10.1111/mec.12644
Olsen, M. T., Wesley Andersen, L., Dietz, R., Teilmann, J., Harkonen, T., Siegismund, H.R. (2014) Integrating genetic data and population viability analyses for the identification of harbour seal (Phoca vitulina) populations and management units. Molecular Ecology 23: 815-831
Sipilä, T. (2003) Conservation biology of Saimaa ringed seal (Phoca hispida saimensis) with reference to other European seal populations. PhD Thesis. Available at: http://ethesis.helsinki.fi/julkaisut/mat/ekolo/vk/sipila/conserva.pdf?q=phoca.
Svensson, C.J., Hansson, A., Harkonen, T., Harding, K. (2011) Detecting density dependence in growing seal populations. Ambio (2011) 40: 52–59. DOI 10.1007/s13280-010-0091-7.
Zohari, S., Neimanis, A., Härkönen, T., Moraeus, C., Valarcher, J.F. (2014) Avian influenza A(H10N7) virus involvement in mass mortality of harbour seals (Phoca vitulina) in Sweden, March through October 2014. Euro Surveill. 2014; 19(46):pii=20967. Available at: http://www.eurosurveillance.org/ViewArticle.aspx?ArticleId=20967.