 HBCDD
HBCDD
2 Relevance of the indicator
HBCDD is a persistent, bioaccumulative and toxic (PBT) compound with possible impacts on reproductive and developmental systems, including on marine biota. The main use of HBCDD is in insulation material in the building industry or as coating for textiles to improve the fire resistance of the materials. Measurements of HBCDD provide information of the contaminant load in the Baltic Sea and the presence of HBCDD in biological samples also reflects the bioavailable part of the contaminant pool. Predators (particularly top predators) and humans are exposed to the contaminant through consumption of the species assessed in this indicator.
HBCDD is a globally used chemical, widely spread in biological samples and even present in samples from remote places such as the Arctic region. The HBCDD indicator is therefore relevant for the whole Baltic Sea area and can theoretically be applied in all regions.
2.1 Ecological relevance
The commercially available brominated flame retardant hexabromocyclododecane (HBCDD or HBCD) is lipophilic, has a high affinity to particulate matter and low water solubility. The technical product consists of three stereoisomers, 70–95 % γ-HBCDD and 3–30% of α- and β-HBCDD, proportions depending on the manufacturer and the production method used. However, HBCDD is known to undergo thermal rearrangement, i.e. a shift in the relative amount of each stereoisomer can be seen if HBCDD, or a material containing HBCDD, is heated above 140°C. This has for instance been shown by Peled et al. (1995) and Heeb et al. (2010). As a result of the transformation a relative increase of α-HBCDD / relative decrease of γ-HBCDD is observed. The transformation rate is dependent on time and temperature. HBCDD in this core indicator refers to the sum of the three diastereoisomers, unless otherwise stated.
HBCDD is persistent in air and is subject to long-range transport. It is found to be widespread also in remote regions, and is found in e.g. air and biological samples in the Arctic region (de Wit et al. 2006, EFSA 2011). The low volatility of HBCDD results in significant sorption to atmospheric particulates, with the potential for subsequent removal by wet and dry deposition. The transport potential of HBCDD is considered to be dependent on the long-range transport behaviour of the atmospheric particles to which it sorbs. In a recent study of Swedish rivers covering the entire length of the Swedish coastline, HBCDD was not detected in any of the samples (Gustavsson et al. 2018) suggesting that rivers might be less of a source to the Baltic.
HBCDD has a strong potential to bioaccumulate and biomagnify. Available studies demonstrate that HBCDD is efficiently absorbed in the rodent gastro-intestinal tract. Of the three diastereoisomers constituting HBCDD, the α-form is much more bioaccumulative than the other forms. HBCDD is very toxic to aquatic organisms. In mammals, studies have shown reproductive, developmental and behavioural effects with some of the effects being trans-generational and detectable even in unexposed offspring (Eriksson et al. 2006; Viberg et al. 2006, 2007). Beside these effects, data from laboratory studies with Japanese quail and American kestrels indicate that HBCDD at environmentally relevant doses could cause eggshell thinning, reduced egg production, reduced egg quality and reduced fitness of hatchlings (Fernie et al. 2009). Recent advances in the knowledge of HBCDD-induced toxicity includes a better understanding of the potential of HBCDD to interfere with the hypothalamic-pituitary-thyroid (HPT) axis, its potential ability to disrupt normal development, to affect the central nervous system, and to induce reproductive and developmental effects.
HBCDD has been found in human blood, plasma and adipose tissue. The main sources of exposure to humans presently known is through contaminated food and dust. For breast feeding children, mothers’ milk is the main exposure route, but HBCDD exposure also occurs at early developmental stages as it is transferred across the placenta to the foetus. Swedish human breast milk data from 1980 to 2004 show that HBCDD levels have increased since HBCDD was commercially introduced as a brominated flame retardant in the 1980s (Fängström et al. 2008). Information on the human toxicity of HBCDD is to a great extent lacking, and tissue concentrations found in humans are seemingly low. However, embryos and infants are vulnerable groups that could be at risk, particularly to the observed neuroendocrine and developmental toxicity of HBCDD.
The PBT properties of HBCDD in combination of the globally extensive use means that HBCDD is considered a relevant substance to monitor in the entire Baltic Sea area. Monitoring data are available, and the substance is expected to be found in the whole area.
2.2 Policy relevance
The core indicator on HBCDD concentrations addresses the Baltic Sea Action Plan’s (BSAP 2021) hazardous substances segment’s goal of the ‘Baltic Sea unaffected by hazardous substances and litter’ and the underlying ecological objectives ‘Concentrations of hazardous substances close to natural levels’ and ‘All fish safe to eat’. There also relevance to the Biodiversity segment goal of ‘Baltic Sea ecosystem is healthy and resilient’.
The core indicator is also relevant to the following specific commitment of the BSAP 2007:
- Agree by 2009, if relevant assessments show the need, to initiate adequate measures such as the introduction of use restrictions and substitutions in the most important sectors identified by the Contracting Parties and taking as a starting point the HELCOM list of substances or substance groups of specific concern to the Baltic Sea (in which HBCDD is included).
The core indicator also addresses the following qualitative descriptors of the MSFD for determining good environmental status (European Commission 2008a), in particular being of direct relevance to Descriptor 8 and of significance for Descriptor 9 as set out under the specific Descriptors and Criteria in Commission Decision (EU) 2017/848.
HBCDD is a substance (group) on the revised Water Framework Directive (WFD) Priority Substance list. It is further identified as a Substance of Very High Concern (SVHC), meeting the criteria of a PBT (persistent, bioaccumulative and toxic) substance pursuant to Article 57(d) in the REACH (Registration, Evaluation, Authorisation and Restriction of Chemicals) regulation.
HBCDD is included in Annex XIV of the REACH regulation based on its hazardous properties, the volumes used and the likelihood of exposure to humans or the environment (European Commission 2011). This means that HBCDD cannot be used or placed on the market without first being approved by the European Chemicals Agency, ECHA. According to the harmonized classification and labelling (ATP03) approved by the European Union, this substance is suspected of damaging fertility or the unborn child and may cause harm to breast-fed children.
In December 2009, HBCDD was considered by the Executive Body (EB) of the UNECE (United Nations Economic Commission for Europe) Convention on Long-Range Transboundary Air Pollution (LRTAP) to meet the criteria for POPs, set out in EB decision 1998/2. Since 26th of November 2014, HBCDD is listed in Annex A of the Stockholm Convention, meaning that parties must take measures to eliminate the production and use of the chemical.
Table 1. Overview of key policy relevance elements.
| Baltic Sea Action Plan (BSAP) | Marine Strategy Framework Directive (MSFD) | |
| Fundamental link | Segment: Hazardous substances and litter goal
Goal: “Baltic Sea unaffected by hazardous substances and litter”
|
Descriptor 8 Concentrations of contaminants are at levels not giving rise to pollution effects.
|
| Complementary link | Segment: Biodiversity
Goal: “Baltic Sea ecosystem is healthy and resilient”
|
Descriptor 9 Contaminants in fish and other seafood for human consumption do not exceed levels established by Union legislation or other relevant standards.
(a) for contaminants listed in Regulation (EC) No 1881/2006, the maximum levels laid down in that Regulation, which are the threshold values for the purposes of this Decision; (b) for additional contaminants, not listed in Regulation (EC) No 1881/2006, threshold values, which Member States shall establish through
|
| Other relevant legislation: |
|
|
2.3 Relevance for other assessments
Concerning hazardous substances, the status of the Baltic Sea marine environment is assessed using several core contaminant indicators. Each indicator focuses on one important aspect of the complex issue. In addition to providing an indicator-based evaluation of the status of the Baltic Sea in terms of concentrations of hexabromocyclododecane (HBCDD) in the marine environment, this indicator along with the other hazardous substances core indicators is used to develop an overall integrated assessment of contamination status. This indicator along with the other hazardous substances core indicators is used to develop an overall assessment of contamination status by inclusion in the integrated assessment of hazardous substances.
3 Threshold values
Good Environmental Status (GES) in biota is achieved if the concentration of hexabromocyclododecane (HBCCD) is below the threshold value of 167 µg kg-1 fish wet weight (ww) (HBCDD EQS dossier 2011). An alternative, secondary threshold value at 170 µg kg-1 dry weight (dw) is set for concentrations in sediment but should only be used when it is not possible to evaluate an area using the primary biota-based threshold value. The technical HBCDD products consist of three stereoisomers, α-, β- and γ-HBCDD, but the EQS values are derived for the sum of these three stereoisomers. A conceptual visualisation is provided in Figure 2 and summarised in Table 2.
The threshold value is an environmental quality standard (EQS), derived at EU level as a substance included on the priority list under Directive 2008/105/EC regarding priority substances in the field of water policy (EQSD) (European Commission 2008a). Good environmental status in accordance with the MSFD is defined as ‘concentrations of contaminants at levels not giving rise to pollution effects’.
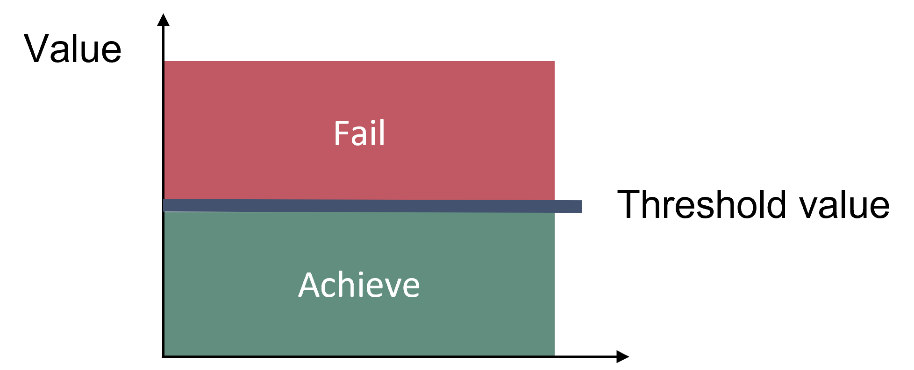
Figure 2. Good environmental status is achieved if the concentration of HBCCD is below the threshold value of 167 µg kg-1 fish wet weight. The threshold value is an environmental quality standard (EQS) derived at EU level as a substance included on the priority list under the Directive on Environmental Quality Standards.
For harmonization purposes, the EC Guidance Document No. 32 on biota monitoring (the implementation of EQSbiota) under the Water Framework Directive was developed (European Commission 2014). This guidance document recommends that for lipid soluble, biomagnifying compounds such as HBCDD the fish assessed for EQS compliance should be at a trophic level of 4.5 for marine environments with a whole body lipid content of 5%. The aim of the recommendation is to obtain comparable monitoring data. The results in the indicator have been adjusted in order to represent a lipid content of 5 % however no adjustment to a trophic level of 4.5 has been conducted.
Article 3 of the EQSD states that long-term temporal trends should also be assessed for substances that accumulate in sediment and/or biota, such as HBCDD. A trend indicates if the state of the environment is approaching the threshold value or if the state is deteriorating.
Table 2. Threshold value for the core indicator addressing HBCDD. Underlined supporting parameters represent parameters without which the indicator evaluation cannot be applied. MU = muscle, MU&EP = muscle and skin, LI = liver, CORG = Organic Carbon, Al = Aluminium, Li = Lithium. Sources for threshold values:
European Commission (2013) Directive 2013/39/EU of the European Parliament and of the Council of 12 August 2013 amending Directives 2000/60/EC and 2008/105/EC as regards priority substances in the field of water policy. Off. J. Eur. Union L 226: 1-17.
HBCDD EQS dossier 2011.pdf – CIRCABC – Europa EU.
| Indicator | Threshold value | Parameters (PARAM) / Parameter groups (PARGROUP)
(see also http://vocab.ices.dk/) |
Matrix | Species | Matrix | Basis | Supporting parameters and information |
| HBCDD | Primary threshold
EQS biota human health: 167 µg/kg ww 5% lipid content |
PARAM = (HBCD, HBCDA, HBCDB, HBCDG) | Biota | Herring & cod (open sea)
Flounder, sole, eelpout & Perch (coastal) |
MU, MU&EP, (‘fillet’), LI or whole fish | W | Lipid content |
| Secondary threshold
Sediment QS from EQS dossier 170 µg/ kg DW 5% CORG normalisation |
Sediment
(surface, ICES ’upper sediment layer – 0-X cm’) |
All | CORG
Al Li Grain size |
3.1 Setting the threshold value(s)
The EQS for HBCDD is based on the Quality Standards (QS) set for biota, to protect from secondary poisoning, defined for prey tissue, i.e. fish whole body. QSs are derived from ecotoxicological and toxicological studies to protect freshwater and marine ecosystems from potential adverse effects of chemicals, as well as protection of human health in connection with consumption of drinking water and food from aquatic environments. QSs are derived for different protection goals, i.e. pelagic and benthic communities, top-predators in these ecosystems, and human health. The most stringent of these QSs are the basis for the EQS.
An alternative secondary threshold value at 170 µg kg-1 dry weight (dw) is set for concentrations in sediment. It is a QS derived within the EQS process set to protect the marine benthic community that can be used if no biota observations are available.
The technical HBCDD products consist of three stereoisomers, α-, β- and γ-HBCDD, but the QS and EQS values are derived for the sum of these three stereoisomers. For the determination of the QS, results from toxicity studies from six mammalian and two avian studies were used with a main focus on results from an avian reproductive study on Japanese quail (HBCDD EQS dossier 2011). A reported NOEC of 5 mg/kg and an assessment factor of 30 was used to calculate the QS. More detailed information concerning the derivation of the threshold value can be found in HBCDD EQS dossier (HBCDD EQS dossier 2011).
4 Results and discussion
The results of the indicator evaluation that underlie the key message map are provided below.
4.1 Status evaluation
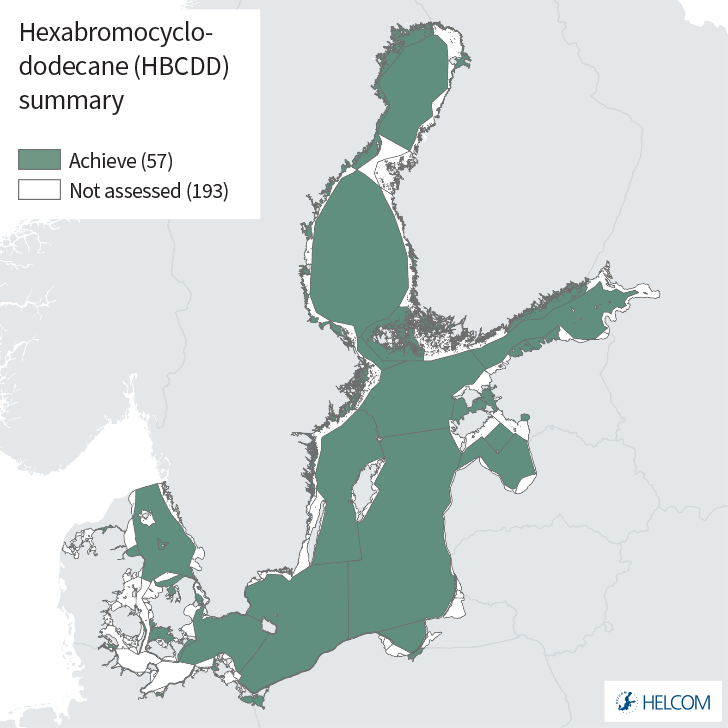
The data presented in this core indicator report were extracted from the HELCOM COMBINE data base, a compilation of data from the monitoring activities reported by all Baltic Sea countries. The report presents information on the current levels of HBCDD in biota (fish) and sediment. Overall, the status of hexabromocyclododecane (HBCDD) achieve the EQS threshold value (GES) in circa all of the evaluated assessment units (Figure 1).
HBCDD in biota
Good environmental status was achieved in terms of concentrations of hexabromocyclododecane (HBCDD) in fish in all evaluated assessment units during the period 2016-2021 as the upper confidence concentrations were below the threshold value of 167µg/kg ww (or 167ng/g ww). The evaluation of biota addresses 55 assessment units, 12 of which are open sea sub-basins (Figure 3).
The results are based on HBCDD concentrations in different fish species, but also different matrixes, i.e. muscle and liver. This brings extra variability in the results due to species differences and matrix specific properties (see discussion section).
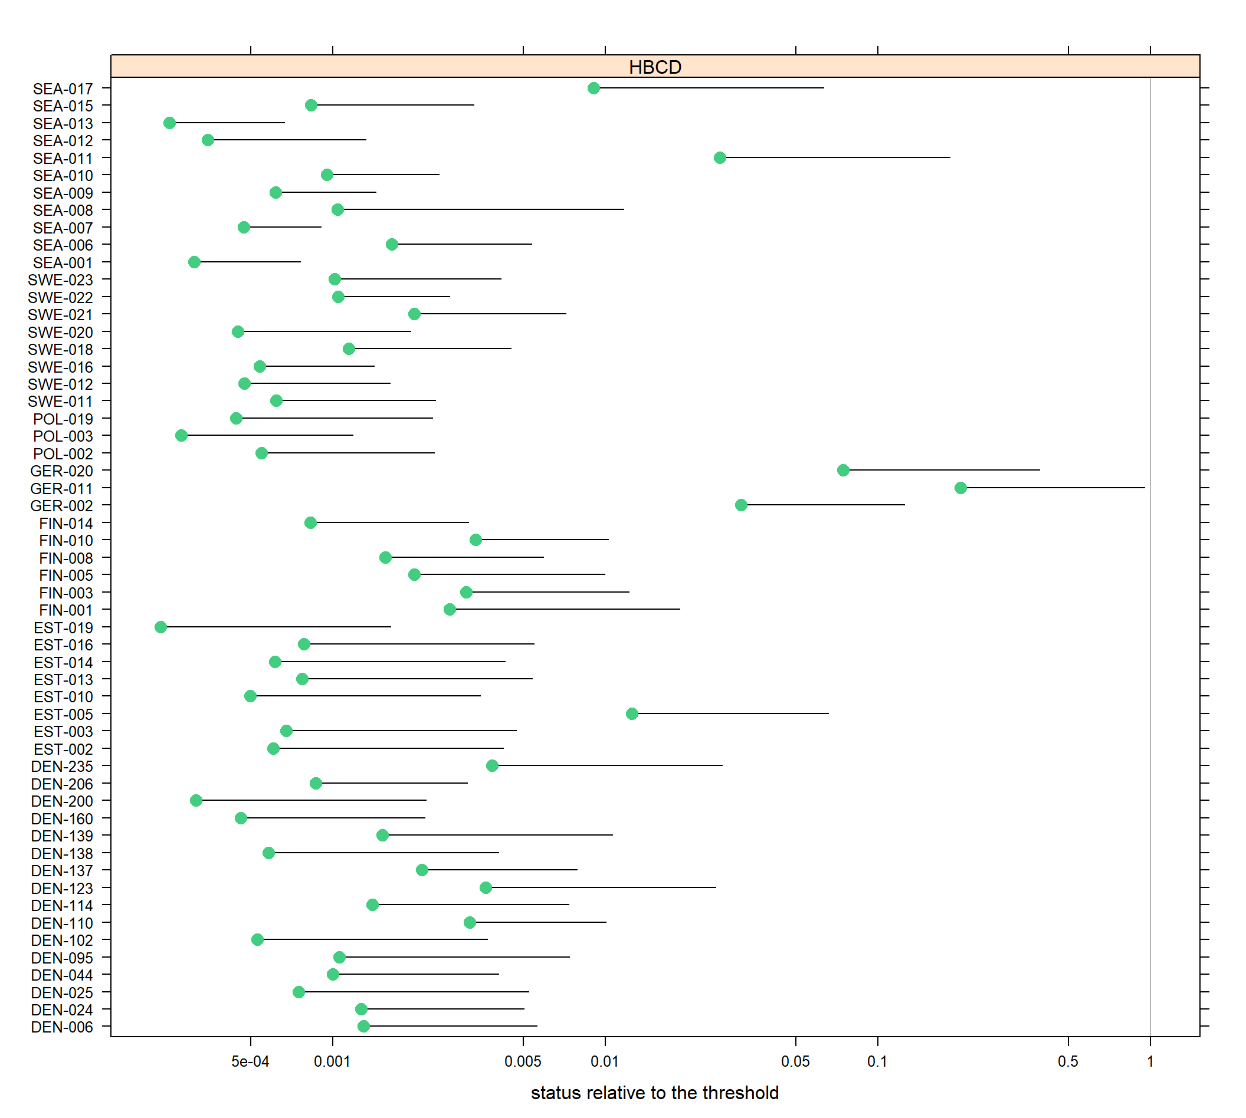
Figure 3. Concentrations of HBCDD in fish relative to the threshold value. Filled circles represent a mean value for each assessment unit and the bar represents the upper 95% confidence limit. Green colour indicates that the assessed area is below the threshold value and red colour that the assessed area is above.
There are currently smaller areas in the Baltic Sea (including open sea sub-basins) that are not covered by any HBCDD monitoring (Figure 4). There are also areas where the results are only based on measurements of 1-2 years (‘initial’ data: open circles in Figure 4). Thus, increased monitoring frequency is needed to enable a stronger and higher confidence status evaluation for the entire Baltic Sea.
The assessment unit level evaluation is built on monitoring at 82 stations, of which 30 represent ‘full’ data series (i.e. more than 3 years of data for the period; see methodology) to which distinct trends could be assigned statistically. Twenty of these stations showed downward trends (e.g. decreasing concentrations of HBCDD), and one – located in The Quark sub-basin – showed an increasing trend in HBCDD concentrations. Stations with downward trends were located in many of the Baltic Sea sub-basins; the Bornholm Basin (4), Gdansk Basin, Åland Sea, Bothnian Sea (4), Bothnian Bay (3), Kattegat (2), Northern Baltic Proper (2), Easter Gotland basin, and Western Gotland Basin (2), and all achieved the threshold value (were in GES). The other nine stations with ‘full’ data series showed no distinct trends. A single station located in The Quark area (Holmöarna) was recorded to show an increasing trend in concentrations, but still achieved the threshold value (was in GES). The remaining stations represented ‘initial’ data sets (Figure 4).
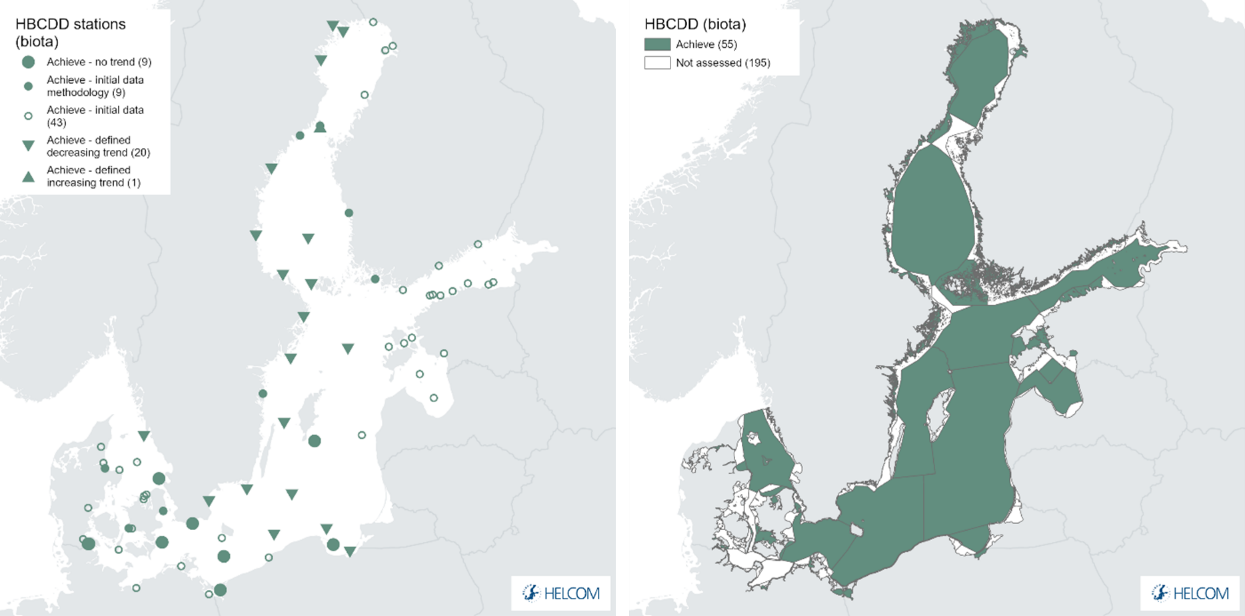
Figure 4. Spatial variation of the HBCDD sampling stations in biota (herring, cod, perch, eelpout and European flounder) (left) and status evaluation by assessment unit in biota (right). Green colour indicates that the upper 95 % confidence interval for HBCDD concentrations are below the threshold value (i.e. good environmental status). Small open circles indicate a status evaluation based on only 1-2 years of data (initial data), small filled circles indicate that data is not suitable to assess a trend (treated with initial methodology), large filled circles that no detectable concentration trends can be identified during the whole monitoring period (full data), and the filled arrow indicate that there is a statistically defined upward or downward trend during the monitoring period. See ‘data chapter’ for interactive maps and data at the HELCOM Map and Data Service.
It is important to be aware that the results used for this core indicator are mainly (but not completely) based on fish from stations considered as reference stations with no local pollution. There are most likely local areas within the Baltic Sea where the pollution load of HBCDD is higher than presented in the evaluation outcome of this indicator.
Areas such as the Gulf of Finland, Gulf of Riga, and Easter Gotland Basin are dominated by stations evaluated as ‘initial’ data series (Figure 4). Examples of different trend patterns at the station level (station time series) are presented in Figure 5 to show the difference between ‘full’ and ‘initial’ data series.
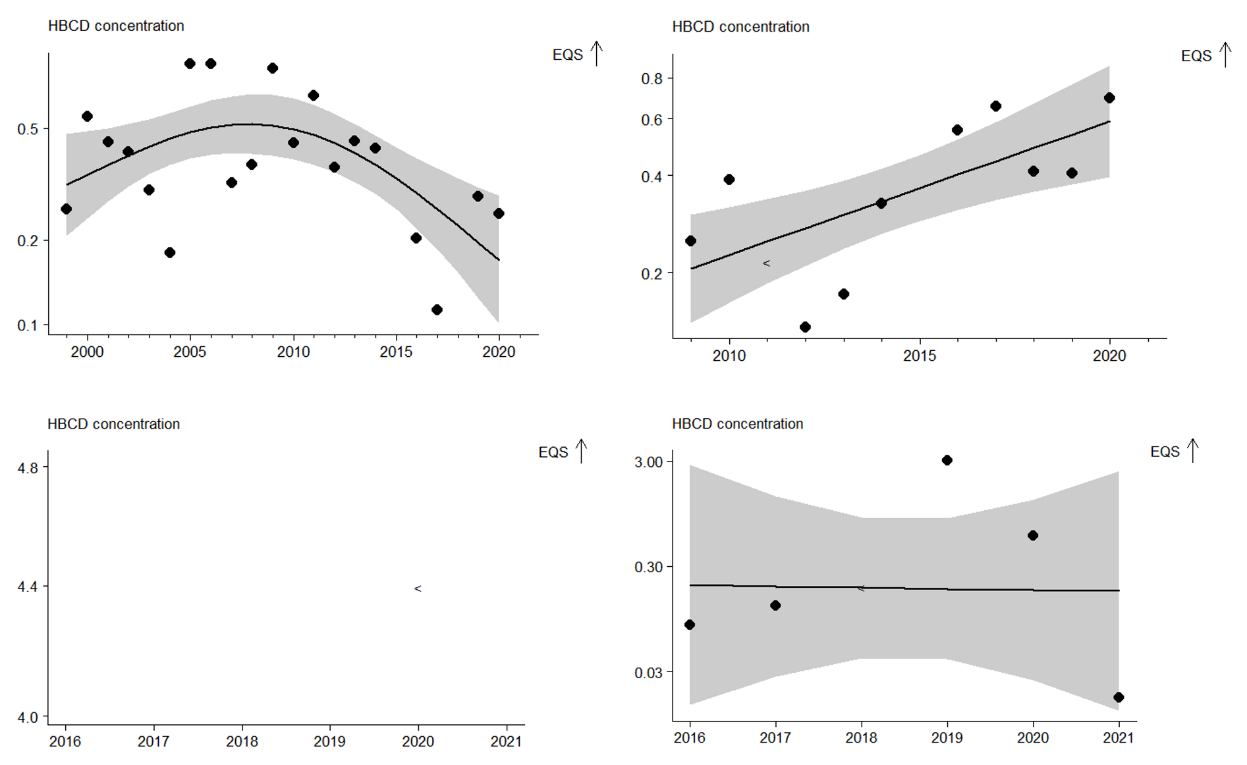
Figure 5. Examples of HBCDD concentration trends in biota from: the Bothnian Bay, Harufjärden station (top left – distinct decreasing trend – in GES, ‘full data’), The Quark, Holmöarna station (top right – distinct increasing trend – in GES, ‘full data), the Gdansk Basin, BGDA station (bottom left – no distinct trend – in GES, ‘full data’), and the Gulf of Riga, R01 station (bottom right – in GES, ‘initial data’).
HBCDD in sediment
Sweden and Finland monitor HBCDD in sediments, focussing mainly in offshore sediments (i.e. open sea sub-basins). When these results are assessed against the QS for sediment all assessment units with data show a status below the threshold, thus are in GES (Figure 6).
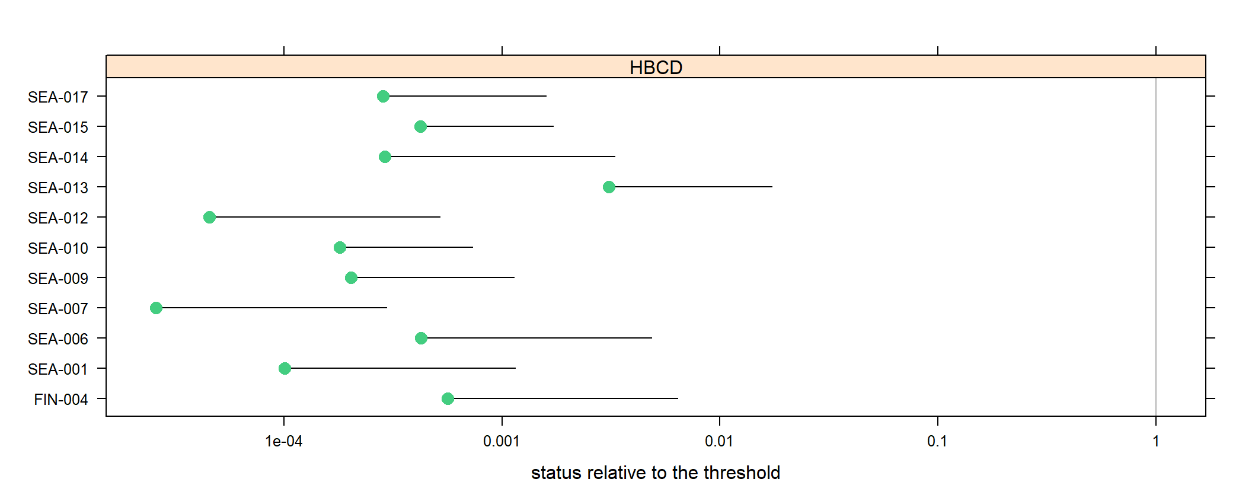
Figure 6. Concentrations of HBCDD in sediment relative to the threshold value. Filled circles represent a mean value for each assessment unit and the bar represents the upper 95% confidence limit. Green colour indicates that the assessed area is below the threshold value and red colour that the assessed area is above.
The sediment evaluations focus on open sea sub-basins and due in the main part to the monitoring structure and frequency agreed on for sediments the data are generally lower in abundance than other types of monitoring and thus handles as ‘initial’ data series (Figure 7).
The assessment unit level evaluation is built on monitoring at 18 stations, all of which are evaluated as ‘initial’ data series (i.e. 2 or less years of data for the period; see methodology). All stations achieved the threshold value and were thus in GES. Due to the methodology applied no trend evaluations are applicable.
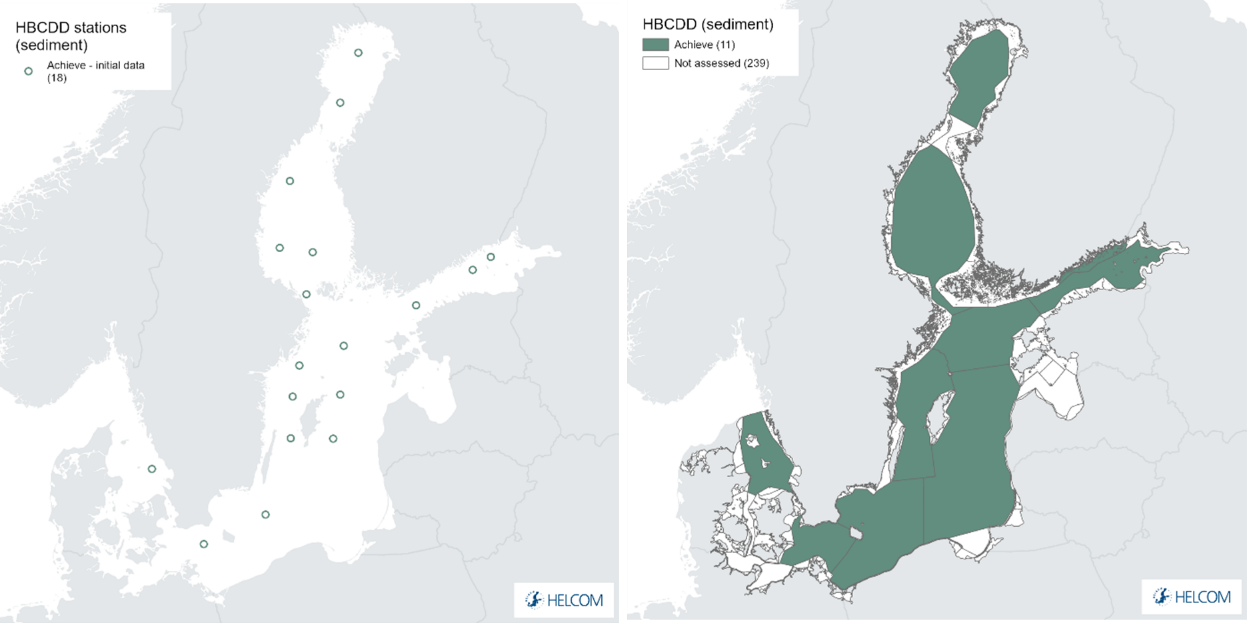
Figure 7. Status evaluation results based on secondary threshold evaluation of HBCDD in sediment. The assessment is carried out using scale 4 HELCOM assessment units (defined in the HELCOM Monitoring and Assessment Strategy Annex 4). See ‘data chapter’ for interactive maps and data at the HELCOM Map and Data Service.
4.2 Trends
Long term data from biota monitoring stations show increasing HBCDD concentrations from the 1970s and 1980s to the 2000s (Soerensen and Faxneld, 2022). Cod from south-eastern Gotland show an increase from the start of the time series in 1980, with the concentration during the peak in the 2000s being up to an order of magnitude higher. Cod from Fladen (in Kattegat) show a similar decrease from the start of the time series in the late 1990s. Concentrations have since decreased and the last 10 years herring for example show a significant decrease for 64% of 22 coastal and offshore stations within the Swedish Monitoring Programme for Contaminants in Marine Biota. At present concentrations are only a factor of two higher than 1980s levels.
Since the beginning of the 2000s, concentrations have decreased for fish across the Baltic Sea, from Kattegat to the Bothnian Bay and in both coastal and offshore sites (Figure 4 and figure 5).
4.3 Discussion
HBCDD is a persistent, bioaccumulative and toxic (PBT) compound with possible impacts on reproductive and developmental systems. Good Environmental Status (GES) is achieved in all evaluated stations and assessment units in the current assessment period and there is strong evidence from published material and also based on trends within this evaluation to show that in general concentrations (in biota) are decreasing. Although not possible currently to evaluate trends in the sediment analyses all evaluated stations and assessment units monitored for sediment also achieved GES.
Under the monitored matrix of biota the tissue utilized in the evaluation may differ, with Liver (LI), fish muscle (MU) and fish muscle and skin (MU&EP) (Figure 8). In general the data set available here is likely too small to fully evaluate the issue (especially for instances where multiple sampling matrices are applied at the same location), but based on the limited overview available there does not appear to be a separation of the data based on the different sampling matrices making the confidence in the evaluation applied higher.
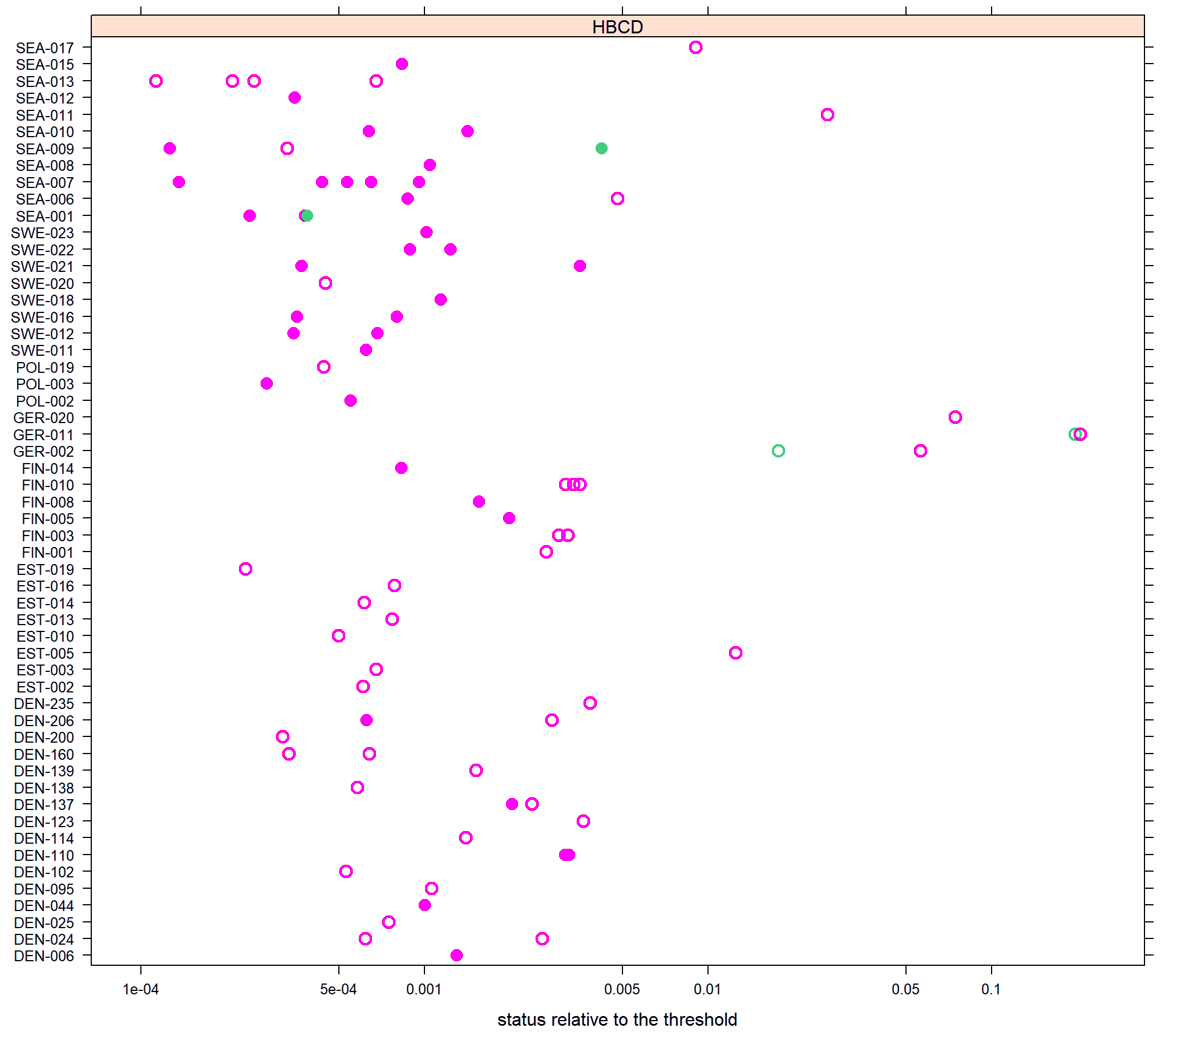 Figure 8. The same assessment unts as shown in Figure 3 are presented but each assessment unit visualises the individual stations included in making the assessment unit level status evaluation. Potential difference in evaluation outcome due to different sampling matrices do not appear to occur (though there are limited stations assessing both): Green = fish liver, and Purple = fish muscle and fish muscle+skin.
An overview of the outcomes for the open sea sub-basins is provided below (Table 3).
Table 3. Overview of evaluation outcomes and comparison with previous evaluation (using the OOAO evaluation outcomes per assessment unit). Currently this approach is only applied for open sea assessment units.
| HELCOM Assessment unit name (and ID) | Threshold value achieved/failed – HOLAS II | Threshold value achieved/failed – HOLAS 3 | Distinct trend between current and previous evaluation. | Description of outcomes, if pertinent. |
| Kattegat (SEA-001) | Achieved | Achieved | Stable, both assessment periods achieve GES. | The threshold value is achieved (in GES). Two distinct downward trends from 3 ‘full’ data stations. Also 1 ‘initial’ for sediment. |
| Great Belt (SEA-002) | Not evaluated | Not evaluated | Not evaluated | NA |
| The Sound (SEA-003) | Not evaluated | Not evaluated | Not evaluated | NA |
| Kiel Bay (SEA-004) | Not evaluated | Not evaluated | Not evaluated | NA |
| Bay of Mecklenburg (SEA-005) | Not evaluated | Not evaluated | Not evaluated | NA |
| Arkona Basin (SEA-006) | Achieved | Achieved | Stable, both assessment periods achieve GES. | The threshold value is achieved (in GES). No distinct trends from 1 ‘full’ and one ‘initial’ data station. Also 1 ‘initial’ for sediment. |
| Bornholm Basin (SEA-007) | Achieved | Achieved | Stable, both assessment periods achieve GES. Potentially improved, more downward trends. | The threshold value is achieved (in GES). Four distinct downward trends from 5 ‘full’ data stations. Also 1 ‘initial’ for sediment. |
| Gdansk Basin (SEA-008) | Achieved | Achieved | Stable, both assessment periods achieve GES. | The threshold value is achieved (in GES). One ‘full’ data station with no distinct trend. |
| Eastern Gotland Basin (SEA-009) | Achieved | Achieved | Stable, both assessment periods achieve GES. Potentially improved, more downward trends. | The threshold value is achieved (in GES). One distinct downward trends from 2 ‘full’ data stations and an ‘initial’ station. Also 2 ‘initial’ for sediment. |
| Western Gotland Basin (SEA-010) | Achieved | Achieved | Stable, both assessment periods achieve GES. Potentially improved, more downward trends. | The threshold value is achieved (in GES). Two distinct downward trends. Also 3 ‘initial’ for sediment. |
| Gulf of Riga (SEA-011) | Not evaluated | Achieved | Improved data availability allows an evaluation in the current period. | The threshold value is achieved (in GES). A single ‘initial’ data station. |
| Northern Baltic Proper (SEA-012) | Achieved | Achieved | Stable, both assessment periods achieve GES. Potentially improved, more downward trends. | The threshold value is achieved (in GES). A single ‘full’ data station showing a downward trend. Also 1 ‘initial’ for sediment. |
| Gulf of Finland (SEA-013) | Not evaluated | Achieved | Improved data availability allows an evaluation in the current period. | The threshold value is achieved (in GES). Four ‘initial’ data station. |
| Åland Sea (SEA-014) | Achieved | Achieved | Stable, both assessment periods achieve GES. | The threshold value is achieved (in GES). The evaluation is based on sediment alone. |
| Bothnian Sea (SEA-015) | Achieved | Achieved | Stable, both assessment periods achieve GES. Potentially improved, more downward trends. | The threshold value is achieved (in GES). A single ‘full’ data station with a downward trend. |
| The Quark (SEA-016) | Not evaluated | Not evaluated | NA | NA |
| Bothnian Bay (SEA-017) | Achieved | Achieved | Stable, both assessment periods achieve GES. Potentially improved, more downward trends. | The threshold value is achieved (in GES). A single ‘initial’ data station. |
5 Confidence
The overall confidence of the evaluation is generally moderate, with occasional assessment units classified as low (Figure 9 and further details in Annex 1).
The geographical resolution of the current biota dataset for the whole Baltic Sea is moderate, though low or absent in some assessment units. Monitoring in sediments generally has low spatial and temporal coverage. No detailed geographical studies to investigate the variability in HBCDD concentrations across the region have yet been carried out. However, good environmental status is widely achieved and the distance from the measured concentrations in fish to the current threshold value is large, with the smallest observations mostly a factor of 2 below the EQS.
It should also be noted that the majority of the monitoring stations are selected as reference stations and potential local problems with HBCDD may occur in areas not included in the current monitoring programmes.
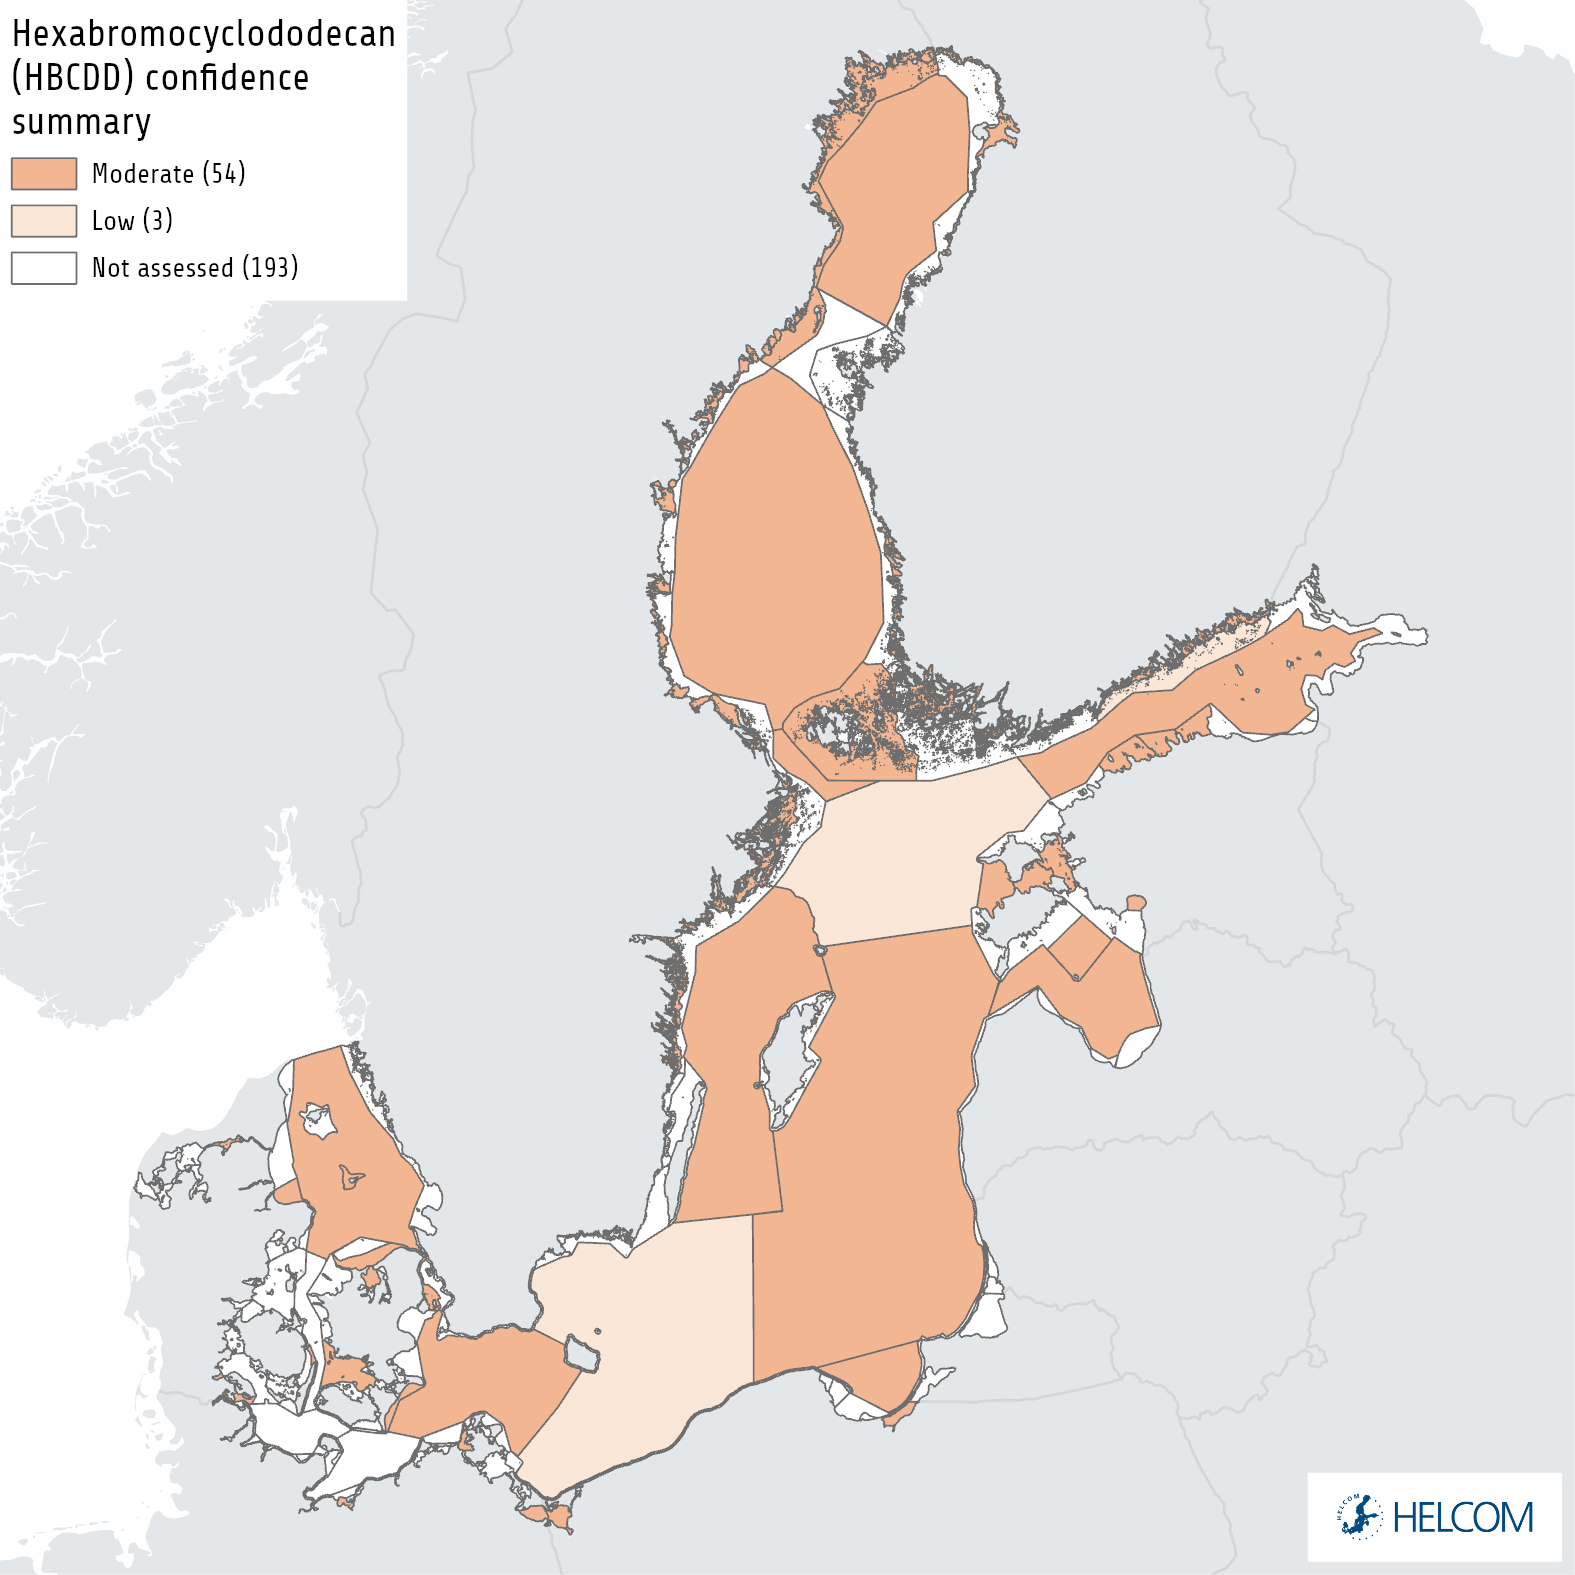
Figure 9. Map presenting the confidence in the overall evaluation based on a OOAO summary of confidence across all monitored matrices (see Annex 1). The evaluation is carried out using Level 4 HELCOM assessment units (defined in the HELCOM Monitoring and Assessment Strategy Annex 4).
6 Drivers, Activities, and Pressures
Drivers are often complex issues that are difficult to quantify, though in certain instances proxies can be utilised to express them or changes in them. A driver for example may relate to globalisation or political will and, while difficult to quantify in terms of specific relevance to an indicator, changes in drivers can catalyse changes in activities that will consequently influence pressures. A brief overview of key pressures and activities is provided in Table 4.
HBCDD is mainly used in expanded polystyrene (EPS) and extruded polystyrene (XPS) in the construction industry (as thermal insulation), as well as coating of textiles to improve their fire resistance (Marvin et al. 2011; ECB 2008; EFSA 2011). Furthermore, HBCDD is present in a number of different consumer products, mainly packaging material but also polystyrene food containers and foam boards (Rani et al. 2014). The use of HBCDD has globally been extensive and the use in EU (not counting imported articles and products containing HBCDD) was estimated to be around 12,000 tonnes in 2006 (Figure 10).
Since HBCDD is used as an additive flame retardant (i.e. not chemically bound to the material) the release of HBCDD occurs by leaching from the material to which it was added (http://chm.pops.int; EFSA 2011). There are a number of studies which identify HBCDD in different media, e.g. in air (EFSA 2011), moss – atmospheric deposition (Schlabach et al. 2002) and soil (Covaci et al. 2009). Furthermore, HBCDD has been shown to be taken up by plants (Li et al. 2011). Covaci et al. (2006) concludes that α-HBCDD is the most commonly occurring diastereoisomer in wildlife.
Estimated emissions within the EU from HBCDD production and handling, associated with micronizing (fine grade grinding) of HBCDD has been about 3 kg per year. The estimated release of particles during usage of EPS and XPS has been estimated to 100 g per tonne EPS and 5 g per tonne XPS. This amounts to an estimated release of approximately 560 kg HBCDD per year (of which 530 kg and 30 kg are from the use of EPS and XPS, respectively, assuming a use of 3% HBCDD in both EPS and XPS) in the past. This can be compared to a total estimated release of around 3000 kg per year in the EU, including all known sources (ECHA, 2009).
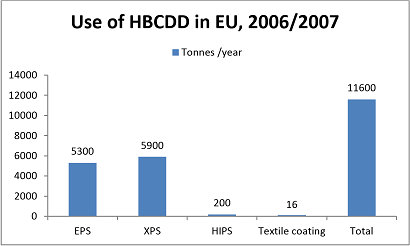
Figure 10: The use of HBCDD in the EU during the years 2006–2007 expressed in tonnes per year. EPS = Expanded polystyrene, XPS = Extruded polystyrene and HIPS = High impact polystyrene, minor sources are not shown as bars. Adapted from ECHA 2009.
It is noted, that most of the construction industry products will become demolition waste at the end of their life (several decades), which may considerably affect releases in the future.
The estimated degradation and persistence of HBCDD differs somewhat depending on type of test and experimental setup, but some studies have identified debrominated transformation products, and a shorter half-life was observed in anaerobic compared to aerobic conditions (EFSA 2011). In vitro experiments have shown that mammalian hepatic microsomes can debrominate HBCDD and that γ-HBCDD is metabolized faster than α-HBCDD (MacInnis et al. 2010).
Table 4. Brief summary of relevant pressures and activities with relevance to the indicator.
| | General | MSFD Annex III, Table 2a |
| Strong link | Use of synthetic compounds to increase fire resistance of materials. Waste treatment. | Substances, energy and litter- Input of other substances (e.g. synthetic substances, non-synthetic substances, radionuclides) – diffuse sources, point sources, atmospheric deposition, acute events |
| Weak link |
7 Climate change and other factors
Precipitation are predicted to increase as a result of climate change in especially the northern Baltic (HELCOM 2021). Due to the low volatility, HBCDD sorbs to, and is transported associated with, atmospheric particulates, followed by subsequent removal by wet and dry deposition. Atmospheric inputs of HBCDD are the most important source to the Baltic Sea. Climate induced increase in precipitation could therefore increase the load of HBCDD to the Baltic Sea. Climate induced increases in sediment transport in coastal areas (Helcom, 2021) could also result in that HBCDD buried in past decades during a time when inputs where higher than today is reintroduced into active layers of the sediment. This could expose benthic organisms to higher HBCDD concentrations in some areas than expected based on future atmospheric deposition.
The oxygen state of, and type of microorganism in, the Baltic Sea sediments will likely affect the biodegradation of HBCDD as a ten times shorter half-life has been observed in anaerobic compared to aerobic sediments (Davis et al. 2005). The future development of sediment and deep-water oxygen conditions are predicted to mainly depend on the nutrient load scenario rather than climate change but oxygen conditions are suggested to improve (HELCOM 2021). Such an improvement could lead to a longer lifetime of HBCDD in sediments. An increase in temperature (as predicted for the Baltic Sea – see text below) could also decrease the half-life, and thereby increase the removal through biodegradation, of HBCDD. In an experiment recreating realistic Baltic Sea shallow coastal systems temperature was shown to positively affect (decrease) the HBCDD concentration in water, sediment and food-web most likely due to an increase in degradation (Bradshaw et al. 2015).
The Baltic Sea average surface-water temperature has increased by around +0.6°C/decade for 1990-2018 (Siegel and Gerth 2019). A further increase in surface water-temperature is one of the most certain future consequences of climate change in the Baltic Sea (HELCOM 2021). The increase in surface-water temperature is likely to have a direct effect on fish body growth, recruitment, and mortality. Increases in growth rate (already a factor today across monitoring data covering a wide range of average temperature from the northern to the southern Baltic Sea; Soerensen and Faxneld 2022) can affect the biomagnification through increased growth dilution. The effects from changes in recruitment and mortality are less straightforward but is part of the indirect climate impact on the overall ecosystem and food web dynamics. The sum of direct climate change parameters (temperature, radiation, salinity, river discharge, precipitation, wind etc) will affect the oxygen content, microbial communities and food web dynamics (stocks and species; HELCOM 2021). Changes in living conditions and food web structure will likely change the flow of HBCDD through the food web, which will likely affect the overall biomagnification. However, more work is needed to understand if climate induced food web changes will lead to an increase or decrease in concentrations in top predators.
8 Conclusions
Overall, the concentrations of HBCDD achieve Good Environmental Status (GES) in all assessment units (and all monitoring matrices) evaluated for biota or sediment. In general there are downward (decreasing concentration) trends in a number of Baltic Sea sub-basins and an increasing number of these downward trends since the previous assessment period was evaluated.
8.1 Future work or improvements needed
The recommended trophic level for contaminant evaluation is 4.5 (European Commission, 2014). For this evaluation, no adjustment for trophic level was done. A uniform approach where all observations are normalised to the same trophic level should be considered for future evaluations. As the food web in the Baltic Sea is usually relative short (trophic level: herring ~3-4, cod ~4-5, white tailed sea eagle ~4) a lower trophic level than 4.5 (representing one trophic level below top predators) could be considered for evaluation in the Baltic Sea if the focus is on overall good environmental status.
As described in the section on optimal monitoring, not all basins are currently monitored and a better spatial coverage should therefore be considered. However, as the status of HBCDD is in general good and trends are overall decreasing it should also be considered whether more systematic monitoring is needed or if focus should instead be shifted to new emerging contaminants. A more detailed study to explore the compatibility between monitoring matrices may be valuable, should data allow. It may also be valuable to explore improved statistical analyses in sediments to explore the possibility to handle lower frequency data and still explore trends, especially across longer periods. Similarly, improvements in the confidence evaluation may also be relevant to explore to better account for such intricacies.
It may be valuable to explore if other fish species are appropriate to add to the evaluation (e.g. roach, bream) and if these offer a spatial distribution or comparable aspect that would improve the spatial coverage and confidence of the indicator in the future.
9 Methodology
9.1 Scale of assessment
The core indicator evaluates the status with regard to concentration of HBCDD using HELCOM assessment unit scale 4 (division of the Baltic Sea into 17 sub-basins and further division into coastal and offshore areas and division of the coastal areas by WFD water types or water bodies). This division is applied in order to take into account the different routes by which HBCDD enters the Baltic Sea – via air and via run-off from land, including also potential point sources.
The assessment units are defined in the HELCOM Monitoring and Assessment Strategy Annex 4.
9.2 Methodology applied
Data processing
The data may require transformation into the relevant unit and base for the threshold value which is µg kg-1 ww. Ideally, all data should be expressed as normalized values in the same matrix. For the purpose of this indicator, this is dictated by the EQS and should therefore be whole body concentrations in fish (ww) at a trophic level of 4.5 with a lipid content of 5%.
The majority of the HBCDD data reported is analysed in muscle tissue. However, the EC Guidance Document No 32 (European Commission 2014) suggests that the assumption can be made that fat soluble compounds will be evenly distributed in the lipid within the whole organism. With this assumption, it is possible to calculate a whole body concentration from any analysed organ as long as the lipid content in the sample is known/analysed. To harmonize the evaluation across the entire Baltic Sea region, it is recommended to convert the concentrations into a values for a fish with a general fat content of 5%.
Data is to be normalised to lipid content according to the following equation, where Concnorm, lipid is lipid normalised ww concentration, Concmeasurement is the original value expressed in ww and lipid contentsample is the actual lipid content of the sample:
 In case information on lipid content is not included in the data, general fat content values derived in regional studies for the sampled matrix can be applied.
The EC guidance document (European Commission 2014) recommends making recalculations so the concentrations are standardized to a fish at a trophic level of 4.5 for marine ecosystems to standardise for the biomagnification effect. Such an adjustment has not been conducted for this evaluation.
For sediments, the contaminant concentrations are normalized prior to the evaluation to account for changes in the bulk physical composition of the sediment such as organic carbon content (5% normalization).
Statistical evaluation
The assessment protocol is structured in three main parts, 1) changes in log concentrations over time are modelled, 2) check for compliance against threshold value and evidence for temporal change of contaminant concentration per station and 3) a spatial aggregation of status per assessment unit.
It should be noted that the assessment protocol makes the assumption that monitoring data stems from the same monitoring stations during consecutive years. The stations used by the protocol are defined in the ICES Station Dictionary. Stations with similar station name are grouped together, but it is also possible to define a group of stations with different names to be defined as the same station in the Station Dictionary. Usually a station is defined in the Station Dictionary with coordinates and a valid box around these coordinates, but coordinates outside of the box will only give a warning when reporting the data, and are not used in the actual data extraction.
Overview
Time series of contaminant concentrations are assessed in three stages:
- The concentrations are log transformed and changes in the log concentrations over time are modelled using linear mixed models. The type of temporal change that is considered depends on the number of years of data:
-
- 1-2 years: no model is fitted because there are insufficient data (‘initial’ data)
- 3-4 years: concentrations are assumed to be stable over time and the mean log concentration is estimated
- 5-6 years: a linear trend in log concentration is fitted
- 7+ years: more complex (smooth) patterns of change over time are modelled
-
- The fitted models are used to assess status against available threshold value and evidence of temporal change in contaminant levels in the last twenty years
- The fitted models are also used for spatial aggregation to assess status against available threshold value and evidence of temporal change in contaminant levels on a scale 4 level HELCOM assessment unit.
These stages are described in more detail in the link below. There is also information on how the methodology is adapted when there are ‘less-than’ measurements (treated as ‘initial’ data), i.e. some concentrations are reported as below the detection limit, and missing uncertainties, i.e. the analytical variability associated with some of the concentration measurements was not reported.
Assessment methodology for contaminants in biota, sediment and water
All initial data is handled in a highly precautionary manner to further ensure that the risk of false positives is minimalised. For all initial data the 95% confidence limit on the mean concentration, based on the uncertainty seen in longer time series throughout the HELCOM area, is used. Applying a precautionary approach, the 90% quantile (psi value, Ψ) of the uncertainty estimates in the longer time series from the entire HELCOM region are used. The same approach is used for time series with three or more years of data, but which are dominated by less-than values (i.e. no parametric model can be fitted). The mean concentration in the last monitoring year (meanLY) is obtained by: restricting the time series to the period 2016-2021 (the last six monitoring years), calculating the median log concentration in each year (treating ‘less-than’ values as if they were above the limit of detection), calculating the mean of the median log concentrations, and then back-transforming (by exponentiating) to the concentration scale. The upper one-sided 95% confidence limit (clLY) is then given by:
 where n is the number of years with data in the period 2016-2021 (HELCOM 2018).
9.3 Monitoring and reporting requirements
Monitoring methodology
Environmental monitoring of hexabromocyclododecane (HBCDD) in biota is currently not coordinated in the HELCOM community, implying that national guidelines are applied in the sampling as documented in the monitoring concepts table in the HELCOM Monitoring Manual under the sub-programme: Contaminants in biota.
So far, there are no technical guidelines related to HBCDD monitoring in biota in the HELCOM Monitoring Manual and there is a need to develop such common monitoring guidelines.
Current monitoring
The monitoring activities relevant to the indicator that are currently carried out by HELCOM Contracting Parties are described in the HELCOM Monitoring Manual in the relevant Monitoring Concept Table.
Sub-programme: Contaminants in biota
Presently, only Denmark, Poland and Sweden have permanent monitoring of HBCDD in biota. Estonia has include HBCDD analysis in biota in coastal areas from 2019. Germany monitors HBCDD in biota on a project basis, national water monitoring is under development and sediment monitoring is in a planning phase. Finland and Lithuania have results from a few years and are planning to include the substance in their national monitoring programmes. Latvia has only screening data and there is no information from Russia.
Description of optimal monitoring
The performance of existing monitoring should be evaluated in relation to the monitoring objectives, but first there is a need to quantify these objectives. These quantitative objectives need to be specified for each kind of monitoring, e.g. temporal trend-, incident-, geographical (spatial)- and compliance monitoring. For example, for temporal trend monitoring: what statistical power is required, during what time period should a certain trend be possible to detect and with what specified power (with certain one-or two-tailed statistical tests at a specified significant level)? With these definitions at hand it is possible to estimate e.g. required sample sizes and sampling frequencies. It can be shown that for a monitoring period of 12 years or shorter, generally the power to detect trends will decrease substantially if the sampling is carried out every second or every third year compared to annual sampling. For geographical studies the required spatial resolution should be determined. For compliance monitoring, it is imperative to know the distance to target levels (and variance) before sample sizes are estimated.
Time series of HBCDD concentrations in fish are missing or too short to enable evaluation for several sub-basins in the Baltic Sea region. Also biological variables, possible confounding factors (e.g. age, fat content) are often missing (not reported) disabling means to make samples comparable between areas and over time. The geographical resolution is generally too poor to make reliable generalized maps from interpolation of the existing stations using Krieging. No serious attempts to study patterns of variation in fish (coastal- offshore) through variograms have been made that could give guidance to the uncertainty and to the distance between sites required to achieve required confidence in generalized maps.
10 Data
The data and resulting data products (e.g. tables, figures and maps) available on the indicator web page can be used freely given that it is used appropriately and the source is cited.
Result: Hexabromocyclododecane (HBCDD) in biota
Result: Hexabromocyclododecane (HBCDD) in sediment
Data: Hazardous substances in biota
Data: Hazardous substances in sediment
The data used in the evaluation is based on HELCOM COMBINE data reported by Contracting Parties as part of regular environmental monitoring activities. The data was extracted in accordance with the HELCOM core indicator extraction table, which specifies the matrix and metadata required.
11 Contributors
Anne L. Soerensen, Swedish Museum of Natural History and Emmi Vähä, Finnish Environment Institute
Rob Fryer, Marine Scotland (OSPAR).
HELCOM Expert Network on Hazardous Substances.
HELCOM Secretariat: Owen Rowe, Deborah Shinoda, Joni Kaitaranta, Jana Wolf and Jannica Haldin.
12 Archive
This version of the HELCOM core indicator report was published in April 2023:
The current version of this indicator (including as a PDF) can be found on the HELCOM indicator web page.
Earlier versions of this report can be found below:
Hexabromocyclododecane HBCDD HELCOM core indicator 2018 (pdf)
13 References
Bradshaw, C., A. Strid, H. von Stedingk, K. Gustafsson (2015) Effects of benthos, temperature, and dose on the fate of Hexabromocyclododecane in experimental coastal ecosystems, Environmental Toxicology and Chemistry 34(6), 1246-1257
Covaci, A., Gerecke, A.C., Law, R.J., Voorspoels, S., Kohler, M., Heeb, N.V., Leslie, H., Allchin, C.R., de Boer, J. (2006) Hexabromocyclododecanes (HBCDs) in the environment and humans: A review. Environmental Science and Technology 40: 3679-3688.
Covaci, A., Roosens, L., Dirtu, A.C., Waegeneers, N., van Overmeire, I., Neels, H., Goeyens, L. (2009) Brominated flame retardants in Belgian home-produced eggs: Levels and contamination sources. Science of the Total Environment 407: 4387-4396.
Davis, J.W., S. Gonsior, G. Marty, J. Ariano (2005) The transformation of hexabromocyclododecane in aerobic and anaerobic soils and aquatic sediments, Water Research 39, 1075-1084
de Wit, C.A., Alaee, M., Muir, D.C.G. (2006) Levels and trends of brominated flame retardants in the Arctic. Chemosphere 64: 209-233.
ECB (European Chemicals Bureau) (2008) Risk assessment. Hexabromocyclododecane. CAS-No25637-99-4. EINECS-No.: 247-148-4. Final report May 2008.
ECHA (European Chemicals Agency) (2009) Data on manufacture, import, export, uses and releases of HBCDD as well as information on potential alternatives to its use. Available at: http://echa.europa.eu/documents/10162/13640/tech_rep_hbcdd_en.pdf
EFSA (European Food Safety Authority) (2011) Scientific Opinion on Hexabromocyclododecanes (HBCDDs) in Food. European Food Safety Authority, Parma, Italy.
Eriksson, P., Fischer, C., Wallin, M., Jakobsson, E., Fredriksson, A. (2006) Impaired behavior, learning and memory, in adult mice neonatally exposed to hexabromocyclodecane (HBCDD). Environmental Toxicology and Pharmacology 21: 317–322.
European Commission (2008a) Directive 2008/105/EC of the European Parliament and the Council on environmental quality standards in the field of water policy (Directive on Environmental Quality Standards). Off. J. Eur. Union L 348.
European Commission (2011) Commission Regulation (EU) No 143/2011 of 17 February 2011 amending Annex XIV to Regulation (EC) No 1907/2006 of the European Parliament and of the Council on the Registration, Evaluation, Authorisation and Restriction of Chemicals (REACH). Off. J. Eur. Union L 44.
European Commission (2014) Common Implementation Strategy for the Water Framework Directive (2000/60/EC) – Guidance Document No. 32 on Biota Monitoring (the Implementation of EQSbiota) under the Water Framework Directive. Technical Report – 2014 – 083.
Fernie, K.J., Shutt, L.J., Letcher, R.J., Ritchie, I.J., Bird, D.M. (2009) Environmentally relevant concentrations of DE-71 and HBCD alter eggshell thickness and reproductive success of American kestrels. Environ. Sci. Technol. 43: 2124–2130.
Fängström, B., Athanassiadis, I., Odsjö, T., Norén, K., Bergman, A. (2008) Temporal trends of polybrominated diphenyl ethers and hexabromocyclododecane in milk from Stockholm mothers, 1980-2004. Molecular Nutrition & Food Research 52: 187-193.
Gustavsson, J., K. Wiberg, E. Ribeli, M.A. Nguyen, S. Josefsson, L. Ahrens (2018) Screening of organic flame retardants in Swedish river water, Science of the Total Environment, 625, 1046-1055
HBCDD EQS dossier (2011) HEXABROMOCYCLODODECANE (HBCDD) [Online]. Supporting background documents 2012 Priority Substances proposal – EQS dossiers: The European Commission. Available at: https://circabc.europa.eu/faces/jsp/extension/wai/navigation/container.jsp.
Heeb, N.V., Graf, H., Schweizer, W.B., Lienemann, P. (2010) Thermally-induced transformation of hexabromocyclo dodecanes and isobutoxypenta bromocyclododecanes in flame-proofed polystyrene materials. Chemosphere 80: 701-708.
HELCOM (2021) Climate Change in the Baltic Sea Fact Sheet 2021. Available at: https://helcom.fi/baltic-sea-climate-change-fact-sheet-new-publication-shows-latest-scientific-knowledge-on-climate-change-in-the-baltic-sea/
Li, Y., Zhou, Q., Wang, Y., Xie, X. (2011) Fate of tetrabromobisphenol A and hexabromocyclododecane brominated flame retardants in soil and uptake by plants. Chemosphere 82: 204-209.
MacInnis, G., Letcher, R., McKinney, M., Tomy, G., Lebeuf, M., Fång, J., Bergman, Å., Marvin, C. (2010). Investigation of HBCD metabolism in marine mammals from Canada using a hepatic microsomal in vitro bioassay approach and comparison with fild samples. Dioxin San Antonio, TX, USA: Organohalogen compounds.
Marvin, C.H., Tomy, G.T., Armitage, J.M., Arnot, J.A., McCarty, L., Covaci, A., Palace, v. (2011). Hexabromocyclododecane: Current Understanding of Chemistry, Environmental Fate and Toxicology and Implications for Global Management. Environmental Science and Technology.
Peled, M., Scharia, R., Sondack, D. (1995) Thermal rearrangement of hexabromocyclododecane (HBCD). Advances in Organobromine Chemistry Ii 7: 92-99.
Rani M., Shim, W.J., Han, G.M., Jang, M., Song, Y.K., Hong, S.H. (2014) Hexabromocyclododecane in polystyrene based consumer products: An evidence of unregulated use. Chemosphere 110: 111–119.
Schlabach, M., Mariussen, E., Borgen, A., Dye, C., Enge, E.-K., Steinnes, E., Green, N., Mohn, H. (2002) Kartlegging av bromerte flammehemmere og klorerte parafiner. (In Norwegian). Norsk institutt for luftforskning (NILU), Kjeller, Norway. Rapport 62/2002, 71 pp. Available at: http://www.klif.no/publikasjoner/overvaking/1924/ta1924.pdf
Siegel, H., M. Gerth, (2019) Sea Surface Temperature in the Baltic Sea 2018. 7pp. Available at: https://helcom.fi/wp-content/uploads/2020/07/BSEFS-Sea-Surface-Temperature-in-the-Baltic-Sea-2018.pdf
Soerensen A.L., S. Faxneld (2022) Graphic and statistical overview of temporal trends and spatial variations within the Swedish National Monitoring Programme for Contaminants in Marine Biota (until 2020 year’s data), report 5:2022, Swedish Museum of Natural History, Stockholm, Sweden
Viberg, H., Johansson, N., Fredriksson, A., Eriksson, J., Marsh, G., Eriksson, P. (2006) Neonatal exposure to higher brominated diphenyl ether, impairs spontaneous behavior and learning and memory functions of adult mice. Toxicological Sciences 92: 211–218.
Viberg, H., Fredriksson, A., Eriksson, P. (2007) Changes in spontaneous behavior and altered response to nicotine in the adult rat, after neonatal exposure to the brominated flame retardant, decabrominated diphenyl ether (PBDE 209). Neurotoxicology 28: 136–142.
14 Other relevant resources
Bignert, A., Göthberg, A., Jensen, S., Litzén, K., Odsjö, T., Olsson, M., Reutergårdh, L. (1993) The Need for Adequate Biological Sampling in Ecotoxicological Investigations – a Retrospective Study of 20 Years Pollution Monitoring. Science of the Total Environment 128: 121-139.
Bignert, A., Danielsson, S., Nyberg, E. (2011) Hexabromocyclododecane (HBCD) concentrations in herring muscle and Guillemot egg. HELCOM Indicator Fact Sheet 2011.
Danielsson, S., E. Nyberg, J. Mannio (2018) Hexabromocyclododecane (HBCD), Helcom core indicator report.
ECHA (European Chemicals Agency) (2010) Opinion proposing harmonised classification and labelling at Community level of Hexabromocyclododecane (HBCDD). Committee for Risk Assessment, ECHA/RAC/CLH-O-0000001050-94-03/F.
European Commission (2000) Directive 2000/60/EC of the European Parliament and of the Council of 23 October 2000 establishing a framework for Community action in the field of water policy. Off. J. Eur. Union L 327.
European Commission (2006) Commission Regulation (EC) No 1881/2006 of 19 December 2006 setting maximum levels for certain contaminants in foodstuffs. Off. J. Eur. Union L364.
European Commission (2008b) Directive 2008/56/EC of the European Parliament and the Council establishing a framework for community action in the field of marine environmental policy (Marine Strategy Framework Directive). Off. J. Eur. Union L 164: 19-40.
European Commission (2010) Commission Decision of 1 September 2010 on criteria and methodological standards on good environmental status of marine waters (2010/477/EU). Off. J. Eur. Union L232: 12-24.
European Commission (2013) Directive 2013/39/EU of the European Parliament and of the Council of 12 August 2013 amending Directives 2000/60/EC and 2008/105/EC as regards priority substances in the field of water policy. Off. J. Eur. Union L 226: 1-17.
EU-RAR (2006) European Union Risk assessment on hexabromocyclododecane. Draft October 2006. European Union Risk assessment report 58. 356 pp. European Chemicals Bureau.
Gilbert, R.O. (1987) Statistical methods for environmental pollution monitoring. Van Nostrand Reinhold Co., New York, x. 320 pp.
Grimås, U., Göthberg, A., Notter, M., Olsson, M., Reutergårdh, L. (1985) Fat Amount – a Factor to Consider in Monitoring Studies of Heavy-Metals in Cod Liver. Ambio 14: 175-178.
HELCOM (2010) Hazardous substances in the Baltic Sea – An integrated thematic assessment of hazardous substances in the Baltic Sea. Balt. Sea Environ. Proc. No. 120B.
Helsel, D.R., Hirsch, R.M. (1992a). Statistical methods in water resources. Studies in environmental science. Elsevier, Amsterdam, New York, USA, xvi. 522 pp.
Helsel, D.R., Hirsch, R.M. (1992b) (page 212) Statistical methods in water resources. Studies in environmental science. Elsevier, Amsterdam, New York, USA.
ICES (1995) Report of the ICES/HELCOM Workshop on Temporal Trend Assessment of Data on Contaminants in Biota from the Baltic Sea, ICES CM 1995/ENV:10, Ref E. International Council for the Exploration of the Sea.
Loftis, J.C., Ward, R.C., Phillips, R.D. (1989) An Evaluation of Trend Detection Techniques for Use in Water Quality Monitoring Programs. In: Developement OoRa (Hrsg.). U.S. Environmental Protection Agency. 139 pp.
Nicholson, M.D., Fryer, R.J., Larsen, J.R. (1998) Temporal trend monitoring: Robust method for analysing contaminant trend monitoring data. ICES Techniques in Marine Environmental Sciences 20. ICES, Copenhagen, Denmark. 29 pp.
Annex 1 Assessment unit level confidence summary
Confidence is evaluated per assessment unit based on a relative evaluation of following parameters for the copper indicator: 1) spatial component, 2) temporal component, 3) methodological component, and 4) the evaluation component. Despite the common approach applied with other indicators the information set out here is not directly comparable as it only focusses on an evaluation within each indicator (i.e. is relative only between the evaluated assessment units for copper) and it furthermore only addresses the evaluated units. More general information related to overarching confidence and required improvements are detailed in the main report.
The confidence for each component was applies based on a categorical approach using high, moderate and low. To achieve the overall summary confidence a score of 0.25 was applied to low, 0.5 to moderate and 1.0 to high with an average value calculated across the components and the same scores used to then select he final overall category.
Spatial component: Open sea and coastal areas were treated separately due to the scale of sea area being vastly different. The area (km2) for each evaluated assessment unit was divided by the total number of stations in the assessment unit and the resulting area per station was used to divide into three categories, roughly interpreted as stations addressing small, medium or large areas. If a large number (relatively) of stations were still available despite the area being large an increase of 1 category was applied.
Temporal component: The presence of ‘full’ and/or ‘initial’ data series was utilised to evaluate this. Where only a single initial data series/station was present a category of low was applied, where two initial data series were available a category of moderate was applied, where a single full data series was present a category of moderate was applied, and where two or more full data series were present a category of high was applied.
Methodological component: A score of high is applied to all evaluated assessment units since the indicator is evaluated using the MIME tool and applies a regionally agreed methodology and threshold values on national monitoring data.
Evaluation component: The standard error generated within the MIME assessment tool is utilised as a proxy for this component. In simple terms the basis of this evaluation is that standard error can be roughly equated to a coefficient of variance. This therefore provides a general confidence evaluation of the underlying data and variation within it. A categorical approach was applied where standard error values >0.70 were scored as low, 0.4-0.7 were scored as moderate and <0.4 were scored as high.
The confidence is provided for biota below (Annex 1 – Tables 1-2).
The overall confidence for the OOAO status evaluation is also generated using a OOAO approach from these tables below, suing the overall category.
Annex 1 – Table 1. Summary table showing categorical confidence per component and overall for HBCDD in biota.
| Assessment Unit | Spatial | Temporal | Methodological | Evaluation | Overall |
| DEN-006 | High | Moderate | High | Low | Moderate |
| DEN-024 | High | Moderate | High | Low | Moderate |
| DEN-025 | High | Low | High | Low | Moderate |
| DEN-044 | High | Moderate | High | Low | Moderate |
| DEN-095 | High | Low | High | Low | Moderate |
| DEN-102 | High | Low | High | Low | Moderate |
| DEN-110 | High | High | High | Moderate | Moderate |
| DEN-114 | High | Low | High | Low | Moderate |
| DEN-123 | High | Low | High | Low | Moderate |
| DEN-137 | High | High | High | Low | Moderate |
| DEN-138 | High | Low | High | Low | Moderate |
| DEN-139 | High | Low | High | Low | Moderate |
| DEN-160 | High | Moderate | High | Low | Moderate |
| DEN-200 | High | Low | High | Low | Moderate |
| DEN-206 | High | High | High | Low | Moderate |
| DEN-235 | High | Moderate | High | Low | Moderate |
| EST-002 | High | Low | High | Low | Moderate |
| EST-003 | High | Low | High | Low | Moderate |
| EST-005 | High | Low | High | Low | Moderate |
| EST-010 | Moderate | Low | High | Low | Moderate |
| EST-013 | High | Low | High | Low | Moderate |
| EST-014 | High | Low | High | Low | Moderate |
| EST-016 | High | Low | High | Low | Moderate |
| EST-019 | Moderate | Low | High | Low | Moderate |
| FIN-001 | Moderate | Low | High | Low | Moderate |
| FIN-003 | High | Moderate | High | Low | Moderate |
| FIN-005 | Moderate | Moderate | High | Low | Moderate |
| FIN-008 | High | Moderate | High | Low | Moderate |
| FIN-010 | High | Moderate | High | Moderate | Moderate |
| FIN-014 | Low | Moderate | High | Low | Moderate |
| GER-002 | High | Moderate | High | Low | Moderate |
| GER-011 | High | Moderate | High | Low | Moderate |
| GER-020 | High | Low | High | Low | Moderate |
| POL-002 | High | High | High | Low | Moderate |
| POL-003 | High | High | High | Low | Moderate |
| POL-019 | High | Low | High | Low | Moderate |
| SWE-011 | Low | High | High | Low | Moderate |
| SWE-012 | High | High | High | Low | Moderate |
| SWE-016 | High | High | High | Moderate | Moderate |
| SWE-018 | Moderate | Moderate | High | Low | Moderate |
| SWE-020 | High | Low | High | Low | Moderate |
| SWE-021 | High | High | High | Low | Moderate |
| SWE-022 | High | High | High | Low | Moderate |
| SWE-023 | Low | Moderate | High | Low | Moderate |
| SEA-001 | High | High | High | Moderate | Moderate |
| SEA-006 | High | High | High | Moderate | Moderate |
| SEA-007 | High | High | High | High | High |
| SEA-008 | High | Moderate | High | Low | Moderate |
| SEA-009 | Moderate | High | High | Moderate | Moderate |
| SEA-010 | Moderate | High | High | Moderate | Moderate |
| SEA-011 | High | Low | High | Low | Moderate |
| SEA-012 | Low | Moderate | High | Low | Moderate |
| SEA-013 | High | Moderate | High | Moderate | Moderate |
| SEA-015 | Low | Moderate | High | Moderate | Moderate |
| SEA-017 | Moderate | Low | High | Low | Moderate |
Annex 1 – Table 2. Summary table showing categorical confidence per component and overall for HBCDD in sediment.
| Assessment Unit | Spatial | Temporal | Methodological | Evaluation | Overall |
| FIN-004 | Low | Low | High | Low | Low |
| SEA-001 | Moderate | Low | High | Low | Moderate |
| SEA-006 | Moderate | Low | High | Low | Moderate |
| SEA-007 | Low | Low | High | Low | Low |
| SEA-009 | Low | Moderate | High | Low | Moderate |
| SEA-010 | High | Moderate | High | Low | Moderate |
| SEA-012 | Low | Low | High | Low | Low |
| SEA-013 | High | Moderate | High | Low | Moderate |
| SEA-014 | High | Low | High | Low | Moderate |
| SEA-015 | Moderate | Moderate | High | Low | Moderate |
| SEA-017 | Moderate | Moderate | High | Low | Moderate |