 Impulsive sounds
2 Relevance of the indicator
To date, a wide range of marine species are known to be adversely affected by impulsive anthropogenic underwater noise. Many marine animals rely on underwater sound for orientation, communication, navigation and/or prey capture. These animals in particular have sensitive auditory systems. It has been demonstrated that intense noise impacts can cause a broad spectrum of effects. Effects of loud impulsive sound ranges from behavioural effects (deterrence, disturbance) over impact on auditory systems (temporary and permanent hearing loss) to physiological injury and in extreme cases death.
Sound waves propagate efficiently in water, which means that loud sources without noise mitigation measures may have far-reaching effects, up to tens of kilometers from the source. The most significant man-made sources of loud impulsive noise are explosions, pile driving, seismic explorations and low frequency sonars. Although noise does not persist in the environment, it may harm marine species if no measures are taken in order to mitigate adverse effects.
Not all individual, intense impulsive noise activities are subject of national environmental impact assessments (EIA) processes, making it relevant to assess their impact via the regional HELCOM noise registry and if necessary, indicate the need for taking appropriate measures.
2.1 Ecological relevance
Elevated levels of underwater sound may affect aquatic animals, with impacts including masking of other sounds, behavioural disturbance and physiological changes (hearing loss, discomfort, injury to the auditory system). In extreme cases, where animals are close to very loud sources (in particular underwater explosions), the consequences can be tissue damage and death (CBD, 2012; Schack et al, 2016, De Backer et al., 2017).
Fish species are able to detect sounds within the frequency range of the most widely occurring anthropogenic sounds (Popper, 2003). However, most of the published studies on the effects of underwater noise on fish rely on investigations that are not standardised and thus not comparable (Popper & Hawkins, 2019). Moreover, the acoustic metrics (terminology) used in the fish studies differ in a way that makes results difficult to understand, compare and use for setting environmental targets.
However, some scientific papers suggest that fish species such as perch (Perca fluviatilis), carp (Cyprinus carpio), sea bass (Dicentrarchus labrax) and others, due to anthropogenic continuous or impulsive noise, experience elevated levels of cortisol hormone in blood, which is a primary indicator of stress response regardless their hearing sensitivities (Wysocki et al., 2006; Santully et al., 1999).
Possible effects of underwater noise on invertebrates are also not possible to quantify although some indications from studies are available. At present, both data on spatial and temporal occurrence and abundance as well as on possible effects of underwater noise in the field are lacking.
Marine mammals have very good underwater hearing abilities and rely extensively on sound for their orientation, communication and foraging. However, it is important to point out the different hearing abilities and characteristics of marine mammals found in the Baltic Sea region, especially differences between pinniped species and phocoenidae species. A clear distinction is found in hearing abilities of these two species groups. Cetaceans encompass in their hearing system “sigmoidal process” which makes them highly specialized in hearing as echolocating species underwater. The pinniped species employ “regular” hearing as humans, and it is understood these species hear underwater through “bone conduction” as these species also spend appreciable time on ice or land (Au & Hastings, 2008).
There is a large body of experimental evidence for behavioural reactions to loud impulsive noise, in particular for harbour porpoises (e.g. Madsen et al., 2006; Brandt et al., 2009; Tougaard et al., 2009; Tougaard et al., 2012; Dähne et al., 2013), but also harbour seals (e.g. Jacobs and Terhune, 2002; Gordon et al., 2015; Kastelein et al., 2015c). Temporary and permanent damage to the auditory system (TTS and PTS, respectively) has also been well documented in these two species, as well as others (Lucke et al., 2009, Finneran, 2015). Masking has been well documented in captivity, but due to methodological challenges remains to be quantified under natural conditions. Masking occurs when a sound in the environment (i.e. noise) interferes with the ability of a receiver (in this case the marine mammal) to recognize a sound of interest (e.g. communication signals of a conspecific, echoes from prey) (Erbe et al., 2016)). Erbe et al. ,(2016) reviewed the process of masking as well as challenges regarding the quantification and investigation of masking processes in the wild.
Impulsive noise input from unmitigated pile driving activities for example has been shown to induce avoidance reactions and thus disturbance to harbour porpoises at a distance of 25 km (Dähne et al., 2013).
Most recent studies based on field acoustical data showed that effective noise mitigation measures applied during pile driving activities reduce the effect radius for onset of biological response to 12 km, while significant effects (disturbance of harbour porpoise associated with habitat avoidance) are reduced down to 7,5 km from the source (Dähne et al., 2017, Brandt et al., 2018, Rose et al., 2019).
Furthermore, disturbance due to acoustic harassment devices, like seal scarers often used in aquaculture but also in pile driving activities have also the potential to disturb harbour porpoises and lead to habitat avoidance at distances of more than 7 km from the source (Brandt et al., 2013).
A recent study during a wind farm installation off southeast England using GPS/global system for mobile communication tags on 23 harbor seals that provided distribution and activity data revealed that the closest range of individual seals to piling varied from 6,65 to 46,1 km. Furthermore, the maximum predicted received levels (RLs) at individual seals varied between 146,9 and 169,4 dB re 1 μPa peak to peak (Russell et al., 2016).
A summary table on the effects of impulsive sound on marine organisms is presented below (Table 1).
Table 1: Summary table on the effects of impulsive sound on marine organisms.
| Sound source | Affected group | Effect | References |
|---|---|---|---|
| Explosions | Porpoises Harbour seals Grey seals Ringed seals | Blast injury at distances of few km, depending on charge size, TTS and PTS up to several km | Yelverton et al., 1973; Ketten, 1995, von Benda Beckmann et al 2015, Siebert et al., 2021 |
| Fish | Blast injury at distances of up to 1-2 km, depending on charge size and fish, hearing injury at several km, death and injury on larvae and eggs up to a few hundred meters, the scale of effect depends on the presence of swim bladder or not | Yelverton et al., 1975, Wright 1982, Govoni et al., 2003,
2008, Popper et al., 2014 |
|
| Sonars (<10 kHz) | Porpoises | TTS induced by exposure to various sonar signals in captivity | Kastelein et al., 2013a; Kastelein et al., 2014; Kastelein et al., 2015b |
| Startle and other behavioural reactions induced in porpoises by exposure to helicopter dipping sonar sounds | Kastelein et al., 2012; Kastelein et al., 2013b | ||
| Fish | The few published studies show mixed results of injuries and no injury to high levels of sonar pulses | Hastings et al., 1996; McCauley et al 2003, Jörgensen et al 2005; Popper et al., 2007; Kane et al., 2010 | |
| The few published studies show mixed results to < 10 kHz sonar signals | Jörgensen et al., 2005; Doksæter et al., 2012 | ||
| Pile driving | Porpoises | TTS induced after 1 h of exposure to pile driving noise at a cumulated SEL of 180 dB re. 1 uP2s | Kastelein et al., 2015a |
| Short term avoidance (hours to days) at distances 20-30 km from pile driving sites | Tougaard et al., 2009; Brandt et al., 2011; Dähne et al., 2013 | ||
| Noise Mitigation During Pile Driving Efficiently Reduces Disturbance of Marine Mammals | Nehls et al., 2016, Dähne et al., 2017, Brandt et al., 2018, Rose et al., 2019 | ||
| Offshore Test Site alpha ventus, Marine Mammals, Final report from baseline to wind farm operation. Study based on monitoring data for the wind farm alpha ventus | Rose et al., 2014 | ||
| Effects of Offshore pile driving on harbour porpoise abundance in the German Bight – Assessment of Noise Effects | Brandt et al., 2016 |
| Sound source | Affected group | Effect | References |
|---|---|---|---|
| Pile driving | Seals | Avoidance of wind farm during pile driving seen up to 25 km away | Russell et al., 2016 |
| Fish | Injuries to organs after thousands of pile strikes in laboratory conditions and very close (<100 m) from a pile driving operation, however, some studies found no mortality in the field, the scale of the effect depends on the presence of swim bladder or not | Caltrans 2004; Nedwell et al., 2007; Halvorsen et al., 2012a, b; Casper et al., 2012, 2013; Bolle et al., 2012; Debusschere et al., 2014 | |
| Real pile driving and play back studies show reactions up to several km away | Nedwell et al., 2007; Mueller- Blenke et al., 2010; Hawkins et al., 2014 | ||
| Seismic surveys | Porpoises | TTS induced by exposure to single air gun pulse at 164 dB re. 1 uPa2s | Lucke et al., 2009 |
| Short-term avoidance (<10 days) from area where 2-D seismic survey was conducted | Thompson et al., 2013 | ||
| Reactions of porpoises 10-15 km from a large 3D seismic array in the North Sea | Sarnocińska et al., 2020 | ||
| Fish | Injury to larvae and egg very close to source, impact on hearing close to source (<1 km). The scale of effect depends on the presence of swim bladder or not | Knutsen and Dalen 1985; Popper et al., 2005 | |
| Large scale voidance up to tens of km) by fish from the area where surveys were conducted, startle responses to impulsive tones in the laboratory | Engås et al., 1996; Wardle et al., 2001; Slotte et al., 2004; Kastelein et al., 2008; Lokkeborg et al., 2012 | ||
| Seal scarers | Porpoises | Avoidance at ranges of several km | Johnston, 2002; Olesiuk et al., 2002; Brandt et al., 2013; review by Hermannsen et al., 2015, Findlay et al., 2021 |
| Harbour seals | Avoidance and reactions at ranges up to about 1 km | Gordon et al., 2015; review by Mikkelsen et al., 2015 | |
| Fish | See effects from sonar | See effects from sonar |
2.2 Policy relevance
Marine biodiversity is to be protected and prevented from any kind of pollution (UNCLOS, 1982). Although underwater noise is not a ‘substance’ but a form of ‘energy’, it is still considered as pollutant (cf. UNCLOS, 1982; and MSFD, 2008), in line with for example chemical pollutants.
Concern about pollution by underwater noise and its effects on marine life was raised in the 1970’s (e.g. Payne and Webb, 1971; reviewed by Richardson et al., 1995) and received renewed political attention when a link between navy sonars and whale strandings was established in the late 1990’s (Frantzis, 1998; Evans and England, 2001). In parallel with this, the development of plans for an extensive expansion of renewable energy, in particular offshore wind, into coastal areas raised concerns about the possible impact of underwater noise (Madsen et al., 2006). These and other events were key factors in the gradual realisation that underwater noise was and is one of the significant human impacts on in particular marine mammals, and especially because cetaceans are included in annex 4 of the European Habitats Directive, this led to the inclusion of noise in the evaluation of the impact assessments for offshore activities and prompted national regulatory actions.
In 2009, ASCOBANS (Agreement on the Conservation of Small Cetaceans of the Baltic and the North Sea) adopted a Resolution on Adverse Effects of Underwater Noise on Marine Mammals during Offshore Construction Activities for Renewable Energy Production. Impulsive noise is in focus when within this Agreement guidelines from the perspective of marine mammal protection in connection with underwater noise were developed. A couple of years later (2011) a Resolution at UNEP level was adopted to protect cetaceans together with other migratory species. Moreover, the Jastarnia Plan for the protection of harbor porpoise in the Baltic Proper was adopted by ASCOBANS in 2010 and revised in 2016. In 2012, the Conservation Plan for the population in the Kattegat, the Belt Seas, the Sound and the Western Baltic (WBBK) was adopted.
The harbor porpoise population of the Baltic Proper is considered critically endangered according to the IUCN Red list.
At EU level the Fauna Flora Habitat (FFH)-Directive (art. 12) does not allow to induce injury or death to strictly protected species of Annex IV, to which all whale species belong to.
Furthermore, the EU MSFD identifies noise as a significant pressure to the marine environment and gives guidance on how to proceed evaluating the Good Environmental Status for both indicators under descriptor 11 on underwater noise.
Moreover, the European Commission Guidance Document on Wind Energy Developments and Natura 2000 refers to potential impacts of wind farms on marine animals due to marine noise pollution. The guidance lists the effects of wind farms of potential relevance for marine mammals which include intense noise during piling – driving, drilling and dredging operations (EU, 2011, 2021).
In HELCOM, noise was not highlighted as a specific segment in the 2007 Baltic Sea Action Plan (BSAP), however consecutive HELCOM Ministerial Declarations have highlighted noise as a pressure on the marine environment. Thus, the HELCOM Ministerial Meeting 2013 agreed that:
- the level of ambient and the distribution of impulsive sounds in the Baltic Sea should not have a negative impact on marine life;
- human activities that are assessed to result in negative impacts on marine life should be carried out only if relevant mitigation measures are in place.
Accordingly, the 2013 Ministerial Meeting agreed that as soon as possible and by the end of 2016, using mainly already on-going activities, to:
- establish a set of indicators including technical standards which may be used for monitoring ambient and impulsive underwater noise in the Baltic Sea;
- encourage research on the cause and effects of underwater noise on biota;
- map the levels of ambient underwater noise across the Baltic Sea;
- set up a register of the occurrence of impulsive sounds;
- consider regular monitoring on ambient and impulsive underwater noise as well as possible options for mitigation measures related to noise taking into account the ongoing work in IMO on non- mandatory draft guidelines for reducing underwater noise from commercial ships and in CBD context.
In 2016, the Regional Baltic Underwater Noise Roadmap 2015-2017 was adopted (Annex 3 of the Outcome of HELCOM 37-2016) aiming at making every effort to prepare a knowledge base towards a regional action plan on underwater noise in 2017/2018 to meet the objectives of the 2013 Ministerial Meeting, and of the EU MSFD for HELCOM countries being EU members states.
In 2021, HELCOM Recommendation 42-43/1 on the HELCOM Regional Action Plan on Underwater Noise was adopted, with the aim to implement the actions included in the Action Plan, where such actions have scientific justification and taking into account socioeconomic impacts, having the scope to define and achieve good environmental status of the Baltic Sea. Moreover, the BSAP was updated in 2021, being the strategic programme of measures and actions for achieving a good environmental status in the Baltic Sea, includes both ecological and managerial objectives on underwater noise, and a set of actions to achieve these objectives, identifying the Action Plan as the main tool for that purpose
Table 2. Policy relevance of this specific HELCOM indicator.
| Baltic Sea Action Plan (BSAP) | Marine Strategy Framework Directive (MSFD) | |
| Fundamental link | Goal: Environmentally sustainable sea-based activities.
Ecological objective: No or minimal harm to marine life from man-made noise. Management objective: Minimize noise to levels that do not adversely affect marine life. |
Descriptor 11 Introduction of energy, including underwater noise, is at levels that do not adversely affect the marine environment.
|
| Complementary link | Natural distribution, occurrence and quality of habitats and associated communities
Marine life is healthy |
|
| Other relevant legislation: | United Nations Convention on the Law of the Sea (UNCLOS, 1982), Convention on Biological Diversity (Decision XI/18 A). Council Directive 92 /43 /EEC of 21 May 1992 on the conservation of natural habitats and of wild fauna and flora (Habitats Directive, 1992).
UN Sustainable Development Goal 14 (Conserve and sustainably use the oceans, seas and marine resources for sustainable development) is most clearly relevant, though SDG 12 (Ensure sustainable consumption and production patterns) and 13 (Take urgent action to combat climate change and its impacts) also have relevance. |
|
2.3 Relevance for other assessments
Underwater noise is just one of the anthropogenic pressures on the marine environment and should thus be considered in an overarching assessment of status of marine mammals and potentially other animal groups when determining GES on a regional basis. The current assessment reflects the first full evaluation of impulsive noise in the HELCOM region and will be included in the HOLAS 3 Thematic Assessment on Pollution as well as reflected in the HOLAS 3 summary report where its relevance will be included in combination with other key issues.
3 Threshold values
No threshold values are currently in place as no regionally agreed and approved threshold value has been adopted. The information set out in this report utilises the agreed methodologies discussed both in HELCOM (EG Noise) and within the EU for MSFD processes (i.e., adoption by the Marine Strategy Coordination Group, MSCG). No official evaluation is therefore possible at the current time as threshold values are not approved, however a preliminary evaluation is provided utilising the latest EU level proposal available at this point. The pre-core indicator is still to be developed in a range of aspects in alignment with EU processes and taking into account regional specificities.
3.1 Setting the threshold value
The methodology for the indicator assessment and the assessment threshold value setting for HOLAS3 has been described by EG Noise (see document 4J-76 to STATE & CONSERVATION 14-2021 for further details). It was proposed that the assessment should allow for a transparent evaluation of the pressure in terms of the spatial distribution, temporal extent and levels of low- and mid-frequency anthropogenic impulsive noise, as well as pay special attention to the evaluation of biologically significant periods and relevant habitats. Suitable thresholds should be defined such that they may be clearly linked to values that represent levels at which species, identified as sensitive to underwater noise, are not adversely affected.
The quantitative evaluation of assessment results for this indicator utilises the agreed methodologies discussed in HELCOM (EG Noise) and information and preliminary results from the ongoing development of assessment methodologies and MSFD threshold values at EU level (i.e. TG Noise and WG GES). At the time of the assessment of this indicator, the concept of the proposed threshold values under consideration for approval at EU-level has been formulated to be based on the evaluation of the temporal and spatial proportion of habitats that are impacted and affected by underwater sound. However, the quantitative threshold values had not been agreed upon. For this reason, the indicator lead proposes to discuss indicator results of this assessment in the light of a proposed interim threshold value of a daily fraction of exposed area of 10% of the Baltic Sea, in agreement with the threshold concept under discussion at EU level during the practical assessment for this report and with the range of quantitative threshold values under consideration for adoption at EU level by the end of finalizing this report.
The basis of the proposed threshold values is the evaluation of the temporal and spatial proportion of habitats that are impacted and affected by underwater sound. A dual threshold is currently proposed to address short-term and long-term exposure to impulsive noise, where short-term exposure is set to 1 day and long-term exposure is set to 1 year. The specific proposal is as follows:
- a maximum fraction of 20% or lower over 1 day of the habitat of an indicator species to be exposed to impulsive noise levels higher than a species specific level of biological relevance (LOBE: Level of Onset of Biological adverse Effects);
- a maximum of 10% or lower over 1 year on average of the habitat of an indicator species to be exposed to impulsive noise levels higher than a species specific level of biological relevance.
Regional or local specificities and indicator species shall be taken into account when determining the exact threshold value by Regional Sea Conventions. The relevant habitats for the marine unit under consideration are to be defined in conjunction with the selection of associated indicator species at regional level.
4 Results and discussion
4.1 General overview of spatial and temporal pressure distribution in the HELCOM area.
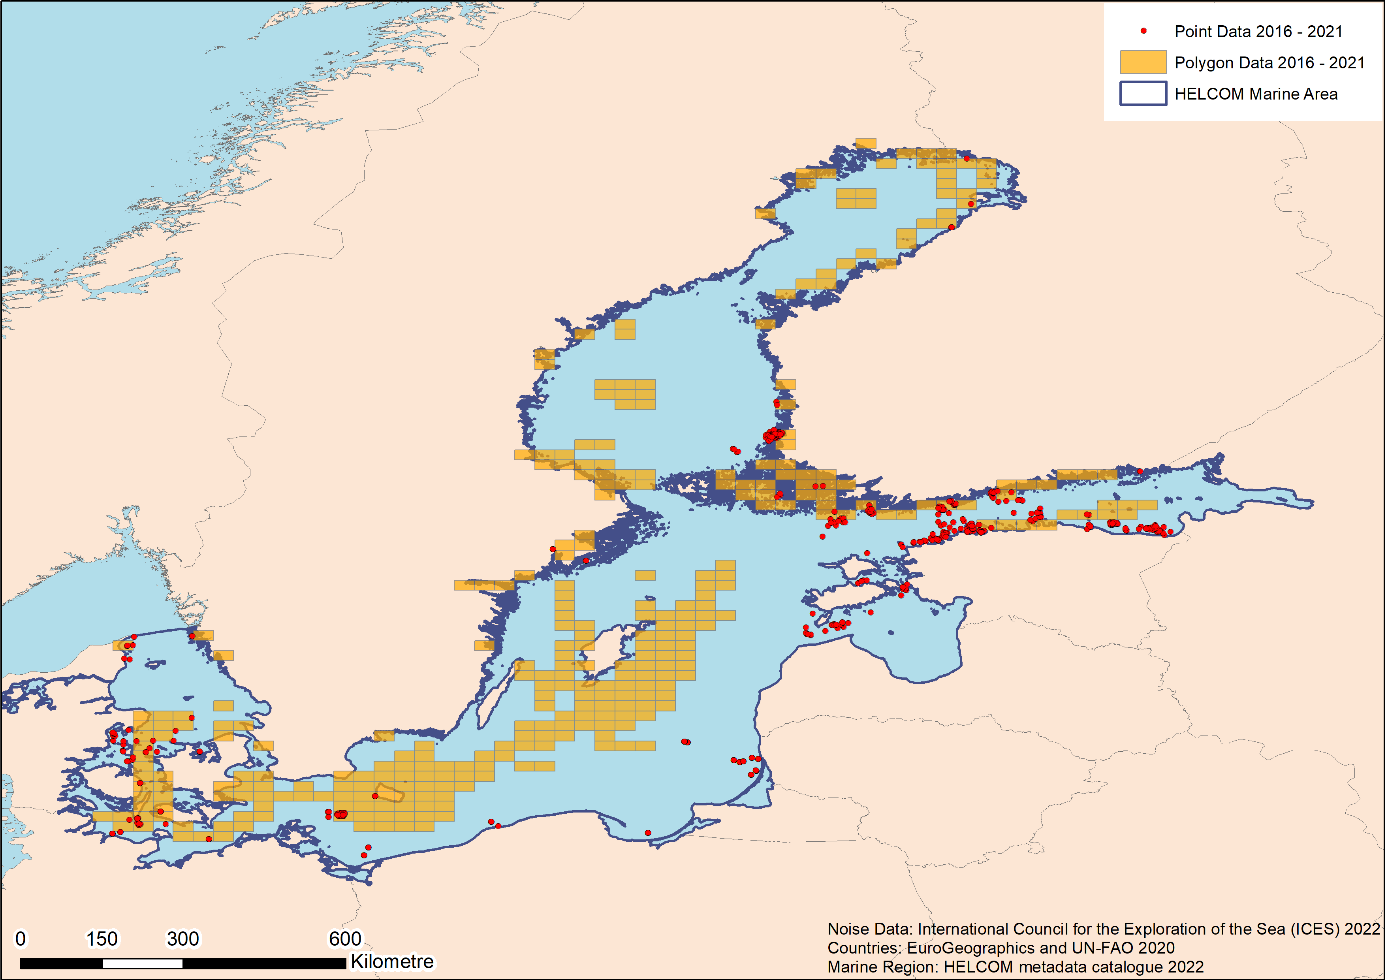
Fig. 1: Overview of impulsive noise activities in 2016 – 2021 reported for the HELCOM area (data source: HELCOM noise registry hosted by ICES).
In the HELCOM registry hosted by ICES, the location of an event can either be reported as a point (exact coordinates of the event) or as a polygon (pre-defined rectangles with individual identification) within which it occurred. Figure 1 depicts all locations (points and polygons) for which events were reported to the noise registry for the years 2016 to 2021.
For a comprehensive analysis of the data available in the registry, two approaches were taken when conducting this indicator evaluation: an analysis regarding the properties of the events as reported to the registry, and an analysis of the daily exposure according to the amount and properties of events reported for each day. For the quantitative evaluation of the temporal and spatial exposure in the Baltic Sea, the exposed area was further calculated per day. The effect range for each reported source was evaluated based on standardized and source specific effect ranges as detailed in section 9, table 3.
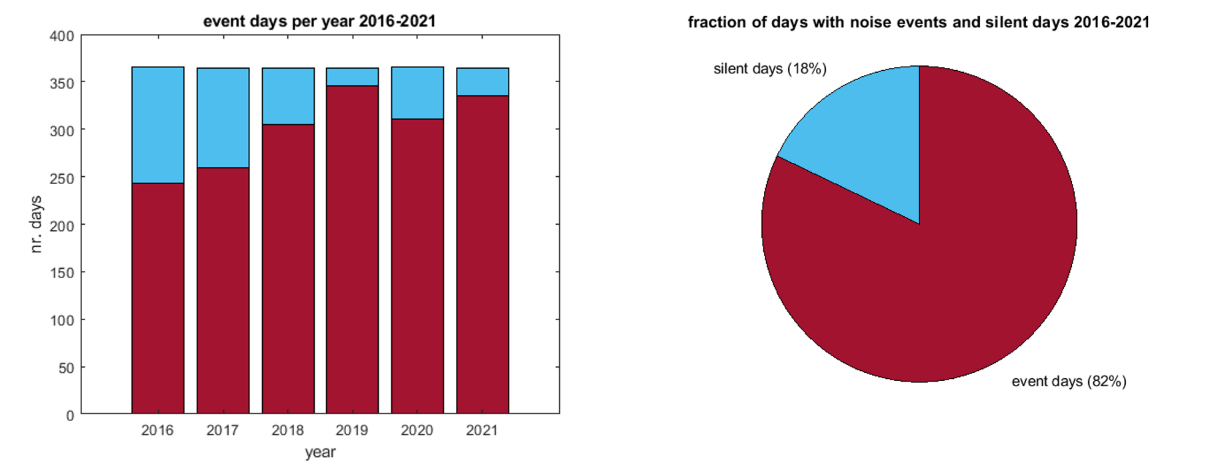
Figure 2: Left: Number of days for which one or more events were reported for each year anywhere within the entire HELCOM area (i.e. HELCOM Scale 1, whole Baltic Sea). Right: Proportion of days with (event days) and without (silent days) one or more events reported anywhere within the entire HELCOM area.
4.2 Characteristics of events with respect to the evaluation of long-term pressure
For insight into long-term contributions to the regional pressure, the duration of events was considered in figure 3. Figure 3(a) shows a histogram of the event durations for events with a duration of less than 10 days. The vast majority of events lasted only a few days (most only one day), but there is a considerable number of events with a very long duration, up to 250 days.
Figure 3 (b) shows the sub-group of events with a duration exceeding 10 days. Such events were reported for all source types in general. However, reported events of source type Sonar or Acoustic Deterrents are particularly frequently represented in this sub-group (89 events of source event type Sonar or Acoustic Deterrents compared to 11-20 events for each of the other types of source events). Note the different y-axes in figures 3 (a) and (b).
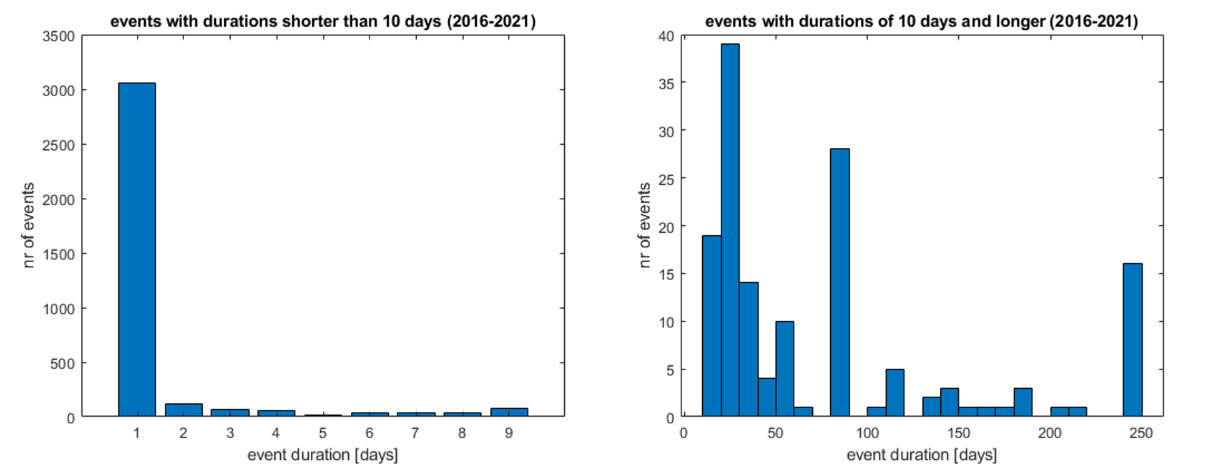
Figure 3. Overview of reported event duration (in days) and the number of such events; (left) shows events with a reported total duration shorter than 10 days, (right) shows events with a reported total duration of 10 days and longer. Note different y-axes.
4.3 Characteristics of events with respect to the evaluation of seasonal pressure
To consider seasonal effects, the number and properties of event days were evaluated per month. To this end, the number of event days in each category were summed up for every month and then divided by the number of years.
The distribution of event days over the course of the year is depicted in figure 4. Here, the number of event days per month, averaged over the years 2016-2021 is shown. The majority of events occurred in the period of May-November which partially coincides with the reproductive season of harbor porpoises, but also harbor seals in the Baltic Sea.
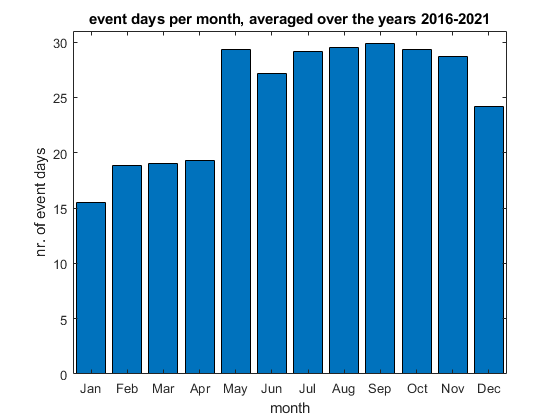
Figure 4: Distribution of event days per month within the entire HELCOM area (averaged over the years 2016-2021).
The Value Codes of the days in a month, averaged to calendar month values over the assessment period, are shown in figure 5. If for one day events with different Value Codes were reported, the highest reported Value Code was assigned to that day.
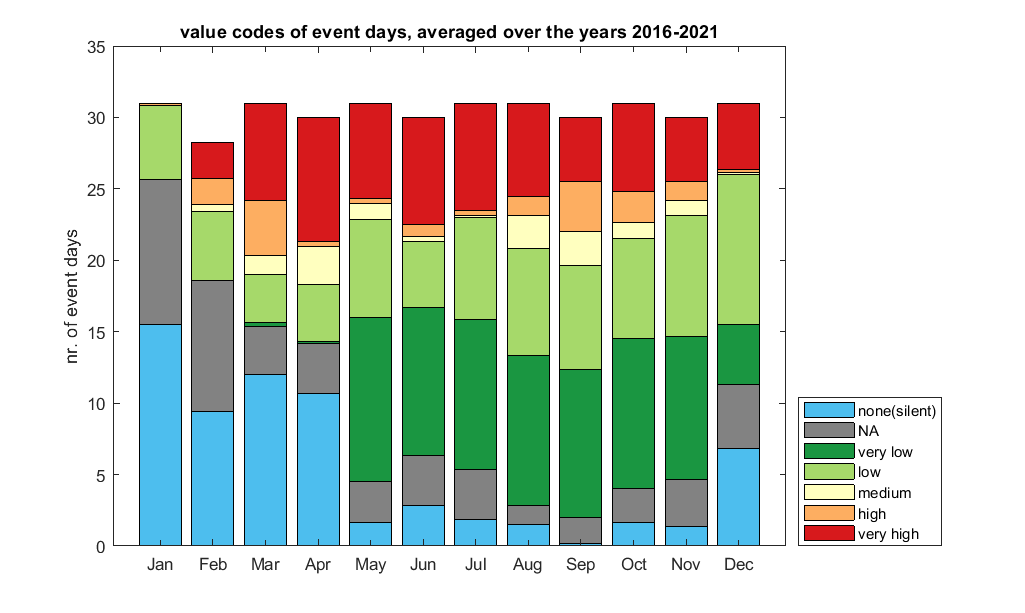
Figure 5: Event days of each value code for every month (averaged over the years 2016-2021), days for which events with different Value Codes were reported count into the highest category reported for that day. The category ‘NA’ (depicted in grey) indicates that the value code was not reported.
The number of Event Days per month on which certain source types occurred, averaged over the years 2016-2021 is shown in figure 6. If more than one source type was reported for one day, an Event Day is counted for each of those reported source types.
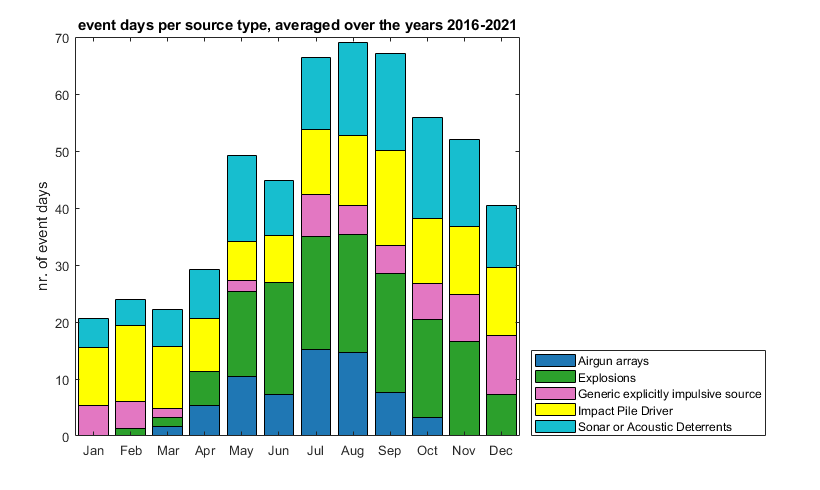
Figure 6. Event days of each source type for every month (averaged over the years 2016-2021), days for which events from different source types were reported count into multiple categories.
4.4 Activity type overview of spatial and temporal pressures distribution in the HELCOM area
The spatial distribution of reported events and their source types for the years 2016 – 2021 is shown in figure 7. Note that if events of different source types were reported for one polygon, only the most recent one is shown.
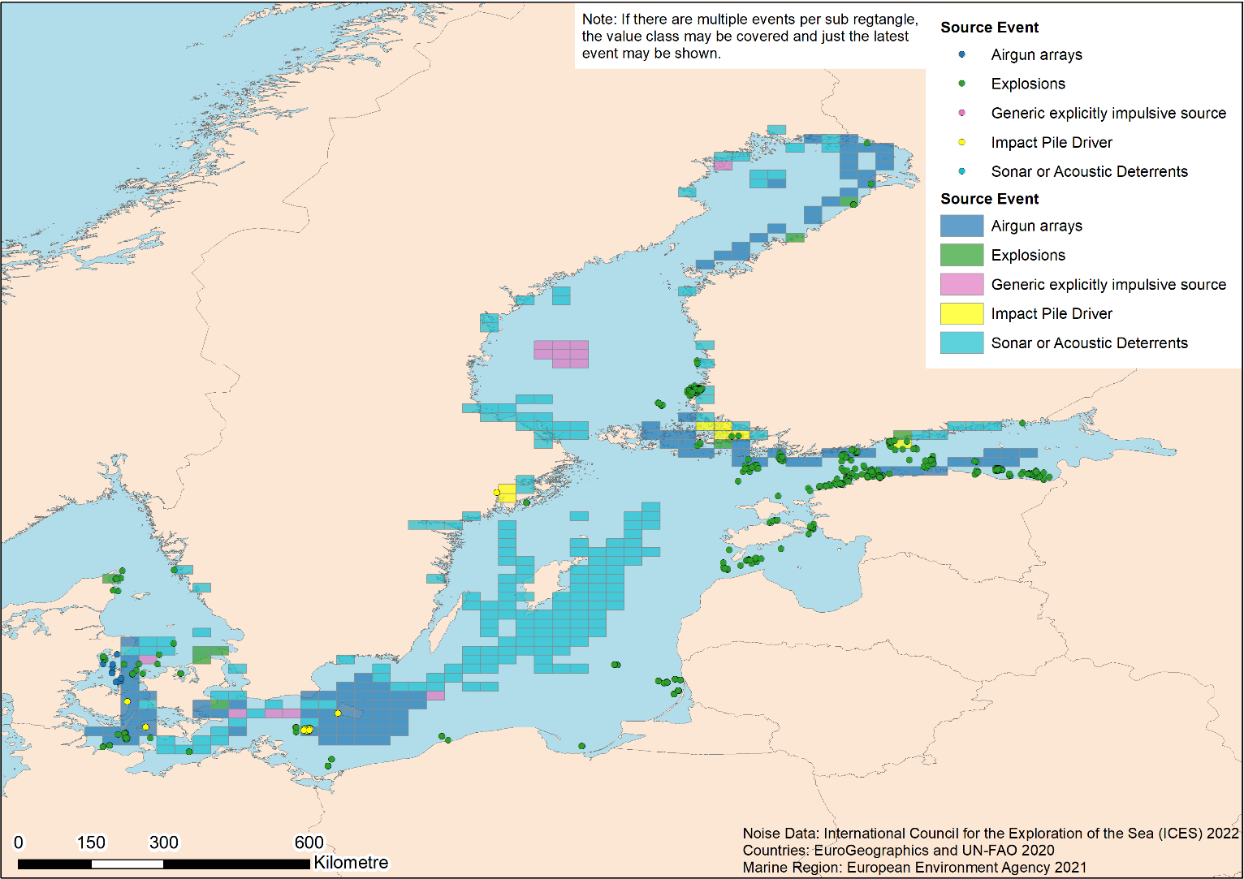
Figure 7: Overview of impulsive noise activities with respect to their source event type in 2016 – 2021 reported for the HELCOM area (data source: HELCOM Noise Registry).
The number of reported events and Event Days per source type are shown in figure 8. In figure 8 (a) all reported events are shown. In figure 8 (b) the Event Days per source type are considered, with days for which events of several different source types were reported captured by the category ‘multiple’. It is apparent that most Event Days fall into that latter category, i.e. for most days of the assessment period events of different source types occurred somewhere within the HELCOM-area.
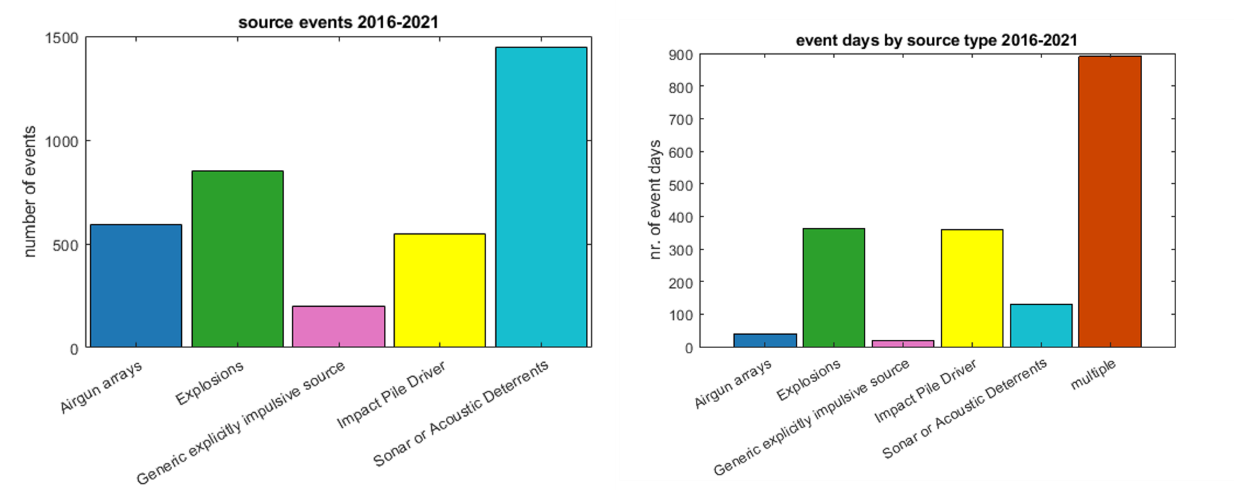
Figure 8: (Left) Overview of source event types of reported events for the period 2016 – 2021. (Right) Number of Event Days with reported source type, days for which events from different source types were reported count as ‘multiple’.
Figure 9 shows the number of events reported per source type, similar to figure 8(a), but for each year separately. There are no clear trends visible for any source type. The number of airgun array events varies strongly between the years but does not show a general increase or decrease. There are a very high number of explosion events in 2016. In most years there were small numbers of generic explicitly impulsive source events, with the exception of 2018. Impact pile driving was present in all years but to a varying extend, with the highest numbers of events in 2017 and 2018. The number of sonar or acoustic deterrent events was somewhat consistent throughout the years, except for 2020 when there was a very high number of events of this type.
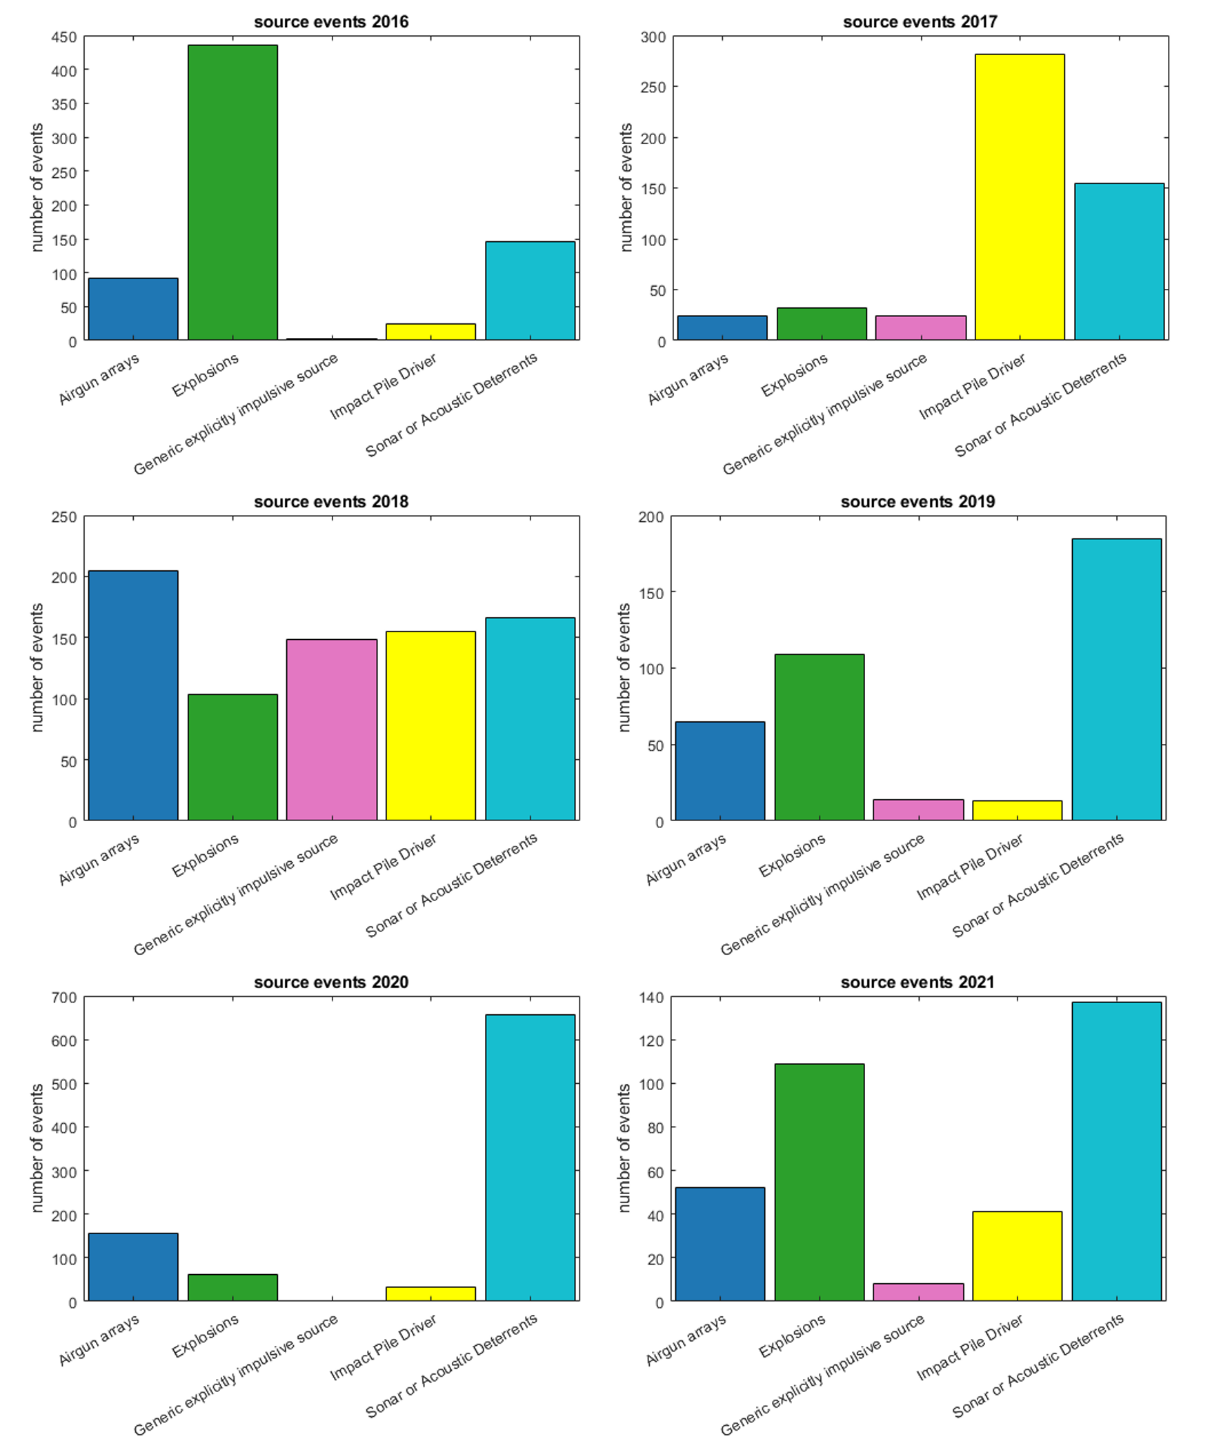
Figures 9. Overview of annual number of events with respect to source event types reported for each year. Note the different y-axes.
4.5 Value code overview of spatial and temporal pressure distribution in the HELCOM area
An overview of the spatial distribution and respective value code is provided in figure 10. Where multiple occurrences take place in the same point or polygon, the latest event is depicted unless stated otherwise.
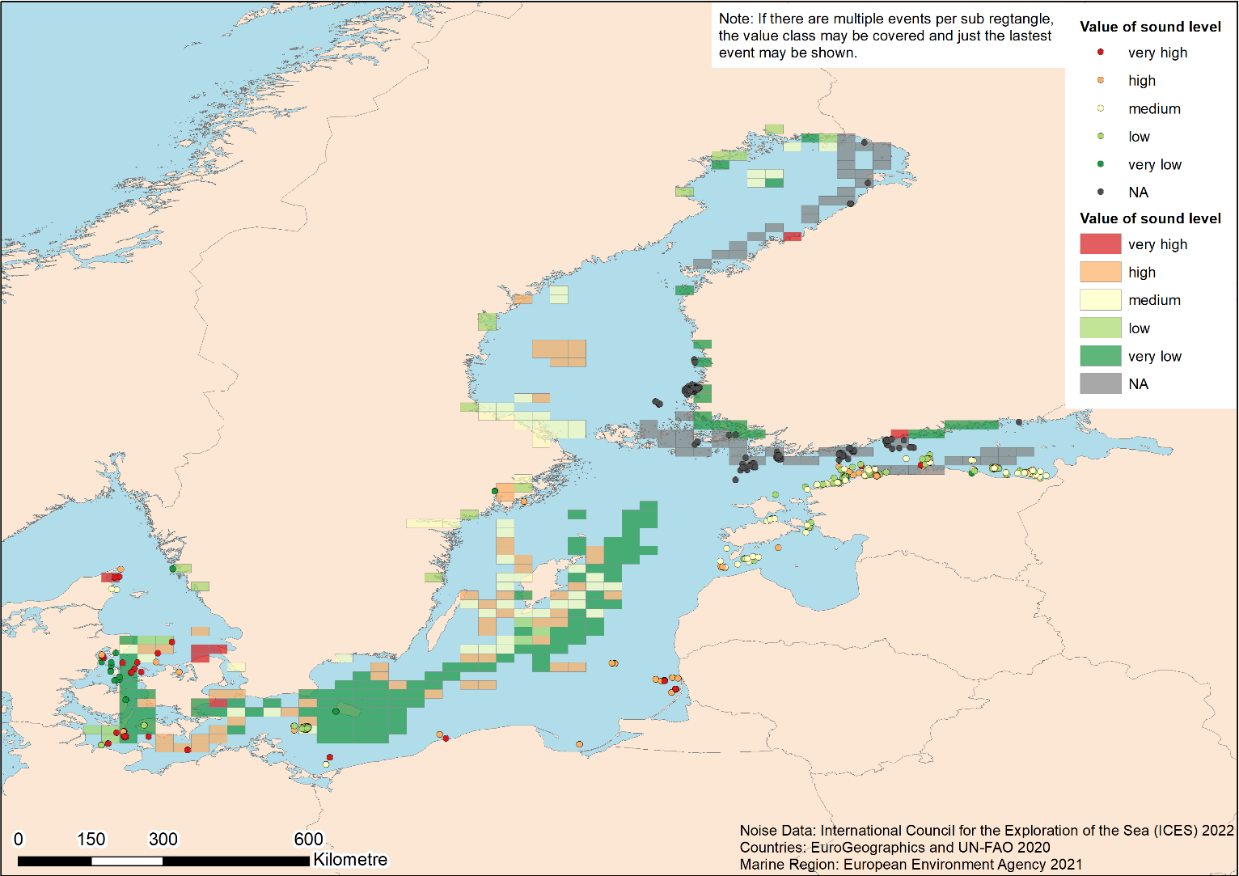
Figure 10. Overview of impulsive noise activities with respect to their value code in 2016 – 2021 reported for the HELCOM area (data source: HELCOM Noise Registry).
The relative proportion of event Value Codes across the 2016-2021 period is shown in figure 11 (a). Figure 11 (b) shows the percentage of days, on which events of each Value Code occurred, and days, for which no event was reported (Silent Days). It is important to have in mind here, that an event can last for several days (see glossary). Since a number of events in the category very high occurred over several days, the temporal fraction of Event Days with events of value code very high is about 21% (470 days) compared to the relative proportion of events of value code very high, 3% (115 events).
If events of different Value Codes were reported for a single day, the highest Value Code reported for that day was assigned. Unfortunately, for a considerable fraction of events (17 %) the Value Code was not reported to the registry.
Approximately half of the events reported for 2016 – 2021 yield a value code of medium or higher.
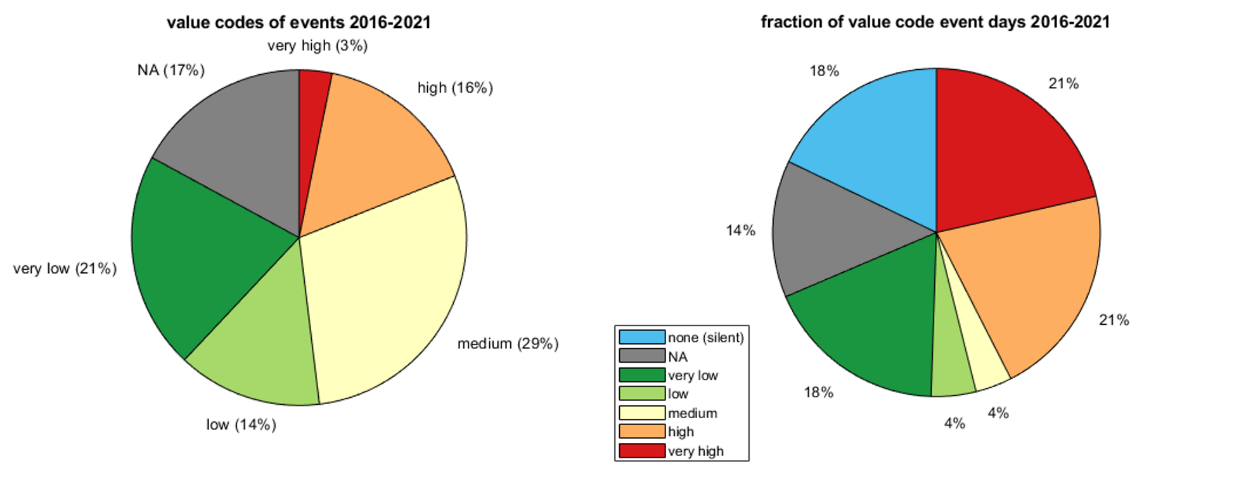
Figure 11. (Left) Overview of the distribution of reported events in 2016 – 2021 according to their Value Codes. The total number of reported events is 3637. (Right) Fraction of Event Days with reported Value Codes and silent days (on which no event was reported), days for which events with different Value Codes were reported count into the highest category reported for that day. The total number of Event Days is 1799, being 2191 the total number of days for the temporal period assessed.
The number of events per reported Value Code is shown in figure 12 for each source type. It is notable that for some source types a specific Value Code is predominant while others are more broadly distributed. Airgun array events and explosions have high numbers of events reported without Value Code (i.e. shown as NA), especially explosions. This is unfortunate since the reported explosion events span the whole range of Value Codes, with a considerable number of Value Codes ‘high’ and ‘very high’, and the difference in impact on marine life by events of different Value Code is probably the biggest for this type of explosion.
Interestingly, most pile driving events had a Value Code of ‘very low’ even though only in very few cases noise mitigation measures were applied (figure 13).
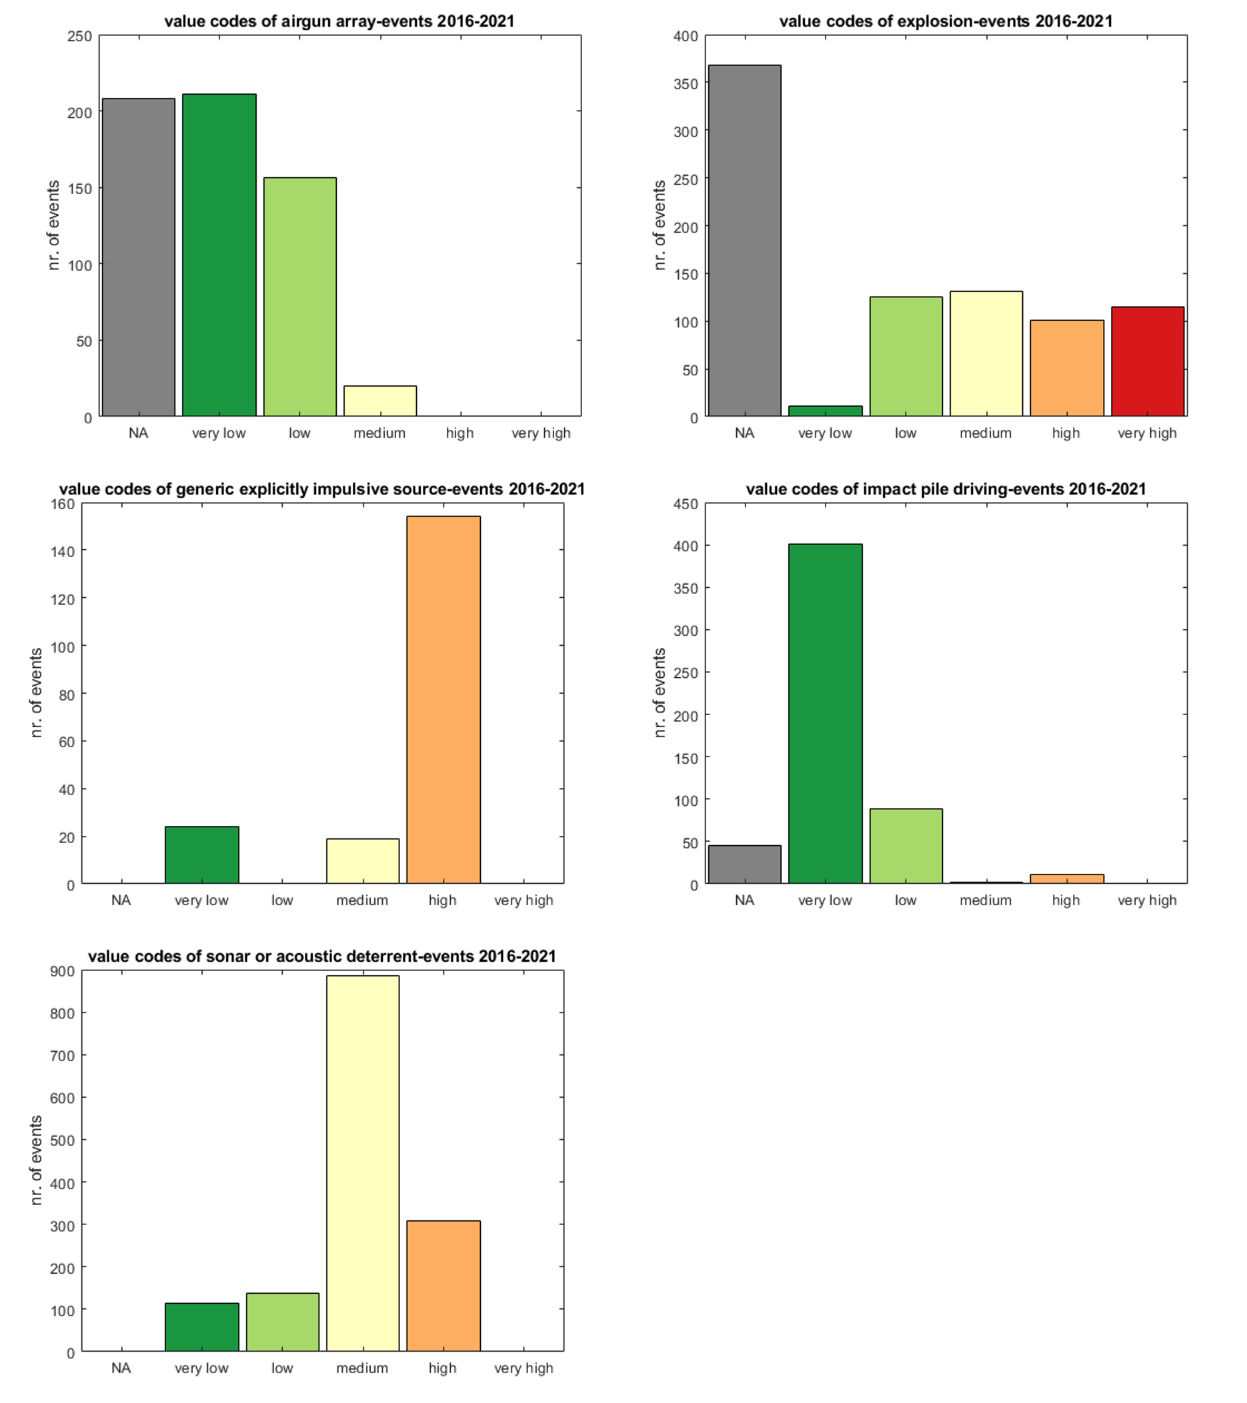
Figures 12. Value Codes of events reported for each Source Type. Note different y-axes.
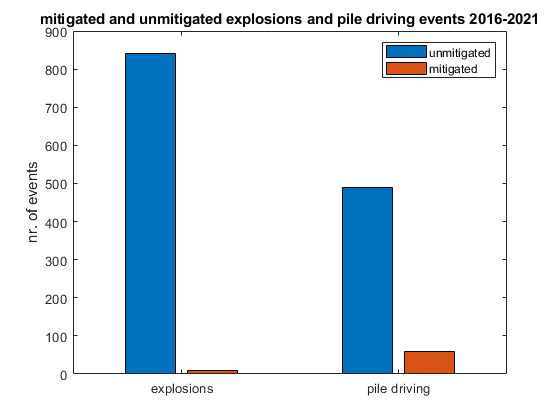
Figure 13. Reported explosions and pile driving events with and without noise mitigation measures.
A known caveat for the evaluation of reported value codes is that the comparison of value code categories between different source activity types is limited. However, the value code distribution within the impulsive noise type categories (single impulsive event, multiple impulsive event and non-pulse event) serves as proxy for the identification of severe risk of impact.
The assessment based on the general pressure due to impulsive noise events and their characteristics reported to the regional impulsive noise registry data shows that in the period 2016 to 2021 a broad range of impulsive sound events have taken place in the Baltic Sea region. As known from studies mentioned above, events of high intensity mostly referred to explosions, acoustic deterrents but also unmitigated pile driving events may have biological effects on species and their populations in the Baltic Sea.
4.6 Spatio-temporal assessment of exposure for harbour porpoise
The exposed areas for each year (i.e. the areas where impulsive noise is at levels that can impact on harbour porpoise), generated by considering the reported locations of events as points or polygons and their respective effect ranges, according to empirical information on the disturbance of harbour porpoise is illustrated in figure 14. The effect range of each event was determined based on the event source type and the presence of noise mitigation measures according to chapter 9, Table 3.
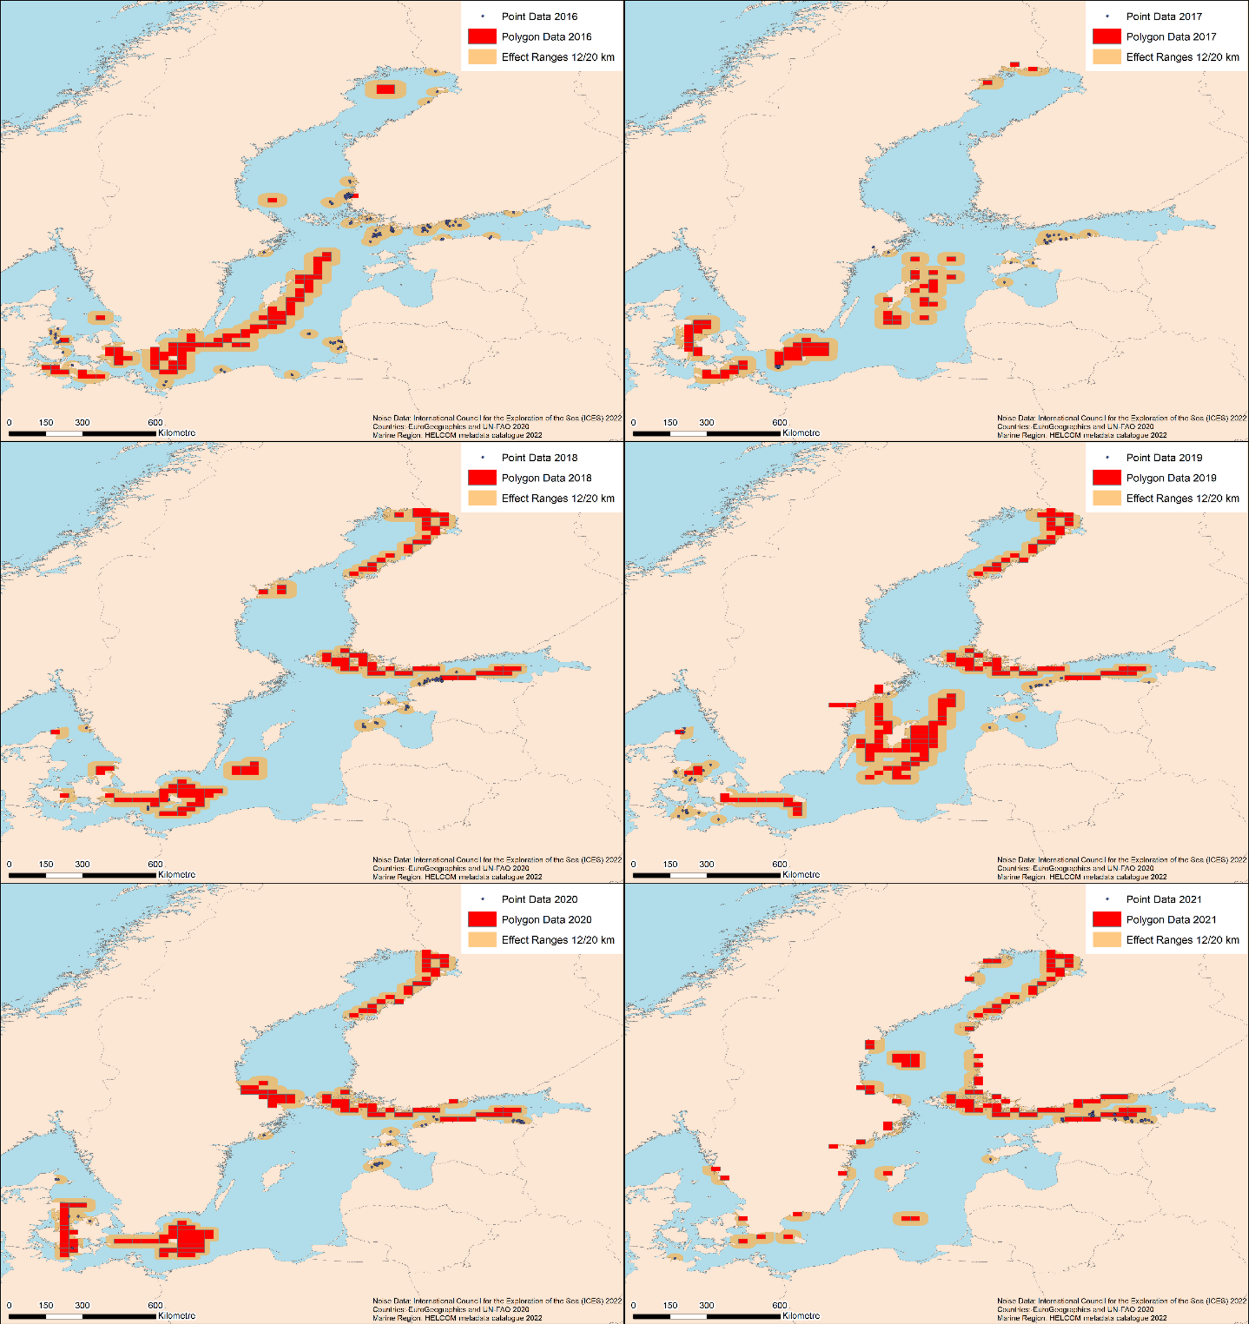
Figure 14. Annual overview of exposed areas/habitats due to impulsive noise activities in the period 2016 – 2021 reported for the HELCOM area (data source: HELCOM Noise Registry). The exposed area shown corresponds to the max hold area (i.e. the maximum value of the unification of all areas). Please note that the harbour porpoise in the Baltic Sea at its current status and distribution does not cover large parts of the assessed area illustrated.
It should be noted that the harbour porpoise in the Baltic Sea at its current status and distribution does not cover large parts of the assessed area illustrated above. The current population that is divided into two management areas or sub-populations is mainly centred in the Belt Sea area (Belt Sea population) and in a smaller and critically endangered population in the Baltic Proper (southern Baltic proper area). The prior distribution has however encompassed the whole Baltic Sea (see Abundance and Distribution of harbour porpoise indicators) thus the monitoring and evaluation of impulsive noise impacts are critical as these factors, especially when considered cumulatively with other pressures, are likely to contribute to recovery of the species at its former natural distribution and abundance. It should also be noted that in all years illustrated in figure 14, except for 2021, there are significant records of noise events of a level that can impact on harbour porpoise within the core area or the Belt Sea population.
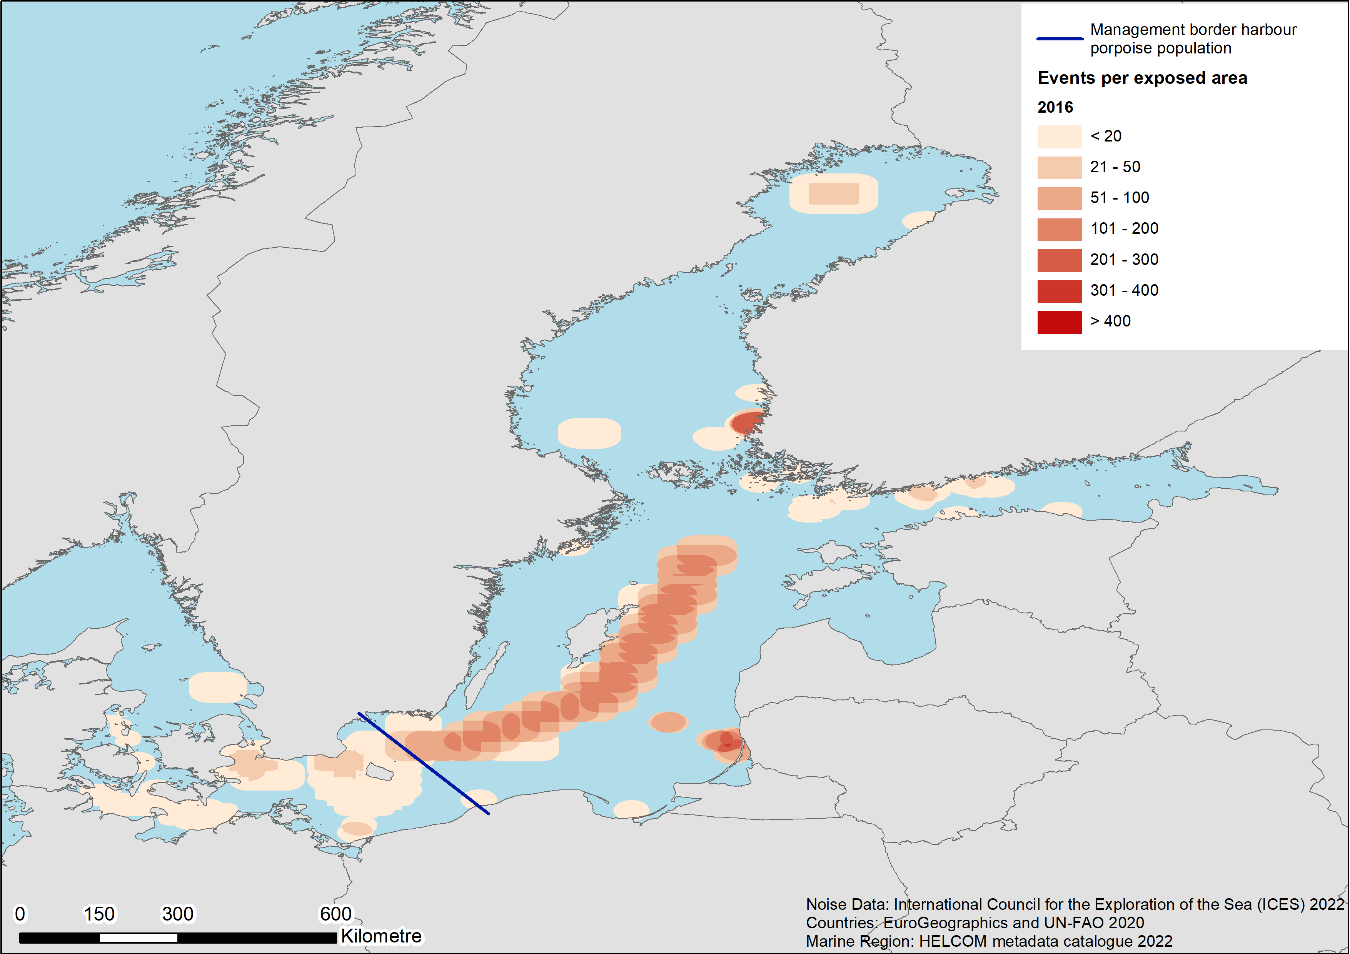
Figure 15. Events per exposed area for the year 2016. The blue line shows the summer eastern management border for the Belt Sea harbour porpoise population.
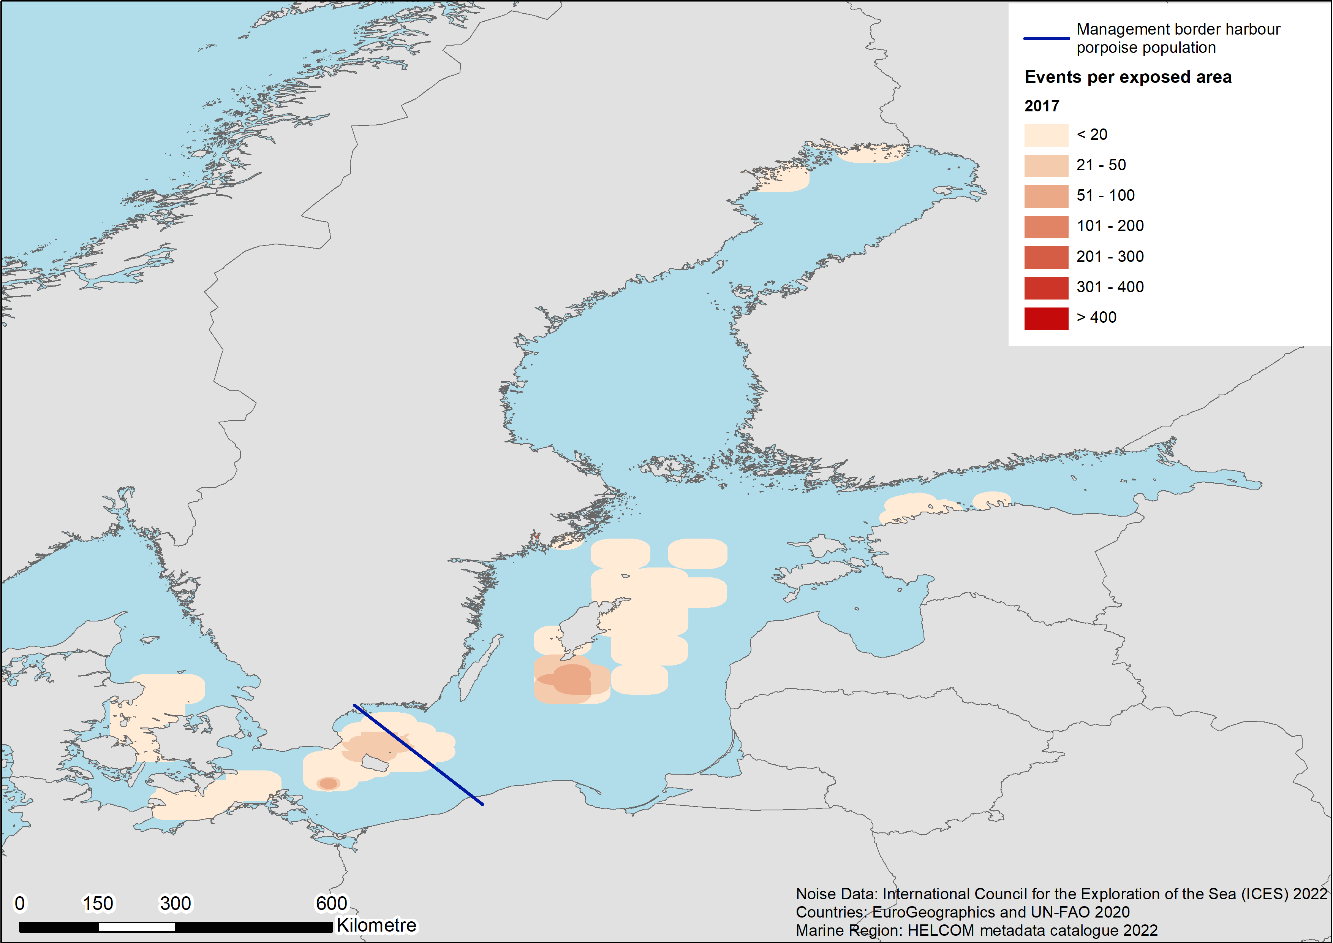
Figure 16 Events per exposed area for the year 2017. The blue line shows the summer eastern management border for the Belt Sea harbour porpoise population.
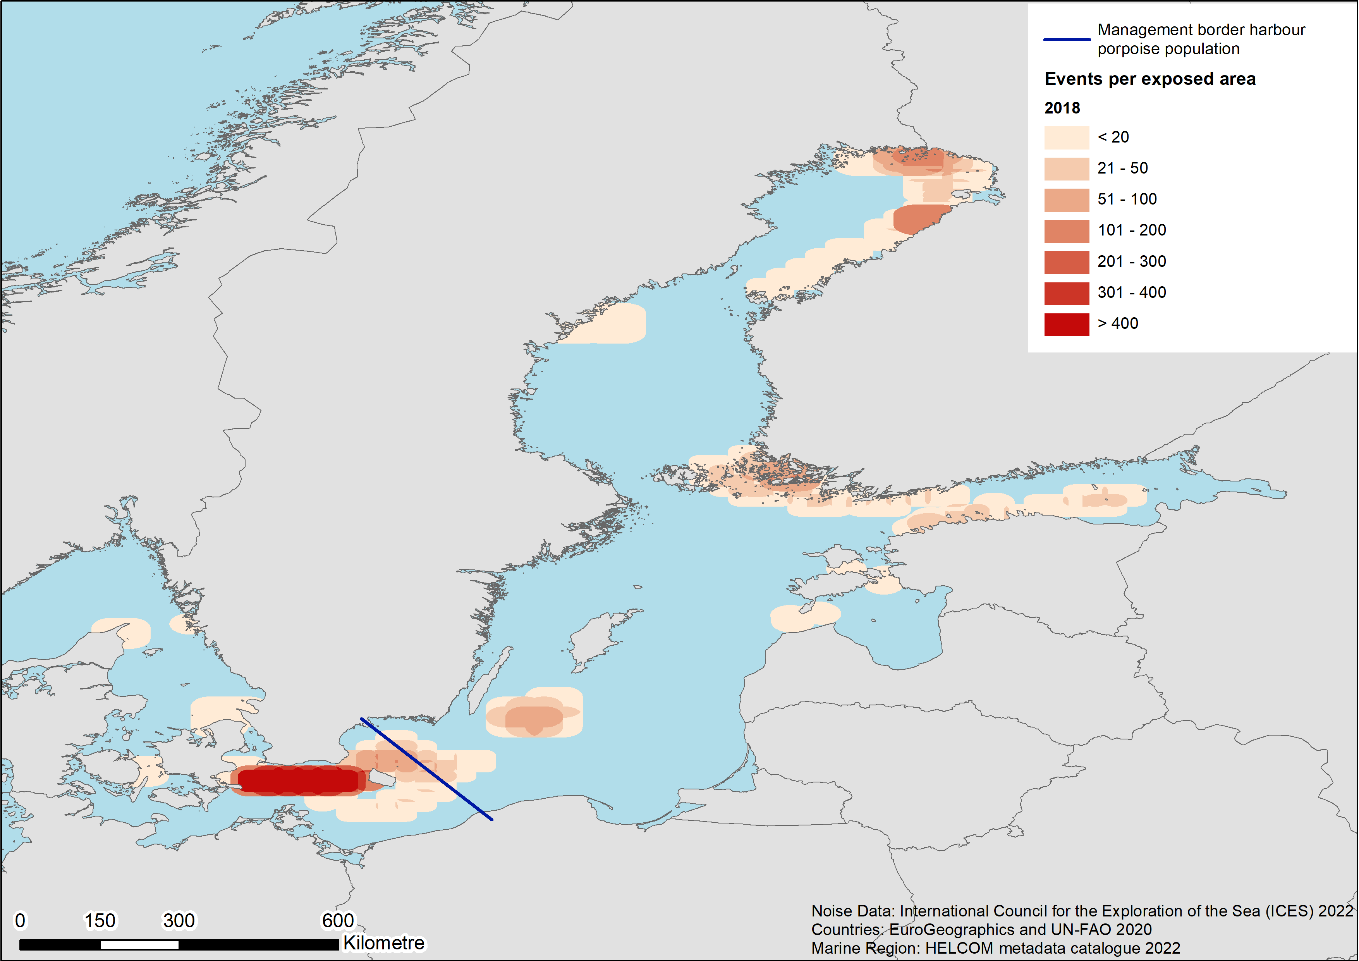
Figure 17. Events per exposed area for the year 2018. The blue line shows the summer eastern management border for the Belt Sea harbour porpoise population.
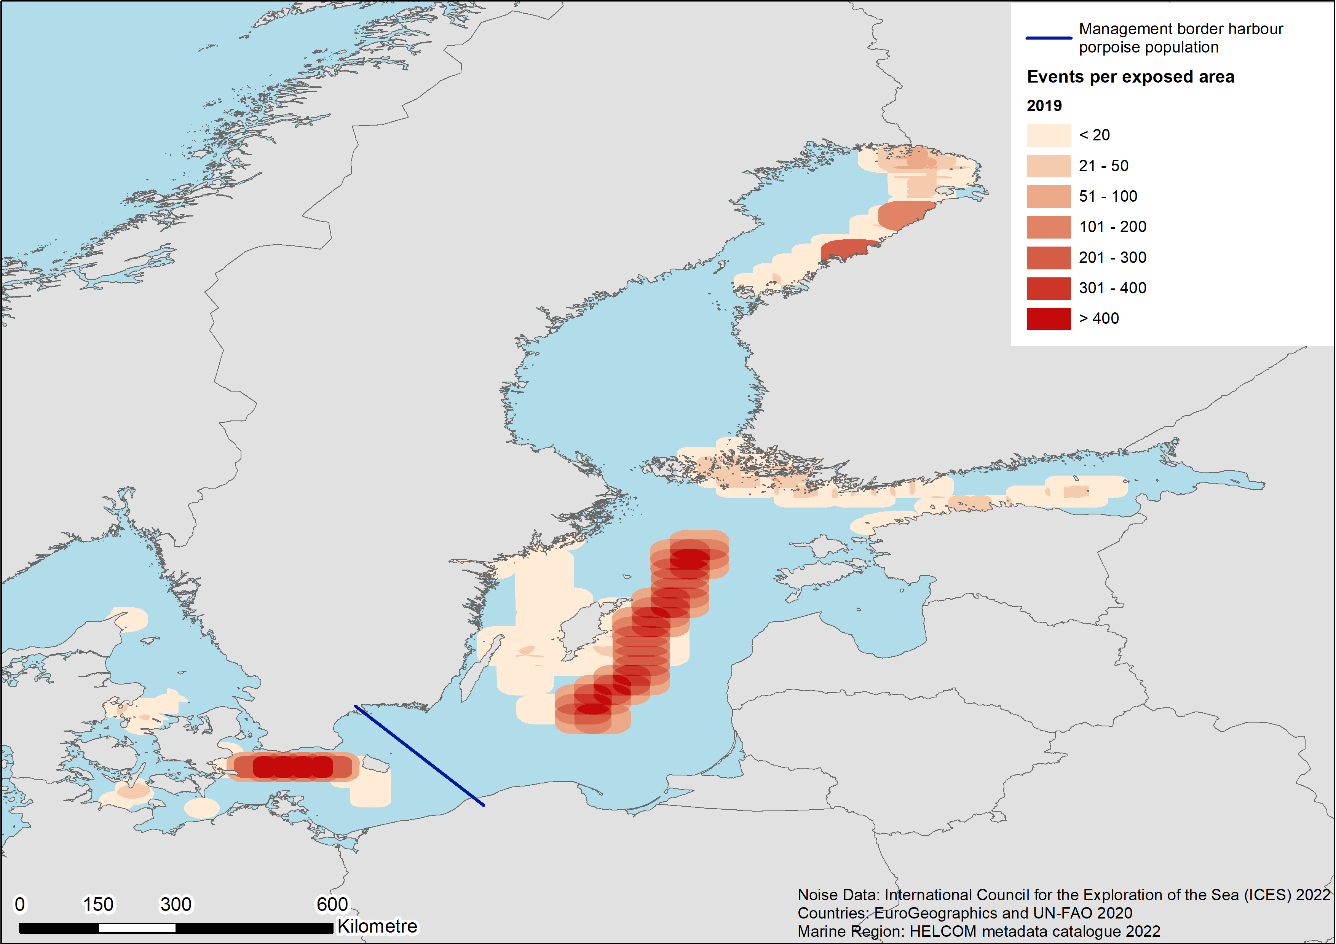
Figure 18. Events per exposed area for the year 2019. The blue line shows the summer eastern management border for the Belt Sea harbour porpoise population.
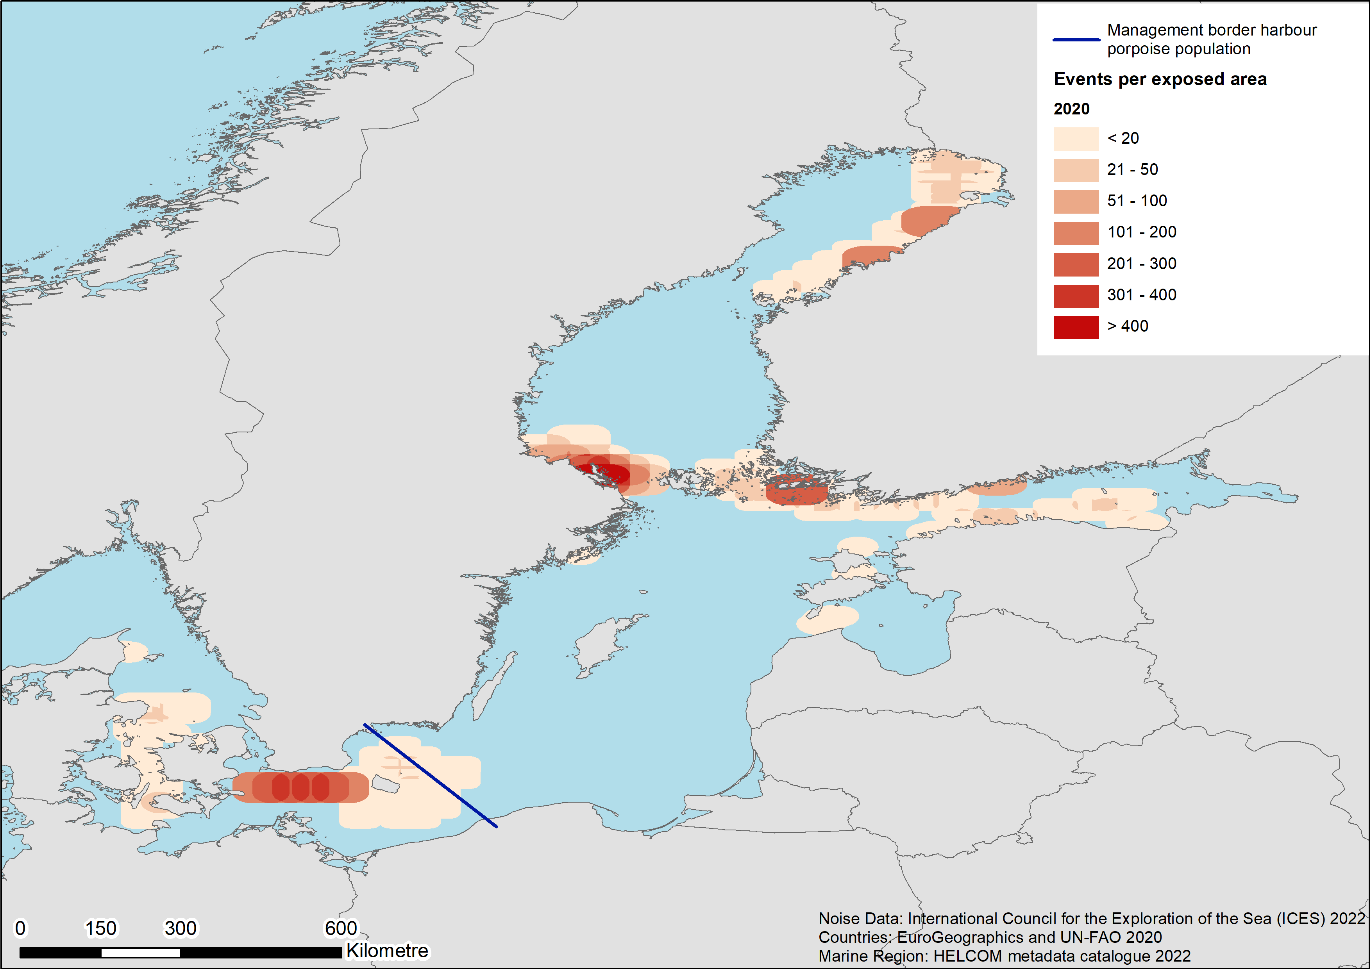
Figure 19. Events per exposed area for the year 2020. The blue line shows the summer eastern management border for the Belt Sea harbour porpoise population.
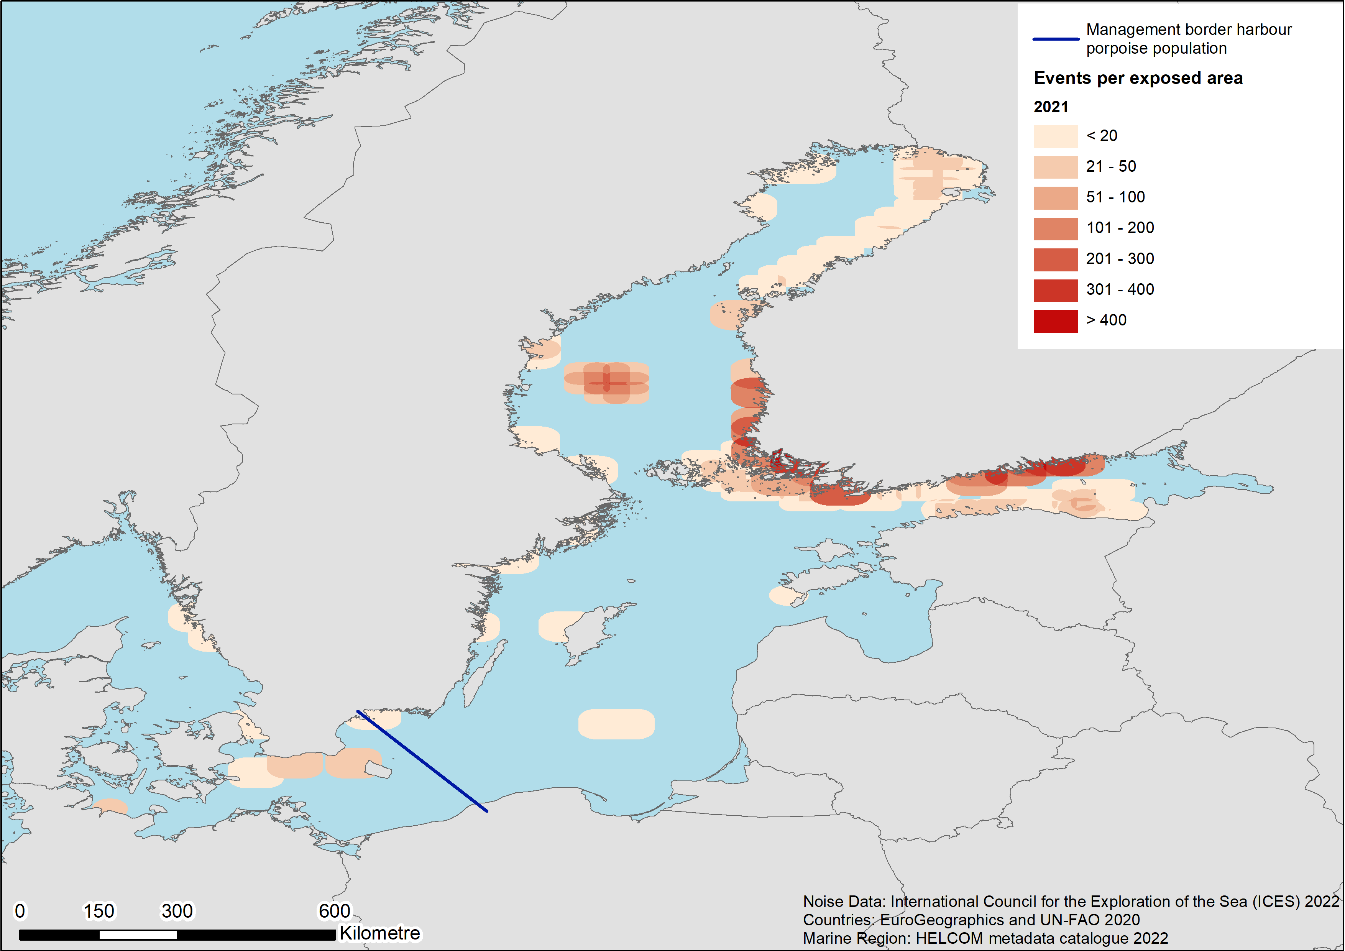
Figure 20. Events per exposed area for the year 2021. The blue line shows the summer eastern management border for the Belt Sea harbour porpoise population.
Figures 15-20 show the number of events with their effect ranges that overlap in the exposed areas, i.e. to how many events the area is exposed for each year. The blue line is the summer eastern management border for the Belt Sea harbour porpoise as considered in Carlén et al. (2018). Figure 18 is of particular interest, since the highest number of event days during the assessment period occurred in the year 2019.
Figure 21 shows the daily percentage of the HELCOM area exposed to impulsive noise for each year, in total and per source type. Over most of the time, the area/habitat exposed and disturbed remained below a fraction of 10% of the HELCOM area habitat per day. There is, however, a period during the spring of 2016 where the percentage of total exposed area exceeded this proposed interim threshold value for several days (24 days). Within this period many events occurred simultaneously, a number of which were long-lasting events that overlapped. These were mainly sonar or acoustic deterrent events and explosions. Most of those events had the Value Code ‘very low’; there were, however, several events of Value Codes ‘high’ and ‘very high’. This coincidental accumulation and the occurrence of several unmitigated explosions at the same time seem to be the probable cause for the high exposure.
In the spring of 2019, there was another period of high exposure, when the percentage of total exposed area remained just below 10%. During this time there was also a very high number of long-lasting events (some of very long duration) present. Those were mostly sonar or acoustic deterrent events of Value Code ‘very low’, the high exposure seems to be caused by the large number of simultaneous events.
However, throughout the entire assessment period the daily exposed area remained below the daily (short term) threshold value developed on EU level of a habitat fraction of 20%. Table 3 additionally presents the annual averages of the daily exposed habitat fractions for each year between 2016 and 2021. The annual average of each year was calculated as arithmetic means of the daily exposed habitat fractions in the respective year. Again, the habitat area considered for the evaluation refers to the entire HELCOM area. The annual averages of exposed habitat fraction remain well below a value of 3% throughout the entire assessment period for HOLAS 3 and do therefore not exceed the annual (long term) threshold value developed at EU level of a yearly average habitat fraction of 10%. The largest annual averaged fraction of exposed habitat is obtained for 2019 with a value of 2.77%.
Table 3. Annual averages of exposed habitat
| Year | Annual average of daily fraction of exposed habitat (i.e. of entire HELCOM area) |
| 2016 | 1.18 |
| 2017 | 0.26 |
| 2018 | 1.70 |
| 2019 | 2.77 |
| 2020 | 1.59 |
| 2021 | 2.18 |
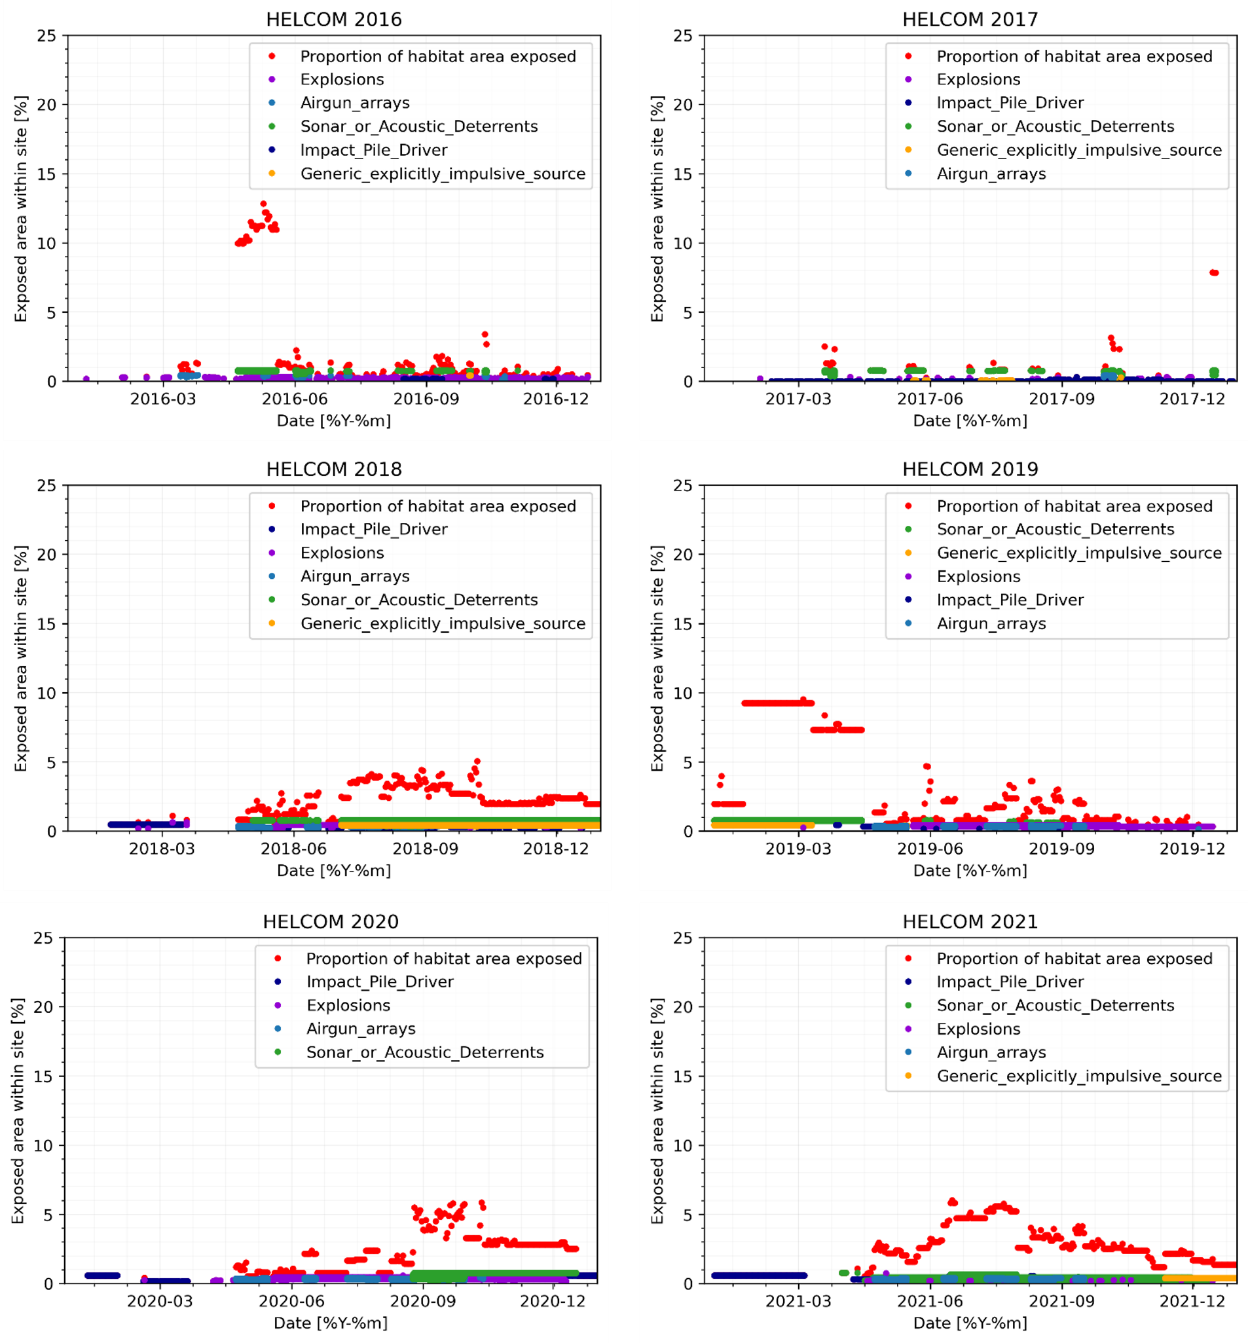
Figure 21. Annual overview of daily exposed area/habitat due to impulsive noise activities in 2016 – 2021 reported for the HELCOM area (data source: HELCOM Noise Registry).
To assess the risk of exposure for species, information is needed about their distribution in terms of time and space. In other words, information is needed about where and when species are likely to be present. The spatial extent of impulsive noise sources varies primarily with the intensity of an activity but may also vary on average between different activities. Furthermore, the intensity of the impulsive noise sources largely determines the degree of adverse effects and the area associated with the noise input. This includes the potential for disturbance by impulsive noise events in general, and the additional potential for injury due to intense events such as explosions.
The impact of impulsive noise on harbour porpoises depends on the nature of the sound source and whether there have been mitigation and abatement technologies in place (where applicable). Furthermore, there may be times and areas during the year that are more sensitive than others (e.g. HELCOM 2019). Carlén et al (2018) showed that between May – October there is a clear border between the critically endangered population in the Baltic Proper and the population in the Western Baltic. According to the study, calving and mating appear to take place during these months – the Baltic Proper population is concentrated in the area south of Gotland. During the winter months the populations mix, which in turn means that animals belonging to the Baltic Proper population enter the Western Baltic.
To assess the exposure of those populations in more detail, a statistical analysis of the relevant areas has been performed for the two areas depicted in figure 22. These areas are estimates of regions of high activity overlapping with the areas relevant to the mentioned populations.
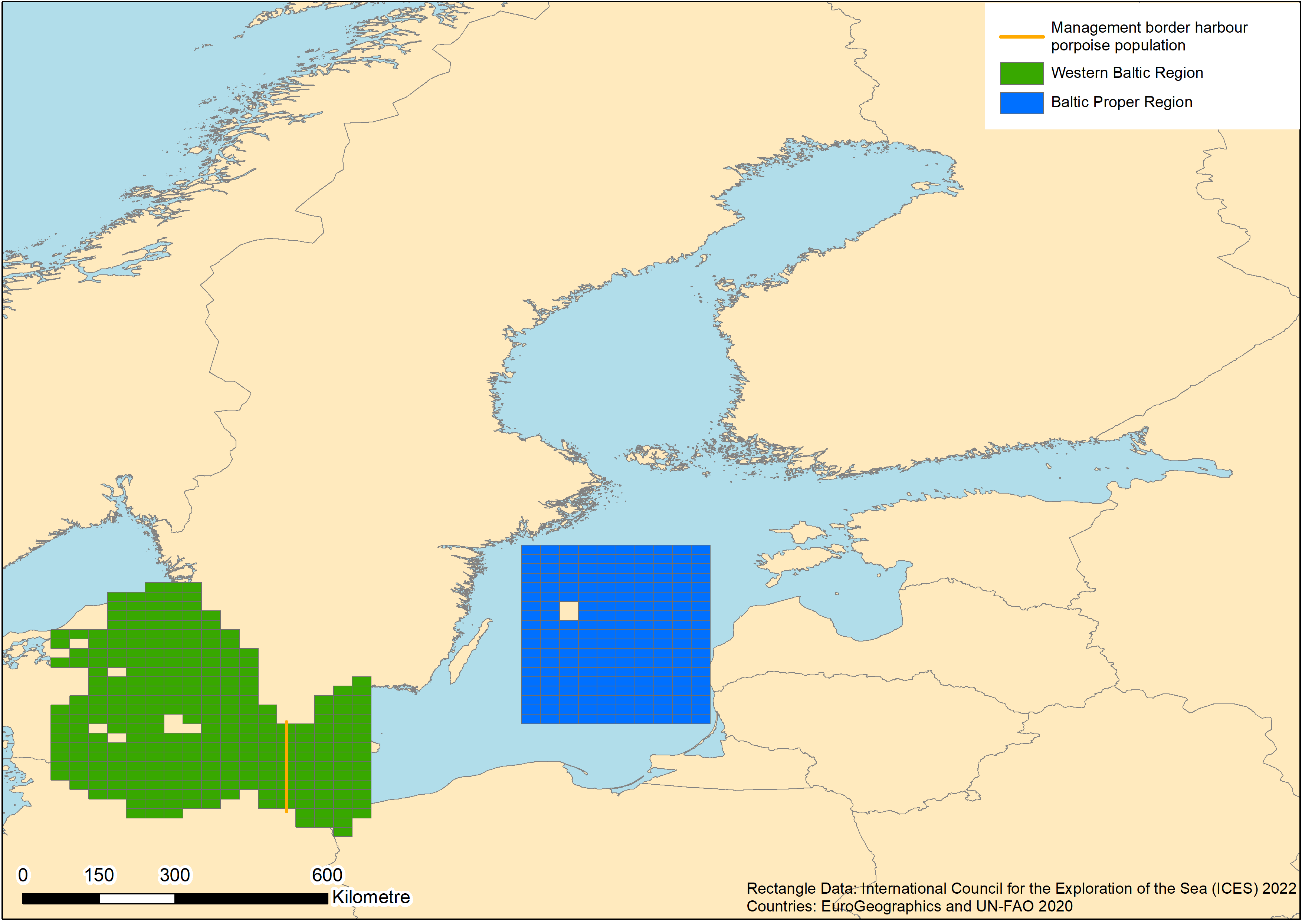
Figure 22. Areas considered in the statistical analysis regarding harbour porpoise populations. The orange line represents the border between the Belt Sea population and the region shared with the Baltic Proper population.
These areas cover the region south and east of Gotland (Baltic Proper, orange in figure 22) and the region from Bornholm to the border between the Baltic and the North Sea (Western Baltic, green in figure 22). The latter contains the summer management border of the Baltic Proper and the Belt Sea population.
From the 3637 total events reported, only about 7.5 % (271 events) occurred in the area southeast of Gotland. These affect 203 Event Days, about 11.3 % of all Event Days (1799).
The exposure of the Western Baltic area is considerably higher. In this region, about 27.9 % (1013 events) of all reported events occurred on 35.63 % (741 days) of all event days. 39.9 % of those events occurred west of and 59.6 % east of the border mentioned above. Of the Event Days for that area, about 77.9 % (west) and about 80.3 % (east) were exposed, respectively.
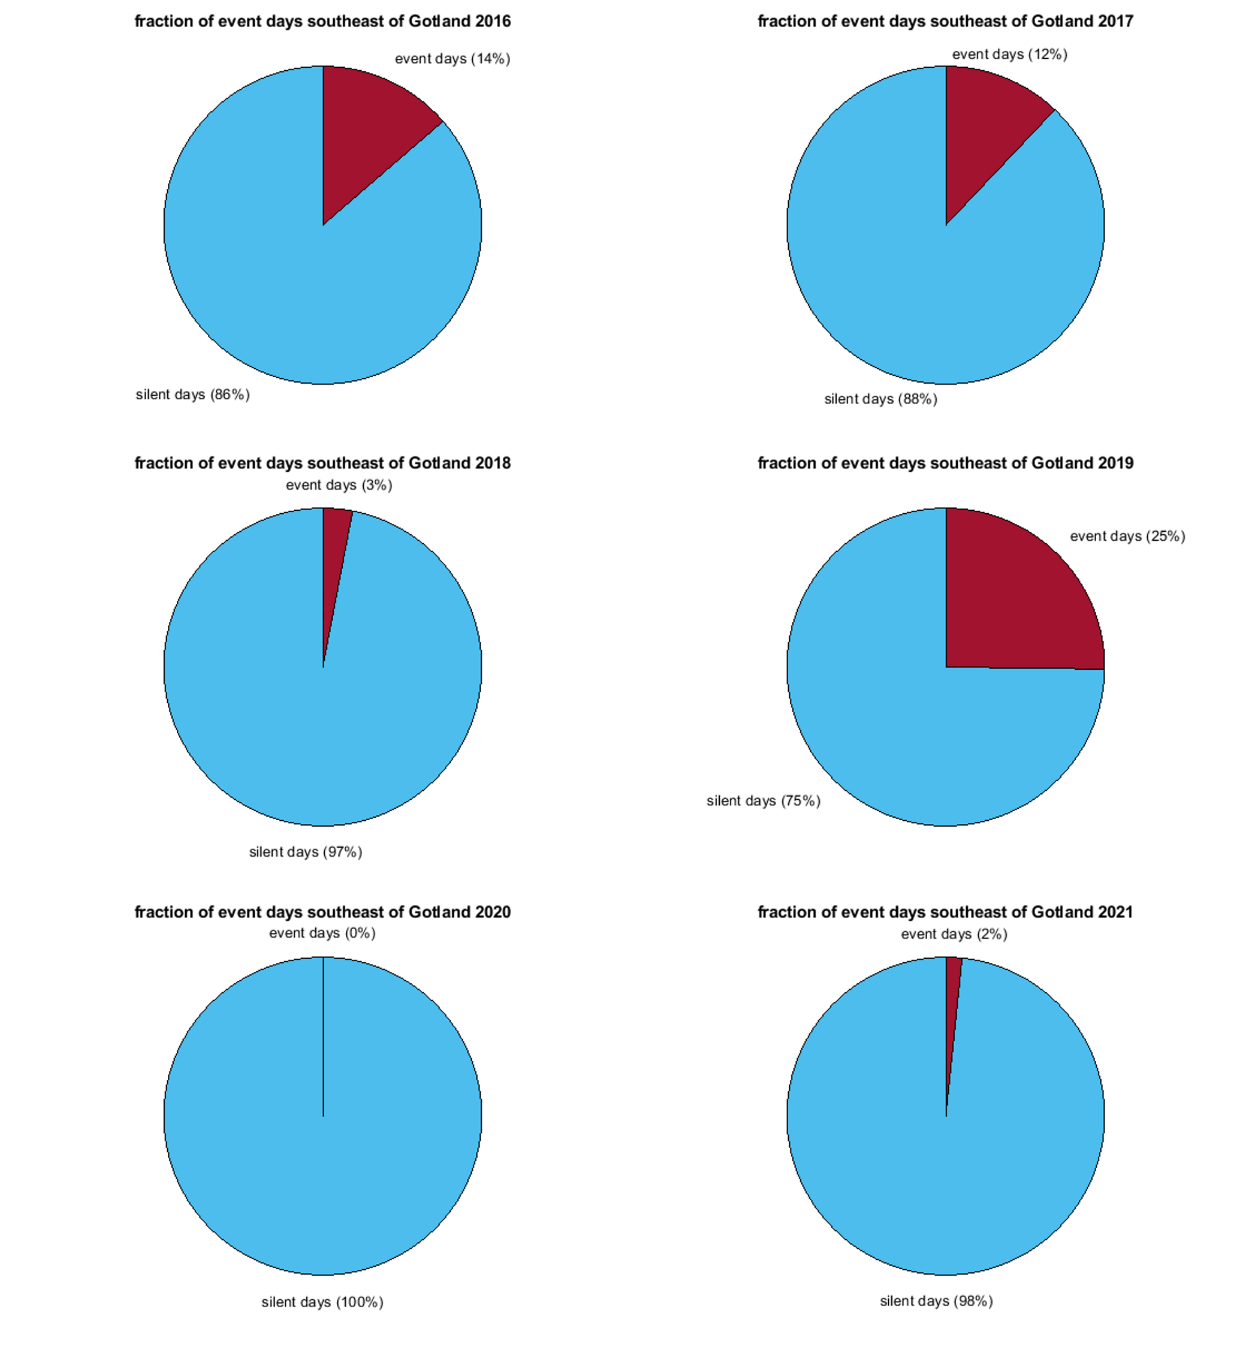
Figure 23. Number of Event Days and Silent Days in the area southeast of Gotland for each year.
As figure 23 shows, the fraction of Event Days and Silent Days (see glossary) varies strongly between the years. The highest number of Event Days in this area occurred in 2019.
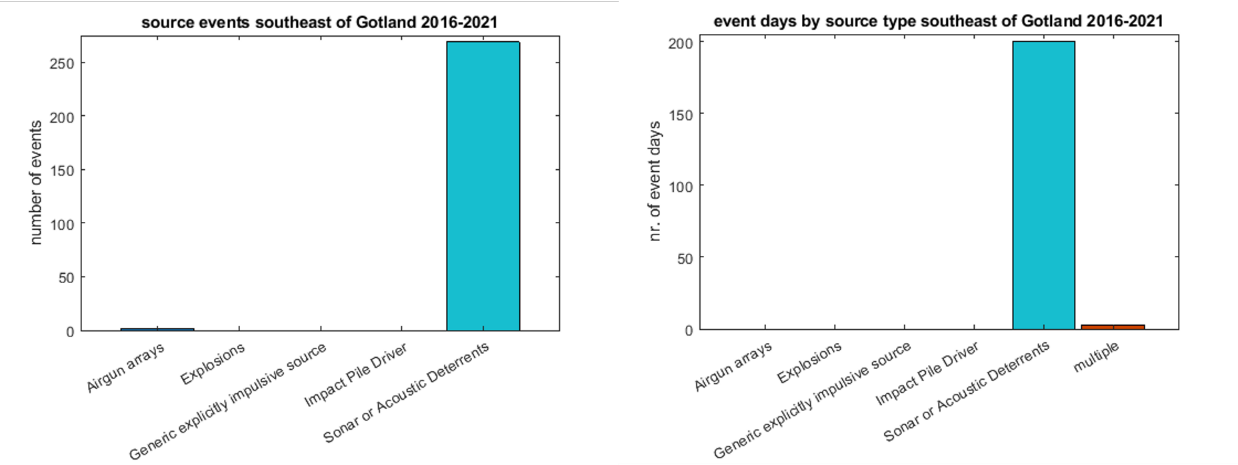
Figure 24. Source event types within the area southeast of Gotland. (a) Number of events reported for each source type. (b) Number of Event Days per source type. Days for which more than one source event type was reported count into category ‘multiple’. Note different y-axes.
Figure 24 shows the types of source events reported for the area southeast of Gotland. It is obvious that the vast majority of events there were Sonar or Acoustic Deterrents. In the current reporting schedule of the noise registry no further distinction between these activities (sonar or acoustic deterrent) is included. On three days explosions occurred besides the Sonar or Acoustic Deterrent events. As the difference between events and Event Days shows (figure 24, note different y-axes), several of the events occurred simultaneously. Since the considered area is the summer habitat of the endangered Baltic proper population it would be important to be able to differentiate between sonar and acoustic deterrents. Gillnets are by far the biggest threat to harbour porpoises, as bycatch occurring in gillnets is usually lethal. To account for this effect and for a general improvement of the depth of the analysis of different activities, an adjustment of the registry in this regard seems advisable.
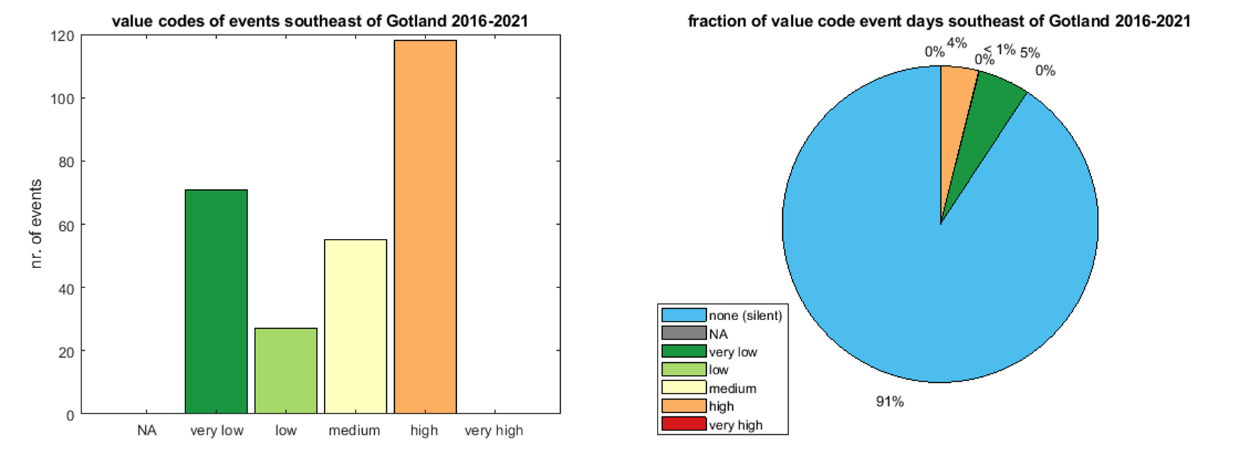
Figure 25. Value codes of events in the area southeast of Gotland. (Left) Number of reported events per value code. (Right) Fraction of Event Days with each value code, including Silent Days. Days for which events with different Value Codes were reported count into the highest category reported for that day.
In figure 25, which shows the value codes of events and Event Days within the area southeast of Gotland, there seems to be a discrepancy between the numbers of events and the numbers of Event Days for some categories: while there are several events reported with value codes ‘low’ and ‘medium’, their percentage of Event Days is zero and almost zero, respectively. This can be explained by the method of calculation of the Event Day value codes. If for a day, events of more than one value code have been reported, this day is counted into the category of the highest value code reported for that day. Thus, on each of the days on which events of value code ‘low’ occurred, at least one other event with a higher value code took place.
Figure 25 shows that about half of the Event Days in this area had value codes ‘high’ and ‘medium’ while also about half had the value code ‘high’. No events with value code ‘very high’ were reported and no events were reported without value code (‘NA’). Since the value code of the two reported airgun array events is ‘very low’, the events of source type Sonar or Acoustic Deterrent span the whole range of reported value codes, from ‘very low’ to ‘high’.
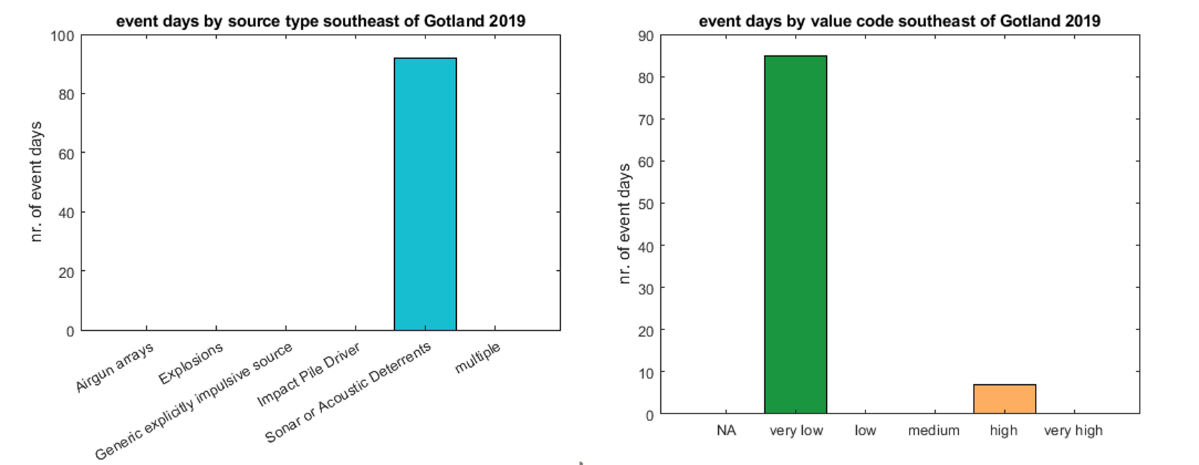
Figure 26. Event Days per source event type and per value code in the area southeast of Gotland for the year 2019. (a) Source events. (b) Value codes. Days for which events with different Value Codes were reported count into the highest category reported for that day.
Figure 26 shows the source event types and value codes of Event Days in the area southeast of Gotland in the year 2019, the year with the highest number of Event Days in this area. It clearly shows that the events reported in this area and time period were exclusively Sonar or Acoustic Deterrents. While this year contained the highest number of Event Days, the majority of these had only value codes of ‘very low’. Only on seven days in the year 2019 events of value code ‘high’ occurred.
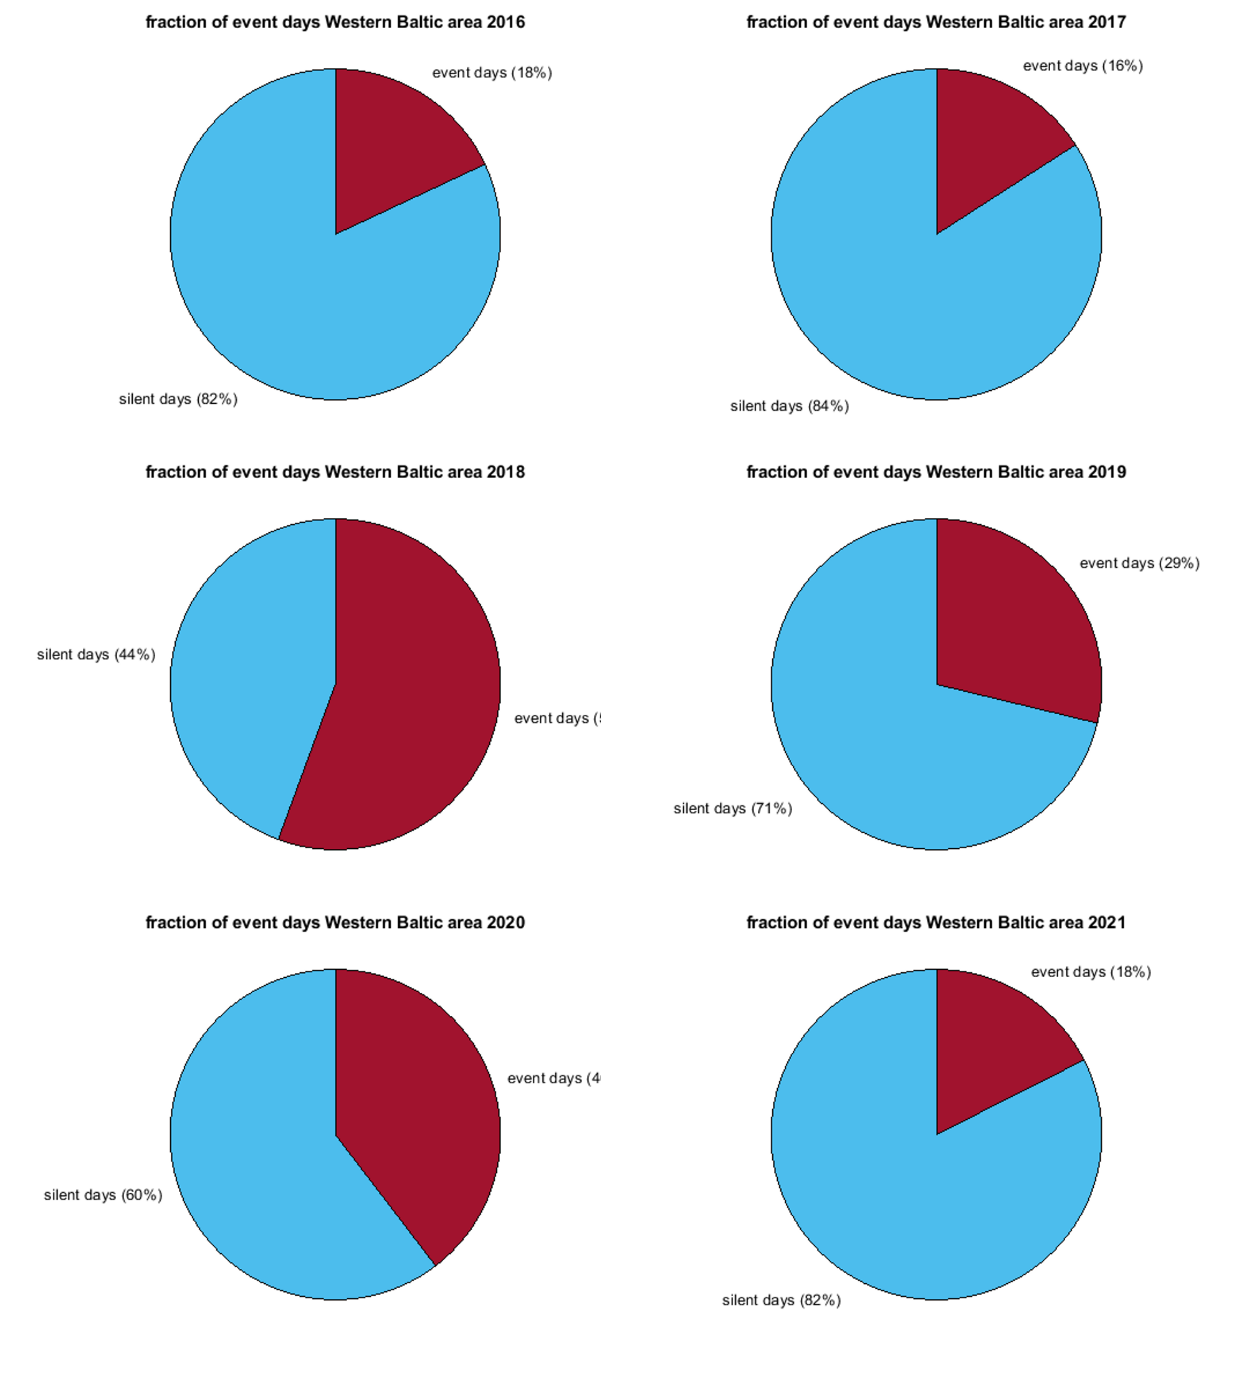
Figure 27. Number of Event Days and Silent Days in the Western Baltic area for each year.
The fraction of Event Days compared to Silent Days in the Western Baltic area for each year is shown in figure 27. As in the area southeast of Gotland, this fraction varies strongly over the years. The number of Event Days, however, is altogether higher in the Western Baltic area. The year with the highest fraction of Event Days is 2018, with a temporal exposure of about 56 % of the year. In none of the years, the fraction of Event Days is lower than 16 %.
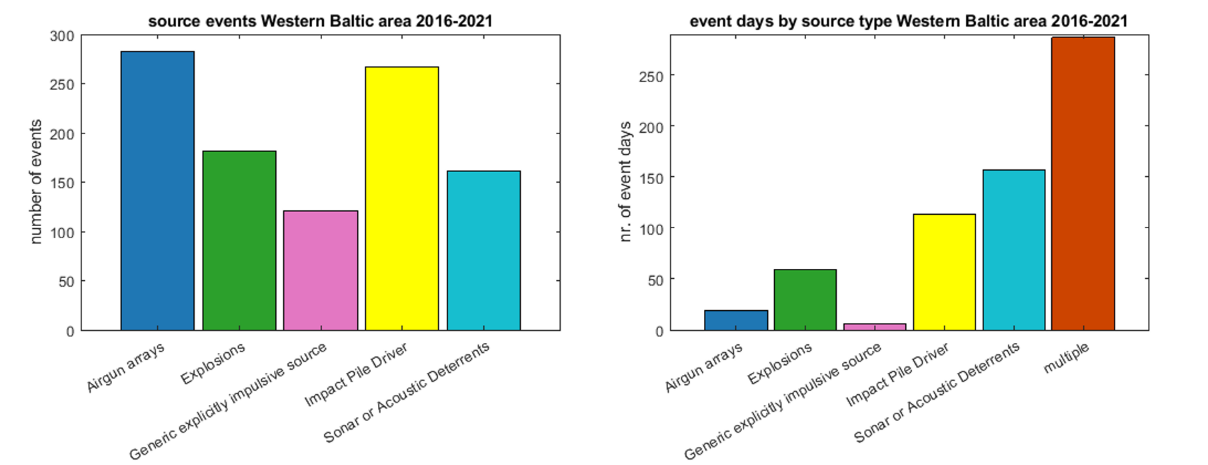
Figure 28. Source event types within the Western Baltic area. (Left) Number of events reported for each source type. (Right) Number of Event Days per source type. Days for which more than one source event type was reported count into category ‘multiple’. Note different y-axes.
Figure 28 shows the source event types of events and Event Days in the Western Baltic area. All source types were present, with most Event Days falling into the category ‘multiple’, i.e. for most Event Days more than one source event type was reported. Similar to the area southeast of Gotland, a high number of Event Days contained Sonar or Acoustic Deterrent events.

Figure 29. Value codes of events in the Western Baltic area. Left) Number of reported events per value code. Right) Fraction of Event Days with each value code, including Silent Days. Days for which events with different Value Codes were reported count into the highest category reported for that day.
In figure 29, the value codes of the events and Event Days in the Western Baltic area are shown. The events in this area span the whole range of value codes, with no events reported without value code (‘NA’). Apparently, several events of value code ‘high’ lasted longer than one day, thus the fraction of Event Days with value code ‘high’ is the largest.
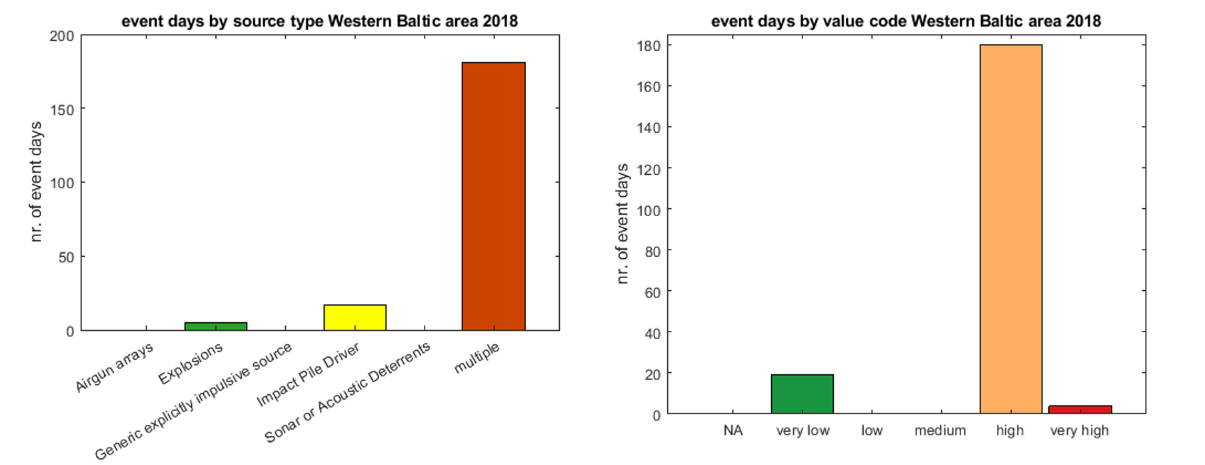
Figure 30. Event Days per source event type and per value code in the Western Baltic area for the year 2018. Left) Source events. Right) Value codes. Days for which events with different Value Codes were reported count into the highest category reported for that day.
Since 2018 was the year with the highest number of Event Days for the Western Baltic area, figure 30 shows the source event types and value codes of the Event Days in this year. The Event Days within the category ‘multiple’ here contain mostly Sonar and Acoustic Deterrents and Generic explicitly impulsive sources but also some airgun arrays and impact pile driving. It is apparent that on most Event Days in that year events of more than one source type occurred. The majority of Event Days fall into the value code-category ‘high’, a small number even into ‘very high’. This suggests that not only was the temporal exposure within the Western Baltic area high, but also the intensity of that exposure. This is consistent with the exposure-map shown in figure 17.
As mentioned above, the Western Baltic area considered here contains the summer eastern management border for the Belt Sea harbour porpoise. To assess whether there is a difference in exposure between the region of the Belt Sea population and the region shared with the Baltic Proper population, a separate analysis of these parts was done.
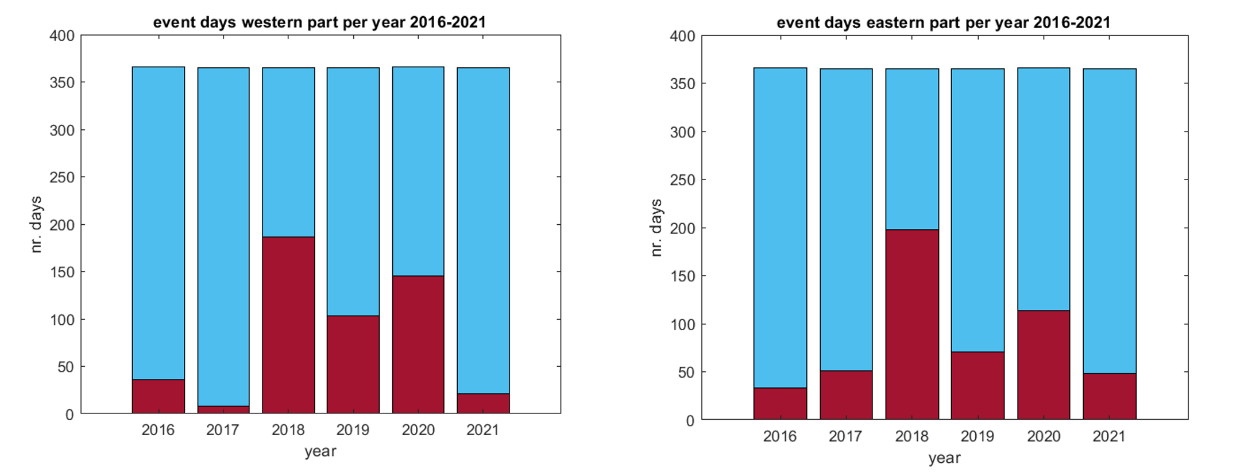
Figure 31. Event days and Silent Days per year in parts of the Western Baltic area. Left) Western part. Right) Eastern part.
As figure 31 shows, there is little difference between the area parts concerning the number of Event Days. In both parts, 2018 is the year with the highest temporal exposure. The overall number of Event Days is higher in the eastern part of the area, which is surprising since this part is smaller than the western part.
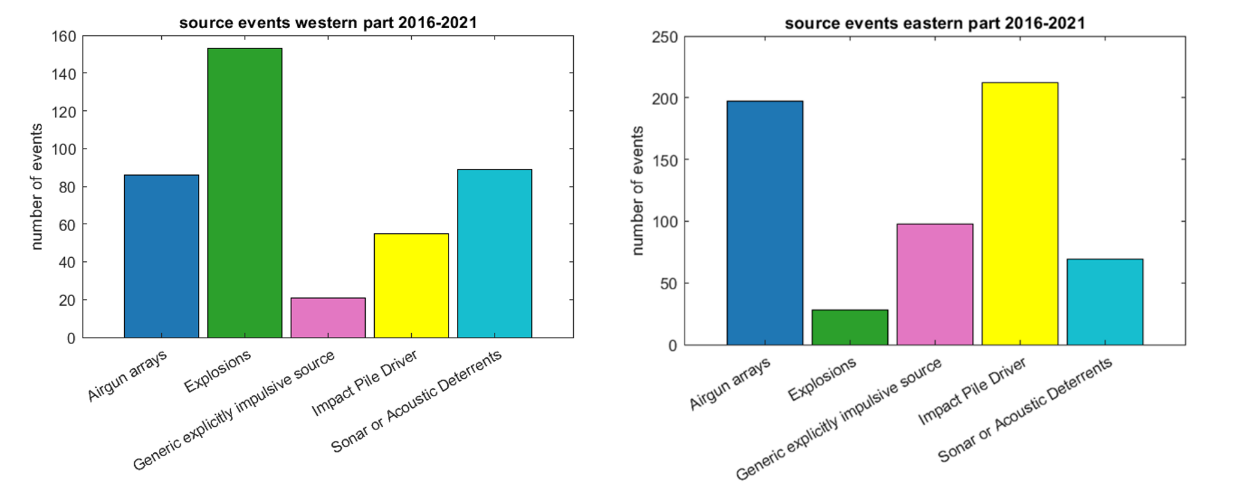
Figure 32. Events per source type in Western Baltic area. Left) Western part. Right) Eastern part. Note different y-axes.
Figure 32 shows the source event types reported for the two area parts. In both parts, all source event types were present; there is, however, a difference in the number of events for each source type. In the western part, many explosions took place, while in the eastern part the category for which the highest number of events was reported is impact pile driving. It is notable that high numbers of airgun array and Generic explicitly impulsive sources events were reported for this area. This suggests that a lot of seismic exploration took place there, especially within the eastern part.
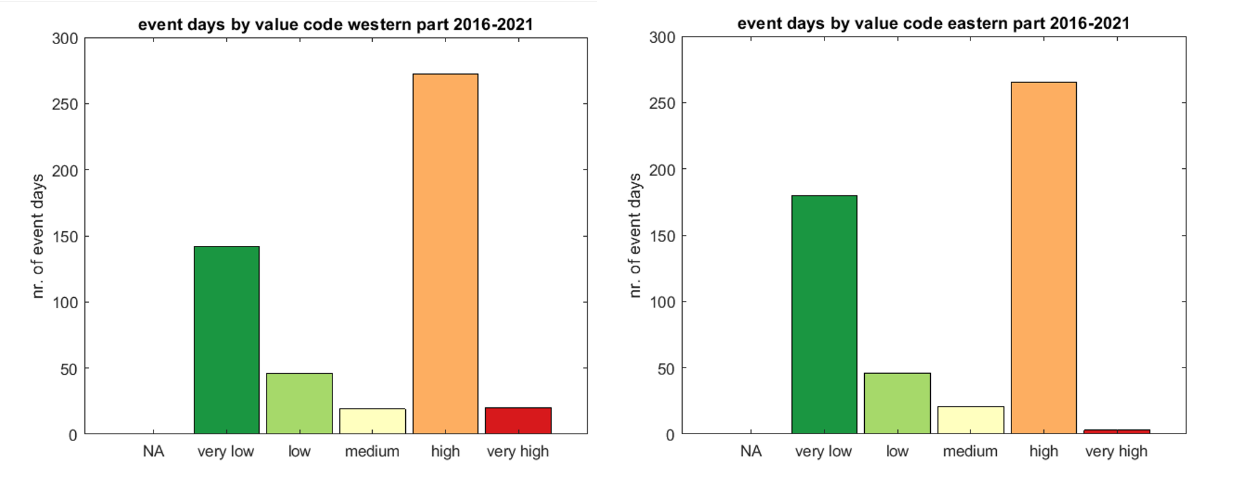
Figure 33. Event Days per value code in the Western Baltic area. (Left) Western part. (Right) Eastern part. Days for which events with different Value Codes were reported count into the highest category reported for that day.
The distribution of Event Days per value codes appears to be somewhat similar in both parts of the area, as figure 33 shows. In both areas, most Event Days fall into the category ‘very high’. There are, however, differences in the highest and lowest value code: while the eastern part contains more Event Days of the value code ‘very low’, the number of Event Days of the value code ‘very high’ is notably larger in the western part.
4.7 Spatio-temporal qualitative assessment of exposure for seals
Ringed seals are known to inhabit the Bothnian Bay, The Archipelago Sea, Gulf of Finland and Western Estonia, with distribution and abundance data being evaluated from coastal sightings derived from national monitoring. The peak moulting season for ringed seals in the Baltic is Mid-April, while they give birth to their pups between February and March. The lactation period lasts between 3 and 6 weeks like for the other two seal species in the Baltic, the harbour seal and the grey seal.
Grey seals also give birth to their pups between February and March and have their peak in moulting in late May up to early June. Grey seals inhabit the entire Baltic Sea and in the described periods they can be found along the south coast of Sweden and on Bornholm. The majority of grey seals are, however, located along the east coast of Sweden north of Gotland. Further habitats are Rødsand, the Kattegat, the islands north of the Gulf of Riga, the coast within the Gulf of Finland and the Gulf of Bothnia.
Harbour seals tend to have the most southern distribution of the Baltic Sea seal species. They occur mainly along the Swedish West coast, but also along the south coast of Sweden in addition to their distribution on the southern Islands of Denmark and the Kattegat. Moulting occurs in mid-August, mainly along the west coast of Sweden, but also along the southern Islands of Denmark (e.g. Loland, Falster) as well as on the Island of Läsö. A distinct subpopulation of harbour seals is known to inhabit the Swedish coast of Kalmarsund. Harbour seals give birth to their pups in June and have their peak moulting season during August.
For all three seal species mating starts after the lactation period. This period might be relevant to consider when assessing the impact of impulsive sound, since for all three species the males strongly vocalize in the range of a few hundred Hertz up to 5 kHz (ringed seals) in order to attract females.
It is difficult to assess the impact of impulsive noise on seal species, since there is sparse data concerning this topic. No data are found for ringed and grey seals, there is one study related to pile driving and the reaction of harbour seals by Russel et al. (2016). This study constitutes a significant reduction in harbour seal abundance in the radius of 25 km around the piling site. However, the study also describes this significant displacement to be restricted to the piling activity itself. The construction work around the piling is described to be non-significant in terms of displacement. Within two hours of cessation of pile driving, seals were distributed again as during the non-piling scenario. Importantly, it is to be mentioned that piling, which is referred to within the study, took place without noise mitigation systems. Sensitive times for the respective seal species should be considered during mating (because of males using vocalization) and the lactation period. The latter being important because females and their pups could be impacted if displacement occurs. Females especially rely on food resources during this period in order to produce milk of high fat content.
4.8 Overall status evaluation
No threshold value representative of GES has yet been agreed upon for the indicator due to ongoing parallel processes in the EU that have direct relevance to the MSFD and thus are important to consider in HELCOM indicator development.
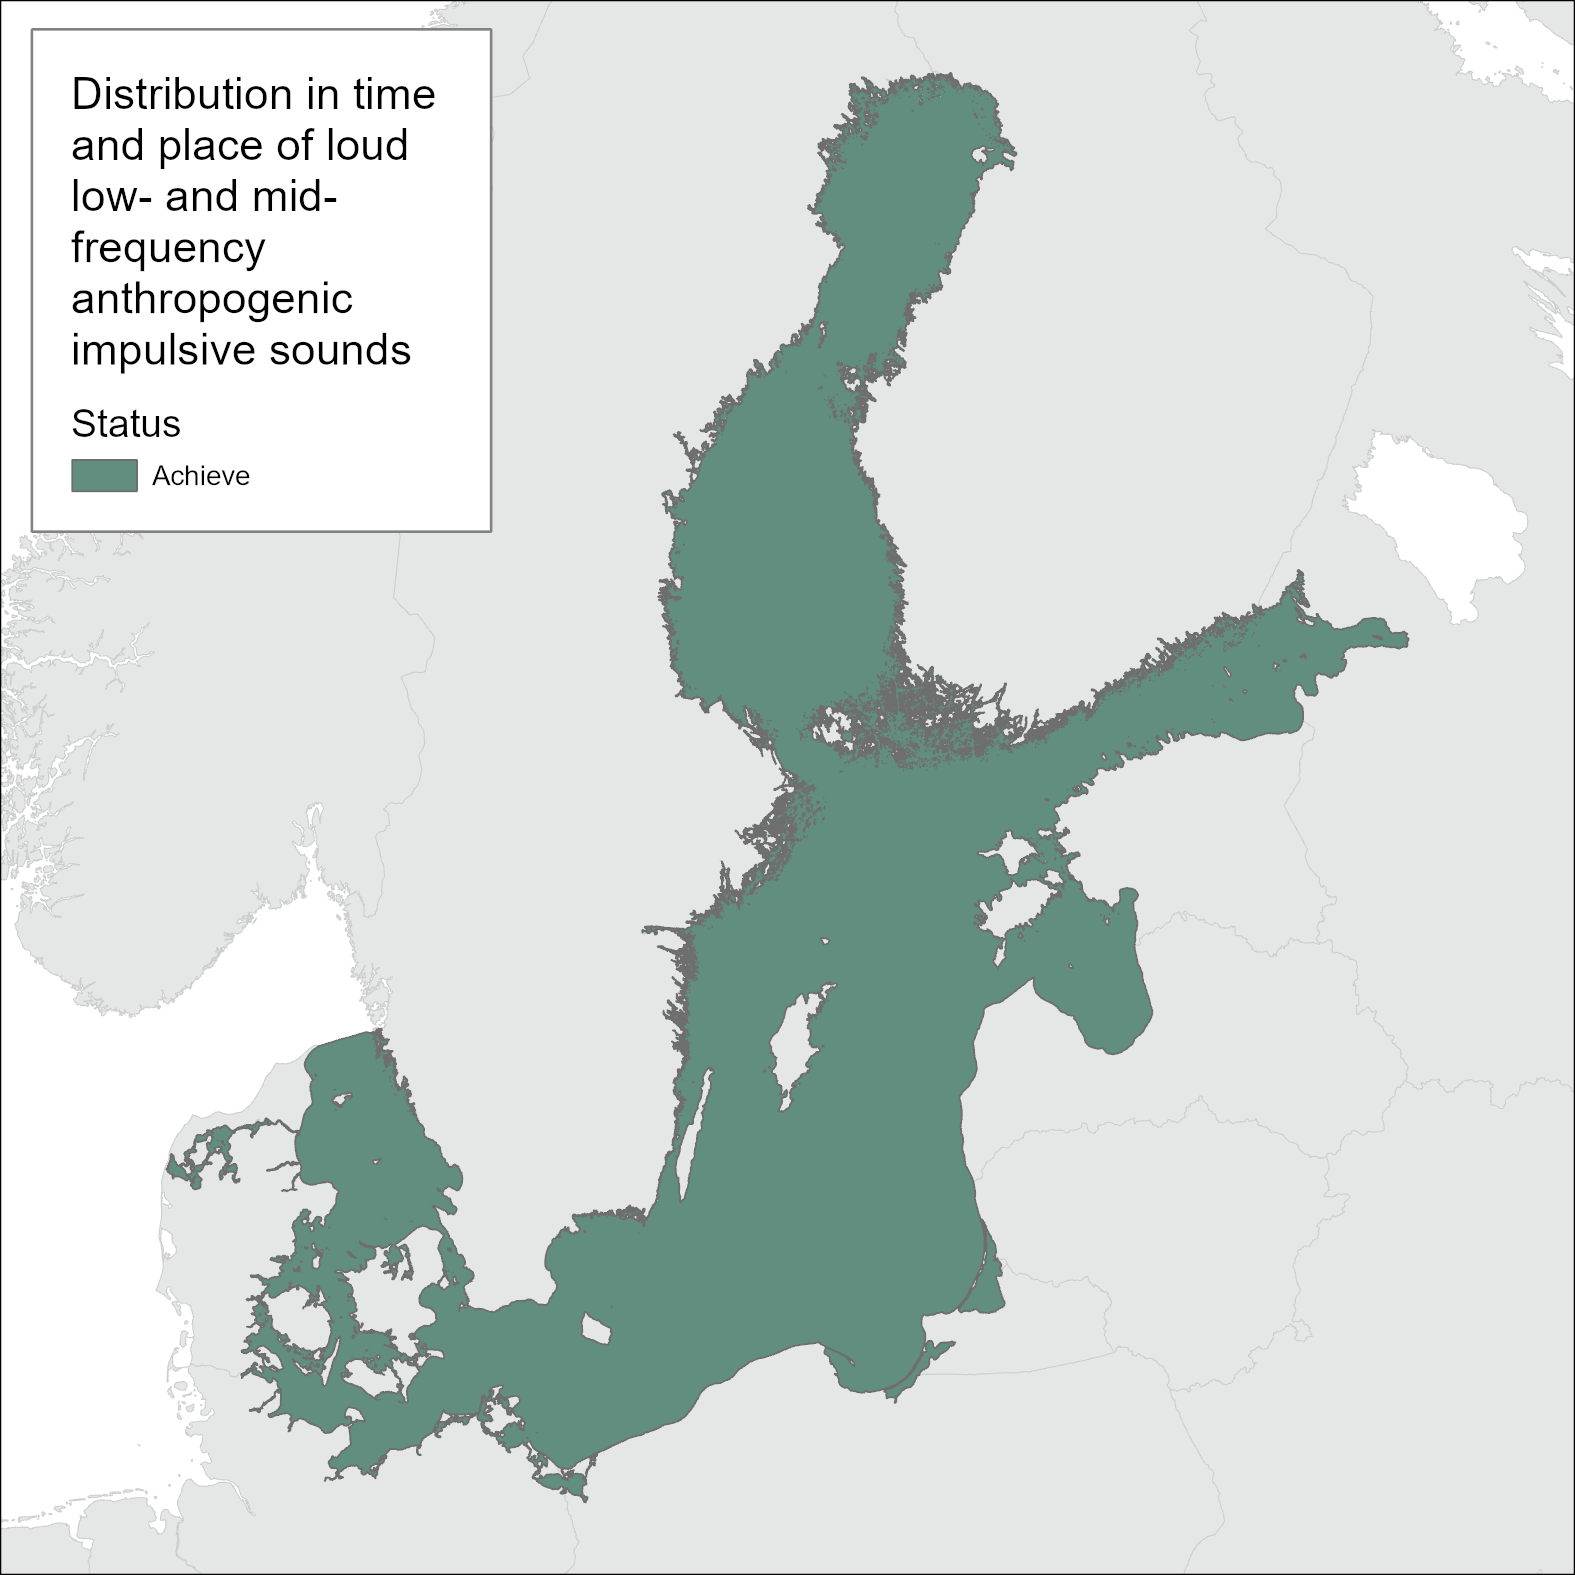
The current evaluation against preliminary threshold values and utilizing the available data reported to the Noise registry indicates that GES is achieved across the Baltic Sea region since less than 10% of the habitat area is exposed to noise levels that exceed LOBE levels (Level of Onset of Biological adverse Effects) and that any exceedances occur for less than 10% of the period (i.e. 2016-2021). Several aspects remain that require further improvement, as addressed under the confidence and future work sections. Thus, even though GES is achieved in this preliminary assessment, the difference in impact between mitigated and unmitigated events and areas of high temporary impact are still to be identified.
5 Confidence
The determination of threshold values is an ongoing process thus further work to approve and subsequently hone these parameters to be able to optimally define the Good Environmental Status (GES) will be needed in the future.
The monitoring programme for impulsive underwater noise implemented in the HELCOM region provides the data for evaluating exposure caused by anthropogenic impulsive underwater noise and the collected data is available in the HELCOM/OSPAR noise registry for assessment requirements in HELCOM. The monitoring of impulsive noise is regionally coordinated by HELCOM, while the responsibility for the completeness of the national reporting and for corresponding quality reviews of reported data lies with the HELCOM Contracting Parties.
The monitoring strategy for impulsive noise requires active reporting of the occurrence of corresponding noise generating activities and does not include any passive monitoring of impulsive noise signals. Therefore, the status of reporting completeness of impulsive noise events in the HELCOM noise registry cannot be quantified and the reported numbers of events might in theory represent a fraction of actual occurrences of events in the Baltic Sea. To assure strong and harmonised future data sets on which to base such evaluations it may be necessary to review and strengthen monitoring and reporting guidelines in the light of the findings from this first evaluation of impulsive noise in the HELCOM region.
The reason for possible data gaps in the indicator may be manifold. Activities, which sole purpose is defence or national security are exempt from the obligation to report. Still, countries are encouraged to report on these activities on a voluntary basis. Some activities may be conducted without being subject to a licensing procedure, limiting the possibilities of the responsible agencies to acquire information for reporting. A relevant source of gaps in reporting may be, that national procedures and reporting routines for impulsive noise events might not be fully implemented. Since submission regarding occurrences of impulsive noise events can be made for previous reporting periods, the data completeness for the indicator assessment can be improved at any time as soon as improved information becomes available.
A differentiation between the reason behind possible data gaps, and the transparent communication regarding the implications on uncertainty and the assessment results should be taken forward.
Despite this caveat of incomplete reporting of event numbers, the exceedance of biologically relevant levels of disturbed habitat of population, but also regarding intensity, duration, seasonal and spatial relevance of impulsive events could be evaluated for this indicator assessment.
Regular monitoring and reporting of impulsive noise to the regional noise registries was initiated in most HELCOM Contracting Parties in 2015. However, some data was already reported for the years between 2008-2014. Hence, for the purpose of this indicator assessment within the context of HOLAS3, it was possible to draw on a long time series of data reported to the regional noise registry, which covered the entire assessment period of HOLAS3.
Overall, the confidence in this indicator can be considered as moderate based on the current data availability.
6 Drivers, Activities, and Pressures
6.1 Strong link
There are a number of human activities that generate loud impulsive noise in the frequency range 10 Hz to 10 kHz. They can be divided into two types, those where the sound is a by-product of the main activity and those that deliberately use sound for their own purposes. Typical loud events that are recommended to be included in the registry are seismic airguns, underwater explosions, active sonars and pile driving (Dekeling et al., 2014b). Sonars and seismic airguns are examples where sound is an essential part of the activity (although the high frequency part of the air gun signals is not used in the analysis of the data, but may be the most significant source of impact for some species), while in pile driving and explosions sound is a by-product. Irrespectively of their purpose, these sources have the potential to induce large scale effects on the environment and, thus, should be monitored. It should be mentioned that the spatial and temporal characteristics of these sources can be very different and have to be considered when assessing their effects. For example, underwater explosions are solitary events (short duration) with extreme high energy level, whereas pile driving includes many consecutive single events (long duration) at energy levels that are low compared to explosions. Moreover, seismic survey activity may last several hours or days.
The spatial extent of impulsive noise sources varies primarily with the intensity of an activity but may also vary on average between different activities. Furthermore, the intensity of the impulsive noise sources largely determines the degree of adverse effects and the area associated with the noise input. This includes the potential for disturbance by impulsive noise events in general, and the additional potential for injury due to intense events such as explosions.
6.2 Weak link
The focus of the indicator has been on open waters. The Baltic Sea has long broken coastlines and in some areas, rich archipelagos. The near-shore areas are important for many species and used for foraging, mating, nursery and growing ground for juvenile fish. Human activities taking place on land near to the sea will generate sound that propagates into the sea. The effect of land-based activities, such as piling in harbors, has not been investigated and as a result is not included in the impact assessment. The link between the land- based sources and the effect on the environment is weak. Further investigations on this matter are needed.
Echo sounders for boats and ships operate at higher frequencies (above 10 kHz) and will fall outside the indicator’s frequency range that was set by the Commission and further explained by the EU TG Noise group (Van der Graaf et al., 2012). The indicator, de facto, will not deal with echo sounders as a potential source.
The frequency range defined by the indicator was developed with the Atlantic and the Mediterranean in mind where absorption of sound starts to play an important role for frequencies higher than 10 kHz. The Baltic Sea differs to the Atlantic in that the salinity is lower, which results in a lower absorption. Thus, comparable absorption is obtained at higher frequencies. Extending the frequency interval would broaden the list of loud sources that will be included in the registry. An appropriate frequency interval for the Baltic Sea has not been studied but should be re-assessed in the future.
7 Climate change and other factors
Underwater impulsive noise is a by-product of certain human activities and can also be limited to acceptable levels (or localised) by good planning/management and appropriate mitigation methods. These factors can result in sustainable use of the marine environment. Climate change and changes in management to respond or mitigate the impacts of it could have significant impact on noise levels in the marine environment. For example, coastal defence construction, changes in tourism or use of the marine environment and a move towards green technologies such as wind power may require construction and the by-product of such construction would be underwater noise. While no clear trends are possible to define here, other than an expected major increase in wind power development in the coming years, it is clear that such changes, especially if not carefully managed or mitigated, risk having a major impact on the marine environment.
8 Conclusions
The current evaluation against preliminary threshold values and utilizing the available data reported to the noise registry indicates that, on a daily basis, less than 10% the habitat area is exposed to noise levels that are known to cause temporary habitat loss, and that any exceedances of daily exposure occur for less than 10% of the period (i.e. 2016-2021).
Several aspects remain that require further improvement, as addressed under the confidence and future work sections. Thus, even though a generally tolerable status of the entire Baltic Sea Habitat is achieved in this assessment the difference in impact between mitigated and unmitigated events and areas of high spatially and temporary impact are still to be identified. Further work is required on the indicator not only to further develop threshold values but also to extend to other relevant species and improve the confidence in future assessments. Possible issues to address in future work and later iterations of the indicator are presented below. The indicator does, in its current form, identify that there are clear risks of impact on marine species from unmitigated, regular or extreme impulsive noise events but that the preliminary threshold values for where such occurrences would have an impact on species and habitat availability are currently not exceeded.
8.1 Future work or improvements needed
Future work is needed to further develop the threshold values and attain regional agreement on their application. Other pertinent issues that may support a more harmonised evaluation in the future include a review and evaluation of data reporting (i.e. if complete and if all required parameters are included), reporting on details related to mitigation methods employed, stronger scientific understanding of the link between noise and marine mammals or key sensitive species (especially seals), studies and evaluations across sensitive periods (e.g. breeding), and a more detailed confidence evaluation of the data and evaluation carried out. Other aspects that may be valid to discuss in the future, in particular for future HOLAS processes and compatibility with other assessments, could be to review the appropriate assessment scale for the indicator (e.g. link to 17 sub-basin or marine mammal management units) and even the value in carrying out an integrated assessment of underwater noise in which the overall pressure of impulsive and continuous noise can be presented overall.
9 Methodology
The pre-core indicator is still to be developed in a range of aspects in alignment with EU processes and taking into account regional specificities.
9.1 Scale of assessment
The indicator is evaluated using HELCOM assessment scale 1, which is the whole Baltic Sea area. The assessment units are defined in the HELCOM Monitoring and Assessment Strategy Annex 4.
9.2 Methodology applied
The assessment methodology for HOLAS3 is coordinated with related work under EU TG Noise and further aims at providing a link to biologically significant periods, relevant habitats and adverse effects such as injury and disturbance. A priority outcome of the assessment is a robust interpretation of results, in the presence of sparse and heterogeneous data of both, underwater noise and biota.
The approach for this indicator assessment is to exploit the highest spatial and temporal resolution of the reported impulsive noise events, while ensuring that all available data is included in the assessment in a coherent manner. Since impulsive noise events may be reported as point source or polygon information, the reported spatial extend of the source was used for the analysis of exposed area.
The effect range of the disturbance of the harbour porpoise according to each reported source was evaluated based on standardized and source specific effect ranges as detailed in Table 4. Results of the application of these effect ranges to the reported events are presented in figure 14 for each year. The same effect ranges were used to obtain the daily percentages of exposed area depicted in figure 21.
Table 4. Effect ranges for the assessment of harbour porpoise disturbance according to different sources.
| Source Event | Effect Range (km) |
| Airgun Arrays | 12 |
| Generic explicitly impulsive source | 12 |
| Impact Pile Driver mitigated | 12 |
| Impact Pile Driver non mitigated | 20 |
| Explosions | 20 |
| Sonar or Acoustic Deterrents | 20 |
The mandatory minimum temporal resolution for reported impulsive noise events included in the information is one day, while voluntary information on the exact duration was reported for a minority of events only. For the purpose of a coherent integration of all reported impulsive noise events, this indicator assessment of the pressure distribution in time and space due to impulsive noise utilizes a standardized temporal resolution of 24 hours (one pulse block day).
Events for which the duration extends over several days are considered as pressure contribution on each of the affected days. Events with a duration of less than a day are considered as pressure contribution on the affected day.
9.3 Monitoring and reporting requirements
Monitoring methodology
See monitoring programme.
Monitoring of underwater noise is described on a general level in the HELCOM Monitoring Manual, in the monitoring topic ‘Underwater noise’ sub-programme ‘Registry of impulsive sounds’.
The purpose of the indicator is to provide an overview of all loud impulsive low and mid-frequency sound sources, through the year and through areas. This will enable HELCOM members to get an overview of the overall pressure from these sources. To achieve this target all relevant sources need to be monitored and registered.
Current monitoring
See monitoring programme and noise registry
Description of optimal monitoring
Impulsive noise monitoring requires a clear delineation of the spatial and temporal scale considered which is optimally included in the design of the noise registry, as well as detailed specifications on the parameters to be delivered and detailed descriptions of how the data are to be processed. This is now given, since HELCOM agreed on establishing a common regional registry hosted by ICES.
10 Data
In 2015 a common registry for impulsive sound events for HELCOM and OSPAR hosted by ICES was appointed. The aim of the common registry is to fulfil the requirements set by HELCOM and OSPAR on their respective assessments and support the implementation of the EU MSFD regarding the indicator 11.2.1 for those HELCOM and OSPAR countries being EU member states.
Result: Impulsive noise – polygon
The data reported to the regional impulsive noise registry provides the relevant data basis for the HOLAS3 assessment. Currently, the occurrence of impulsive noise from the following activities is reported to the regional noise registry by Contracting Parties on an annual basis:
Table 5. Activities as reported to the regional noise registry and corresponding minimum level category that triggers the entry into the noise registry.
| Source type | Minimum level category of events to trigger an entry into the noise registry |
| Explosions | mTNTeq > 8g |
| Airgun arrays | SLz-p > 209 dB re 1 μPa m |
| Impact pile driver | hammer energy > 0 kJ |
| Sonar or acoustic deterrents | SL > 176-200 dB re 1 μPa m |
| Generic explicitly impulsive source | ESL > 186 dB re 1 μPa² m² s |
The registry includes well-defined metadata of impulsive sound events on a mandatory basis and offers the possibility to optionally include processed data on the events, like measured sound exposure levels and type of technical mitigation measures applied.
Information to be provided is either mandatory (i.a. latitude/longitude of the station) or optional (i.a. types of mitigation measures). The following tables (Table 6 and 7) compile the reporting format to be used to load data to the registry. The reporting of data included in Table 6 is mandatory and in Table 7 optional.
Spatial component of sound event data
Event locations can be reported as geographic point source locations (i.e. latitude, longitude and geometry type) or as polygon-IDs. When reported as point location, the exact coordinates of the event are available. The polygon-IDs of events reported as such refer to specific ICES-polygons, pre-defined map rectangles with individual IDs. Polygon source data can be reported in two ways: by entering the Latitude and Longitude of the centroid of the polygon and selecting the appropriate polygon type from ‘Geometry_type’, or alternatively, an identifier for the polygon can be reported in the ‘Polygon_ID’ column. Additionally, events reported by the German military on a voluntary basis are reported in the specific polygon format of German Naval Tiles. To avoid strongly overestimating the exposed area due to these events, the geometric centroid of the intersection of the respective naval tile with the German EEZ was assigned as location of the explosions that were reported for that tile. Since the number of explosions for each naval tile was reported, that number was included in the statistical analysis of the numbers of reported events. To avoid overestimating the exposed time, in the statistical analysis considering Event Days, the days within the time period of 08/28/2019 to 08/31/2019 were assigned as Event Days to the aforementioned locations. This time period was inferred solely from publicly available information (https://www.bfn.de/sites/default/files/BfN/meeresundkuestenschutz/Dokumente/Minensprengungen_im_Fehmarnbelt/gesamtbewertung_fehmarnbelt_minensprengungen.pdf).
Temporal component of sound event data:
The start and end dates of the events must be reported, including the year in which they occurred. Some of the reported events are single events (e.g. a single explosion), others contain multiple sound pulses (e.g. pile driving or seismic surveys). Events may have an effective duration of less than a day or extend over several days.
Impulsive noise event level information of anthropogenic impulsive sound event data
For each source type, a range of five Value Codes ranging from very low to very high can be associated to the reported events based on the sound pressure or energy of the source. There is, however, a number of events for which the Value Code was not reported.
Other mandatory information included in the noise registry:
Regarding sound mitigation, it is mandatory to report if technical noise mitigation/abatement measures were applied.
Additional voluntary information included in the noise registry:
Information on the type of mitigation measures applied, whether sound measurements were recorded, and if so, which parameters of the sound pressure levels were measured (e.g. sound exposure level, source spectrum), can be reported on a voluntary basis. Since this information was reported only for a minority of events, these parameters could not be evaluated.
The reporting format to be used to upload data to the portal is available to download in the data portal. It consists of an Excel file that converts data to an XML file that can be uploaded to the database.
Table 6. Reporting format to be used to load compulsory data to the registry.
| Column header | Content |
| Country (ISO 1366 code) | The country where the source was registered. Codes are provided in the ‘vocabularies’ spreadsheet |
| Organization (EDMO code) | Organization who is reporting the data. EDMO codes (European Directory of Marine Organisations) are provided in the ‘vocabularies’ spreadsheet |
| Start_date (ddmmyyyy) | Start date of the detection in YYYYMMDD format |
| End_date (ddmmyyyy) | End date of the detection in YYYYMMDD format |
| Latitude (WGS84) | To report point source data. The latitude of the detection in decimal degrees, using WGS84 |
| Longitude (WGS84) | To report point source data.The longitude of the detection in decimal degrees, using WGS84 |
| Geometry_type (Point, UK license blocks, ICES sub-rectangles, German naval polygon) | Please see explanation above |
| Polygon_ID (ICES sub-rectangle ID or Regional Polygon ID) | Please see explanation above |
| Source_event (vocab list) | One of these options is to be chosen based on the source of the event (also provided in the ‘vocabularies’ sheet and in ICES website):
|
| Value (from list: NA/very_low/low/medium/high/very_high) | One of these options is to be chosen based on the source and duration of the event (also provided in the ‘vocabularies’ sheet and in ICES website): not available, very low, low, medium, high or very high. | |
| – Airgun arrays: | ||
| NA | Not available | |
| Very low | 209-233 dB re 1 μPa m | |
| Low | 234-243 dB re 1 μPa m | |
| Medium | 244-253 dB re 1 μPa m | |
| High | 253 dB re 1 μPa m | |
| – Explosions: | ||
| NA | Not available | |
| Very low | 8g – 210g | |
| Low | 220g – 2,1kg | |
| Medium | 2,11kg – 21kg | |
| High | 22kg – 210kg | |
| Very high | 210kg and above | |
| – Generic explicitly impulsive source: | ||
| NA | Not available | |
| Very low | 186-210 dB re 1 μPa2 m2s | |
| Low | 211-220 dB re 1 μPa2 m2s | |
| Medium | 221-230 dB re 1 μPa2 m2s | |
| High | 230 dB re 1 μPa2 m2s and above | |
| – Impact pile driver: | ||
| NA | <280kJ | |
| Very low | 290kJ – 2,8MJ | |
| Low | 2,81MJ – 28MJ | |
| Medium | >28MJ | |
| High | ||
| – Sonar or acoustic deterrents: | ||
| NA | Not available | |
| Very low | 176-200 dB re 1 μPa m | |
| Low | 201-210 dB re 1 μPa m | |
| Medium | 211-220 dB re 1 μPa m | |
| High | 220 dB re 1 μPa m and above | |
| Sound_mitigation_bool (yes/no) | Choose ‘yes’ or ‘no’. | |
Table 7: Reporting format to be used to load optional data to the registry.
| Column header | Content | |
| NMS_type (from list: BBC/SBC/IHC/HSD/HEP/COF/ CBBCIHC/CBBCHSD/CBBCCOF
/Other) |
Types of noise mitigation systems (NMS) to be chosen among these options: | |
| BBC | Big Bubble Curtain | |
| SBC | Small Bubble Curtain | |
| IHC | I H C – Noise Mitigation System | |
| HSD | HydroSoundDamper | |
| HEP | Pile-in-Pile Jacket | |
| COF | Cofferdamm | |
| CBBCIHC | Combined BBC and I H C-NMS | |
| CBBCHSD | Combined BBC and HSD | |
| CBBCCOF | Combined BBC and Cofferdamm | |
| Other | Other system or other combination | |
| Sound_measurement_bool (yes/no) | Choose ‘yes’ or ‘no’. | |
| SEL (dB re 1µPa²s) | Sound Exposure Level expressed in dB re 1 µPa²s | |
| Lpeak (dB re 1µPa) | Peak Level expressed in dB re 1 µPa²s | |
| Distance_to_pile (metres, decimal) | Distance to the pile | |
| Type_hammer (Model number of hammer used, e.g. S-2000, 3000S) | Model of the hammer used | |
| Max_energy (Kj) | Maximum energy reached during the event | |
| Source_Spectra (UNIT to be determined) | The frequency band of the event (format to be determined) | |
| Duty_cycle (decimal) | The percentage of the duration the signal was active | |
| Start_time (hhmm) | Start time of the event transmission | |
| Duration (seconds, integer) | The duration of the event in seconds | |
| Directivity (decimal) | A Q value representing the directivity of the sound source | |
| Source_depth (metres, decimal) | Approximate depth, in metres, of the sound source | |
| Platform_speed (Knots, decimal) | Speed of the platform recording the event | |
| Remarks (free text) | Any free text comments or additional supporting information | |
11 Contributors
Carina Juretzek, Katharina Grunert, Ramona Eigenmann, Benedikt Niesterok, Isabella Kratzer, Maria Boethling, Jakob Tougaard, Okko Outinen, Mathias Andersson, Emilia Lalander.
HELCOM Expert Group on Underwater Noise (HELCOM EG Noise).
HELCOM Secretariat: Marta Ruiz.
12 Archive
This version of the HELCOM core indicator report was published in April 2023:
The current version of this indicator (including as a PDF) can be found on the HELCOM indicator web page.
This is the first iteration of this indicator and there are currently no previous full versions.
13 References
Andrew, R. K., Howe, B. M., Mercer, J. A., & Dzieciuch, M. A. 2002. Ocean ambient sound: comparing the 1960s with the 1990s for a receiver off the California coast. Acoustics Research Letters Online, 3: 65-70.
ASCOBANS, 2009. ASCOBANS Resolution 6.2 on Adverse Effects of Underwater Noise on Marine Mammals during Offshore Construction Activities for Renewable Energy Production.
Au & Hastings, 2008. Principles of Marine Bioacoustics. Springer Science+Business Media, New York, 679 pp, hardbound, 99 USD, ISBN 978-0-387-78364-2.
Bolle, L.J., de Jong, C.A.F., Bierman, S.M., van Beek, P.J.G., van Keeken, O.A., m.fl. 2012. Common Sole Larvae Survive High Levels of Pile-Driving Sound in Controlled Exposure Experiments. PLoS ONE 7(3): e33052. doi:10.1371/journal.pone.0033052.
Brandt, M. A.C. Dragon, A. Diederichs, A. Schubert, V. Kosarev, G. Nehls, V. Wahl, A. Michalik, A. Braasch, C. Hinz, C. Ketzer, D. Todeskino, M. Gauger, M. Laczny, W. Piper. 2016. Effects of Offshore pile driving on harbour porpoise abundance in the German Bight – Assessment of Noise Effects. Study based on monitoring data of offshore wind farms in the German EEZ, OFW, 246 p., under: http://bioconsult- sh.de/site/assets/files/1573/1573.pdf.
Brandt, M. J., Dragon, A. C., Diederichs, A., Bellmann, M.A., Wahl, V., Piper, W., Nabe-Nielsen, J., Nehls, G. 2018. Disturbance of harbour porpoises during construction of the first seven offshore wind farms in Germany. Mar Ecol. Progr. Ser. 506, 213-232.
Brandt, M. J., Diederichs, A., Betke, K., and Nehls, G. 2011. “Responses of harbour porpoises to pile driving at the Horns Rev II offshore wind farm in the Danish North Sea,” Mar. Ecol. Prog. Ser. 421, 205-216.
Brandt, M. J., Höschle, C., Diederichs, A., Betke, K., Matuschek, R., Witte, S., and Nehls, G. 2013. “Far-reaching effects of a seal scarer on harbour porpoises, Phocoena phocoena,” Aquatic Conservation: Marine and Freshwater Ecosystems 23, 222-232.
Caltrans (California Department of Transportation). 2004. Fisheries and hydroacoustic monitoring program compliance report for the San Francisco-Oakland Bay Bridge east span seismic safety project. Strategic Environmental Consulting, Inc. and Illingworth and Rodkin, Inc. June.
Carlén, I., Thomas, L., Carlström, J., Amundin, M., Teilmann, J., Tregenza, N., Tougaard, J., Koblitz, J.C., Sveegaard, S., Wennerberg, D., Loisa, O., Dähne, M., Brundiers, K., Kosecka, M., Anker Kyhn, L., Tiberi Ljungqvist, C., Pawliczka, I., Koza, R., Arciszewski, B., Galatius, A., Jabbusch, M., Laaksonlaita, J., Niemi, J., Lyytinen, S., Gallus, A., Benke, H., Blankett, P., Skóra, K.E., Acevedo-Gutiérrez, A. 2018. Basin-scale distribution of harbour porpoises in the Baltic Sea provides basis for effective conservation actions. Biological Conservation 226, 42-53.
Casper, B.M., Halvorsen, M.B., Matthews, F., Carlson, T.J., Popper, A.N. 2013. Recovery of barotrauma injuries resulting from exposure to pile driving sounds in two sizes of hybrid striped bass. PLoS ONE 8(9):e73844.
Casper, B.M., Popper, A.N., Matthews, F., Carlson, T.J., Halvorsen, M.B. 2012. Recovery of barotrauma injuries in Chinook salmon, Oncorhynchus tshawytscha from exposure to pile driving sound. PLoS ONE 7(6):e39593.
CBD, 2012. UNEP/CBD/SBSTTA/16/INF/12. Scientific synthesis on the impacts of underwater noise on marine and coastal biodiversity and habitats.
Debusschere, E., De Coensel, B., Bajek, A., Botteldooren, D., Hostens, K. 2014. In Situ Mortality Experiments with Juvenile Sea Bass (Dicentrarchus labrax) in Relation to Impulsive Sound Levels Caused by Pile Driving of Windmill Foundations. PLoS ONE 9(10): e109280. doi:10.1371/ journal.pone.0109280.
Dekeling, R.P.A., Tasker, M.L., Ainslie, M.A., Andersson, M., André, M., Castellote, M., Borsani, J.F., Dalen, J., Folegot, T., Leaper, R., Liebschner, A., Pajala, J., Robinson, S.P., Sigray, P., Sutton, G., Thomsen, F., Van der Graaf, A.J., Werner, S., Wittekind, D. and Young, J.V. 2014a. Monitoring Guidance for Underwater Noise in European Seas. 2nd Report of the Technical Subgroup on Underwater noise (TSG Noise). Part I – Executive Summary. Interim Guidance Report. 12pp.
Dekeling, R.P.A., Tasker, M.L., Ainslie, M.A., Andersson, M., André, M., Castellote, M., Borsani, J.F., Dalen, J., Folegot, T., Leaper, R., Liebschner, A., Pajala, J., Robinson, S.P., Sigray, P., Sutton, G., Thomsen, F., Van der Graaf, A.J., Werner, S., Wittekind, D. and Young, J.V. 2014b. Monitoring Guidance for Underwater Noise in European Seas – 2nd Report of the Technical Subgroup on Underwater noise (TSG Noise). Part II Monitoring Guidance Specifications. Interim Guidance Report. 26pp.
Dekeling, R.P.A., Tasker, M.L., Ainslie, M.A., Andersson, M., André, M., Castellote, M., Borsani, J.F., Dalen, J., Folegot, T., Leaper, R., Liebschner, A., Pajala, J., Robinson, S.P., Sigray, P., Sutton, G., Thomsen, F., Van der Graaf, A.J., Werner, S., Wittekind, D. and Young, J.V. 2014c. Monitoring Guidance for Underwater Noise in European Seas – 2nd Report of the Technical Subgroup on Underwater noise (TSG Noise). Part III Background Information and Annexes. Interim Guidance Report. 66pp.
Doksæter, L., Handegard, N. O., Godø, O. R. 2012. Behavior of captive herring exposed to naval sonar transmissions (1.0–1.6 kHz) throughout a yearly cycle. J. Acoust. Soc. Am. 131 (2), 1632–1642.
Engås, A., Løkkeborg, S., Ona, E., Soldal, A.V. 1996. Effects of seismic shooting on local abundance and catch rates of cod (Gadus morhua) and haddock (Melanogrammus aeglefinus). Canadian journal of fisheries and aquatic science 53:2238-2249.
European Commission. 2007. Guidelines for the establishment of the Natura 2000 network in the marine environment. Application of the Habitats and Birds Directives. Available at: http://ec.europa.eu/environment/nature/natura2000/marine/docs/marine_guidelines.pdf.
EU. 2011. EU Guidance on wind energy development in accordance with the EU nature legislation. Available at: http://ec.europa.eu/environment/nature/natura2000/management/docs/Wind_farms.pdf.
Govoni, J. J.; West, M.A.; Settle, L. R., Lynch, R.T., Greene, M.D. 2008. Effects of underwater explosions on larval fish: implications for a coastal engineering project. Journal of Coastal Research, 24i, 2B), 228-233.
Govoni, J. J., Settle, L. R., West, M. A. 2003. Trauma to Juvenile Pinfish and Spot Inflicted by Submarine Detonations, Journal of Aquatic Animal Health, 15:2, 111-119.
Halvorsen, M.B., Casper, B.M., Woodley, C.M., Carlson, T.J., Popper, A.N. 2012a. Threshold for onset of injury in Chinook salmon from exposure to impulsive pile driving sounds. PLoS ONE 7(6):e38968.
Halvorsen, M.B., Casper, B.C., Matthews, F., Carlson, T.J., Popper, A.N. 2012b. Effects of exposure to pile driving sounds on the lake sturgeon, Nile tilapia, and hogchoker. Proc Roy Soc B 279:4705–4714.
Hastings, M. C., Popper, A. N., Finneran, J. J. & Lanford, P. J. 1996. Effect of low-frequency underwater sound on hair cells of the inner ear and lateral line of the teleost fish. Journal of the Acoustical Society of America 99, 1759– 1766.
Hawkins, A.D., Roberts, L., Cheesman, S. 2014. Responses of freeliving coastal pelagic fish to impulsive sounds. J Acoust Soc Am 135:3101-3116.
HOD, 2021. Outcome of the 61st Meeting of the Heads of Delegation (HOD 61-2021). Available at https://portal.helcom.fi/meetings/HOD%2061-2021-896/MeetingDocuments/Outcome%20of%20HOD%2061-2021.pdf
HELCOM, 2019. Noise sensitivity of animals in the Baltic Sea. Baltic Sea Environment Proceedings N° 167 Available at https://www.helcom.fi/wp-content/uploads/2019/08/BSEP167.pdf.
Hermannsen, L., Mikkelsen, L., and Tougaard, J. 2015. “Review: Effects of seal scarers on harbour porpoises. Research note from DCE – Danish Centre for Environment and Energy,” (Aarhus University, Roskilde, Denmark).
Johnston, D. W. 2002. “The effect of acoustic harassment devices in harbour porpoises (Phocoena phocoena) in the Bay of Fundy, Canada,” Biol.Conserv. 108, 113-118.
Jörgensen, R., Olsen, K.K., Falk-Petersen, I-B., Kanapthippilai, P. 2005. Investigation of potential effects of low frequency sonar signals on survival, development and behavior of fish larvae and juvenils. Report from Norwegian College of Fishery Science.
Kastelein, R. A., Gransier, R., Marijt, M. A. T., and Hoek, L. 2015a. “Hearing frequency thresholds of harbor porpoises (Phocoena phocoena) temporarily affected by played back offshore pile driving sounds,” J. Acoust. Soc. Am. 137, 556-564.
Kastelein, R. A., Gransier, R., Schop, J., and Hoek, L. 2015b. “Effects of exposure to intermittent and continuous 6–7 kHz sonar sweeps on harbor porpoise (Phocoena phocoena) hearing,” J. Acoust. Soc. Am. 137, 1623-1633.
Kastelein, R. A., Hoek, L., Gransier, R., Rambags, M., and Clayes, N. 2014. “Effect of level, duration, and inter-pulse interval of 1-2kHz sonar signal exposures on harbor porpoise hearing,” J. Acoust. Soc. Am. 136, 412-422.
Kastelein, R. A., Gransier, R., Hoek, L., and Rambags, M. 2013a. “Hearing frequency thresholds of a harbor porpoise (Phocoena phocoena) temporarily affected by a continuous 1.5 kHz tone,” J. Acoust. Soc. Am. 134, 2286- 2292.
Kastelein, R. A., Gransier, R., van den Hoogen, M., and Hoek, L. 2013b. “Brief behavioral response threshold levels of a harbor porpoise (Phocoena phocoena) to five helicopter dipping sonar signals (1.33 to 1.43 kHz),” Aquat. Mamm. 39, 162-173.
Kastelein, R. A., Steen, N., Gransier, R., Wensveen, P. J., and de Jong, C. A. F. 2012. “Threshold received sound pressure levels of single 1-2 kHz and 6-7 kHz up-sweeps and down-sweeps causing startle responses in a harbor porpoise (Phocoena phocoena),” J. Acoust. Soc. Am. 131, 2325-2333.
Kastelein, A., Heul, S., Verboom, W.C., Jennings, N., Veen, J., Haan, D. 2008. Startle response of captive North Sea fish species to underwater tones between 0.1 and 64 kHz. Elsavier. Marine Environmental Research 65:369-377.
Ketten, D. 1995. “Estimates of blast injury and acoustic trauma zones for marine mammals from underwater explosions,” in Sensory systems of aquatic mammals, edited by R. A. Kastelein, J. A. Thomas, and P. E. Nachtigall (de Spil Publishers, Woerden, the Netherlands), pp. 391-407.
Knutsen, G.M., Dalen, J. 1985. Skadeeffekter på egg, larver og yngel fra seismiske undersokelser. Havforskningsinstituttet, rapp. nr. FO 8505, Bergen. 26 s.
Lucke, K., Siebert, U., Lepper, P. A., and Blanchet, M.-A. 2009. “Temporary shift in masked hearing thresholds in a harbor porpoise (Phocoena phocoena) after exposure to seismic airgun stimuli,” J. Acoust. Soc. Am. 125, 4060-4070.
Løkkeborg, S., Ona, E., Soldal, A., Salthaug, A. 2012. Effects of sounds from seismic airguns on fish behavior and catch rates. In: Popper AN, Hawkins AD (eds) The effects of noise on aquatic Life.Springer Science + Business Media, New York, p 415-419.
McCauley, R. D., Fewtrell, J. & Popper, A. N. 2003. High intensity anthropogenic sound damages fish ears. Journal of the Acoustical Society of America 113, 638–642.
McDonald, M. Hildebrand, J. and Wiggins, S. 2006. Increases in deep ocean ambient noise in the Northeast Pacific west of San Nicolas Island, California. Journal of the Acoustical Society of America, 120: 711-718.
Mikkelsen, L., Hermannsen, L., and Tougaard, J. 2015. “Effect of seal scarers on seals. Literature review for the Danish Energy Agency,” (Aarhus University, DCE, Roskilde), p. 19.
MSFD Advice Manual and Background document on Good environmental status – Descriptor 11: Underwater noise, 2012.
Nedwell, J.R., Turnpenny, A.W.H., Lovell, J., Parvin, S.J., Workman, R., Spinks, J.A.L., Howell, D. 2007. A validation of the dBht as a measure of the behavioural and auditory effects of underwater noise. Subacoustech Report No. 534R1231.
Nedwell, J.R., Turnpenny, A. W. H., Langworthy, J. W., Edwards, B. 2003. Measurements of underwater noise during piling at the Red Funnel Terminal, Southampton, and observations of its effect on caged fish. Science Report (Subacustech) Nr. 558R0207, 33 pp.
Nehls, G., A. Rose, A. Diederichs, M. Bellmann, and H. Pehlke. 2016. Noise Mitigation During Pile Driving Efficiently Reduces Disturbance of Marine Mammals. In: A.N. Popper, A. Hawkins (eds.), The Effects of Noise on Aquatic Life II, Advances in Experimental Medicine and Biology 875, DOI 10.1007/978-1-4939-2981-8_92.
Olesiuk, P. F., Nichol, L. M., Sowden, M. J., and Ford, J. K. B. 2002. “Effect of the sound generated by an acoustic harassment device on the relative abundance and distribution of harbor porpoises (Phocoena phocoena) in Retreat Passage, British Columbia,” Mar. Mamm. Sci. 18, 843-862.
Piha, H and Zampoukas, J. 2011. Review of Methodological Standards Related to the Marine Strategy Framework Directive Criteria on Good Environmental Status, JRC. Available at: http://publications.jrc.ec.europa.eu/repository/bitstream/111111111/16069/1/lbna24743enn.pdf.
Popper, A. N., Hawkins, A. D., Fay, R., Mann, D., Bartol, S., Carlson, T. J., Coombs, S., Ellison, W.T., Gentry R. L., Halvorsen, M. B., Løkkeborg, S., Rogers, P. H., Southall, B. L., Zeddies, D. G., Tavolga, W.N. 2014. ASA S3/SC1.
4 TR-2014 Sound Exposure Guidelines for Fishes and Sea Turtles: A Technical Report Prepared by ANSI-Accredited Standards Committee S3/SC1 and Registered with ANSI. Springer.
Popper, A. N., Halvorsen, M. B., Kane, A. S., Miller, D. L., Smith, M. E. Song, J., Stein, P. & Wysocki, L. E. 2007. The effects of high-intensity, low-frequency active sonar on rainbow trout. Journal of the Acoustical Society of America 122, 623–635.
Popper, A.N., Smith, M.E., Cott, P.A.m.fl. 2005. Effects of exposure to seismic airgun use on hearing of three fish species. J Acoust Soc Am 117:3958-3971.
Popper, A. N. 2003. Effects of anthropogenic sounds on fishes. Fisheries, 28 (10): 24–31.
Rose, A., A. Diederichs, G. Nehls, M. Brandt, S. Witte, C. Höschle, M. Dorsch, T. Liesejohahn, A. Schubert, V. Kosarev, M. Laczny, A. Hill, W. Piper. 2014. Offshore Test Site alpha ventus, Marine Mammals, Final report from baseline to wind farm operation. Study based on monitoring data for the wind farm alpha ventus. Under: http://www.bsh.de/de/Meeresnutzung/Wirtschaft/Windparks/Windparks/Projekte/StUK3/Betriebsphase/ Marine_Saeugetiere_3_Betriebsjahr.pdf.
Russell, D. J. F., Hastie, G. D., Thompson, D., Janik, V. M., Hammond, P. S., Scott-Hayward, L. A. S.,. McConnell, B. J. (2016). Avoidance of wind farms by harbour seals is limited to pile driving activities. Journal of Applied Ecology, n/a-n/a. doi: 10.1111/1365-2664.12678.
Sarnocińska, J., Teilmann, J., Balle, J. D., Van Beest, F. M., Delefosse, M. and Tougaard, J. 2020. Harbor Porpoise (Phocoena phocoena) Reaction to a 3D Seismic Airgun Survey in the North Sea. Frontiers in Marine Science 6:824.
Santulli, A., Modica, A., Messina, C., Ceffa, L., Curatolo, A., Rivas, G., Fabi, G., D’amelio, V. 1999. Biochemical responses of European Sea bass (Dicentrarchus labrax L.) to the stress induced by offshore experimental seismic prospecting. Marine Pollution Bulletin, 38 (12): 1105–1114.
Thompson, P. M., Brookes, K. L., Graham, I. M., Barton, T. R., Needham, K., Bradbury, G., and Merchant, N. D. 2013. “Short-term disturbance by a commercial two-dimensional seismic survey does not lead to long-term displacement of harbour porpoises,” Proceedings of the Royal Society B-Biological Sciences 280, 8.
UNCLOS. 1982. United Nations Convention on the Law of the Sea.
Tasker, M.L., Amundin, M., Andre, M., Hawkins, A., Lang, W., Merck, T., Scholik-Schlomer, A., Teilmann, J., Thomsen, F., Werner, S. and Zakharia, M. 2010. Marine Strategy Framework Directive. Task Group 11 Report, Underwater noise and other forms of energy. European Union and ICES. 58pp.
Tasker, M. 2014. Possible Approach to amend Decision 2010/477/EC, Descriptor 11: Energy, including underwater noise.
UNEP/CMS. 2011. UNEP/CMS Resolution 10.24 on Further Steps to Abate Underwater Noise Pollution for the Protection of Cetaceans and other Migratory Species.
Van der Graaf, A.J., Ainslie, M.A., André, M., Brensing, K., Dalen, J., Dekeling, R.P.A., Robinson, S., Tasker, M.L., Thomsen, F., Werner, S. 2012. European Marine Strategy Framework Directive – Good Environmental Status (MSFD GES): Report of the Technical Subgroup on Underwater noise and other forms of energy.
von Benda Beckmann et al. 2015. Assessing the Impact of Underwater Clearance of Unexploded Ordnance on Harbour Porpoises (Phocoena phocoena) in the Southern North Sea.
Yelverton, J. T., Richmond, D. R., Hicks, W., Saunders, K., Fletcher. R. 1975. Relationship Between Fish Size and their Response to Underwater Blast, Report DNA.
Yelverton, J. T., Richmond, D. R., Fletcher, E. R., and Jones, R. K. 1973. “Safe distances from underwater explosions for mammals and birds,” (Albuquerque, New Mexico).
Wardle, C.S., Carter, T.J., Urquhart, G.G.m.fl. 2001. Effects of seismic airguns on marine fish. ContShelf Res 21:1005- 1027.
Wright B. D. 1982. A discussion paper on the effects of explosives on fish and marine mammals in the waters of the northwest-territories. Western Region Department of Fisheries and Oceans Winnipeg, Manitoba R3T 2N6, Canadian Technical Report of Fisheries & Aquatic Sciences Om 1052.
Wysocky, E., Dittami, J., Ladich, F. 2006. Ship noise and cortisol secretion in European freshwater fishes. Biological Conservation, 128: 501–508.
14 Other relevant resources
Brandt, M. J., Diederichs, A., and Nehls, G. 2009. “Harbour porpoise responses to pile driving at the Horns Rev II offshore wind farm in the Danish North Sea. Final report to DONG Energy,” (Husum, Germany).
Dähne, M., Gilles, A., Lucke, K., Peschko, V., Adler, S., Krügel, K., Sundermeyer, J., and Siebert, U. 2013. “Effects of pile- driving on harbour porpoises (Phocoena phocoena) at the first offshore wind farm in Germany,” Env Res Lett 8, 025002.
Erbe, C., Reichmuth, C., Cunningham, K., Lucke, K., and Dooling, R. 2016. “Communication masking in marine mammals: A review and research strategy,” Marine Pollution Bulletin 103, 15-38.
Evans, D. L., and England, G. R. 2001. “Joint Interim Report. Bahamas Marine Mammal Stranding Event of 15-16 March 2000. US Department of Commerce and US Navy.”
Finneran, J. J. 2015. “Noise-induced hearing loss in marine mammals: A review of temporary threshold shift studies from 1996 to 2015,” J. Acoust. Soc. Am. 138, 1702-1726.
Frantzis, A. 1998. “Does acoustic testing strand whales?,” Nature 392, 29-29.
Gordon, J., Blight, C., Bryant, E., and Thompson, D. 2015. “Tests of acoustic signals for aversive sound mitigation with harbour seals. Report to Scottish Government Marine Mammal Scientific Support Research Programme MMSS/001/11,” (SMRU, St. Andrews).
Hastings, M.C., Popper, A.N. 2005. Effects of sound on fish. California Department of Transportation Contract 43A0139 Task Order 1.
Jacobs, S. R., and Terhune, J. M. 2002. “The effectiveness of acoustic harassment devices in the Bay of Fundy, Canada: seal reactions and a noise exposure model,” Aquat. Mamm. 28, 147-158.
Kastelein, R. A., Helder-Hoek, L., Janssens, G., Gransier, R., and Johansson, T. 2015c. “Behavioral Responses of Harbor Seals (Phoca vitulina) to Sonar Signals in the 25-kHz Range,” Aquat. Mamm. 41, 388-399.
Madsen, P. T., Wahlberg, M., Tougaard, J., Lucke, K., and Tyack, P. L. 2006. “Wind turbine underwater noise and marine mammals: Implications of current knowledge and data needs,” Mar. Ecol. Prog. Ser. 309, 279-295.
Mueller-Blenkle, C., Gill, A.B., McGregor, P.K., Metcalfe, J., Bendall, V., Wood, D.,Andersson, M.H., Sigray, P., Thomsen, F. 2010. Behavioural reactions of cod and sole to playback of pile driving sound. J. Acoust. Soc. Am. 128, 2331. OSPAR. 2014. OSPAR inventory of measures to mitigate the emission and environmental impact of underwater noise.
OSPAR Commision 626, ISBN 978-1- 909159-59-4, 41 s.
Payne, R., and Webb, D. 1971. “Orientation by means of long range acoustic signalling in baleen whales,” Ann. N. Y. Acad. Sci. 118, 110-141.
Richardson, W. J., Greene, C. R., Malme, C. I., and Thomson, D. H. 1995. Marine mammals and noise (Academic Press, San Diego).
Schack, H., Ruiz, M., Andersson, M.H. 2016. Noise Sensitivity of Animals in the Baltic Sea. BalticBOOST report, p 62.
Slotte A., Hansen, K., Dalen, J., Ona, E. 2004. Acoustic mapping of pelagic fish distribution and abundance in relation to a seismic shooting area off the Norwegian west coast. Fisheries Research 67 (2004) 143–150.
Tougaard, J., Carstensen, J., Teilmann, J., Skov, H., and Rasmussen, P. 2009. “Pile driving zone of responsiveness extends beyond 20 km for harbour porpoises (Phocoena phocoena, (L.)),” J. Acoust. Soc. Am. 126, 11-14.
Tougaard, J., Kyhn, L. A., Amundin, M., Wennerberg, D., and Bordin, C. 2012. “Behavioral reactions of harbor porpoise to pile-driving noise,” in Effects of Noise on Aquatic Life, edited by A. N. Popper, and A. D. Hawkins (Springer, New York), pp. 277-280.