 Lead
Lead
2 Relevance of the indicator
Lead has historically entered the Baltic Sea at elevated levels due to human activities and has known negative environmental impacts where concentrations exceed acceptable levels. Releases of lead, for example from combustion activities, remains a relevant source of contamination for the marine environment.
2.1 Ecological relevance
Heavy metals, including lead (Pb) are toxic to wildlife and humans, and even at low levels, they can be harmful to organisms. The severity of the effect mainly depends on the concentration in the tissues. When heavy metals bioaccumulate in tissues they can cause different biological effects on the individual organism, which transform into changes at the population, then species level, and finally affect biodiversity and ecosystem functioning. Heavy metal accumulation in fish, specifically destined for human consumption, directly affects human health. Lead can cause increased blood pressure and cardiovascular problems in humans. Long-term exposure to high levels of lead can affect the neurological system. Lead (Pb) is a metal that is not essential for life processes and proves acutely toxic to most organisms. Compared to other metals Pb is rather immobile in the environment but still, its biogeochemical cycling is greatly perturbed by human activities.
2.2 Policy relevance
The core indicator evaluating concentrations of the metal Lead (Pb) addresses a major goal and various ecological objectives of the Baltic Sea Action Plan (BSAP 2021). This includes the goal of the hazardous substances and litter segment of a ‘Baltic Sea unaffected by hazardous substances (and litter)’, and key ecological objectives of: ‘Marine life is healthy’, ‘Concentrations of hazardous substances are close to natural levels’, and ‘All sea food is safe to eat’. There is also relevance for the BSAP biodiversity goals (Table 1).
Table 1. Overview of key policy relevance elements.
| Baltic Sea Action Plan (BSAP) | Marine Strategy Framework Directive (MSFD) | |
| Fundamental link | Segment: Hazardous substances and litter goal
Goal: “Baltic Sea unaffected by hazardous substances and litter”
|
Descriptor 8 Concentrations of contaminants are at levels not giving rise to pollution effects.
|
| Complementary link | Segment: Biodiversity
Goal: “Baltic Sea ecosystem is healthy and resilient”
|
Descriptor 9 Contaminants in fish and other seafood for human consumption do not exceed levels established by Union legislation or other relevant standards.
(a) for contaminants listed in Regulation (EC) No 1881/2006, the maximum levels laid down in that Regulation, which are the threshold values for the purposes of this Decision; (b) for additional contaminants, not listed in Regulation (EC) No 1881/2006, threshold values, which Member States shall establish through
|
| Other relevant legislation: |
|
|
The core indicator also addresses the following qualitative descriptors of the MSFD for determining good environmental status (European Commission 2008a), in particular being of direct relevance to Descriptor 8 and of significance for Descriptor 9 as set out under the specific Descriptors and Criteria in Commission Decision (EU) 2017/848.
Lead is listed as a priority substance (European Commission 2013) monitoring under the EU Water Framework Directive is done in the water matrix (European Commission 2000). As a highly toxic element, lead is included in the recommendations concerning the acceptable levels in products for consumption including seafood (Commission Regulation (EC) No 1881/2006, European Commission 2006a).
Article 3 of the EU directive on environmental quality standards states that also long-term temporal trends should be assessed for substances that accumulate in sediment and/or biota (European Commission 2008b).
2.3 Relevance for other assessments
The status of the Baltic Sea marine environment in terms of contamination by hazardous substances is assessed using several core indicators.
These core indicators focus on contaminants with well-established knowledge base on their environmental impacts, often accompanied by long-standing monitoring activities. These core indicator contaminants include e.g. heavy metals (Pb, Cd and Hg), PAHs, PCBs and PCDD/Fs. Each of these indicators focuses on one important aspect of the complex issue, and are further used in producing an overall hazardous substances assessment. Pb as one of the metal indicators will give an evaluation of the status in terms of heavy metals concentration. The Lead indicator will be included in the integrated hazardous substances assessment, using the HELCOM hazardous substances assessment tool CHASE.
3 Threshold values
Good Environmental Status (GES) is achieved if the concentrations of lead are below the specified threshold values for each relevant monitoring matrix, as illustrated in Figure 2.
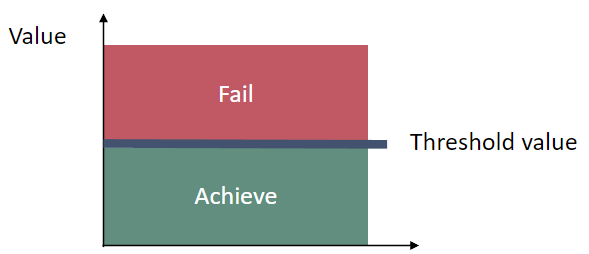
Figure 2. Good Environmental Status (GES) is achieved if the concentrations of metals are below the agreed threshold value.
The threshold value for lead is based on Environmental Quality Standards (EQS) for water as a primary matrix (Thresholds table 1) which have been defined at the EU level for substances included in the priority list under the Water Framework Directive, WFD (European Commission 2000, 2013). For historical reasons, the countries around the Baltic Sea have differing monitoring strategies and data on lead concentrations in water are not available in all regions of the Baltic Sea. In order to perform the evaluation based on other matrices, secondary thresholds were proposed: QS for sediments, BAC for fish liver and values based on scientific studies for fish muscle and mussel soft tissue (Table 2). Under the WFD, Member States may establish other values than EQS for alternative matrices if specific criteria are met (see Art 3.3. in European Commission 2008b, revised in European Commission 2013).
Table 2. Threshold values for Lead (EQS – Environmental Quality Standard, AA- Annual Average Concentration, QS – Quality Standard, BAC = Background Assessment Criteria). Underlined supporting parameters represent parameters without which the indicator evaluation cannot be applied. MU = muscle, LI = fish liver, SB = soft body, CORG = organic carbon, Al = Aluminium, Li = Lithium. European Commission (2013) Directive 2013/39/EU, Lead and its compounds – CIRCABC – Europa EU, 2011, and EG HAZ 16-2021 document 3-4.
| Indicator | Threshold value | Parameters (PARAM) / Parameter groups (PARGROUP)
(see also http://vocab.ices.dk/) |
Matrix | Species | Matrix | Basis | Supporting parameters and information |
| Metals
(Pb) |
Primary threshold
EQS water 1.3 µg/l |
PARAM = PB | Water | WT (filtered, unfiltered if the concentration is below the EQS) | Surface water layer (≤ 5.5 m) | ||
| Secondary threshold
OSPAR proxy BAC 26 µg/kg ww fish liver 110 ug/kg ww – mussel and fish muscle BAC maintained for liver samples as muscle/liver conversion is currently not available. |
Biota | Herring & cod (open sea)
Flounder, sole, eelpout & Perch (coastal) Mussels |
Muscle & LI
SB |
W
W |
Dry weight
Dry weight |
||
| *Secondary threshold
QS from EQS dossier 120 mg/kg sediment (DW) |
Sediment
(surface, ICES ’upper sediment layer – 0-X cm’) |
D | Al
Li CORG Grain size |
*Denmark retains a study reservation on this threshold value and is currently carrying out national work to review and evaluate a suitable threshold value, but supports the application of the regional indicator for HOLAS 3.
It should be noted that for HOLAS 3 and subsequent to HOLAS II a new threshold value has been implemented. The Secondary threshold value, an EQS secondary poisoning (DK derived) 110 ug/kg ww mussels and fish muscle. This overrides the previous threshold value applied in HOLAS II for mussels of 1300 µg kg-1 d.w (OSPAR BAC). For HOLAS 3, since fish muscle/liver conversion factor are not currently available it has been decided to use the BAC for fish liver until studies have been made to provide well-justified conversion factors applicable across the relevant species and the Baltic Sea region.
3.1 Setting the threshold value(s)
The threshold value for lead is based on Environmental Quality Standards (EQS) for water as a primary matrix (Thresholds table 1) which have been defined at the EU level for substances included in the priority list under the Water Framework Directive, WFD (European Commission 2000, 2013). In order to perform the evaluation based on other matrices, secondary thresholds were proposed: QS for sediments, BAC for fish liver and values based on scientific studies for fish muscle and mussel soft tissue.
There are chronic effect values for 8 sediment species, of which 2 are marine. The species represent 3 major taxonomic groups, and at least 4 different foraging strategies. The two marine species, a crustacean and an oligochaete, are neither more nor less sensitive than their freshwater taxonomic counterparts, and so the freshwater and saltwater data are combined. A recent Danish evaluation expanded on the existing information pool, increasing the number of species to three (including two marine species). Further details are provided in EG HAZ 16-2021 document 3-4.
4 Results and discussion
The results of the indicator evaluation that underlie the key message map and information are provided below.
4.1 Status evaluation
The data underlying the core indicator evaluation are based on regular monitoring data gathered by HELCOM Contracting Parties and reported to the HELCOM COMBINE data base (hosted by ICES). The indicator presents information on the current levels of lead concentrations in selected marine matrices: seawater, fish (muscle and liver tissue), soft body of mussels as well as in the bottom sediment for the assessment period 2016-2021, assessed against regionally agreed threshold values. The values presented in the report refer to the concentrations and mean values calculated from them, while the status evaluations are based on the so-called representative concentrations assessed against threshold values, which result from data evaluation (see Methodology), and are considered as values representative of status for the given assessment units.
Seawater
The primary matrix for lead is water, as the primary threshold value for the core indicator is agreed to be the EQS value for water. This is in conflict with the HELCOM COMBINE monitoring program, where the preferred matrix for monitoring is biota and sediment. As a result, very limited data is available for lead in water.
Lead concentrations in the seawater have been measured by Germany, Estonia, Lithuania and Poland.
An evaluation was possible for 50 assessment units, of which 5 were open sea HELCOM sub-basins. All open sea assessment units achieved the threshold value (were in GES) and of the remaining assessment units an additional 19 achieved the threshold value (in GES) (Figure 3). However, lead concentrations in the seawater have been measured only by Germany, Estonia, Lithuania and Poland, and even in these instances in relatively low coverage and frequency, thus the spatial coverage of the evaluation in water is low.
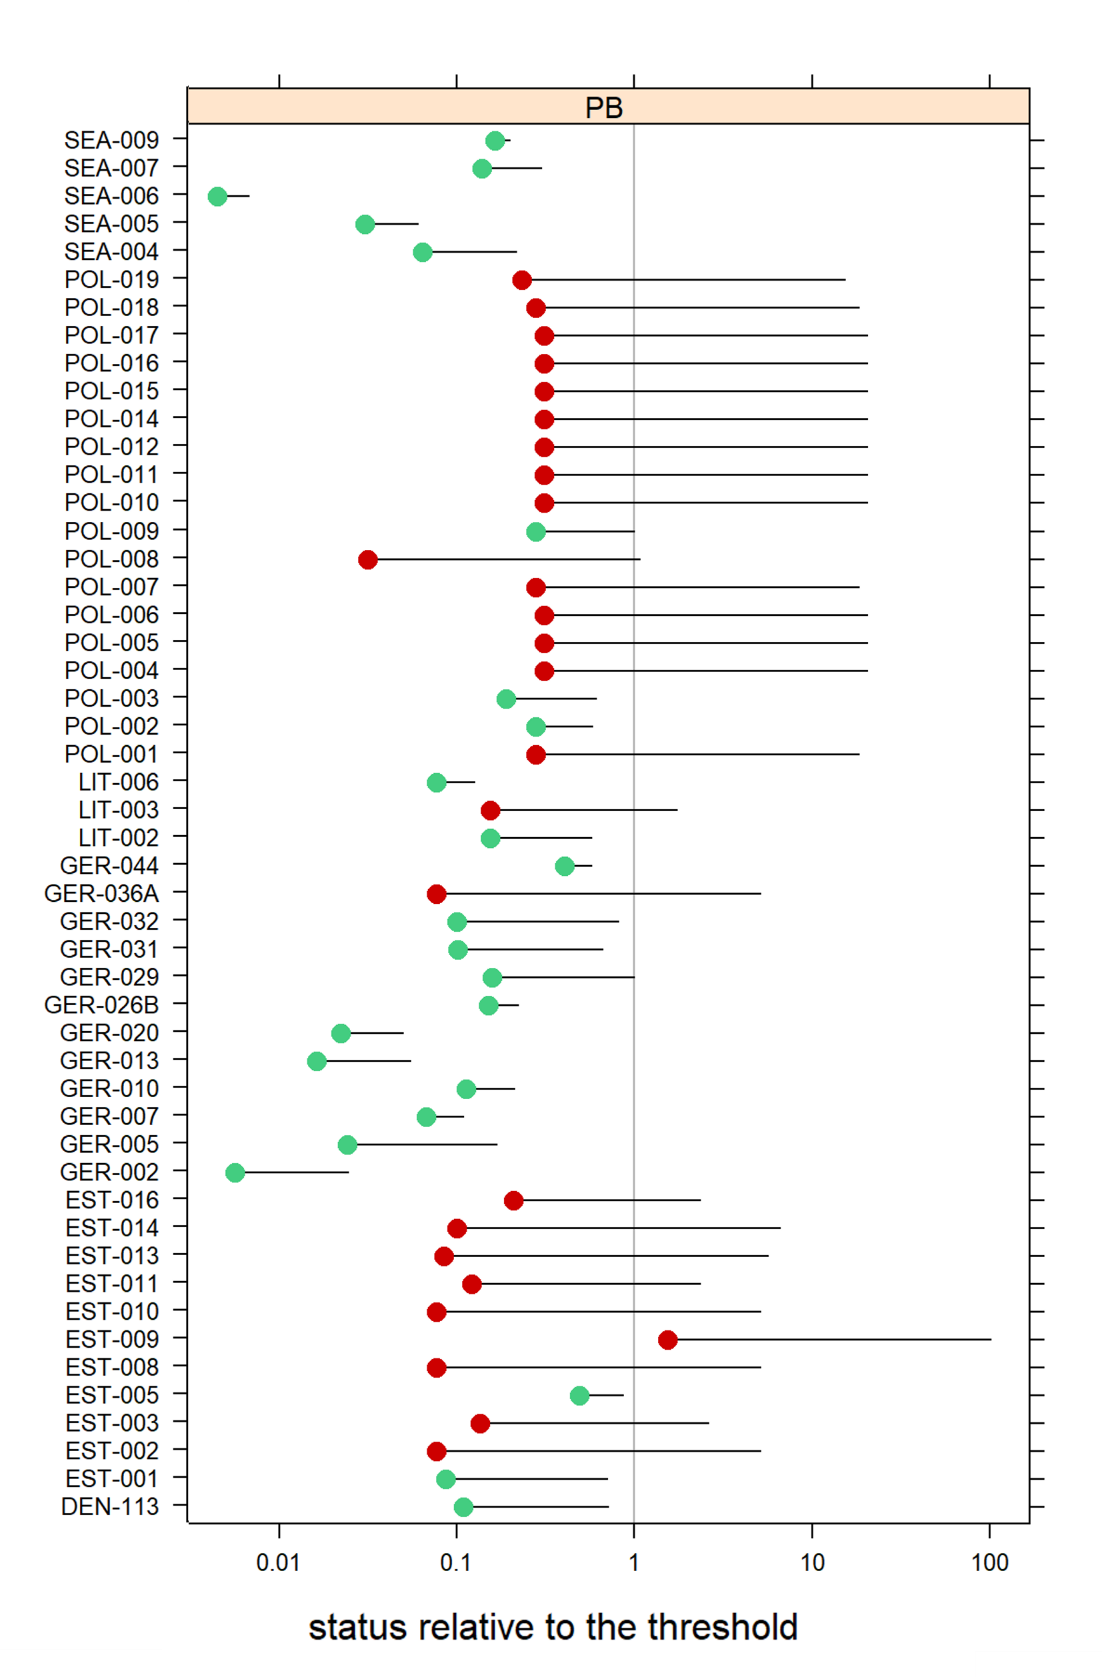
Figure 3. Overview of HELCOM Level 4 assessment units evaluated for Lead (Pb) in water. The 95% confidence limit on the mean concentration is presented. Filled circles represent a mean value for each assessment unit and the bar represents the upper 95% confidence limit. Green colour indicates that the assessed area achieves the threshold value and red colour that the assessed area fails the threshold.
The concentration in the last year of the evaluation (i.e. the most recent concentration in any given data series) is informative of latest reference point and will occur in the current assessment period. At the station level (i.e. per data series) the concentrations in the last year of evaluation (ug/l) varied, in cases somewhat widely even within a single sub-basin. This varied between and within the 17 HELCOM sub-basins when comparing all stations, inclusive of open sea and coastal, within each sub-basin (Table 3). These values show the variation across sub-basins and also the latest station level concentrations in the assessment period but do not themselves reflect status as status is derived from the entire assessment period and is also influenced by the 95% confidence limit on the mean concentration (as in Figure 3).
Table 3. Overview of number of stations within each HELCOM sub-basin (coastal and open sea), the mean value of the concentrations in the last year of evaluation across the stations and the lowest and largest of these values within each sub-basin (where evaluated).
| HELCOM sub-basin | Mean
(ug/l) |
Number of stations | Lowest concentration (ug/l) | Largest concentration (ug/l) |
| Kattegat (SEA-001) | NA | NA | NA | NA |
| Great Belt (SEA-002) | 0.1 | 1 | 0.1 | 0.1 |
| The Sound (SEA-003) | NA | NA | NA | NA |
| Kiel Bay (SEA-004) | 0.1 | 9 | 0.0 | 0.2 |
| Bay of Mecklenburg (SEA-005) | 0.1 | 9 | 0.0 | 0.5 |
| Arkona Basin (SEA-006) | 0.1 | 8 | 0.0 | 0.2 |
| Bornholm Basin (SEA-007) | 0.3 | 16 | 0.1 | 0.4 |
| Gdansk Basin (SEA-008) | 0.3 | 11 | 0.0 | 0.4 |
| Eastern Gotland Basin (SEA-009) | 0.2 | 12 | 0.1 | 0.4 |
| Western Gotland Basin (SEA-010) | NA | NA | NA | NA |
| Gulf of Riga (SEA-011) | 0.5 | 6 | 0.1 | 2.0 |
| Northern Baltic Proper (SEA-012) | 0.1 | 2 | 0.1 | 0.1 |
| Gulf of Finland (SEA-013) | 0.3 | 9 | 0.1 | 0.9 |
| Åland Sea (SEA-014) | NA | NA | NA | NA |
| Bothnian Sea (SEA-015) | NA | NA | NA | NA |
| The Quark (SEA-016) | NA | NA | NA | NA |
| Bothnian Bay (SEA-017) | NA | NA | NA | NA |
The status evaluation is derived based on the station level evaluation of 83 individual stations across the Baltic Sea region. Eight of these stations represented ‘full data’ and of these two distinct downward trends (e.g. decreasing concentrations) were recorded (these were also in GES). These stations were located in the Bornholm Basin and Bay of Mecklenburg sub-basin. Other stations were evaluated as ‘initial’ data series due to the lower number of years with data available (Figure 4).
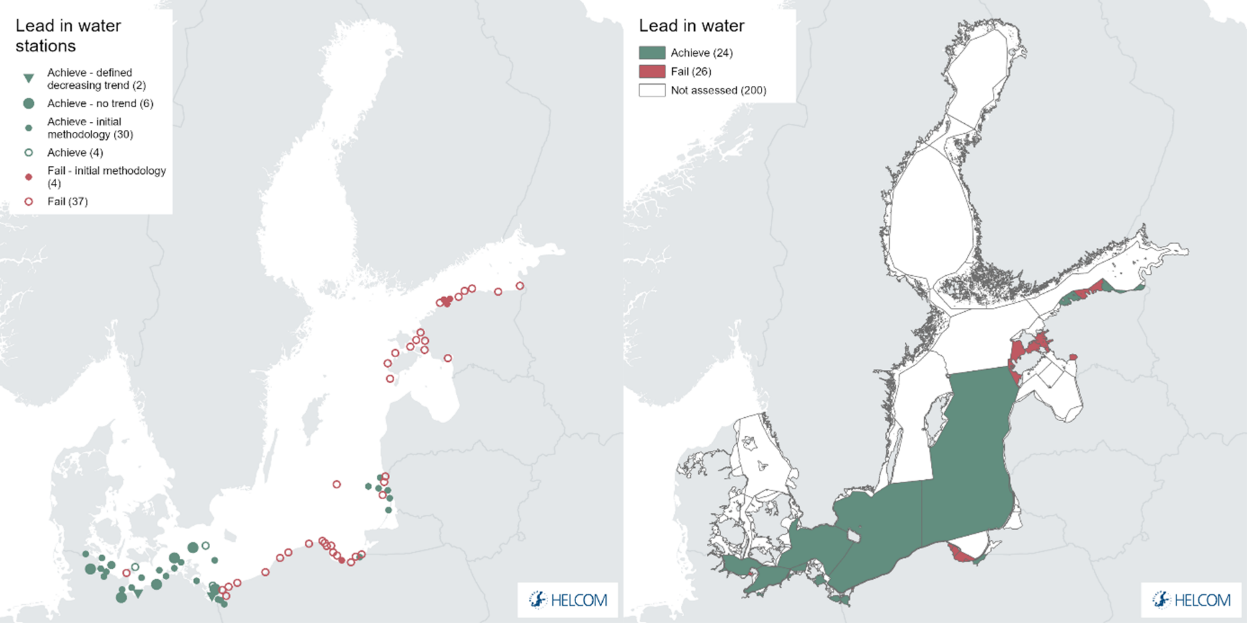
Figure 4. Map presenting station based status of lead concentrations in water (left) and assessment unit based status evaluation for lead in water (right). Green colour represents good environmental status and red colour represents not good status. Large filled triangles indicate data series of three or more years for which statistical trends could be assigned (upwards-increasing concentrations or downwards-decreasing concentrations), large filled circles triangles indicate data series of three or more years for which statistical trends could be assigned but where no detectible trend was observed, and full evaluation with MIME Script (see Methodology) was carried out. Small filled circles represent data series of three or more years for which statistical trends could not be assigned due to specific data factors and open circles represent data series of less than three years for which statistical trends could not be assigned due to data series length, and these data types are treated with initial status evaluation (see Methodology). See ‘data chapter’ for interactive maps and data at the HELCOM Map and Data Service.
Stations with ‘full’ (>3 years of data in the assessment period) and ‘initial’ data (<2 years of data in the assessment period), the latter which limits the application of the full statistical analyses, were available to support the evaluation, though in general spatial and temporal aspects of the data set are limited at the Baltic Sea scale. Examples of different trend patterns at the station level (station time series) are presented in Figure 5.
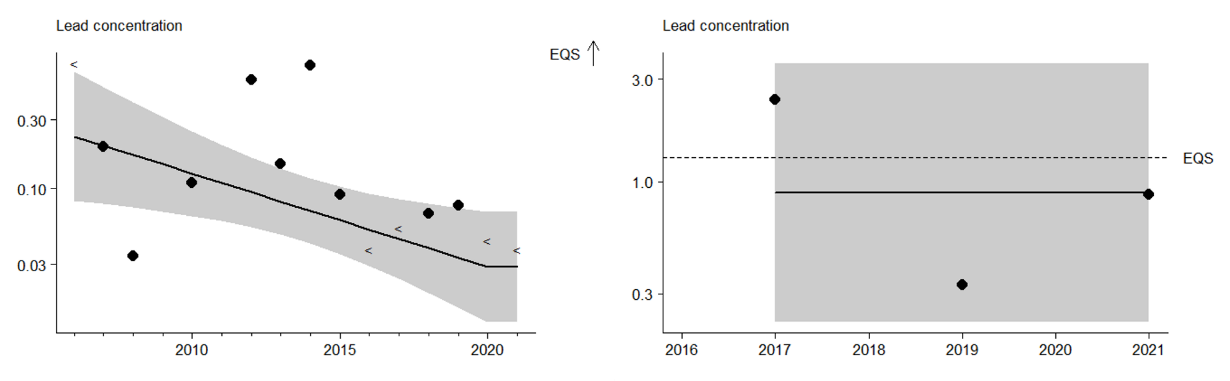
Figure 5. Examples of Lead concentration in water at stations in the Bornholm Basin (left – distinct decreasing trend, ‘full data’, in GES), and the Gulf of Finland (right – no distinct directional trend, ‘initial’ data, sub-GES).
Biota
The evaluation of the core indicator status is based on data on Pb concentrations in the muscles of fish of the following species: herring, cod, perch, flatfish, eelpout and soft tissues of mussels of the species: Mytilus edulis, Macoma balthica and Limecola balthica (figure 6). Biota is a secondary matrix for the Pb status evaluation.
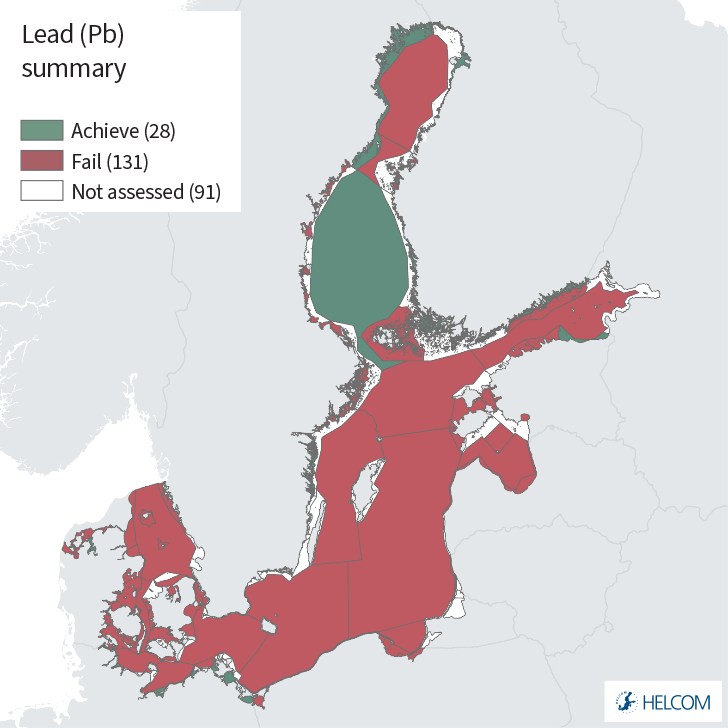
An evaluation was possible for 134 assessment units, of which 16 were open sea HELCOM sub-basins (of a possible 17 sub-basins). All but one open sea assessment unit (Bothnian Sea, SEA-015) failed to achieve the threshold value (were sub-GES) and of the remaining 118 coastal station only 17 achieved the threshold value (were in GES) (Figure 6).
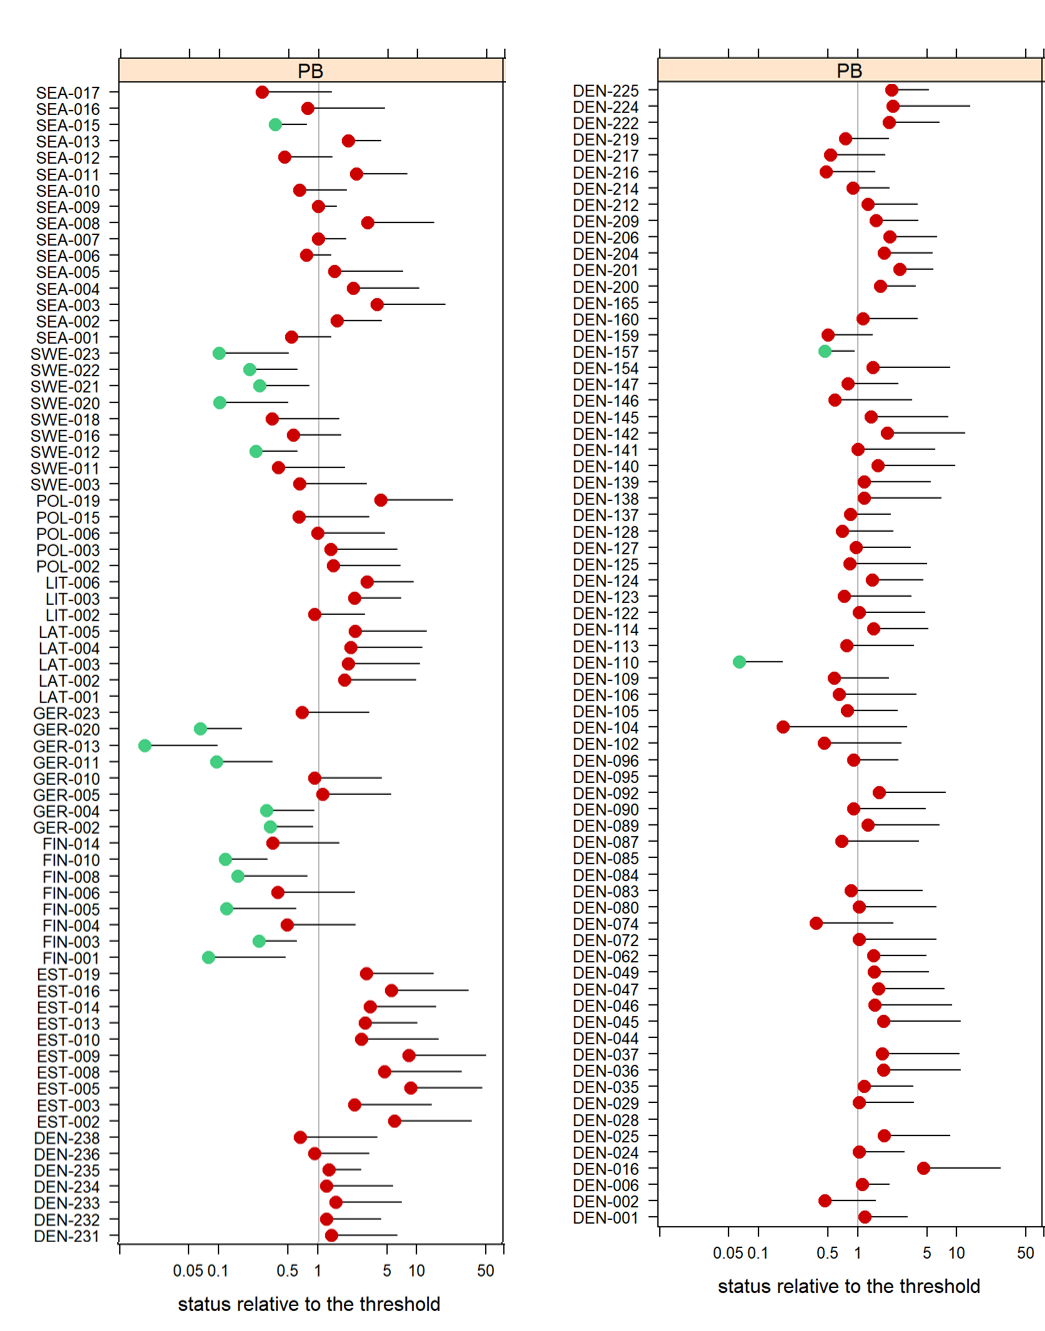
Figure 6. Overview of HELCOM Level 4 assessment units evaluated for Lead (Pb) in biota. The 95% confidence limit on the mean concentration is presented.
The concentration in the last year of the evaluation (i.e. the most recent concentration in any given data series) is informative of latest reference point and will occur in the current assessment period. At the station level (i.e. per data series) the concentrations in the last year of evaluation (ug/kg) varied, in cases somewhat widely even within a single sub-basin. This varied between and within the 17 HELCOM sub-basins when comparing all stations, inclusive of open sea and coastal, within each sub-basin (Table 4). These values show the variation across sub-basins and also the latest station level concentrations in the assessment period but do not themselves reflect status as status is derived from the entire assessment period and is also influenced by the 95% confidence limit on the mean concentration (as in Figure 6).
Table 4. Overview of number of stations within each HELCOM sub-basin (coastal and open sea), the mean value of the concentrations in the last year of evaluation across the stions and the lowest and largest of these values within each sub-basin (where evaluated). The table summarises all biota thus includes fish muscle and liver and also mussel soft body. This contributes to the broad range in values.
| HELCOM sub-basin | Mean
(ug/kg) |
Number of stations | Lowest concentration (ug/kg) | Largest concentration (ug/kg) |
| Kattegat (SEA-001) | 120 | 52 | 9 | 361 |
| Great Belt (SEA-002) | 122 | 75 | 0 | 510 |
| The Sound (SEA-003) | 251 | 8 | 14 | 447 |
| Kiel Bay (SEA-004) | 66 | 2 | 58 | 75 |
| Bay of Mecklenburg (SEA-005) | 112 | 9 | 5 | 204 |
| Arkona Basin (SEA-006) | 143 | 22 | 2 | 501 |
| Bornholm Basin (SEA-007) | 43 | 12 | 3 | 148 |
| Gdansk Basin (SEA-008) | 74 | 3 | 34 | 108 |
| Eastern Gotland Basin (SEA-009) | 1031* | 29 | 1 | 28000* |
| Western Gotland Basin (SEA-010) | 34 | 5 | 1 | 125 |
| Gulf of Riga (SEA-011) | 90 | 12 | 50 | 210 |
| Northern Baltic Proper (SEA-012) | 26 | 4 | 10 | 70 |
| Gulf of Finland (SEA-013) | 59 | 14 | 2 | 220 |
| Åland Sea (SEA-014) | 6 | 2 | 3 | 99 |
| Bothnian Sea (SEA-015) | 11 | 9 | 4 | 29 |
| The Quark (SEA-016) | 10 | 5 | 3 | 20 |
| Bothnian Bay (SEA-017) | 8 | 7 | 2 | 29 |
*a single station appears to have a unit or reporting error that generates this high value and will also influence the average value in this table. The highest value excluding this is 210.10 and the mean would be 67.48. The potential error here is not expected to have a strong influence on the overall status evaluation.
The status evaluation is derived based on the station level evaluation of 270 individual stations across the Baltic Sea region. Seventy-three of these stations represented ‘full data’ and of these 12 distinct downward trends (e.g. decreasing concentrations) were recorded (8 of which were in GES). These stations were located in the Bay of Mecklenburg, Bornholm Basin, Bothnian Bay, Bothnian Sea, Eastern Gotland Basin (2), Great Belt, Kattegat (2), Kiel Bay, and Western Gotland Basin (2) sub-basins. There were a lower number of stations that exhibited upwards trends (i.e. increasing concentrations), two of which were in GES, located in the Bornholm Basin, Kattegat and The Quark. Other stations were evaluated as ‘initial’ data series due to the data available (Figure 7).
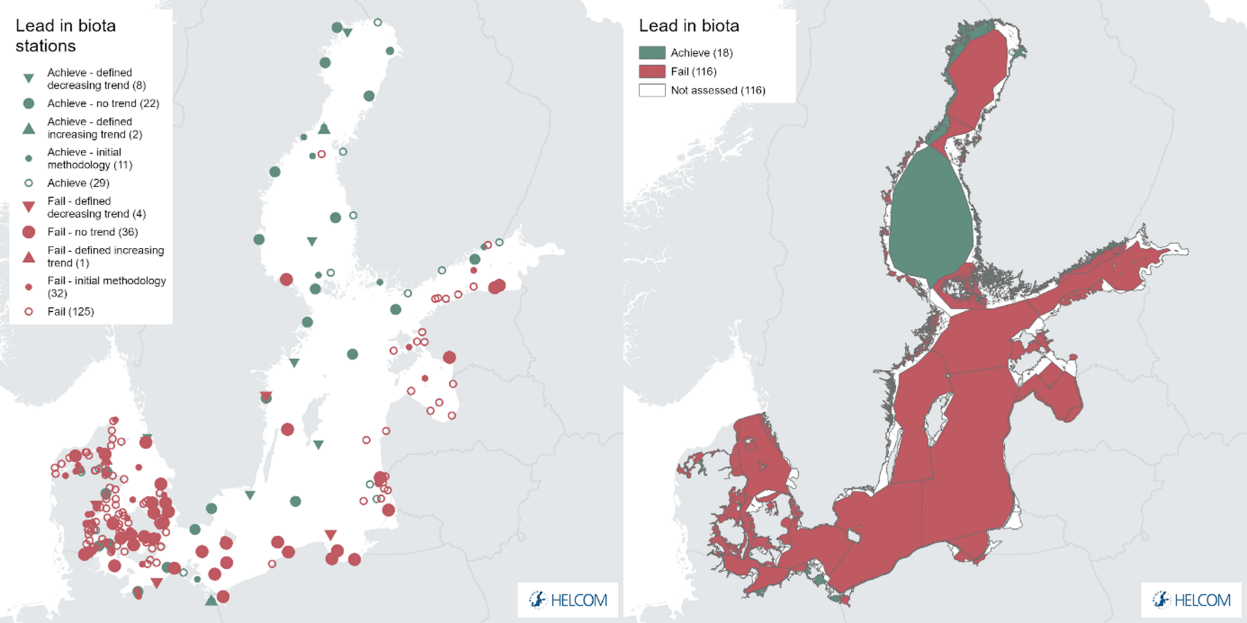 Figure 7. Map presenting station based status of lead concentrations in biota (left) and assessment unit based status for lead in biota (right). Green colour represents good status and red colour represents not good status. Large filled triangles indicate data series of three or more years for which statistical trends could be assigned (upwards-increasing concentrations or downwards-decreasing concentrations), large filled circles triangles indicate data series of three or more years for which statistical trends could be assigned but where no detectible trend was observed, and full evaluation with MIME Script (see Methodology) was carried out. Small filled circles represent data series of three or more years for which statistical trends could not be assigned due to specific data factors and open circles represent data series of less than three for which statistical trends could not be assigned due to data series length, and these data types are treated with initial status evaluation (see Methodology). See ‘data chapter’ for interactive maps and data at the HELCOM Map and Data Service.
In certain instances, especially where a small number of stations occur in an assessment unit or the stations are dominantly ‘initial’ data series, a difference in status outcome between the outcome at the separate station level evaluations and the assessment unit evaluation level can occur. This is due to the precautionary approach applied and the application of psi values derived from the full regional data set (see methodology) being applied. Where large ranges in the data occur and increased uncertainties are part of the overall evaluation these factors can influence status. This aspect is also likely compounded by the lack of fish muscle/liver conversion factors and may explain apparent differences between the left and right panels in figure 7 (e.g. in Swedish coastal waters of the Northern Baltic Proper).
Stations with ‘full’ (>3 years of data in the assessment period) and ‘initial’ data (<2 years of data in the assessment period), the latter which limits the application of the full statistical analyses, were available to support the evaluation. There is a high spatial coverage of stations with long time series (‘full’ data) for this evaluation at the Baltic Sea scale. Examples of different trend patterns at the station level (station time series) are presented in Figure 8.
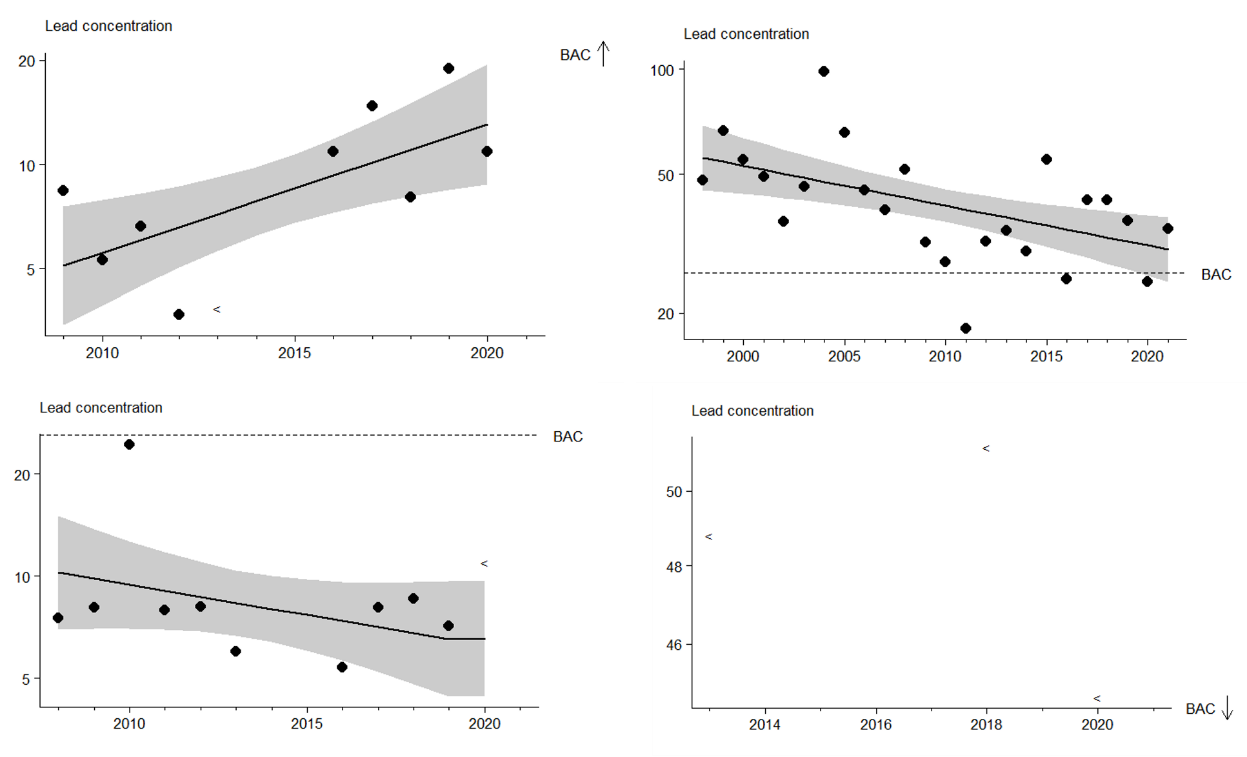
Figure 8. Examples of Lead concentration in biota at stations (grey colour- confidence level 95% range (see Methodology)) in The Quark (top left – Holmöarna, distinct increasing trend, ‘full data’, in GES), the Eastern Gotland Basin (top right – LWLA, distinct downward trend, ‘full data’, sub-GES), the Bothnian Bay (bottom left – Kinnbäcksfjärden, no distinct directional trend, ‘full data’, in GES), and the Eastern Gotland Basin (bottom right – Z06, no distinct directional trend, ‘initial’ data, sub-GES).
Sediment
The evaluation of sediment in the core indicator evaluating Lead (Pb) is possible for 31 assessment units, of which 13 were open sea HELCOM sub-basins (of a possible 17 sub-basins). Three of the open sea assessment unit failed to achieve the threshold value (were sub-GES) and of the remaining 18 coastal station only five failed to achieve the threshold value (only 5 were sub-GES) (Figure 9).
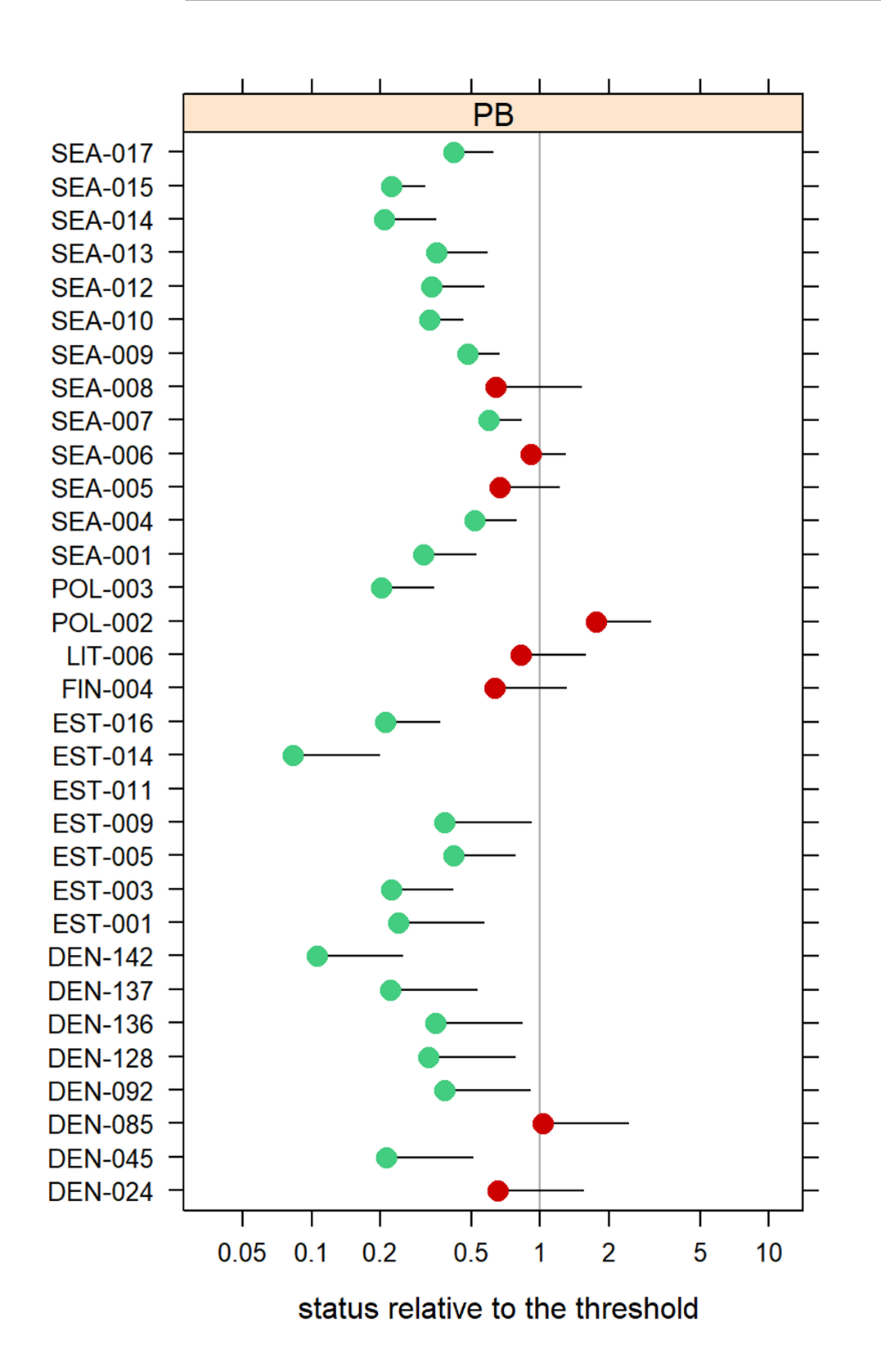
Figure 9. Overview of HELCOM Level 4 assessment units evaluated for Lead (Pb) in sediment. The 95% confidence limit on the mean concentration is presented.
The concentration in the last year of the evaluation (i.e. the most recent concentration in any given data series) is informative of latest reference point and will occur in the current assessment period. At the station level (i.e. per data series) the concentrations in the last year of evaluation (mg/kg) varied, in cases somewhat widely even within a single sub-basin. This varied between and within the 17 HELCOM sub-basins when comparing all stations, inclusive of open sea and coastal, within each sub-basin (Table 5). These values show the variation across sub-basins and also the latest station level concentrations in the assessment period but do not themselves reflect status as status is derived from the entire assessment period and is also influenced the 95% confidence limit on the mean concentration (as in Figure 9).
Table 5. Overview of number of stations within each HELCOM sub-basin (coastal and open sea), the mean value of the concentrations in the last year of the station time series and the lowest and largest of these values within each sub-basin (where evaluated) for sediment.
| HELCOM sub-basin | Mean
(mg/kg) |
Number of stations | Lowest concentration (mg/kg) | Largest concentration (mg/kg) |
| Kattegat (SEA-001) | 44.21 | 4 | 31.88 | 55.58 |
| Great Belt (SEA-002) | 54.86 | 5 | 33.53 | 78.88 |
| The Sound (SEA-003) | ||||
| Kiel Bay (SEA-004) | 14.79 | 2 | 9.95 | 19.63 |
| Bay of Mecklenburg (SEA-005) | 79.66 | 1 | 79.66 | 79.66 |
| Arkona Basin (SEA-006) | 101.77 | 3 | 65.45 | 134.77 |
| Bornholm Basin (SEA-007) | 98.75 | 5 | 24.91 | 210.26 |
| Gdansk Basin (SEA-008) | 40.52 | 2 | 40.14 | 40.89 |
| Eastern Gotland Basin (SEA-009) | 49.24 | 5 | 24.21 | 73.12 |
| Western Gotland Basin (SEA-010) | 48.82 | 3 | 26.60 | 77.87 |
| Gulf of Riga (SEA-011) | 36.18 | 4 | 17.92 | 58.06 |
| Northern Baltic Proper (SEA-012) | 29.21 | 1 | 29.21 | 29.21 |
| Gulf of Finland (SEA-013) | 56.59 | 8 | 12.67 | 123.00 |
| Åland Sea (SEA-014) | 59.38 | 1 | 59.38 | 59.38 |
| Bothnian Sea (SEA-015) | 48.47 | 3 | 20.43 | 98.81 |
| The Quark (SEA-016) | ||||
| Bothnian Bay (SEA-017) | 53.42 | 2 | 32.53 | 74.30 |
The status evaluation is derived based on the station level evaluation of 49 individual stations across the Baltic Sea region. Two of these stations represented ‘full data’ both showing distinct downward trends and both were in GES. The low number of long-term time series is in part due to the relatively infrequent sampling that is standard practice for sediment monitoring. There are however spatial gaps in the monitoring of sediment at the Baltic Sea scale (Figure 10).
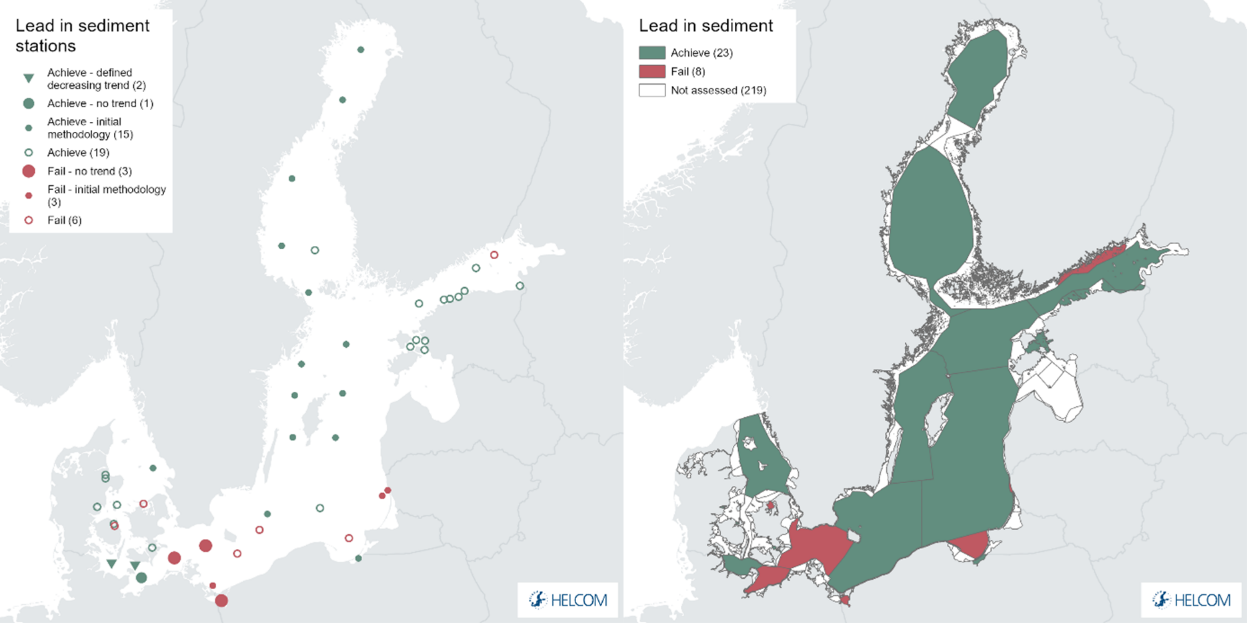
Figure 10. Map presenting station based status of lead concentrations in sediment (left) and assessment unit based evaluation for lead in sediment (right). Large filled triangles indicate data series of three or more years for which statistical trends could be assigned (upwards-increasing concentrations or downwards-decreasing concentrations), large filled circles triangles indicate data series of three or more years for which statistical trends could be assigned but where no detectible trend was observed, and full evaluation with MIME Script (see Methodology) was carried out. Small filled circles represent data series of three or more years for which statistical trends could not be assigned due to specific data factors and open circles represent data series of less than three for which statistical trends could not be assigned due to data series length, and these data types are treated with initial status evaluation (see Methodology). See ‘data chapter’ for interactive maps and data at the HELCOM Map and Data Service.
4.2 Trends
Examples of key station level trends at selected stations are provided above (Figures 5 and 8). The evaluation of lead includes a large number of high-quality datasets with long trends and the possibility to assign statistical trends. However, the depth, frequency and spatial coverage of data does differ between the monitoring matrices evaluated. Trends are described for each matrix separately.
In water only 2 downward trends (distinct decreasing concentrations) were recorded.
In biota 13 downward trends and 3 upward trends (distinct increasing concentrations) were recorded.
In sediment 2 downward trends (distinct decreasing concentrations) were recorded.
4.3 Discussion text
Lead can be directly toxic or cause significant harmful effects in the marine environment if suitable levels are exceeded. While trends for decreasing concentrations (downward trends) in biota outweigh those where deterioration appears to occur (upward trends) by circa four-fold there remains generally sub-GES conditions across the Baltic Sea region, especially where all evaluated sampling matrices are utilized. Local variation can also be seen, particularly in areas dominated by shorter (‘initial’) data series.
In addition, some variation in the results may be generated due to the different monitoring matrices applied (Figure 11), an issue that may be relevant for further study beyond HOLAS 3. An initial overview may suggest there is a slight bias towards monitored samples in fish muscle (these generally contribute a small portion of the data) being more likely to achieve the threshold value that other matrix types, however further studies beyond HOLAS 3 would be needed to carry out a proper evaluation of this issue.
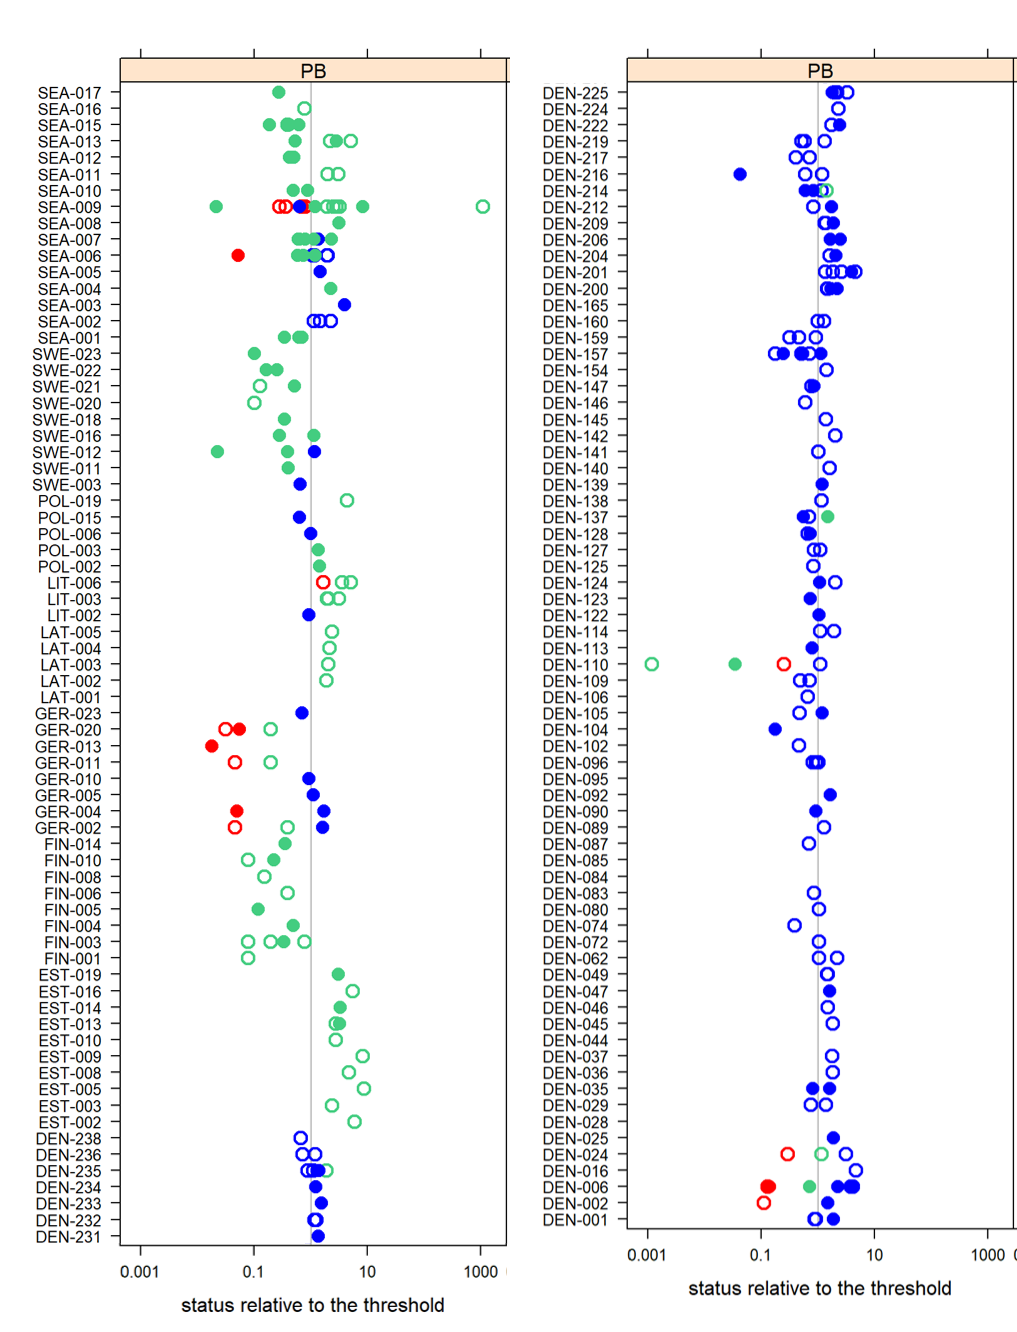
Figure 11. The same assessment units as shown in Figure 3 are presented but each assessment unit visualises the individual stations included in making the assessment unit level status evaluation. Potential difference in evaluation outcome due to different sampling matrices are highlighted: Red = fish muscle, blue = mussel soft body, and green = fish liver.
An overview of the outcomes for the open sea sub-basins is provided below (Table 6).
Table 6. Overview of evaluation outcomes and comparison with previous evaluation (using the OOAO evaluation outcomes per assessment unit). Currently this approach is only applied for open sea assessment units.
| HELCOM Assessment unit name (and ID) | Threshold value achieved/failed – HOLAS II | Threshold value achieved/failed – HOLAS 3 | Distinct trend between current and previous evaluation. | Description of outcomes, if pertinent. |
| Kattegat (SEA-001) | Achieved | Failed | Deterioration in status outcome. Likely driven by greater data availability and the implementation of a new threshold value. | The threshold value is not achieved (sub-GES). The majority of ‘full’ data stations fail to achieve the threshold value (mainly biota). |
| Great Belt (SEA-002) | Achieved | Failed | Deterioration in status outcome. Likely driven by greater data availability and the implementation of a new threshold value. | The threshold value is not achieved (sub-GES). The ‘initial’ data stations fail to achieve the threshold value (biota). |
| The Sound (SEA-003) | Not evaluated | Failed | New data availability has facilitated an evaluation for this assessment period. | |
| Kiel Bay (SEA-004) | Failed | Failed | No change in status between the two assessment periods. | The threshold value is not achieved (sub-GES). Water and sediment achieve their threshold values but biota does not. |
| Bay of Mecklenburg (SEA-005) | Failed | Failed | No change in status between the two assessment periods. | |
| Arkona Basin (SEA-006) | Failed | Failed | No change in status between the two assessment periods. | The threshold value is not achieved (sub-GES). Water achieves the threshold value, some sediment stations also, but biota does not. |
| Bornholm Basin (SEA-007) | Failed | Failed | No change in status between the two assessment periods. | The threshold value is not achieved (sub-GES). Stations both fail and achieve their threshold values for all monitoring matrices. |
| Gdansk Basin (SEA-008) | Failed | Failed | No change in status between the two assessment periods. | The threshold value is not achieved (sub-GES). Neither sediment or biota achieve their threshold values. |
| Eastern Gotland Basin (SEA-009) | Failed | Failed | No change in status between the two assessment periods. | The threshold value is not achieved (sub-GES). Stations both fail and achieve their threshold values for all monitoring matrices. |
| Western Gotland Basin (SEA-010) | Failed | Failed | No change in status between the two assessment periods. | The threshold value is not achieved (sub-GES). Sediment and some biota stations achieve their threshold values, but not all biota evaluations. |
| Gulf of Riga (SEA-011) | Not evaluated | Failed | New data availability has facilitated an evaluation for this assessment period. | The threshold value is not achieved (sub-GES) Monitoring only occurs in biota. |
| Northern Baltic Proper (SEA-012) | Failed | Failed | No change in status between the two assessment periods. | The threshold value is not achieved (sub-GES). Sediment achieves but biota stations fail to achieve their threshold value. |
| Gulf of Finland (SEA-013) | Failed | Failed | No change in status between the two assessment periods. | |
| Åland Sea (SEA-014) | Achieved | Achieved | No change in status between the two assessment periods. | The threshold value is achieved (GES). Only a single sediment station is evaluated. |
| Bothnian Sea (SEA-015) | Achieved | Achieved | No change in status between the two assessment periods. | The threshold value is achieved (GES). Sediment and biota achieved their threshold values. |
| The Quark (SEA-016) | Failed | Failed | No change in status between the two assessment periods. | The threshold value is not achieved (sub-GES) Monitoring only occurs in biota. |
| Bothnian Bay (SEA-017) | Failed | Failed | No change in status between the two assessment periods. | The threshold value is not achieved (sub-GES). Sediment achieved the threshold value but biota did not. |
5 Confidence
The overall confidence of the indicator evaluation is generally moderate, with some assessment units being classified as high or low confidence (Figure 12 and further details in Annex 1).
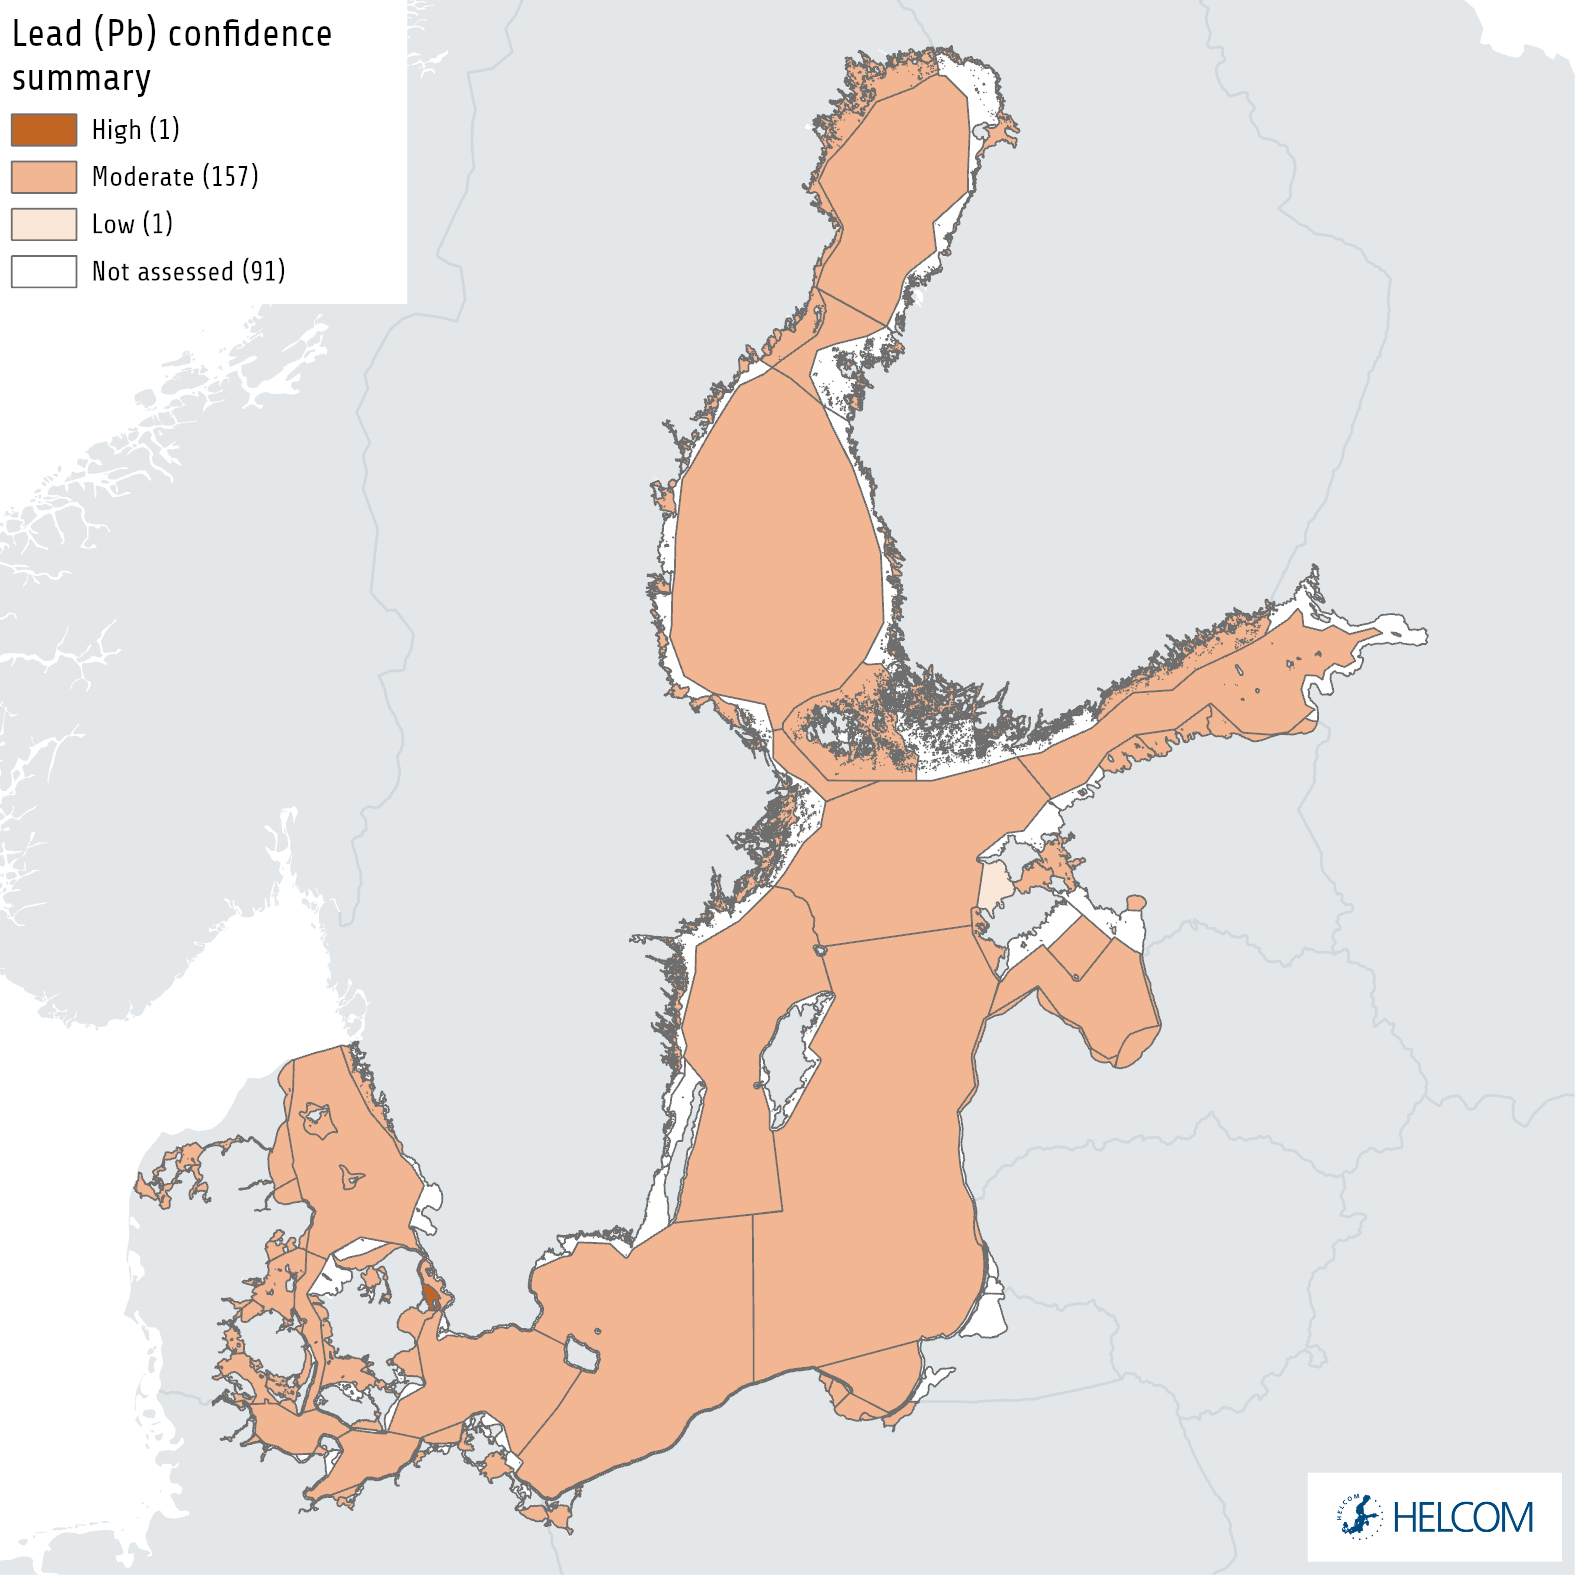
Figure 12. Map presenting the confidence in the overall evaluation based on a OOAO summary of confidence across all monitored matrices (see Annex 1). The evaluation is carried out using Level 4 HELCOM assessment units (defined in the HELCOM Monitoring and Assessment Strategy Annex 4).
The accuracy of the estimation method is considered to be high, and the risk of false status classifications is considered to be very low. The underlying monitoring data is of high quality and regionally comparable.
The data on lead concentrations in seawater was reported by Estonia, Germany, Lithuania and Poland and covers 10 sub-basins. The confidence of the evaluation based on seawater results is medium.
The data on metal concentrations in fish and bivalves, as well as in sediment, is spatially adequate and time series are available for several stations, therefore the confidence in the results is high.
6 Drivers, Activities, and Pressures
Drivers are often large and complex issues that are difficult to quantify, though in certain instances proxies can be utilised to express them or changes in them. A driver for example may relate to globalisation or political will and, while difficult to quantify in terms of specific relevance to an indicator, changes in drivers can catalyse changes in activities that will consequently influence pressures for example resulting in altered levels of shipping and the subsequent pressures for that activity. A brief overview of key pressures and activities is provided in Table 7.
One of the biggest sources of environmental pollution, including the marine environment, with heavy metals, is the combustion of solid fuels – such as coal, lignite, peat and wood – both in industrial and domestic conditions. In the case of lead, the main source was also leaded fuels until their ban in Europe in the 1990s. Current legal use of lead includes lead car batteries. In the last decades, EU or worldwide legislation has been put in place banning most uses of heavy metals.
The main routes of lead transport to the Baltic Sea are atmospheric deposition and river inflow (https://helcom.fi/wp-content/uploads/2019/08/BSEP162.pdf). The atmospheric deposition to the Baltic Sea can also originate from the transport of metals from outside the Baltic Sea catchment area.
Table 7. Brief summary of relevant pressures and activities with relevance to the indicator.
| | General | MSFD Annex III, Table 2a |
| Strong link | Substances, litter and energy
|
|
| Weak link |
7 Climate change and other factors
The observed climate change may impact the distribution and levels of lead in the marine environment. Among the direct parameters of climate change, the fate of lead in the Baltic Sea environment may be affected by the following:
- Seawater temperature – an increase in water temperature may affect the metabolism of marine organisms and increase the efficiency of bioaccumulation of lead
- Large-scale atmospheric circulation – it can affect the transport of pollutants, including lead and thus influence the amount of deposition to the waters of the Baltic Sea
- Precipitation – changes in the precipitation regime may affect the amount of atmospheric lead deposition to the Baltic Sea
- River run-off – may be an important source of lead entering the Baltic Sea; increasing the inflow in flood situations increases the inflow of lead
- Carbonate chemistry – changes in the pH of the aquatic environment may affect the transformations and thus the chemical forms of lead in the marine environment; they may affect also the metabolism of organisms and thus the efficiency of bioaccumulation of lead
- Sediment transportation – due to significant amounts of lead deposited in bottom sediments, dynamics at the bottom and transport of sediments may lead to secondary isotope release
Among the indirect parameters of climate change affecting lead fate in the marine environment are changes in oxygen levels. Projected warming may enhance oxygen depletion in the Baltic Sea, which may influence the biogeochemical processes involving lead.
8 Conclusions
In general, the indicator is fully operational and a wide-ranging evaluation can be made across the region. Lead persists in the environment and is toxic to marine life at elevated concentrations. A number of decreasing trends are detected, offering a good indication of improving conditions, however the evaluation of Good Environmental Status (GES) generally results in sub-GES conditions. Although in certain assessment units the threshold values in water and/or sediments are not achieved the failure to achieve the threshold value is somewhat common in biota (i.e. this commonly drives the overall evaluation). Biota is the most widely evaluated monitoring matrix across the region and when summarised (i.e. in the OOAO approach) sub-GES conditions are generally identified.
8.1 Future work or improvements needed
The current annual sampling of biota and sediment is considered to be of adequate frequency for the core indicator. The biota monitoring in each sub-basin depends on the availability of certain species during the time of monitoring cruises and cannot be secured at all times.
Further development of the confidence evaluation is likely valuable. It may also be relevant to explore trends in and between species used in the evaluation to explore if certain trends exist and may be possible to link with food web structure or function.
Exploring the possibility to include sediment core data in the future and to evaluate the added value of trends from dated sediment cores, in particular to evaluate trends over more extended time periods would be valuable.
Countries should consider extending monitoring to include lead measurements in seawater.
9 Methodology
The overall methodology is set out below.
9.1 Scale of assessment
The core indicator evaluates the status with regard to concentrations of metals using HELCOM assessment unit scale 4 (division of the Baltic Sea into 17 sub-basins division into coastal and offshore areas, and the coastal areas further divided into WFD water types or bodies).
The assessment units are defined in the HELCOM Monitoring and Assessment Strategy Annex 4.
9.2 Methodology applied
The evaluation is carried out using an agreed R-script (MIME) that applies the statistical analysis.
To evaluate the contamination status of the Baltic Sea, the ratio of the concentration of a metal to the specified concentration (threshold) levels is used for each biotic and abiotic elements (matrix) of the marine environment. A ratio above 1 therefore indicates non-compliance (failure to meet threshold). Taking into account the scope of monitoring programmes implemented by the EU MS regarding heavy metals, and the target concentrations of individual elements, the appropriate measurement matrices were recommended to allow the use of results in Descriptor 8.
All available data on lead (in seawater, fish liver, fish muscle, mussel soft tissue and bottom sediments) concentrations up to 2021, reported by HELCOM Contracting Parties to the HELCOM COMBINE database, was used to assess the state of the Baltic Sea environment.
The evaluation of the present environmental status in respect of heavy metal content has been carried out in all assessment units at scale 4, where data availability was sufficient.
The basis for the evaluation carried out in the sub-basins was the determination of the concentrations of individual metals in the respective matrices for each station, which were then compared with threshold values to determine the contamination ratio (CR). Good status in respect of single element is scored if CR ≤1.
A two-way approach was used to determine the representative concentrations of the individual metals in the individual matrices. In the case of stations where long-term data series exist, the agreed script (MIME Script) was used. This method allows determination of the upper value of the 95% confidence level which is regarded as a representative concentration. In the case of stations where data are from 1-2 years only or ‘less-than’ values make the correct assignment of the above statistical procedures impossible then data are treated as ‘initial’ data. All initial data is handled in a highly precautionary manner to further ensure that the risk of false positives is minimalised. For all initial data the 95% confidence limit on the mean concentration, based on the uncertainty seen in longer time series throughout the HELCOM area, is used. Applying a precautionary approach, the 90% quantile (psi value, Ψ) of the uncertainty estimates in the longer time series from the entire HELCOM region are used. The same approach is used for time series with three or more years of data, but which are dominated by less-than values (i.e. no parametric model can be fitted). The mean concentration in the last monitoring year (meanLY) is obtained by: restricting the time series to the period 2016-2021 (the last six monitoring years), calculating the median log concentration in each year (treating ‘less-than’ values as if they were above the limit of detection), calculating the mean of the median log concentrations, and then back-transforming (by exponentiating) to the concentration scale. The upper one-sided 95% confidence limit (clLY) is then given by:
 where n is the number of years with data in the period 2016-2021 (HELCOM 2018).
In order to ensure comparability of the measurements to the core indicator threshold value, the data to be extracted from the HELCOM COMBINE database has been defined in a so called ‘extraction table’. Relevant sections of the extraction table are presented in Table 2.
The evaluation of the present environmental status in respect of heavy metal content should be carried out, if possible – regarding data availability, in all assessment units (assessment units at scale 4).
9.3 Monitoring and reporting requirements
Monitoring methodology
HELCOM common monitoring of relevance to the indicator is described on a general level in the HELCOM Monitoring Manual in the programme topic: Concentrations of contaminants.
Quality assurance in the form of international workshops and proficiency testing has been organized annually by QUASIMEME since 1993, with two rounds each year for water, sediment and biota.
Current monitoring
The monitoring activities relevant to the indicator that is currently carried out by HELCOM Contracting Parties are described in the HELCOM Monitoring Manual in the relevant Monitoring Concept Tables.
Sub-programme: Contaminants in biota
Monitoring Concept Table
Sub-programme: Contaminants in water
Monitoring Concept Table
Sub-programme: Contaminants in sediment
Monitoring Concept Table
Concentrations of lead are being monitored by all the Baltic Sea countries. In addition to long-term monitoring stations of herring, cod, perch, flounder and eelpout, there is a fairly dense grid of monitoring stations for mussels and perch at the shoreline, but very few stations in the open areas of the Baltic Sea. The monitoring is, however, considered to be representative.
Description of optimal monitoring
Lead concentrations are spatially highly varying in the Baltic Sea. Therefore, a dense network of monitoring stations is needed to have reliable overviews of the state of the environment. The monitoring should contain both long-lived and mobile species (herring, cod, flounder) and more local species (perch and shellfish).
Sediment monitoring can complement the evaluation. Sediment represents longer timespans than biota (typically years vs. months), and are available in all places, whereas especially local species are not always available for spatial surveys. Time-trends from dated sediment cores in undisturbed (anoxic) areas can be a valuable source of information on the development in concentrations from before monitoring was started and even back to pre-industrialized times.
Monitoring of lead is relevant in the entire sea area.
10 Data
The data and resulting data products (e.g. tables, figures and maps) available on the indicator web page can be used freely given that it is used appropriately and the source is cited.
Data: Hazardous substances in biota
Data: Hazardous substances in sediment
Data: Hazardous substances in water
The indicator is based on data held in the HELCOM COMBINE database, hosted at the International Council for the Exploration of the Seas (ICES).
11 Contributors
Tamara Zalewska, Institute of Meteorology and Water Management-National Research Institute, Poland
Rob Fryer.
HELCOM Expert Group on Hazardous Substances.
HELCOM Secretariat: Owen Rowe, Deborah Shinoda, Joni Kaitaranta, and Jana Wolf.
12 Archive
This version of the HELCOM core indicator report was published in April 2023:
The current version of this indicator (including as a PDF) can be found on the HELCOM indicator web page.
Older versions of the core indicator report are available:
Metals HELCOM core indicator 2018 (pdf)
HOLAS II component – core indicator report – web-based version July 2017 (pdf)
HELCOM-CoreIndicator-Metals(Lead, Cadmium, Mercury) 2013 (pdf)
13 References
European Commission (2000) Directive 2000/60/EC of the European Parliament and of the Council of 23 October 2000 establishing a framework for Community action in the field of water policy. Off. J. Eur. Union L 327.
European Commission (2006a) Commission Regulation (EC) No 1881/2006 of 19 December 2006 setting maximum levels for certain contaminants in foodstuffs. Off. J. Eur. Union L 364.
European Commission (2008a) Directive 2008/56/EC of the European Parliament and the Council establishing a framework for community action in the field of marine environmental policy (Marine Strategy Framework Directive). Off. J. Eur. Union L 164: 19-40.
European Commission (2008b) Directive 2008/105/EC of the European Parliament and the Council on environmental quality standards in the field of water policy (Directive on Environmental Quality Standards). Off. J. Eur. Union L 348.
European Commission (2013) Directive 2013/39/EU of the European Parliament and of the Council of 12 August 2013 amending Directives 2000/60/EC and 2008/105/EC as regards priority substances in the field of water policy. Off. J. Eur. Union L 226: 1-17.
14 Other relevant resources
HELCOM (2010) Hazardous substances in the Baltic Sea – An integrated thematic assessment of hazardous substances in the Baltic Sea. Balt. Sea Environ. Proc. No. 120B.
HELCOM (2018): HELCOM Thematic assessment of hazardous substances 2011-2016. Baltic Sea Environment Proceedings n°157.
Law, R., Hanke, G., Angelidis, M., Batty, J., Bignert, A., Dachs, J., Davies, I., Denga, Y., et al. (2010) MARINE STRATEGY FRAMEWORK DIRECTIVE Task Group 8 Report Contaminants and pollution effects. JRC Scientific and Technical Reports.
Annex 1 Assessment unit level confidence summary
Confidence is evaluated per assessment unit based on a relative evaluation of following parameters for the copper indicator: 1) spatial component, 2) temporal component, 3) methodological component, and 4) the evaluation component. Despite the common approach applied with other indicators the information set out here is not directly comparable as it only focusses on an evaluation within each indicator (i.e. is relative only between the evaluated assessment units for lead) and it furthermore only addresses the evaluated units. More general information related to overarching confidence and required improvements are detailed in the main report.
The confidence for each component was applies based on a categorical approach using high, moderate and low. To achieve the overall summary confidence a score of 0.25 was applied to low, 0.5 to moderate and 1.0 to high with an average value calculated across the components and the same scores used to then select he final overall category.
Spatial component: Open Sea and coastal areas were treated separately due to the scale of sea area being vastly different. The area (km2) for each evaluated assessment unit was divided by the total number of stations in the assessment unit and the resulting area per station was used to divide into three categories, roughly interpreted as stations addressing small, medium or large areas. If a large number (relatively) of stations were still available despite the area being large an increase of 1 category was applied.
Temporal component: The presence of ‘full’ and/or ‘initial’ data series was utilised to evaluate this. Where only a single initial data series/station was present a category of low was applied, where two initial data series were available a category of moderate was applied, where a single full data series was present a category of moderate was applied, and where two or more full data series were present a category of high was applied.
Methodological component: A score of high is applied to all evaluated assessment units since the indicator is evaluated using the MIME tool and applies a regionally agreed methodology and threshold values on national monitoring data.
Evaluation component: The standard error generated within the MIME assessment tool is utilised as a proxy for this component. In simple terms the basis of this evaluation is that standard error can be roughly equated to a coefficient of variance. This therefore provides a general confidence evaluation of the underlying data and variation within it. A categorical approach was applied where standard error values >0.70 were scored as low, 0.4-0.7 were scored as moderate and <0.4 were scored as high.
The confidence is provided for for water, sediment and biota below (Annex 1 – Tables 1-3)..
The overall confidence for the OOAO status evaluation is also generated using a OOAO approach from these tables below, suing the overall category.
Annex 1 – Table 1. Summary table showing categorical confidence per component and overall for lead in water.
| Region | Spatial | Temporal | Methodological | Evaluation | Overall |
| DEN-113 | High | Low | High | Low | Moderate |
| EST-001 | High | Moderate | High | Low | Moderate |
| EST-002 | Moderate | Low | High | Low | Moderate |
| EST-003 | High | Moderate | High | Low | Moderate |
| EST-005 | High | High | High | High | High |
| EST-008 | High | Low | High | Low | Moderate |
| EST-009 | High | Low | High | Low | Moderate |
| EST-010 | Moderate | Low | High | Low | Moderate |
| EST-011 | High | Moderate | High | Low | Moderate |
| EST-013 | High | Low | High | Low | Moderate |
| EST-014 | Moderate | Low | High | Low | Moderate |
| EST-016 | High | Moderate | High | Low | Moderate |
| GER-002 | High | Moderate | High | Low | Moderate |
| GER-005 | High | Moderate | High | Low | Moderate |
| GER-007 | High | Moderate | High | High | Moderate |
| GER-010 | High | Moderate | High | High | Moderate |
| GER-013 | High | Moderate | High | Low | Moderate |
| GER-020 | High | Moderate | High | Moderate | Moderate |
| GER-026B | High | Moderate | High | High | Moderate |
| GER-029 | High | Low | High | Low | Moderate |
| GER-031 | High | Low | High | Low | Moderate |
| GER-032 | High | Low | High | Low | Moderate |
| GER-036A | High | Low | High | Low | Moderate |
| GER-044 | High | Moderate | High | High | Moderate |
| LIT-002 | High | Moderate | High | Low | Moderate |
| LIT-003 | High | Low | High | Low | Moderate |
| LIT-006 | High | Moderate | High | High | Moderate |
| POL-001 | High | Low | High | Low | Moderate |
| POL-002 | High | Moderate | High | Moderate | Moderate |
| POL-003 | High | Moderate | High | Low | Moderate |
| POL-004 | High | Low | High | Low | Moderate |
| POL-005 | High | Low | High | Low | Moderate |
| POL-006 | Moderate | Low | High | Low | Moderate |
| POL-007 | High | Low | High | Low | Moderate |
| POL-008 | High | Moderate | High | Low | Moderate |
| POL-009 | High | Low | High | Low | Moderate |
| POL-010 | High | Low | High | Low | Moderate |
| POL-011 | High | Low | High | Low | Moderate |
| POL-012 | High | Low | High | Low | Moderate |
| POL-014 | High | Low | High | Low | Moderate |
| POL-015 | High | Low | High | Low | Moderate |
| POL-016 | High | Low | High | Low | Moderate |
| POL-017 | High | Low | High | Low | Moderate |
| POL-018 | High | Low | High | Low | Moderate |
| POL-019 | High | Low | High | Low | Moderate |
| SEA-004 | High | Moderate | High | Low | Moderate |
| SEA-005 | High | High | High | Moderate | Moderate |
| SEA-006 | Moderate | High | High | High | Moderate |
| SEA-007 | Moderate | High | High | Moderate | Moderate |
| SEA-009 | Low | High | High | High | Moderate |
Annex 1 – Table 2. Summary table showing categorical confidence per component and overall for lead in sediment.
| Region | Spatial | Temporal | Methodological | Evaluation | Overall |
| DEN-024 | High | Low | High | Moderate | Moderate |
| DEN-045 | High | Low | High | Moderate | Moderate |
| DEN-085 | High | Low | High | Moderate | Moderate |
| DEN-092 | High | Low | High | Moderate | Moderate |
| DEN-128 | High | Low | High | Moderate | Moderate |
| DEN-136 | High | Low | High | Moderate | Moderate |
| DEN-137 | High | Low | High | Moderate | Moderate |
| DEN-142 | High | Low | High | Moderate | Moderate |
| EST-001 | Moderate | Low | High | Moderate | Moderate |
| EST-003 | High | Moderate | High | High | Moderate |
| EST-005 | High | Moderate | High | High | Moderate |
| EST-009 | High | Low | High | Moderate | Moderate |
| EST-014 | Moderate | Low | High | Moderate | Moderate |
| EST-016 | High | Moderate | High | High | Moderate |
| FIN-004 | Low | Low | High | Moderate | Moderate |
| LIT-006 | High | Moderate | High | High | Moderate |
| POL-002 | High | Moderate | High | High | Moderate |
| POL-003 | High | Moderate | High | High | Moderate |
| SEA-001 | Moderate | High | High | High | Moderate |
| SEA-004 | High | High | High | High | High |
| SEA-005 | High | High | High | High | High |
| SEA-006 | High | High | High | High | High |
| SEA-007 | High | High | High | High | High |
| SEA-008 | High | Low | High | Moderate | Moderate |
| SEA-009 | Moderate | High | High | High | Moderate |
| SEA-010 | High | High | High | High | High |
| SEA-012 | Low | High | High | High | Moderate |
| SEA-013 | High | Moderate | High | High | Moderate |
| SEA-014 | High | Moderate | High | High | Moderate |
| SEA-015 | Moderate | High | High | High | Moderate |
| SEA-017 | Moderate | High | High | High | Moderate |
Annex 1 – Table 3. Summary table showing categorical confidence per component and overall for lead in biota.
| Region | Spatial | Temporal | Methodological | Evaluation | Overall |
| DEN-001 | High | High | High | Moderate | Moderate |
| DEN-002 | High | High | High | Low | Moderate |
| DEN-006 | High | High | High | High | High |
| DEN-016 | High | Low | High | Low | Moderate |
| DEN-024 | High | Moderate | High | Moderate | Moderate |
| DEN-025 | High | Moderate | High | Low | Moderate |
| DEN-029 | High | Moderate | High | Low | Moderate |
| DEN-035 | High | High | High | Moderate | Moderate |
| DEN-036 | High | Low | High | Low | Moderate |
| DEN-037 | High | Low | High | Low | Moderate |
| DEN-045 | High | Low | High | Low | Moderate |
| DEN-046 | High | Low | High | Low | Moderate |
| DEN-047 | High | Moderate | High | Low | Moderate |
| DEN-049 | High | Moderate | High | Moderate | Moderate |
| DEN-062 | High | Moderate | High | Low | Moderate |
| DEN-072 | High | Low | High | Low | Moderate |
| DEN-074 | High | Low | High | Low | Moderate |
| DEN-080 | High | Low | High | Low | Moderate |
| DEN-083 | High | Low | High | Low | Moderate |
| DEN-087 | High | Low | High | Low | Moderate |
| DEN-089 | High | Low | High | Low | Moderate |
| DEN-090 | High | Moderate | High | Low | Moderate |
| DEN-092 | High | Moderate | High | Low | Moderate |
| DEN-096 | High | Moderate | High | Moderate | Moderate |
| DEN-102 | High | Low | High | Low | Moderate |
| DEN-104 | High | High | High | Low | Moderate |
| DEN-105 | High | High | High | Low | Moderate |
| DEN-106 | High | Low | High | Low | Moderate |
| DEN-109 | High | Moderate | High | Low | Moderate |
| DEN-110 | High | High | High | Moderate | Moderate |
| DEN-113 | High | Moderate | High | Low | Moderate |
| DEN-114 | High | Moderate | High | Low | Moderate |
| DEN-122 | High | Moderate | High | Low | Moderate |
| DEN-123 | High | Moderate | High | Low | Moderate |
| DEN-124 | High | High | High | Low | Moderate |
| DEN-125 | High | Low | High | Low | Moderate |
| DEN-127 | High | Moderate | High | Low | Moderate |
| DEN-128 | High | High | High | Low | Moderate |
| DEN-137 | High | High | High | Moderate | Moderate |
| DEN-138 | High | Low | High | Low | Moderate |
| DEN-139 | High | Moderate | High | Low | Moderate |
| DEN-140 | High | Low | High | Low | Moderate |
| DEN-141 | High | Low | High | Low | Moderate |
| DEN-142 | High | Low | High | Low | Moderate |
| DEN-145 | High | Low | High | Low | Moderate |
| DEN-146 | High | Low | High | Low | Moderate |
| DEN-147 | High | High | High | Low | Moderate |
| DEN-154 | High | Low | High | Low | Moderate |
| DEN-157 | High | High | High | Moderate | Moderate |
| DEN-159 | High | Moderate | High | Moderate | Moderate |
| DEN-160 | High | Moderate | High | Low | Moderate |
| DEN-200 | High | High | High | Moderate | Moderate |
| DEN-201 | High | High | High | Moderate | Moderate |
| DEN-204 | High | High | High | Moderate | Moderate |
| DEN-206 | High | High | High | Moderate | Moderate |
| DEN-209 | High | High | High | Moderate | Moderate |
| DEN-212 | High | High | High | Low | Moderate |
| DEN-214 | High | High | High | Moderate | Moderate |
| DEN-216 | High | High | High | Moderate | Moderate |
| DEN-217 | High | Moderate | High | Low | Moderate |
| DEN-219 | High | Moderate | High | Moderate | Moderate |
| DEN-222 | High | High | High | Low | Moderate |
| DEN-224 | High | Low | High | Low | Moderate |
| DEN-225 | High | High | High | Moderate | Moderate |
| DEN-231 | High | Moderate | High | Low | Moderate |
| DEN-232 | High | Moderate | High | Low | Moderate |
| DEN-233 | High | Moderate | High | Low | Moderate |
| DEN-234 | High | Moderate | High | Low | Moderate |
| DEN-235 | High | High | High | Moderate | Moderate |
| DEN-236 | High | Moderate | High | Low | Moderate |
| DEN-238 | High | Low | High | Low | Moderate |
| EST-002 | High | Low | High | Low | Moderate |
| EST-003 | High | Low | High | Low | Moderate |
| EST-005 | High | Low | High | Low | Moderate |
| EST-008 | High | Low | High | Low | Moderate |
| EST-009 | High | Low | High | Low | Moderate |
| EST-010 | Low | Low | High | Low | Low |
| EST-013 | High | High | High | Low | Moderate |
| EST-014 | High | Moderate | High | Low | Moderate |
| EST-016 | High | Low | High | Low | Moderate |
| EST-019 | Moderate | Moderate | High | Low | Moderate |
| FIN-001 | Moderate | Low | High | Low | Moderate |
| FIN-003 | High | High | High | Moderate | Moderate |
| FIN-004 | Low | Moderate | High | Low | Moderate |
| FIN-005 | Moderate | Moderate | High | Low | Moderate |
| FIN-006 | High | Low | High | Low | Moderate |
| FIN-008 | High | Low | High | Low | Moderate |
| FIN-010 | High | High | High | Moderate | Moderate |
| FIN-014 | Low | Moderate | High | Low | Moderate |
| GER-002 | High | High | High | Moderate | Moderate |
| GER-004 | High | High | High | Moderate | Moderate |
| GER-005 | High | Moderate | High | Low | Moderate |
| GER-010 | High | Moderate | High | Low | Moderate |
| GER-011 | High | Moderate | High | Low | Moderate |
| GER-013 | High | Moderate | High | Low | Moderate |
| GER-020 | High | High | High | Moderate | Moderate |
| GER-023 | High | Moderate | High | Low | Moderate |
| LAT-002 | High | Low | High | Low | Moderate |
| LAT-003 | High | Low | High | Low | Moderate |
| LAT-004 | High | Low | High | Low | Moderate |
| LAT-005 | High | Low | High | Low | Moderate |
| LIT-002 | High | High | High | Low | Moderate |
| LIT-003 | High | Moderate | High | Moderate | Moderate |
| LIT-006 | High | Moderate | High | Moderate | Moderate |
| POL-002 | High | Moderate | High | Low | Moderate |
| POL-003 | High | Moderate | High | Low | Moderate |
| POL-006 | High | Moderate | High | Low | Moderate |
| POL-015 | High | Moderate | High | Low | Moderate |
| POL-019 | High | Low | High | Low | Moderate |
| SWE-003 | High | Moderate | High | Low | Moderate |
| SWE-011 | Low | Moderate | High | Low | Moderate |
| SWE-012 | High | High | High | Moderate | Moderate |
| SWE-016 | High | High | High | Moderate | Moderate |
| SWE-018 | Moderate | Moderate | High | Low | Moderate |
| SWE-020 | High | Low | High | Low | Moderate |
| SWE-021 | High | High | High | Moderate | Moderate |
| SWE-022 | High | High | High | Moderate | Moderate |
| SWE-023 | Low | Moderate | High | Low | Moderate |
| SEA-001 | Moderate | High | High | Moderate | Moderate |
| SEA-002 | High | Moderate | High | Moderate | Moderate |
| SEA-003 | High | Moderate | High | Low | Moderate |
| SEA-004 | High | Moderate | High | Low | Moderate |
| SEA-005 | High | Moderate | High | Low | Moderate |
| SEA-006 | High | High | High | High | High |
| SEA-007 | Moderate | High | High | High | Moderate |
| SEA-008 | High | Moderate | High | Low | Moderate |
| SEA-009 | High | High | High | High | High |
| SEA-010 | Low | High | High | Moderate | Moderate |
| SEA-011 | High | Moderate | High | Moderate | Moderate |
| SEA-012 | Low | High | High | Moderate | Moderate |
| SEA-013 | High | High | High | Moderate | Moderate |
| SEA-015 | Moderate | High | High | Moderate | Moderate |
| SEA-016 | High | Low | High | Low | Moderate |
| SEA-017 | Low | Moderate | High | Low | Moderate |