 Oil spills
Oil is an important commodity in the region, with large volumes being transported across the Baltic Sea, and it constitutes the main fuel for the majority of ships in the region. Oil, bilgewater and other petroleum products end up in the marine environment through intentional introduction or due to negligence, often as oil in bilge water, via dumping of waste oil, or due to release during accidents. Accidents in the Baltic Sea mostly occur around the port areas and concern cargo vessels or passenger ships but rarely cause any pollution. Groundings have been the most common cause of accidents followed by contact with fixed or floating object and collisions (HELCOM 2021). In certain cases oil can also be released from wrecks resulting from earlier accidents or incidents. All oil spills pose a significant threat to water birds and other marine animals, both acute (death) and chronic toxic effects are known.
The indicator evaluates the sustainability of and handling of oil and petroleum products in the Baltic Sea region, as sustainable activities should ensure a minimal number of spills and minimum volume of oil introduced to the marine environment.
2.1 Ecological relevance
The introduction of non-synthetic oil-based products to the sea poses a severe threat to the integrity of populations of seabirds and can also cause alterations in the food web through introduction of polyaromatic hydrocarbons to the planktonic food-web. Devastating effects of oil on waterbirds can also have a structural effect on marine food web integrity, as waterbirds are an integral part of the Baltic Sea ecosystem and play an important role in the marine food-web as herbivores, benthivores, piscivores or scavengers.
Waterbirds aggregate to specific feeding grounds in winter. Up to 90% of the wintering population aggregates to areas less than 5% of the entire Baltic Sea according to a census (Durinck et al. 1994). Any oil spills in or near these areas constitute a severe threat to the entire waterbird population in the Baltic Sea. Small amounts of oil on the sea surface are sufficient to cause severe pressure on waterbird populations as the birds spend most of the time on the sea surface. Even minor oil contamination of the plumage is known to severely reduce the buoyancy of the waterbirds and expose them to hypothermia. Spills can also affect other species that inhabit the sea on short- or longer-term scales and impacts may alter food web structures or function from the microscopic level to higher trophic levels. Lasting effects may also be caused if substances are retained in the environment (e.g. on coastal surfaces, in sediments or within the water column). In the last decade maritime transportation has been growing steadily. An increase in the number of ships also means an increased risk of accidents or risk of a larger number of oil discharges. All forms of vessels, from oil tankers to smaller leisure vessels may contribute to the risk of spills (HELCOM BRISK 2013).
2.2 Policy relevance
The Baltic Sea area has been designated as a ‘special area’ in accordance with International Convention for the Prevention of Pollution from Ships (MARPOL), 1973, as modified by the Protocol of 1978 relating thereto, Annexes I (oil), IV (sewage) and V (garbage). Any discharge of oil or oily mixtures into the Baltic Sea is prohibited in accordance with MARPOL (1973/1978) and the 1992 Helsinki Convention.
The goal is to minimize the input of hazardous substances to support the achievement of good environmental status (GES) of the marine environment. This includes achievement of management objectives under the Baltic Sea Action Plan (BSAP 2021) such as ‘Minimize input and impact of hazardous substances from human activities’ to achieve goals such as ‘Baltic Sea unaffected by hazardous substances and litter’. Similarly, under the EU Marine Strategy Framework Directive (MSFD) the aim under Descriptor 8 is to achieve conditions where ‘Concentrations of contaminants are at levels not giving rise to pollution effects’. The pressure from oil spills must be kept at a low level in order to reach these goals. Aspects of policy relevance are further addressed in Table 1.
Far-reaching prohibitions and restrictions on any discharge into the sea of oil or oily mixtures, sewage from passenger ships and garbage have been introduced by the Baltic Sea States to comply with the requirements of a MARPOL ‘special area’. Oil is defined as meaning petroleum in any form, including crude oil, fuel oil, sludge, oil refuse and refined products. Oil discharges are equally prohibited from the cargo tanks of oil tankers and any machinery spaces or ballast tanks of all types of ships. Some discharge of oily mixtures can be permitted but only when the oil content of the effluent does not exceed 15 parts per million. The oil filtering equipment of all ships of 400 gross tonnage or above must have arrangements that ensure an automatic stop if the oil content of any discharge exceeds 15 parts per million. All ships less than 400 gross tonnage flying the flag of a State bordering the Baltic Sea, should comply with guidelines concerning holding tanks or filtering equipment for separating oily water. The responsibility for avoiding discharges of oil or other harmful substances rests not only with the master and his crew, but also with the charterer, the ship-owner and the ports.
All ships entering the Baltic Sea area are urged to comply with the anti-pollution regulations of the 1992 Helsinki Convention. This applies to all ships, irrespective of whether or not they are flying the flag of a Contracting Party to the Helsinki Convention. To uphold the anti-pollution regulations, all ships, with some exceptions, are required to deliver waste oil to a reception facility before leaving port. Oil loading terminals and repair ports are provided with reception facilities to receive and treat all the dirty ballast and tank washing water from oil tankers. Additionally, all ports are provided with reception facilities for other residues and oily mixtures from all ships. The countries bordering the Baltic Sea have agreed that a ship should not be charged for using the reception facilities to encourage delivery, also known as the no-special-fee system, and that the cost is to be covered through e.g. general harbor fees or general environmental fees.
The EU directive on port reception facilities for ship-generated waste and cargo residues (2000/59/EC) aims to reduce the discharges of ship-generated wastes and cargo residues into the sea, especially illegal discharges, by improving the availability and use of port reception facilities. The directive recognizes and does not contradict with the procedures and mechanisms agreed by the Contracting Parties to the Helsinki Convention.
Table 1. Policy relevance of this specific HELCOM indicator
| Baltic Sea Action Plan (BSAP) | Marine Strategy Framework Directive (MSFD) | |
| Fundamental link | Segment: Sea-based activities
Goal: “Environmentally sustainable sea-based activities”
|
Descriptor 8 Concentrations of contaminants are at levels not giving rise to pollution effects.
|
| Complementary link | Segment: Hazardous substances and litter goal
Goal: “Baltic Sea unaffected by hazardous substances and litter”
Management objective: “Minimize input and impact of hazardous substances from human activities”. |
Descriptor 8 Concentrations of contaminants are at levels not giving rise to pollution effects.
Descriptor 8 Concentrations of contaminants are at levels not giving rise to pollution effects.
Descriptor 9 Contaminants in fish and other seafood for human consumption do not exceed levels established by Union legislation or other relevant standards.
(a) for contaminants listed in Regulation (EC) No 1881/2006, the maximum levels laid down in that Regulation, which are the threshold values for the purposes of this Decision; (b) for additional contaminants, not listed in Regulation (EC) No 1881/2006, threshold values, which Member States shall establish through
|
| Other relevant legislation: |
|
|
2.3 Relevance for other assessments
The oil spills indicator acts as a stand alone indicator and is currently not utilised in subsequent integrated assessments of hazardous substances (that integration focussing on the integration of specific substances of groups of substances and their chemical concentrations). However, the information from the indicator is utilised within the HOLAS Thematic Assessment on hazardous substances/pollution to provide a broad context of the pressures from hazardous substances on the marine environment.
3 Threshold values
The threshold values for the indicator are defined as the annual average volume of oil introduced to each sub-basin during the selected reference period (Table 2). The reference period selected for the modern baseline in this indicator is 2008-2013, during which the estimated volume from spills have been at a historically low level (Figure 2).
Table 2. Threshold values expressed as volume of oil per sub-basin.
| Sub-basin | Annual average of total spills during reference period 2008-2013 [m³] |
| Bothnian Bay | 0,1135 |
| The Quark | 0,0007 |
| Bothnian Sea | 0,1863 |
| Åland Sea | 0,1363 |
| Gulf of Finland | 5,2447 |
| Northern Baltic Proper | 14,3056 |
| Gulf of Riga | 0,0124 |
| Western Gotland Basin | 0,2304 |
| Eastern Gotland Basin | 1,8503 |
| Gdansk Basin | 0,1038 |
| Bornholm Basin | 2,8667 |
| Arkona Basin | 7,6978 |
| Bay of Mecklenburg | 0,4070 |
| Kiel Bay | 0,1575 |
| The Sound | 0,1121 |
| Great Belt | 0,4215 |
| Kattegat | 0,4212 |
3.1 Setting the threshold value(s)
It is important to note, that the HELCOM Contracting Parties have committed to the goal ‘Enforce international regulations – no illegal discharges’ in the Baltic Sea Action Plan (BSAP 2021), in line with the 1992 Helsinki Convention, and that this goal is aligned with the requirements of MARPOL Annex I. This goal is still to be strived for and is not substituted by the threshold values used to evaluate this indicator. The threshold values of this core indicator have been derived for the purpose of evaluating the status of the marine environment, and exceeding the target is considered as having a harmful effect on the environment. However, reaching the level of zero spills must still be strived for in the long-term.
The threshold values applied are derived based on a 2008-2013 reference period during which the estimated volume from spills have been at a historically low level. This approach ensures that no worsening of conditions and thus environmental status occurs while also targeting overarching goals of the BSAP such as, a Baltic Sea unaffected by hazardous substances and litter.
4 Results and discussion
The results of the indicator evaluation that underly the key message map and information are provided below.
4.1 Status assessment
Volume of oil detected in the Baltic Sea
During the assessment period 2016-2021 the estimated annual average of oil-spills exceeded the amount during the reference period (2008-2013) in four of the 17 HELCOM sub-basins (Table 3).
Table 3. Indicator evaluation and respective thresholds for the assessment period 2016-2021.
| Sub-basin | Threshold value; annual average of total spills during reference period 2008-2013, m³ | Evaluation; annual average of total oil spills during assessment period 2016-2021, m³ | Indicator result red – fail threshold green – achieve threshold |
| Bothnian Bay | 0.1135 | 0.0507 | Bothnian Bay |
| The Quark | 0.0007 | 0.0000 | The Quark |
| Bothnian Sea | 0.1863 | 0.3263 | Bothnian Sea |
| Åland Sea | 0.1363 | 0.0130 | Åland Sea |
| Gulf of Finland | 5.2447 | 3.0962 | Gulf of Finland |
| Northern Baltic Proper | 14.3056 | 1.7050 | Northern Baltic Proper |
| Gulf of Riga | 0.0124 | 0.0000 | Gulf of Riga |
| Western Gotland Basin | 0.2304 | 0.3840 | Western Gotland Basin |
| Eastern Gotland Basin | 1.8503 | 0.0563 | Eastern Gotland Basin |
| Gdansk Basin | 0.1038 | 0.3169 | Gdansk Basin |
| Bornholm Basin | 2.8667 | 1.0835 | Bornholm Basin |
| Arkona Basin | 7.6978 | 1.2275 | Arkona Basin |
| Bay of Mecklenburg | 0.4070 | 0.0060 | Bay of Mecklenburg |
| Kiel Bay | 0.1575 | 0.0432 | Kiel Bay |
| The Sound | 0.1121 | 0.0090 | The Sound |
| Great Belt | 0.4215 | 0.0000 | Great Belt |
| Kattegat | 0.4212 | 1.3118 | Kattegat |
The largest relative exceedance of the threshold value of any sub-basin that failed the threshold value was detected in the Kattegat where spill volume exceeded the threshold value circa three-fold. The Gdansk basin also exceeded it’s respective threshold value by circa a factor of two, whereas the Bothnian Sea and the Western Gotland Basin exceeded by smaller relative amounts. The basin which was exposed to the highest total volume of spilt oil during the assessment period was the Gulf of Finland (3.0962 m3). The Quark, Gulf of Riga and Great Belt sub-basins did not have any documented spills. The total number of sub basins exceeding the threshold values in the 2016-2021 assessment period is half of that comparison to the 2011-2016 assessment period.
4.2 Trends
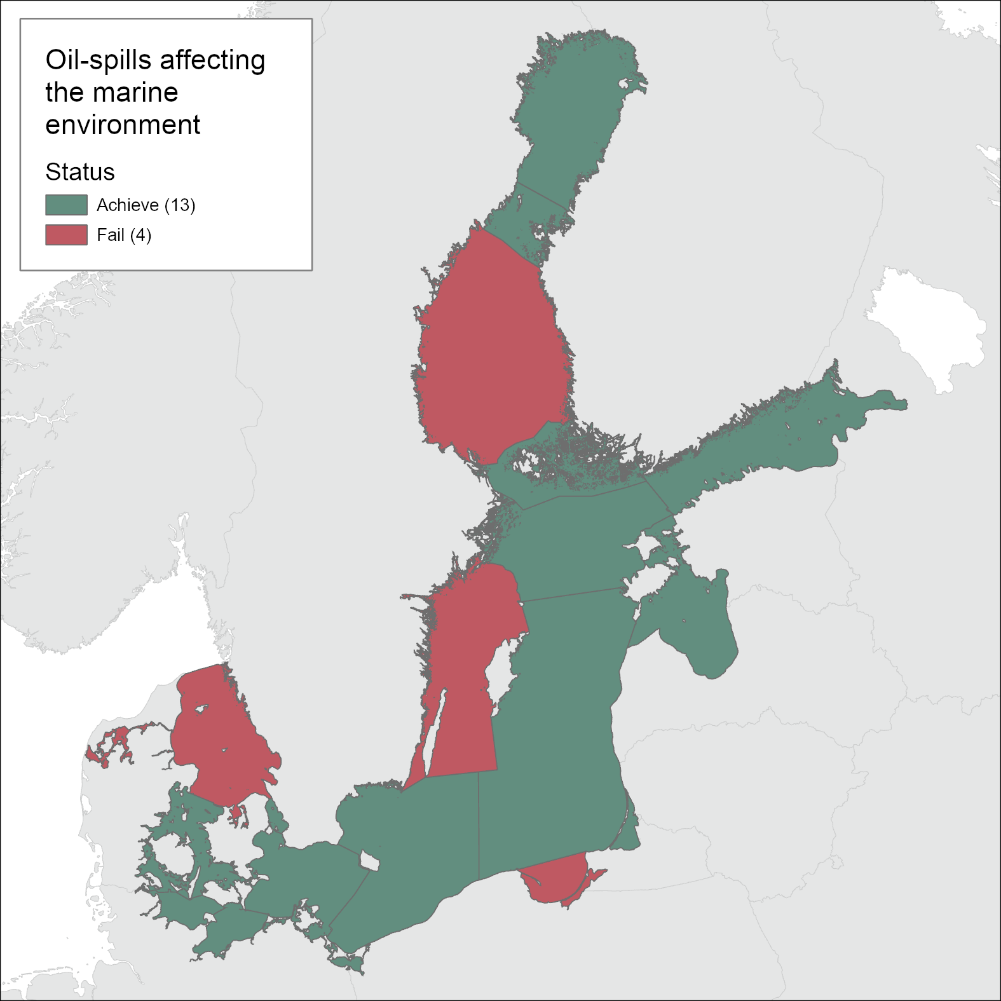
By examining the amount of oil released into the marine environment from the monitoring period between the 1980’s and 2021 (Figure 2), it becomes apparent that a clear downward trend can be observed. The downward trend is not as stark after the year 2008 (in part due do to the generally low level achieved), whereafter the volume of oil spill remains lower than previous decades and somewhat plateaued. The decrease is, when considering the increased shipping traffic, a positive sign especially as no corresponding increase of spills is recorded. The number of flight hours, i.e. the monitoring effort, has varied during these decades and shows a slight tendency to decrease during the previous years. However, the documented decrease in amounts of oil introduced to the Baltic Sea is considered to reflect the actual situation, as the supporting parameter on pollution per flight hour index confirms the decrease.
The peaks detected in 1990 and 2004 were likely caused by single events (Figure 2). In 1990 an accidental spill due to a collision between the Soviet tanker Volgonef 1263 and the West German dry cargo ship Betty along the Swedish south coast is the main cause, whereas the underlying cause for the oil release in 2004 is undocumented. The peak values highlight that single oil spills may introduce large amounts of oil to the environment, highlighting the importance of adequate response preparedness, and underlines the importance of estimating the volume of introduced oil when evaluating whether the pressure is at a level allowing the environment to reach a Good Environmental Status. This further reflects on the current evaluation, as the exceedance of the threshold value in Kattegat was primarily caused by a larger spill in 2017 (5.9634 m3) which accounted for an approximate 68% of the total spill volume throughout the assessment period.
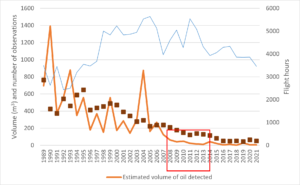
Figure 2. The estimated volume of oil from detected oil spills and the number of observations and flight hours between 1989 and 2021. The red square identifies the reference period used to determine the threshold value.
Overall decreasing trends have been detected in both the number of spills and the size of single spills. Noticeably, the number of detected oil spills larger than 10m3 has decreased significantly in recent decades (Figure 3). Out of the 317 detected oil spills in the assessment period of 2016-2021 91% were estimated to be less than 0.1 m3 (when including unknown size of oil spills).
Figure 3. The number of detected oil spill and the size of detected oil spill between the years 1998 and 2021.
Monitoring effort during the assessment period as flight hours
All HELCOM countries have been involved in aerial surveillance monitoring during the assessment period, during which a slight downward trend in the total number of flight hours can be detected (Figure 4).
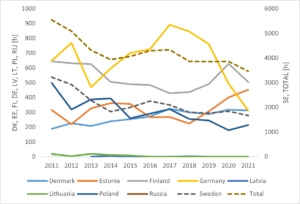
Figure 4. Total number of flight hours in the aerial survey per country between 2011-2021. Note that the number of flight hours for Sweden (dashed grey line) and the total number of flight hours (dashed black line), are indicated on the secondary vertical axis. No data are currently available from Russia.
The total number of aerial surveillance flight hours during the year 2021 varied between countries (Figure 5).
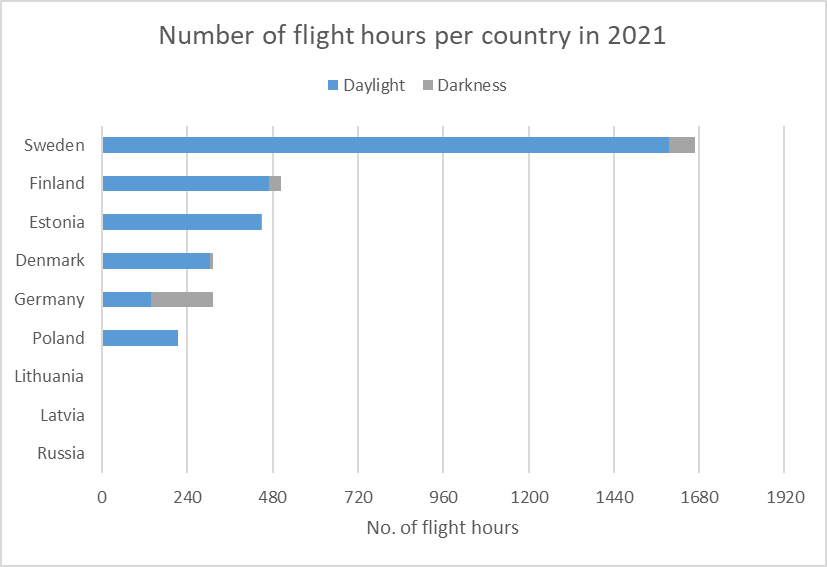
Figure 5. Number of flight hours per country in daylight and darkness during the year 2021.
4.3 Discussion
The status evaluation for the period 2016-2021 (HOLAS 3) continues to show a general decrease in both the number and volume of Oil spills detected through aerial surveillance affecting the marine environment. Fewer sub-basins failed their respective threshold values in this assessment period and in many instances those assessment units that failed to achieve their threshold values do so mainly due to the occurrence of a single accidental spill event. These aspects are explored further in Table 4.
Table 4. Comparative overview between current and prior assessment periods.
| HELCOM Assessment unit name (and ID) | Threshold value achieved/failed – HOLAS II (value m3, colour defines fail-red/achieve-green | Threshold value achieved/failed – HOLAS 3 (value m3, colour defines fail-red/achieve-green | Distinct trend between current and previous assessment. | Description of outcomes, if pertinent. |
| Bothnian Bay | 0.2936 | 0.0507 | Status has improved as less volume of spilt oil was detected in this assessment period enabling the threshold value to be achieved in this period. | The indicator evaluation achieved the threshold value as the volume of detected oil was circa half that of the established threshold value in this assessment period. |
| The Quark | 0.0480 | 0.0000 | Status has improved as no volume of spilt oil was detected in this assessment period enabling the threshold value to be achieved in this period. | The indicator evaluation achieved the threshold value as no oil detected in this assessment period. |
| Bothnian Sea | 0.3023 | 0.3263 | Status has remained stable and both assessment periods failed the threshold value with a similar volume of oil being detected in both periods. | The indicator evaluation failed the threshold value as the volume of detected oil was circa double that of the established threshold value in this assessment period. |
| Åland Sea | 0.7237 | 0.0130 | Status has improved as less volume of spilt oil was detected in this assessment period enabling the threshold value to be achieved in this period. | The indicator evaluation achieved the threshold value as the volume of detected oil was well below the established threshold value in this assessment period. |
| Gulf of Finland | 3.0210 | 3.0962 | Status has remained stable with near identical volumes detected in both assessment periods and both periods achieving the threshold value. | The indicator evaluation achieved the threshold value as the volume of detected oil was below the established threshold value in this assessment period. |
| Northern Baltic Proper | 1.6685 | 1.7050 | Status has remained stable with near identical volumes detected in both assessment periods and both periods achieving the threshold value. | The indicator evaluation achieved the threshold value as the volume of detected oil was well below the established threshold value in this assessment period. |
| Gulf of Riga | 0.0000 | 0.0000 | Status has remained stable (achieving the threshold value) as no volume of spilt oil was detected in either assessment period. | The indicator evaluation achieved the threshold value as no oil detected in this assessment period. |
| Western Gotland Basin | 0.4440 | 0.3840 | Status has remained stable with similar volumes detected in both assessment periods and both periods failing to achieve the threshold value. | The indicator evaluation failed the threshold value as the volume of detected oil was circa double that of the established threshold value in this assessment period. |
| Eastern Gotland Basin | 2.4050 | 0.0563 | Status has improved as less volume of spilt oil was detected in this assessment period enabling the threshold value to be achieved in this period. | The indicator evaluation achieved the threshold value as the volume of detected oil was well below the established threshold value in this assessment period. |
| Gdansk Basin | 0.0852 | 0.3169 | Status has deteriorated with the threshold value failed in the current assessment period. This is due to a number of smaller spills being detected (11) during the assessment period. | The indicator evaluation failed the threshold value as the volume of detected oil was circa three-fold higher than that of the established threshold value in this assessment period. |
| Bornholm Basin | 1.4483 | 1.0835 | Status has remained stable with similar volumes detected in both assessment periods and both periods achieving the threshold value. | The indicator evaluation achieved the threshold value as the volume of detected oil was below the established threshold value in this assessment period. |
| Arkona Basin | 5.8551 | 1.2275 | Status has remained stable though a significant reduction in volumes detected in the current assessment period was recorded despite both periods achieving the threshold value. | The indicator evaluation achieved the threshold value as the volume of detected oil was well below the established threshold value in this assessment period. |
| Bay of Mecklenburg | 0.2134 | 0.0060 | Status has remained stable though a significant reduction in volumes detected in the current assessment period was recorded despite both periods achieving the threshold value. | The indicator evaluation achieved the threshold value as the volume of detected oil was well below the established threshold value in this assessment period. |
| Kiel Bay | 0.1392 | 0.0432 | Status has remained stable though a significant reduction in volumes detected in the current assessment period was recorded despite both periods achieving the threshold value. | The indicator evaluation achieved the threshold value as the volume of detected oil was well below the established threshold value in this assessment period. |
| The Sound | 0.0312 | 0.0090 | Status has remained stable though a significant reduction in volumes detected in the current assessment period was recorded despite both periods achieving the threshold value. | The indicator evaluation achieved the threshold value as the volume of detected oil was well below the established threshold value in this assessment period. |
| Great Belt | 2.9051 | 0.0000 | Status has improved as no volume of spilt oil was detected in this assessment period. | The indicator evaluation achieved the threshold value as no oil detected in this assessment period. |
| Kattegat | 0.5109 | 1.3118 | Status has remained stable with the threshold value failed in both assessment periods. The volume of oil detected in the current assessment period is also significantly higher in the current period, the majority of which comes from a single spill event in 2017. | The indicator evaluation failed the threshold value as the volume of detected oil was circa three-fold higher than that of the established threshold value in this assessment period. |
5 Confidence
Aerial surveys of oil spills have been carried out by HELCOM Contracting Parties with standardized methods, covering the entire Baltic Sea for many years. Thus, the confidence of the indicator evaluation is high. Since 2011 the number of flight hours have slightly decreased and some countries have not been able to conduct aerial surveillance according to the standardized methods, including during this assessment period. Reductions in flight time may also however be to an extent compensated by other technologies such as satellite monitoring. However, if this trend in reduced monitoring effort continues, the confidence of the indicator evaluation may need to be reevaluated in the future.
6 Drivers, Activities, and Pressures
A number of drivers, activities and pressures can influence the potential for oil spills to occur. Drivers behind increases of decreases in activities (e.g. activities such as shipping, tourism or fishing) may include broad issue such as food requirement or globalisation. Drivers that increase activities represent a risk in the potential for spills to occur. Good management and response activities can however also have significant reduction on the risk of spill occurrence. The information briefly addressed in this section aims to support the conceptualisation of this indicator evaluation within causal/management frameworks. Future work on this topic to build more detailed and specific interlinkages between drivers, activities and pressures, and how they are relevant to status are expected to be part of future work within HELCOM.
Table 5. Brief summary of relevant pressures and activities with relevance to the indicator.
| | General | MSFD Annex III, Table 2a |
| Strong link | The incidental release of oil rich substances either purposely or due to negligence. | Introduction of other substances, whether solid, liquid or gas, in marine waters, resulting
from their systematic and/or intentional release into the marine environment, as permitted in accordance with other Community legislation and/or international conventions. |
| Weak link | Environmental effecting substances connected to oil discharges. | Substances, energy and litter- Input of other
substances (e.g. synthetic substances, nonsynthetic substances, radionuclides) – diffuse sources, point sources, atmospheric deposition, acute events. |
7 Climate change and other factors
Future climate change scenarios are not expected to have a direct impact on this indicator. There are however several factors associated with climate change that are relevant related both to the potentially increased sensitivity of the ecosystem and changes in human activities. Increased maritime traffic and increased tourism are potential aspects that may change due to human behavioral responses and these could create the potential for Oil spills detected through aerial surveillance affecting the marine environment. Such events may also be influenced by more extreme weather events. In addition, the response of the Baltic Sea ecosystem and biodiversity/food webs may be more sensitive to pressures from spill events due to the increase cumulative effects from the broad range of pressures also exerted by climate change.
8 Conclusions
The current evaluation carried out for the oil spill indicator shows that, based on the thorough monitoring of the Baltic through aerial surveillance, four of the 17 HELCOM sub-basins fail to achieve the agreed threshold values. Taken at the Baltic Sea level it further shows the continuity of lowered occurrence and lowered volume of spilt oil, a trend maintained since the early 2000s or before. In this evaluation only four sub basins exceeded the threshold value for the assessment period, which is an improvement from the previous evaluations.
8.1 Future work or improvements needed
The indicator is operational and achieved its aims. While not specifically related to this indicator other development on closely associated topics may be valid to consider for the future including: addressing spills of other relevant substances (e.g. including other substances detected by aerial surveillance), aspects related to defining what constitutes a significant pollution event, and the appropriate environmental follow up monitoring in relation to such events (should they occur). Stronger development and the details specification of issues associated with drivers, activities and pressures, and the subsequent link to status would be good to evaluate further.
9 Methodology
Co-operation on surveillance within the Helsinki Convention is carried out in accordance with Annex VII (Regulations 1, 3, 4, 10) to the 1992 Helsinki Convention and HELCOM Recommendation 34E/4. The procedures are further specified in Chapter 6 of HELCOM Response Manual.
The aerial and satellite surveillance activity conducted in the Baltic Sea by the HELCOM Contracting Parties is described in the HELCOM Response Manual, Chapter 6 on aerial surveillance, including flight frequency, cooperation, equipment to be used, observation and documentation of spills etc.
9.1 Scale of assessment
The assessment units considered appropriate for this pressure core indicator are the 17 sub-basins of the Baltic Sea, i.e. the HELCOM scale 2 assessment units.
9.2 Methodology applied
Contracting Parties bordering the Baltic Sea are to conduct aerial surveillance in order to detect suspected offenders to the anti-pollutant regulations in accordance with the 1992 Helsinki Convention Annex VI. The aerial surveillance should be carried out at least twice per week over regular traffic zones including approaches to major sea ports as well as in regions with regular offshore activities. Other regions with sporadic traffic and fishing activities should be covered once per week. Experienced observers/pilots shall conduct reliable detections, classifications and quantification of observed pollution, their frequencies and geographical distributions. Also the Coordinated Extended Pollution Control Flights (CEPCO), which constitutes continuous surveillance of specific areas in the Baltic Sea are to be organized regularly (Super CEPCO biannually in the Baltic Sea (duration: several days), CEPCO North/CEPCO South, every second year, when there is no Super CEPCO (duration: 24h or more), Mini CEPCO, when considered needed (duration: 12h or more).
Aerial surveillance is supported by satellite observations of the CleanSeaNet (CSN) satellite surveillance service provided by the European Maritime Safety Agency (EMSA). It is recommended that satellite detections are checked as soon as possible by aerial surveillance or other means available.
Monitoring is carried out based on agreed methods described in the HELCOM Monitoring Manual in the sub-programme Acute Pollution based on the approach developed through the HELCOM Response Manual.
Assessment protocol
The assessment units considered appropriate for this pressure core indicator are the 17 sub-basins of the Baltic Sea, i.e. the HELCOM scale 2 assessment units.
The ArcMap 10.3 Selection tool (Select by location- Are within a distance of the source layer feature: 1km) has been used to select the spills within an assessment unit/sub-basin and to sum the amount of oil from these spills. Finally, the annual average of spilled oil has been summed separately for each sub-basins in the assessment period.
Compliance to the threshold is to be evaluated annually for each assessment unit. The estimated volumes from all detected oil spills are summed to form an annual oil-spill estimate for each sub-basin. The methods for estimating the volume of each detected oil spill are detailed in the Standard Pollution Observation Format Completion Guide referred to in the HELCOM Response Manual.
It should be noted, that aerial surveillance efforts are focused along the most heavily trafficked shipping routes in the Baltic Sea, and the main route constitutes the Baltic Deep-Water Route from the Danish Straits to St Petersburg. This can be illustrated via the spatial distribution of the detected oil-spills during the reference period and shipping density during 2011 (Figure 6).
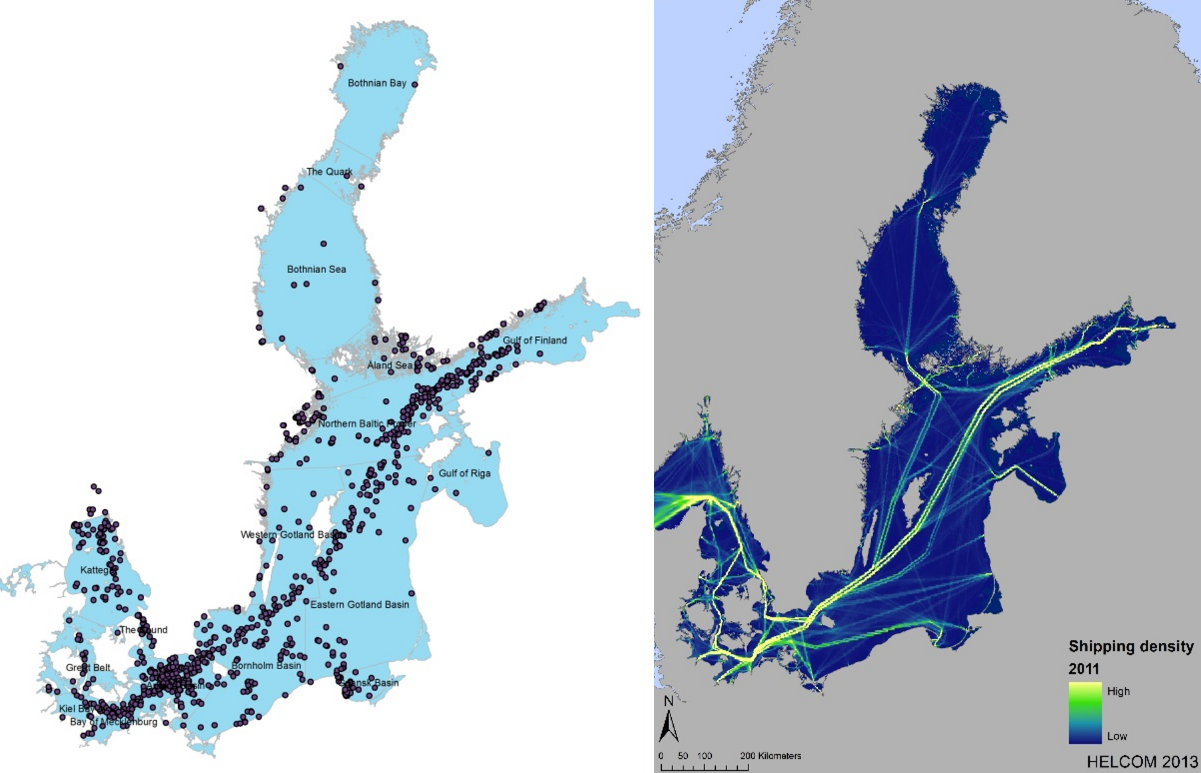
Figure 6. Spatial distribution of oil spills detected during the reference period 2008-2013 (left) and monthly average density of shipping during 2011 (right). Similar information from more recent periods (outside of the reference period) can also be found in relevant HELCOM reports, for example the 2020 Shipping accidents in the Baltic Sea report.
9.3 Monitoring and reporting requirements
Current monitoring
All Contracting Parties to HELCOM have agreed to participate in the collaboration on airborne surveillance to the best of their ability. The design of the aerial surveillance monitoring currently enable evaluation of all HELCOM sub-basins in this indicator and is considered sufficient. More information on current monitoring is available on the aerial surveillance site.
Current monitoring also includes remote sensing techniques. Satellite images are delivered to the countries by the European Maritime Safety Agency (EMSA) in near real time and provide a first indication of possible slicks to be checked by aircraft on spot.
Description of optimal monitoring
Current aerial surveillance efforts are considered to be sufficient to provide a high confidence evaluation of the volume of oil introduced to the Baltic Sea as visible spills.
10 Data
The data and resulting data products (e.g. tables, figures and maps) available on the indicator web page can be used freely given that it is used appropriately and the source is cited.
Result: Oil-spills affecting the marine environment
Data: Oil-spills affecting the marine environment
Monitoring data on oil spills in the Baltic Sea is available since 1988, however, the annual reporting activities in the HELCOM framework started in 2000. Data is annually reported to the HELCOM Secretariat by the Contracting Parties which have conducted surveillance activities in the reporting year and the data is stored in a database hosted by the HELCOM Secretariat and made publicly available online.
Reporting of the annual surveillance activity by the Contracting Parties to the HELCOM Secretariat is described in the HELCOM Response Manual according to an agreed format and data standards (c.f. reporting format and guidance). Quality assurance of data reported by the Contracting Parties is done by the HELCOM Secretariat.
11 Contributors
HELCOM Expert Group on Aerial Surveillance
HELCOM Secretariat: Theodor Hüttel, Markus Helavuori, Laura Meski, Owen Rowe
12 Archive
This version of the HELCOM core indicator report was published in April 2023:
The current version of this indicator (including as a PDF) can be found on the HELCOM indicator web page.
Earlier versions of this indicator are available at:
Operational oil-spills from ships HELCOM core indicator 2018 (pdf)
13 References
Durinck J, Skov H, Jensen FP & Pihl S (1994): Important marine areas for wintering birds in the Baltic Sea. – EU DG XI Research Contract no. 2242/90-09-01. Ornis Consult Report 1994, 110 pp.
HELCOM BRISK (2013) Risks of oil and chemical pollution in the Baltic Sea. Results and recommendations from the HELCOM’s BRISK and BRISK-RU projects. Available online: https://helcom.fi/wp-content/uploads/2019/08/BRISK-BRISK-RU_SummaryPublication_spill_of_oil.pdf
HELCOM (2012) Clean Seas Guide – The Baltic Sea Area a MARPOL 73/78 Special Area. Information for Mariners. Baltic Sea Environment Protection Commission. Available online: http://helcom.fi/Lists/Publications/Clean%20Seas%20Guide%20-%20Information%20for%20Mariners.pdf
HELCOM (2015), HELCOM Annual report on illegal discharges observed during aerial surveillance, 2015. 13 pp. available online: http://www.helcom.fi/Lists/Publications/HELCOM%20Annual%20report%20on%20discharges%20observed%20during%20aerial%20surveillance%20in%20the%20Baltic%20Sea%20in%202015.pdf
HELCOM (2021) HELCOM report on Shipping accidents in the Baltic Sea 2020, 2021. 35 pp. available online: https://helcom.fi/wp-content/uploads/2022/01/Helcom-report-on-Shipping-accidents-in-the-Baltic-Sea-2020-1.pdf
Larsson K & Tyden L (2009): Inventeringar av oljeskadad alfågel längs Gotlands sydkust under perioden 1996/97 till 2010/11. Report to Gotland University [Abstract in English]
Law RJ (1981): Hydrocarbon concentration in water and sediments from UK marine waters, determined by fluorescence spectroscopy. Marine Pollution Bulletin 12: 153-157.
Pikkarainen AL, Lemponen P (2005): Petroleum hydrocarbon concentrations in Baltic Sea subsurface water. Boreal Environment Research 10: 125-134.
Skov H, Heinänen S, Zydelis R, Bellebaum J, Bzoma S (2011): Waterbird Populations and Pressures in the Baltic Sea. TemaNord 2011:550. Available at: http://www.norden.org/en/publications/publikationer/2011-550
Žydelis R, Dagys M, & Vaitkus G (2006): Beached bird surveys in Lithuania reflect marine oil pollution and bird mortality in fishing nets. Marine Ornithology 34: 161-166.
14 Other relevant resources
HELCOM Annual report on illegal discharges observed during aerial surveillance are published:
http://www.helcom.fi/action-areas/response-to-spills/publications/