 Oxygen debt
2. Relevance of the indicator
2.1 Ecological relevance
Oxygen depletion is a common effect of eutrophication in the bottom waters of coastal marine ecosystems and is becoming increasingly prevalent worldwide (Diaz and Rosenberg 2008; HELCOM 2002). In the deep basins and other areas of the Baltic Sea, which are characterized by vertical stratification and low water exchange, conditions of low oxygen or even anoxia are a natural phenomenon, although exacerbated by nutrient loading. Oxygenation of these areas strongly depends on inflows of marine water from the North Sea (HELCOM 2017). Oxygen depletion is caused by the consumption of oxygen by the microbial processes responsible for the degradation of organic matter accumulating at the sea floor. When oxygen consumption exceeds its supply by physical processes, hypoxia (literally ‘low oxygen’) or even anoxia (absence of oxygen) can occur (e.g. Fennel & Testa, 2019). These events may be (1) episodic, (2) annually occurring in summer/autumn (most common), or (3) persistent, that is typical in the deep basins of the Baltic Sea (Carstensen and Conley 2019; Conley et al. 2007). Oxygen depletion has a clear impact on biogeochemical cycles. Anoxic periods cause the release of phosphorus from sediment (e.g., Vahtera et al. 2007). The concentration of dissolved inorganic phosphorus (DIP) can vary greatly from year to year depending on the release of phosphorus from sediments under anoxia (Matthäus et al. 2008). Ammonium is also enriched under hypoxic conditions. The DIP and ammonium from the bottom waters can be mixed into the upper water column and enhance growth of phytoplankton and hence production of organic matter. Thus, hypoxia results in large changes in the biogeochemical cycle, which may augment eutrophication effects.
2.2 Policy relevance
Eutrophication is one of the four thematic segments of the HELCOM Baltic Sea Action Plan (BSAP) with the strategic goal of having a Baltic Sea unaffected by eutrophication (HELCOM 2021). Eutrophication is defined in the BSAP as a condition in an aquatic ecosystem where high nutrient concentrations stimulate the growth of algae which leads to imbalanced functioning of the system. The BSAP goal for eutrophication is broken down into five ecological objectives, one of which is “natural oxygen levels”.
The EU Marine Strategy Framework Directive (2008/56/EC) requires that “human-induced eutrophication is minimized, especially adverse effects thereof, such as losses in biodiversity, ecosystem degradation, harmful algal blooms and oxygen deficiency in bottom waters” (Descriptor 5, Table 1.). ‘Dissolved oxygen in the bottom of the water column’ is listed as a criteria element in MSFD GES Decision ((EU) 2017/848) for assessing the criterium D5C5 ‘The concentration of dissolved oxygen is not reduced, due to nutrient enrichment, to levels that indicate adverse effects on benthic habitats (including on associated biota and mobile species) or other eutrophication effects.
The EU Water Framework Directive (2000/60/EC) requires good ecological status in the European coastal waters. Good ecological status is defined in Annex V of the Water Framework Directive, in terms of the quality of the biological communities, the hydrological characteristics and the chemical characteristics, including dissolved oxygen.
Table 1. Eutrophication links to policy.
2.3 Relevance for other assessments
This indicator is utilised in the integrated assessment of eutrophication (HEAT tool).
3. Threshold values
Status evaluation is measured in relation to scientifically based and commonly agreed sub-basin specific threshold values, which define the estimate of the amount of substance missing (Figure 2).
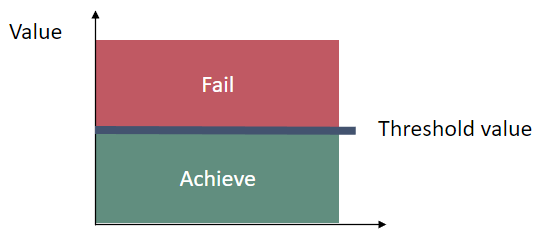
Figure 2. Schematic representation of the threshold value applied in the ‘oxygen debt’ core indicator, the threshold values are assessment unit specific (Table 2).
3.1 Setting the threshold value(s)
These indicator threshold values were based on the results obtained in the TARGREV project (HELCOM 2013), also taking advantage of the work carried out during the EUTRO PRO process (HELCOM 2009). The final threshold values were set through an expert evaluation process done by the intersessional activity on development of core eutrophication indicators (HELCOM CORE EUTRO) and the threshold values were adopted by the HELCOM Heads of Delegations 39/2012 (Table 2).
The threshold values for oxygen debt were defined from the 95th percentiles during the pre-eutrophic period, before 1940, detected through change-point analysis for all assessment units. The indicator is not applicable in basins without a permanent halocline.
Table 2. Assessment unit specific threshold values for the core indicator ‘oxygen debt’.
| Assessment unit (open sea) and HELCOM ID | Threshold value (mg L-1) |
| Bornholm Basin (SEA-007A) | 6.37 |
| Gdansk Basin (SEA-008), Eastern Gotland Basin (SEA-009), Western Gotland Basin (SEA-010), Northern Baltic Proper (SEA-012) and Gulf of Finland Western (SEA-013A) | 8.66 |
| Kattegat (SEA-001), Great Belt (SEA-002), The Sound (SEA-003), Kiel Bay (SEA-004), Bay of Mecklenburg (SEA-005), Arkona Sea (SEA-006), Pomeranian Bay (SEA-007B), Gulf of Riga (SEA-011), Gulf of Finland Eastern (SEA-013B), Åland Sea (SEA-014), Bothnian Sea (SEA-015), The Quark (SEA-016) and Bothnian Bay (SEA-017) | Not applicable |
4. Results and discussion
The results of the indicator evaluation that underlie the key message map and information are provided below.
4.1 Status evaluation
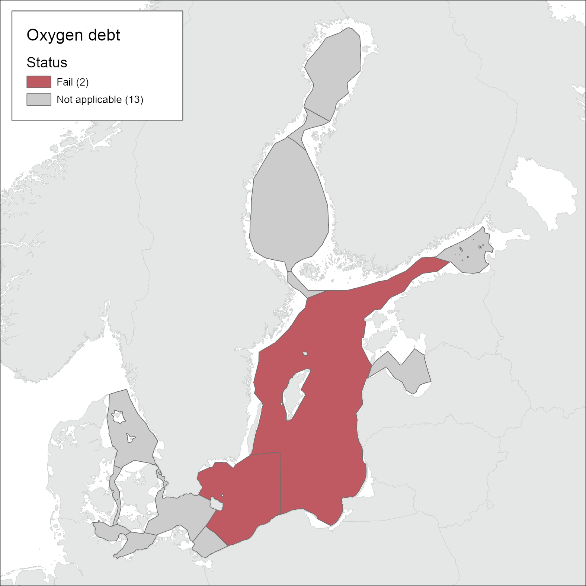
The core indicator ‘Oxygen debt’ is applied in the Baltic Proper area, including the Gdansk Basin, Eastern Gotland Basin, Western Gotland Basin, Northern Baltic Proper and Gulf of Finland Western. Bornholm Basin is evaluated separately. Values below the thresholds have not been achieved in any of these assessment areas, indicating a not good status in all areas where the indicator is applicable (Figure 3 and Table 3). The levels of oxygen debt have varied between the years during the current assessment period, with slightly lower oxygen debt in 2017 and 2019 and larger in 2018 and 2020 (Figure 4). Oxygen debt is more pronounced in the Baltic Proper compared with the Bornholm Basin.
Figure 3. Status of the ‘Oxygen debt’ indicator below the halocline, presented as scaled ecological quality ratios (EQRS) for the assessment period 2016-2020. EQRS shows the present concentration in relation to the threshold value, decreasing along with increasing eutrophication. Good status is achieved when EQRS >= 0.6.
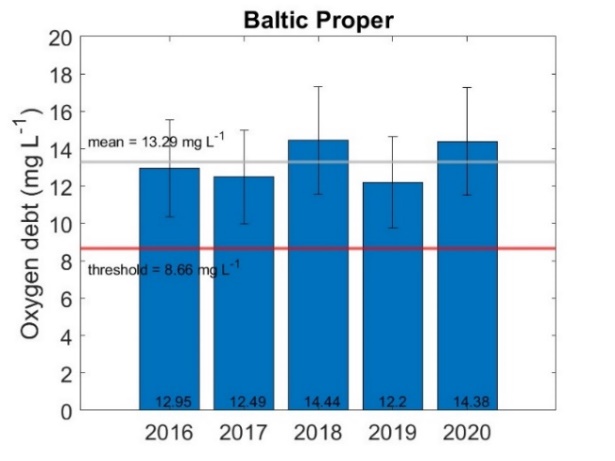
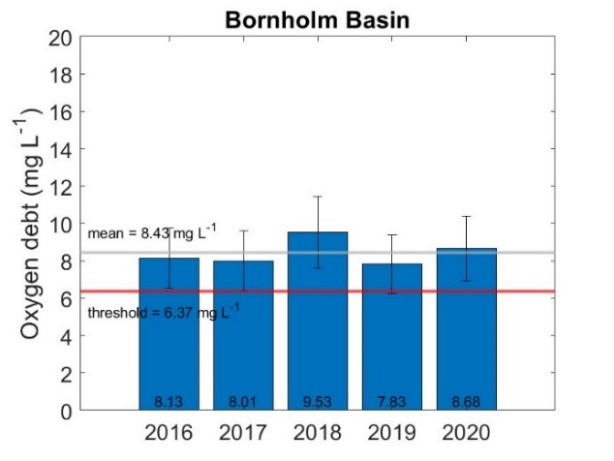
Figure 4. Average oxygen debt below the halocline (grey line; average for years 2016-2020) and threshold values (red line). Baltic Proper includes basins: Gdansk Basin, Eastern Gotland Basin, Western Gotland Basin, Northern Baltic Proper, Gulf of Finland Western. Standard deviation is shown on the bars as thin black lines.
Table 3. Threshold values, present oxygen debt (as average 2016-2020), scaled ecological quality ratio (EQRS) and status of oxygen debt in the open-sea basins. EQRS is a quantitative value for the level of eutrophication, calculated using the threshold value and the present concentration – when EQRS < 0.6, threshold values have not been reached.
| Assessment unit (open sea) (and ID) | Threshold value
(mg L-1) |
Average 2016-2020 (mg L-1) | Scaled ecological quality ratio, EQRS | STATUS (fail/achieve threshold value) |
| Bornholm Basin (SEA-007A) | 6.37 | 8.43 | 0.37 | fail |
| Baltic Proper* | 8.66 | 13.29 | 0.27 | fail |
*Consists of Gdansk Basin (SEA-008), Eastern Gotland Basin (SEA-009), Western Gotland Basin (SEA-010), Northern Baltic Proper (SEA-012) and Gulf of Finland Western (SEA-013A) open sea assessment units.
4.2 Trends
Long-term trends
Oxygen debt below the halocline has increased in both assessment areas since the early 1900s. A significant deteriorating trend has been observed in both areas since 1990 (Figure 5). A simple linear regression analysis results in a decadal increase of oxygen debt of 0.37 mg L-1 for the Baltic Proper (R2 = 0.66, p-value < 0.01, N = 101) and 0.30 mg L-1 for the Bornholm Basin (R2 = 0.40, p-value < 0.01, N = 90) using all available data. Estimating the trends starting from 1990 and comparing them to the long-term trends, the decadal change rate has quadrupled for the Baltic Proper and doubled for the Bornholm Basin. The 1990 to 2020 estimated increase in oxygen debt is 1.49 mg L-1 decade-1 for the Baltic Proper (R2 = 0.75, p-value < 0.01, N = 31) and 0.66 mg L-1 decade-1 for the Bornholm Basin (R2 = 0.29, p-value < 0.01, N = 31).The Bornholm Basin has experienced larger inter-annual variability because of larger variations in the oxygen concentrations, mainly due to natural water flows or processes. However, inter-annual variability was also high in the Baltic Proper during the last decade, when the five-year moving average revealed a significant increase in oxygen debt.
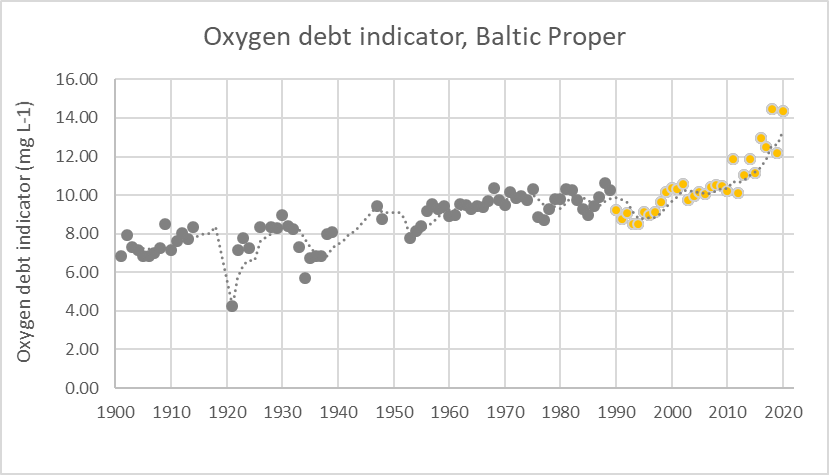
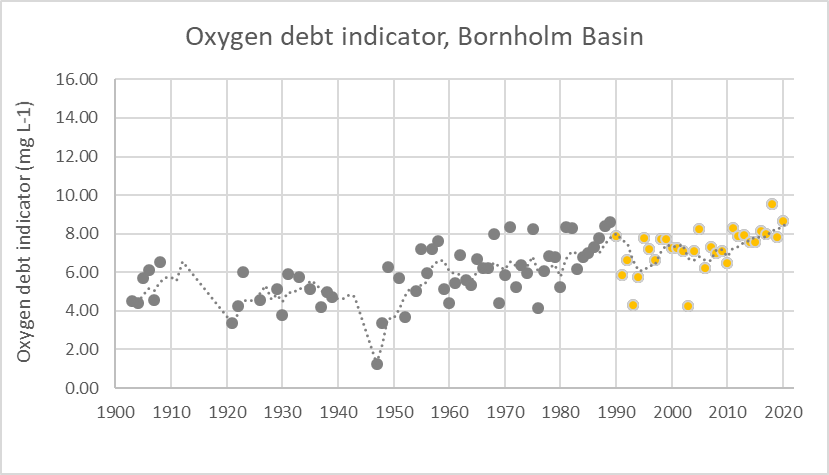
Figure 5. Temporal development in the core indicator ‘Oxygen debt’ in the Baltic Proper (containing Eastern Gotland Basin, Gdansk Basin, Western Gotland Basin, Northern Baltic Proper and Gulf of Finland Western) and Bornholm Basin, showing the volume specific oxygen debt below the halocline based on the data and sub-basin division delineation of HELCOM (2017). Note that the oxygen debt indicator value can exceed the solubility of oxygen since it also includes the oxygen required to oxidize reduced compound like e.g. hydrogen sulfide. The dashed line shows the five-year moving average. The significance of the trend was tested for the period 1990-2020 by the Mann-Kendall nonparametric test. The data within the examined period are colored orange to visualize the tested significant (p<0.05) deteriorating trend (an increasing trend in oxygen debt signifies deteriorating oxygen conditions).
4.3 Discussion text
The oxygen debt indicator value in the Baltic Proper assessment area for the current period 2016-2020 is 2.62 mg L-1 worse than for the previous period from 2011-2016 (10.67 mg L-1). The Bornholm Basin results have remained more or less the same, when comparing the average values for HOLAS II (7.97 mg L-1) and HOLAS 3. What stands out are the higher values for 2018 and 2020 in both assessment areas.
There is a difference between the oxygen debt in the Baltic Proper area in 2016 presented in the current assessment and HOLAS II assessment. This difference in the results is mostly related to additional data submitted after completing the HOLAS II assessment.
Table 4. Overview of status and a comparison to the prior assessment period.
| HELCOM Assessment unit name (and ID) | Threshold value achieved/failed – HOLAS II | Threshold value achieved/failed – HOLAS 3 | Distinct trend between current and previous assessment. | Description of outcomes, if pertinent. |
| Bornholm Basin (SEA-007A) | Failed | Failed | No trend | The current evaluation fails the threshold value and GES in not achieved. |
| Baltic Proper* | Failed | Failed | A distinct trend towards worsening of conditions | The current evaluation fails the threshold value by a significant distance and GES is not achieved. |
*Consists of Gdansk Basin (SEA-008), Eastern Gotland Basin (SEA-009), Western Gotland Basin (SEA-010), Northern Baltic Proper (SEA-012) and Gulf of Finland Western (SEA-013A) open sea assessment units.
The assessment methodology requires background data on Major Baltic Inflows (MBI) and nitrogen load. Relevant data series were available until 2016 and 2020, respectively. Thus, the long-term indicator series is not fully calculated using the same input data. The updated data series of saltwater inflows is calculated based on a new method (Mohrholz 2018) and is available at https://www.io-warnemuende.de/major-baltic-inflow-statistics-7274.html (accessed 23.10.2022). Since the yearly salt transport to the Baltic Sea has been smaller for 2017-2019 than for 2011-2016, the bias of not using the MBI data in the current assessment period could not be significant.
5. Confidence
Confidence of the indicator status evaluation
The confidence of the indicator status evaluation is based only on the accuracy of the threshold-setting protocol. Accuracy confidence was High in all the sub-basins where the indicator was applicable (Figure 6).
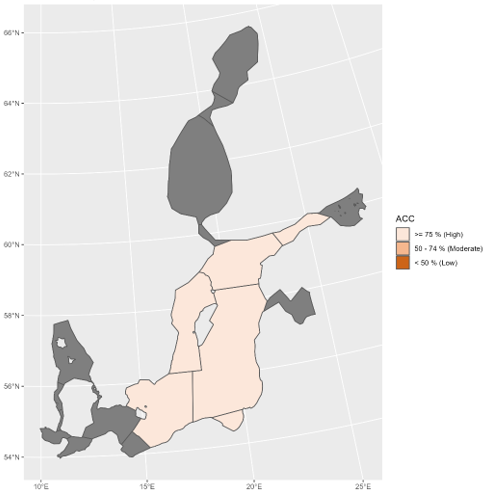
Figure 6. Indicator accuracy confidence for the assessment period 2016-2020.
The indicator confidence was estimated only through confidence scoring of the threshold (ET-Score) in absence of a method for assessing the confidence for the data used for oxygen debt in HEAT. The ET-Score and thus the whole confidence was rated based on the uncertainty of the threshold value setting procedure. See Andersen et al. (2010) and Fleming-Lehtinen et al. (2015) for further details.
6. Drivers, Activities, and Pressures
Oxygen depletion is an indirect effect of eutrophication having an indirect link to anthropogenic pressures, through increased anthropogenic nutrient loads and subsequent increase of organic matter sedimentation.
For HOLAS 3 initial work has been carried out to explore Drivers (and driver indicators) to evaluate how such information can be utilised within the DAPSIM management framework. It is recognised that only a small portion of the drivers via proxies such as relevant human activities have been addressed for eutrophication assessment. Wastewater treatment (Drivers and driver indicators for Wastewater Treatment) and agriculture (Drivers and driver indicators for Agricultural Nutrient Balance) have been explored in these pilot studies for HOLAS 3.
Diffuse sources constitute the highest proportion of total nitrogen (nearly 50%) and total phosphorus (about 56%) inputs to the Baltic Sea (HELCOM 2022a). For total nitrogen, atmospheric deposition on the sea has the second highest share (24%) followed by natural background loads (20%) and point sources (9%). Natural background loads have the second highest share of total phosphorus inputs to the Baltic Sea (20%), followed by point sources (17%) and atmospheric deposition (7%). Point sources include activities such as municipal wastewater treatment plants, industrial plants and aquacultural plants and diffuse sources consists of anthropogenic sources as agriculture, managed forestry, scattered dwellings, storm water etc.
A significant reduction of nutrient inputs has been achieved for the whole Baltic Sea. The normalized total input of nitrogen was reduced by 12% and phosphorus by 28 % between the reference period (1997-2003) and 2020 (HELCOM 2023). The maximum allowable input (MAI) of nitrogen in this period was fulfilled in the Bothnian Bay, Bothnian Sea, Danish Straits and Kattegat and the maximum allowable input of phosphorus in the Bothnian Bay, Bothnian Sea, Danish Straits and Kattegat.
Further developing an overview of such components and the relevant data to be able to better quantify the linkages within a causal framework provide the opportunity for more informed management decisions, for example targeting of measures, and can thereby support the achievement of Good Environmental Status.
Table 5. Brief summary of relevant pressures and activities with relevance to the indicator.
| General | MSFD Annex III, Table 2a | |
| Strong link | Substances, litter and energy
– Input of nutrients – diffuse sources, point sources, atmospheric deposition |
|
| Weak link | Substances, litter and energy
– Input of organic matter – diffuse sources and point sources |
7. Climate change and other factors
Oxygen concentrations in the Baltic Sea deep water are impacted by climate change induced variations in the deep water transport and mixing/stratification. Although there are no statistically significant trends in stratification and saltwater inflows on centennial timescales since 1850 (Meier et al. 2019), the increase in sea surface temperature has probably strengthened vertical stratification (Kniebusch et al. 2019). The interannual to decadal variability in oxygen concentrations of the Baltic Sea deep water could be caused by variations in oxygen transport and stratification (Carstensen et al. 2014; Meier et al. 2019). For instance, the observed strengthening of vertical stratification in most of the Baltic Sea during 1982-2016 (Liblik and Lips 2019) could be one of the reasons for the rapid increase in oxygen debt since the early 1990s. Recently calculated oxygen consumption rates are higher than earlier observed (Meier et al. 2018), and projected warming may enhance oxygen depletion in the Baltic Sea by reducing air-sea and vertical transports of oxygen (HELCOM and Baltic Earth 2021).
8. Conclusions
Baltic Sea deep basins have not achieved oxygen debt values below the threshold defining good environmental status. Oxygen debt below the halocline has increased in all basins since the early 1900s. The increase has been strongest in recent years since the early 1990s. Oxygen conditions are influenced by long-term and decadal-scale variations in hydrographic conditions. To differentiate between the changes caused by the changes in nutrient load and climate/hydrographic conditions, further work in indicator development is needed.
8.1 Future work or improvements needed
The future work for the oxygen debt indicator should contain analyses on (1) a possible differentiation of GES thresholds in deep basins currently evaluated as one Baltic Proper assessment unit, (2) how saltwater transport in deep basins and/or MBI intensities or changes in hydrographic conditions are best taken into account, and (3) whether there is a need to account for changes in nutrient input in the indicator calculations. Furthermore, a methodology assessing the confidence of the indicator evaluation needs to be developed.
9. Methodology
9.1 Scale of assessment
The assessment units for the indicator were initially BALTSEM units, consisting of two assessment areas Baltic Proper (including Gulf of Finland Eastern) and Bornholm Basin (including Pomeranian Bay). For this indicator report, the borders of the units have been changed (Figure 7). Baltic Proper assessment area includes Gdansk Basin, Eastern Gotland Basin, Western Gotland Basin, Northern Baltic Proper and Gulf of Finland Western. Bornholm Basin is assessed as one.
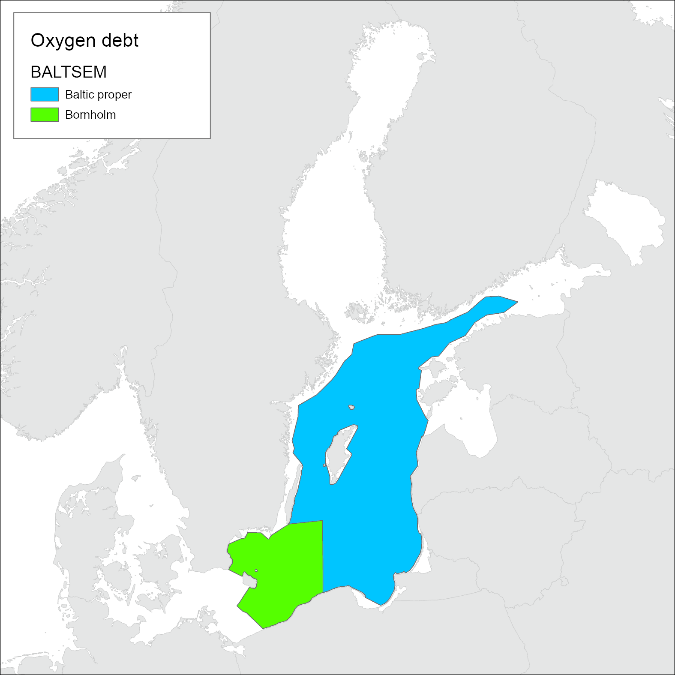
Figure 7. Bornholm Basin (green) and Baltic proper (blue) assessment units for the oxygen debt indicator.
9.2 Methodology applied
The oxygen debt is defined as the “missing” oxygen relative to a fully saturated water column, another term often used is the apparent oxygen utilization (AOU). By using the oxygen debt instead of the actual oxygen concentration, the variations due to temperature-controlled solubility are excluded.
It is preferable to use oxygen data from the whole water column, but monitoring is often carried out in the surface and deep layers, especially for older data. To overcome this problem, the oxygen profiles have been modelled with the information from salinity profiles, which typically have a higher vertical resolution.
To find the volume specific oxygen debt values, the applied methodology also takes into account information on MBIs and nitrogen inputs from rivers to sub-basins.
For more details on the method, see BSEP 133 (BSEP 133) and the derivative R-scripts (https://github.com/ices-tools-prod/HEAT/tree/master/OxygenDebt).
9.3 Monitoring and reporting requirements
Monitoring methodology
Monitoring of oxygen concentration by the Contracting Parties of HELCOM is described on a general level in the HELCOM Monitoring Manual sub-programme: Water column chemical characteristics.
Specific monitoring guidelines “Guidelines for sampling and determination of dissolved oxygen in seawater” have been agreed (see https://helcom.fi/wp-content/uploads/2019/08/Guidelines-for-sampling-and-determination-of-dissolved-oxygen.pdf)
Current monitoring
The monitoring activities relevant to the indicator that are currently carried out by HELCOM Contracting Parties are described in the HELCOM Monitoring Manual sub-programme table c.4.
Description of optimal monitoring
Regional monitoring is considered to be sufficient for the purposes of the indicator evaluation.
10. Data
The data and resulting data products (e.g. tables, figures and maps) available on the indicator web page can be used freely given that it is used appropriately and the source is cited.
Data source: The average for 2016-2020 was estimated using monitoring data provided by the HELCOM Contracting Parties, and kept in the HELCOM database, hosted by ICES (www.ices.dk). Nominated members of HELCOM STATE & CONSERVATION group were given the opportunity to review the data, and to supply any missing monitoring observations, in order to achieve a complete dataset.
MBI data was provided by IOW. Nitrogen input data is from the HELCOM core indicator report (HELCOM 2022b).
Description of data: The data includes in-situ temperature, salinity and oxygen profiles, determined as explained in the HELCOM monitoring manual. Dissolved oxygen (and hydrogen sulfide where relevant) measurements made at the depths below the halocline were used in the assessment.
Geographical coverage: The observations are distributed in the sub-basins according to the HELCOM monitoring programme, added occasionally with data from research cruises.
Temporal coverage: The raw data includes observations throughout the year, during the assessment period 2016-2020.
Data aggregation: The 2016-2020 averages for each assessment unit were produced as inter-annual estimates, determined using a GLM-GAM procedure to exclude spatio-temporal bias. The oxygen debt calculation algorithm R-script can be accessed at https://github.com/ices-tools-prod/HEAT/tree/master/OxygenDebt.
11. Contributors
Stella-Theresa Stoicescu and Urmas Lips, Tallinn University of Technology
HELCOM EG EUTRO
HELCOM Secretariat: Laura Kaikkonen, Joni Kaitaranta, Theodor Hüttel.
12. Archive
This version of the HELCOM core indicator report was published in April 2023:
The current version of this indicator (including as a PDF) can be found on the HELCOM indicator web page.
Earlier versions of the core indicator report include:
13. References
Andersen, Jesper H., Ciarán Murray, Hermanni Kaartokallio, Philip Axe, and Jarle Molvær. 2010. “A Simple Method for Confidence Rating of Eutrophication Status Classifications.” Marine Pollution Bulletin 60: 919–24. http://www.sciencedirect.com/science/article/pii/S0025326X10001104.
Carstensen, Jacob, Jesper H. Andersen, Bo G Gustafsson, and Daniel J Conley. 2014. “Deoxygenation of the Baltic Sea during the Last Century.” Proceedings of the National Academy of Sciences of the United States of America 111 (15): 5628–33. http://www.pubmedcentral.nih.gov/articlerender.fcgi?artid=3992700&tool=pmcentrez&rendertype=abstract.
Carstensen, Jacob, and Daniel J Conley. 2019. “Baltic Sea Hypoxia Takes Many Shapes and Sizes.” Limnology and Oceanography Bulletin 28 (4): 125–29. https://doi.org/https://doi.org/10.1002/lob.10350.
Conley, Daniel J, Jacob Carstensen, Gunni Ærtebjerg, Peter Bondo Christensen, Tage Dalsgaard, Jørgen L S Hansen, and Alf B Josefson. 2007. “LONG-TERM CHANGES AND IMPACTS OF HYPOXIA IN DANISH COASTAL WATERS.” Ecological Applications 17 (sp5): S165–84. https://doi.org/https://doi.org/10.1890/05-0766.1.
Diaz, Robert J., and Rutger Rosenberg. 2008. “Spreading Dead Zones and Consequences for Marine Ecosystems.” Science 321 (5891): 926–29. https://doi.org/10.1126/science.1156401.
Fennel, Katja, and Jeremy M Testa. 2019. “Biogeochemical Controls on Coastal Hypoxia.” Annual Review of Marine Science 11 (1): 105–30. https://doi.org/10.1146/annurev-marine-010318-095138.
Fleming-Lehtinen, Vivi, Jesper H. Andersen, Jacob Carstensen, Elzbieta Łysiak-Pastuszak, Ciarán Murray, Minna Pyhälä, and Maria Laamanen. 2015. “Recent Developments in Assessment Methodology Reveal That the Baltic Sea Eutrophication Problem Is Expanding.” Ecological Indicators 48: 380–88.
HELCOM. 2002. “Environment of the Baltic Sea Area 1994-1998.” Baltic Sea Environment Proceedings No. 82B, 215.
———. 2009. “Eutrophication in the Baltic Sea – An Integrated Thematic Assessment of the Effects of Nutrient Enrichment and Eutrophication in the Baltic Sea Region.” Balt. Sea Environ. Proc. No. 115B, 148.
———. 2013. “Approaches and Methods for Eutrophication Target Setting in the Baltic Sea Region.” Balt. Sea Environ. Proc. No. 133.
———. 2017. “First Version of the ‘State of the Baltic Sea’ Report – June 2017 – to Be Updated in 2018.” http://stateofthebalticsea.helcom.fi/.
———. 2021. “Baltic Sea Action Plan. 2021 Update.” https://helcom.fi/wp-content/uploads/2021/10/Baltic-Sea-Action-Plan-2021-update.pdf.
———. 2022a.” Assessment of sources of nutrient inputs to the Baltic Sea in 2017.” https://helcom.fi/wp-content/uploads/2022/12/PLC-7-Assessment-of-sources-of-nutrient-inputs-to-the-Baltic-Sea-in-2017.pdf
———. 2022b. “Inputs of Nutrients to the Sub-Basins (2019). HELCOM Core Indicator Report. Online.” 2022. https://doi.org/ISSN 2343-2543.
———.Inputs of Nutrients to the Sub-Basins (2020). HELCOM Core Indicator Report. Online. 2023.
HELCOM, and Baltic Earth. 2021. “Climate Change in the Baltic Sea. 2021 Fact Sheet. Baltic Sea Environment Proceedings N°180.” https://doi.org/ISSN: 0357-2994.
Kniebusch, Madline, H E Markus Meier, Thomas Neumann, and Florian Börgel. 2019. “Temperature Variability of the Baltic Sea Since 1850 and Attribution to Atmospheric Forcing Variables.” Journal of Geophysical Research: Oceans 124 (6): 4168–87. https://doi.org/https://doi.org/10.1029/2018JC013948.
Liblik, Taavi, and Urmas Lips. 2019. “Stratification Has Strengthened in the Baltic Sea – An Analysis of 35 Years of Observational Data.” Front.Earth.Sci. 7:174. https://doi.org/10.3389/feart.2019.00174.
Matthäus, W., D. Nehring, R. Feistel, G. Nausch, V. Mohrholz, H.U. Lass, R. Feiste, G. Nausch, and N. Wasmund. 2008. “The Inflow of Highly Saline Water into the Baltic Sea.” In State and Evolution of the Baltic Sea, 1952–2005, 265–309. Wiley.
Meier, H E M, K Eilola, E Almroth-Rosell, S Schimanke, M Kniebusch, A Höglund, P Pemberton, Y Liu, G Väli, and S Saraiva. 2019. “Disentangling the Impact of Nutrient Load and Climate Changes on Baltic Sea Hypoxia and Eutrophication since 1850.” Climate Dynamics 53 (1): 1145–66. https://doi.org/10.1007/s00382-018-4296-y.
Meier, H E Markus, Germo Väli, Michael Naumann, Kari Eilola, and Claudia Frauen. 2018. “Recently Accelerated Oxygen Consumption Rates Amplify Deoxygenation in the Baltic Sea.” Journal of Geophysical Research: Oceans 123 (5): 3227–40. https://doi.org/https://doi.org/10.1029/2017JC013686.
Mohrholz, Volker. 2018. “Baltic Saline Barotropic Inflows (SBI) 1887 – 2018.” Leibniz Institute for Baltic Sea Research (IOW). http://doi.io-warnemuende.de/10.12754/data-2018-0004.
Vahtera, Emil, Daniel J. Conley, Bo G. Gustafsson, Harri Kuosa, Heikki Pitka¨nen, Oleg P. Savchuk, Timo Tamminen, et al. 2007. “Internal Ecosystem Feedbacks Enhance Nitrogen-Fixing Cyanobacteria Blooms and Complicate Management in the Baltic Sea.” Ambio 36: 186–94. http://www.mare.su.se/dokument/evaluation/ecology/vahtera et al (2007 in press).pdf.