 PAHs and metabolites
2 Relevance of the indicator
Polycyclic aromatic hydrocarbons (PAHs) are of concern due to their persistence and potential to accumulate in aquatic organisms, particularly invertebrates such as bivalves and crustaceans. In most vertebrates PAHs are fairly rapidly metabolized, however PAHs and the toxic intermediates that are formed during metabolic degradation can cause harmful effects in fish. PAHs associate with particles in the water and accumulate in sediments, and are persistent especially in anaerobic sediments.
Some PAHs are formed naturally, but the majority of PAHs in the marine environment stem from human activity. Sources of PAH include the release of crude oil products into the sea (oil-spills), as well as all types of incomplete combustion of fossil fuels and waste incineration.
2.1 Ecological relevance
Polycyclic aromatic hydrocarbons (PAHs) are of concern due to their persistence and potential to accumulate in aquatic organisms, particularly invertebrates, such as bivalves and crustaceans. In most vertebrates, PAHs are fairly rapidly metabolized, but they and their toxic intermediates that emerge during metabolic degradation, can cause deleterious effects in fish.
The PAH compounds identified as priority pollutants include low-molecular-weight PAH compounds, two-ring compounds (naphthalene) and three-ring compounds (acenaphthylene, acenaphthene, fluorene, phenanthrene, anthracene) that are acutely toxic to a broad spectrum of marine organisms. The compounds also include high-molecular-weight PAHs with four-ring compounds (fluoranthene, pyrene, benzo(a)anthracene, and chrysene), five-ring compounds (benzo(a)pyrene, benzo(b)fluoranthene, benzo(k)fluoranthene, and dibenz(a,h)anthracene), and six-ring compounds (indeno(1,2,3-c,d)pyrene, benzo(g,h,i)perylene) that are less toxic but have greater carcinogenic potential (Kennish 1997).
Indeno(1,2,3-c,d)pyrene and chrysene have been shown to cause carcinogenic effects in experiments on animals (IARC class 2b), and benzo(a)pyrene to cause cancer in humans (IARC class 1). Weakly- or non-carcinogenic PAHs can modify the carcinogenic activity of other PAHs in complex mixtures (Marston et al. 2001). Therefore, synergistic effects of PAHs can be larger than the total levels of PAHs would indicate. Also, PAHs are transformed in the marine environment, e.g. when exposed to sunlight, the mechanism known as phototoxicity is involved, producing reactive and toxic photomodification products (HELCOM 2010). Thus, evaluating the overall environmental status based on PAHs has to take this complexity into consideration.
PAHs tend to associate with particulate material due to their low water solubility and hydrophobic nature. Deposition of these particles can lead to an accumulation of PAHs in the sediment. PAHs are persistent, especially in anaerobic sediments, with the higher molecular weight PAHs being more persistent than the lower molecular weight compounds (Kennish 1997; Webster et al. 2003).
Bioaccumulation of PAHs in marine organisms from sediments is dependent, thermodynamically, on the ratio between adsorption capacity of the sediment and absorption capacity of the organism. Different profiles of contaminants have been observed in organisms of different trophic levels that have been attributed to a partial biotransformation of the contaminants in the organisms of higher trophic levels (Baumard et al. 1998b). Increased levels of neoplastic aberrations or tumors have been found in fish exposed to PAH contaminated sediments. High concentrations of PAHs are also harmful to reproduction of fish and can damage cellular membrane structures (Knutzen 1995). Oxidised PAHs in an organism are known to bind to DNA and/or cause mutations which may lead to cancer.
To evaluate effects of PAH exposure on fish, concentrations of the main metabolites such as 1-hydroxypyrene, 1-hydroxyphenanthrene and 3-hydroxybenzo(a)pyrene can be determined in bile by HPLC with fluorescence detection (HPLC-F), by synchronous fluorescence scanning, gas chromatography with mass selective detection (GC/MS) and also by UPLC/MS/MS (Ariese et al. 2005). PAH metabolites in fish bile reflects the level of exposure during the last few days before sampling, varying to some degree depending on the feeding activity of the fish.
2.2 Policy relevance
This Polycyclic aromatic hydrocarbons (PAHs) HELCOM core indicator addresses the Baltic Sea Action Plan’s (BSAP) Hazardous substances and litter segment goal of a “Baltic Sea unaffected by hazardous substances and litter” and also has relevance for elements of the Biodiversity and to some extent the Maritime activities segment goals: “The Baltic Sea ecosystem is healthy and resilient” and “Environmentally sustainable sea-based activities”, respectively.
In addition the indicator is of direct relevance to Descriptor 8 and of significance for Descriptor 9 or the EU Marine Strategy Framework Directive (MSFD) as set out under the specific Descriptors and Criteria in Commission Decision (EU) 2017/848.
An overview of policy relevance is provided in Table 1.
Table 1. Overview of key policy relevance elements.
| Baltic Sea Action Plan (BSAP) | Marine Strategy Framework Directive (MSFD) | |
| Fundamental link | Segment: Hazardous substances and litter goal
Goal: “Baltic Sea unaffected by hazardous substances and litter”
|
Descriptor 8 Concentrations of contaminants are at levels not giving rise to pollution effects.
|
| Complementary link | Segment: Biodiversity
Goal: “Baltic Sea ecosystem is healthy and resilient”
Segment: Sea-based activities Goal: “Environmentally sustainable sea-based activities”
|
Descriptor 9 Contaminants in fish and other seafood for human consumption do not exceed levels established by Union legislation or other relevant standards.
(a) for contaminants listed in Regulation (EC) No 1881/2006, the maximum levels laid down in that Regulation, which are the threshold values for the purposes of this Decision; (b) for additional contaminants, not listed in Regulation (EC) No 1881/2006, threshold values, which Member States shall establish through
|
| Other relevant legislation: |
|
|
2.3 Relevance for other assessments
The status of hazardous substances is assessed using several core indicators. Each indicator focuses on one important aspect of the complex issue. In addition to providing an indicator-based evaluation of PAHs and their metabolites, this indicator will also contribute to the overall hazardous substances assessment along with the other hazardous substances core indicators. It should be noted that the metabolites component is not included in the integrated assessment of contaminant concentrations but instead used in the biological effects of contaminants work.
3 Threshold values
Good status is evaluated for the core indicator ‘Polyaromatic hydrocarbons (PAHs) and their metabolites’ by comparing the measured concentrations of benzo(a)pyrene, fluoranthene, and anthracene, and the metabolite 1-hydroxypyrene, to the regionally agreed threshold values (Table 2). If concentrations exceed the agreed threshold value then the threshold value, and thus Good Environmental Status (GES) is not achieved, as visualised in the schematic presented in Figure 2.
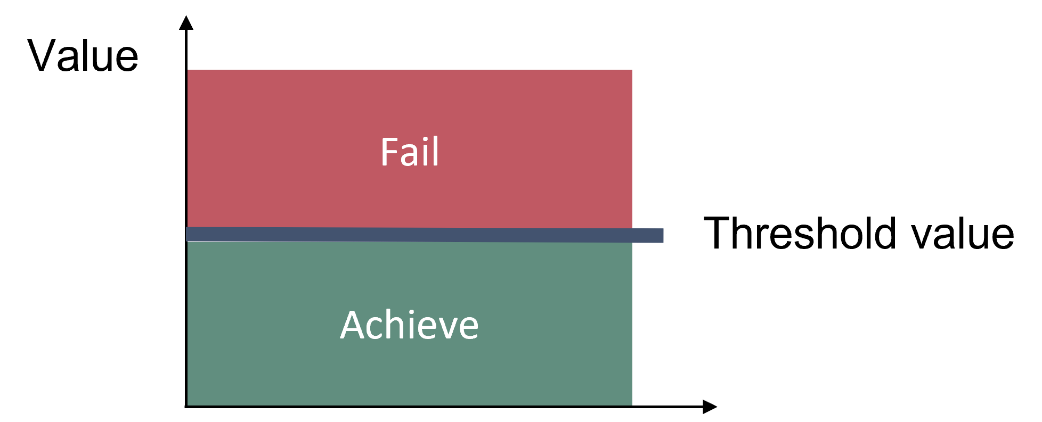
Figure 2. Schematic representation of the threshold value for which the measured concentration of the substance evaluated should be lower than the threshold value concentration in order for the threshold value to be achieved.
An overview of the specific threshold values applied in this indicator is provided in Table 2.
Table 2. Threshold values for the primary and secondary application in the indicator. Underlined supporting parameters represent parameters without which the indicator evaluation can not be applied. W = wet weight, D = dry weight, SB = soft body, TM = total mussel, BI = biota, CORG = Organic Carbon, EAC = Environmental Assessment Concentration, and GC/MS = Gas Chromatography/Mass spectrometry.
| Indicator | Threshold value | Parameters (PARAM) / Parameter groups (PARGROUP)
(see also http://vocab.ices.dk/) |
Matrix | Species | Matrix | Basis | Supporting parameters and information |
| PAHs
(benzo(a)pyrene) |
Primary threshold
EQS biota human health 5 μg/kg ww crustaceans and molluscs. |
PARAM = BAP | Biota | Molluscs & Crustaceans (M. edulis, M. baltica, D. polymorpha & Saduria entomon) | SB, TM | W | Dry weight |
| PAHs (fluoranthene) | Secondary threshold
EQS biota human health: 30 μg/kg ww crustaceans and molluscs |
PARAM = FLU | Biota | Molluscs & Crustaceans (M. edulis, M. baltica, D. polymorpha & Saduria entomon) | SB, TM | W | Dry weight |
| PAHs (fluoranthene) | Secondary threshold
3500 µg/kg dw, 5% CORG |
Sediment
(surface, ICES ’upper sediment layer – 0-X cm’) |
All | D | CORG
Al Li Grain size |
||
| PAHs (anthracene) | *Secondary threshold
QS 24 ug/kg dw sediment |
PARAM = ANT | Sediment
(surface, ICES ’upper sediment layer – 0-X cm’) |
All | D | CORG
Al Li Grain size |
|
| PAH Metabolite
1-hydroxypyrene |
Primary threshold:
Cod EAC 483 ng/g fish bile (GC/MS) |
PARAM = PYR1OH | Biota | Herring & cod, dab,
Flounder, sole, eelpout & Perch |
BI | W |
*Denmark retains a study reservation on this threshold value, but supports the application of the regional indicator for HOLAS 3.
It should be noted that threshold value for fluoranthene in sediment of 3500 µg/kg dw (5% CORG) represents a difference compared to HOLAS 2 as this threshold value has been updated in HOLAS 3 to correct an error identified in the earlier version of the EQS dossier.
3.1 Setting the threshold value(s)
The threshold values are based on established threshold value setting approaches or published parameters required for carrying out such evaluations. Environmental Quality Standards (EQS) and Quality Standards (QS) are developed following the approach set out in the Derivation of environmental quality standards (EQS) for the aquatic environment is following the EU Guidance Document No. 27. Technical Guidance Document for Deriving Environmental Quality Standards (EU, 2018).
The EU directive on environmental quality standards (2008/105/EC), Article 3, states that also long-term temporal trends should be assessed for substances that accumulate in sediment and/or biota.
The threshold value for benzo(a)pyrene is an EQS derived for the protection goal of human health via consumption of fishery products. The threshold value for benzo(a)pyrene concentration is matrix sensitive, and only applicable if the concentrations are measured in the appropriate matrix. For historical reasons, the Contracting Parties around the Baltic Sea have differing monitoring strategies and as a pragmatic approach secondary threshold values for secondary substances have also been agreed to be used to evaluate assessment units where no measurements are available for the primary substance and threshold value. The threshold values were agreed at HELCOM HOD 50-2016 (outcome para 4.47).
4 Results and discussion
The results of the indicator evaluation that underlie the key message map and information are provided below.
4.1 Status evaluation
The core indicator is evaluated against specific threshold values for each relevant substance-monitoring matrix combination in each assessment units where data is available for the period 2016-2021. The aggregated results (i.e. combining all results from each of these combinations, except for the evaluation of metabolites) that provide the summary status evaluation (Figure 1) are achieved by carrying out a One-Out-All-Out integration process across all evaluations should more than one evaluation occur in any given assessment unit. Of the 15 open sea assessment units evaluated 5 failed to achieve their given threshold value and were therefore classified as sub-GES. Only two of the 17 open sea HELCOM sub-basins were not possible to evaluate, the Gulf of Riga and The Quark. Failure to achieve the threshold value occurs in all cases within the evaluation of anthracene in sediments. Of the 95 evaluated coastal assessment units, 22 were classified as sub-GES (in Danish, Estonian, German and Polish waters). Failure of the threshold value commonly occurred in areas where sediment monitoring took place (only 3 failures were exclusively due to evaluations applied in biota).
To carry out a full evaluation, a minimum of three years of data per monitoring station is required, though ‘initial’ data (data series of 2 or less years or containing ‘less-than’ values) was also included in the evaluation (see Methodology). Concentrations are available for the primary substance benzo(a)pyrene in biota for three of the evaluated open sea assessment units and a number of coastal assessment units, and the threshold value was achieved in all but two units. It could furthermore be noted that the secondary substance fluoranthene (in biota) was evaluated in a similar selection of assessment units and that a similar status pattern was observed. The secondary substance anthracene, in sediment, however was assessed across a wider spatial area and 6 of the 13 assessed open sea units (and a number of coastal areas failed to achieve the threshold (i.e. not-good status).
It should be noted that in addition to the data that supports a full evaluation using the core indicator evaluation protocol, there is also initial status evaluation data available meaning that measurements are only available for 1-2 years per station (most sediment stations and some mussel stations). In order to achieve a better spatial coverage and include all available monitoring data, the initial status evaluation data are also considered using a precautionary statistical approach.
Benzo(a)pyrene (in biota)
Two of the 85 assessment units evaluated for benzo(a)pyrene (BAP) in biota failed to achieve the threshold value. In general the mean values for the assessment units are well below the agreed threshold value, but in those instances where the threshold value is not achieved (sub-GES, red) the 95% confidence level exceeeds the threshold value resulting in sub-GES status (Figure 3).
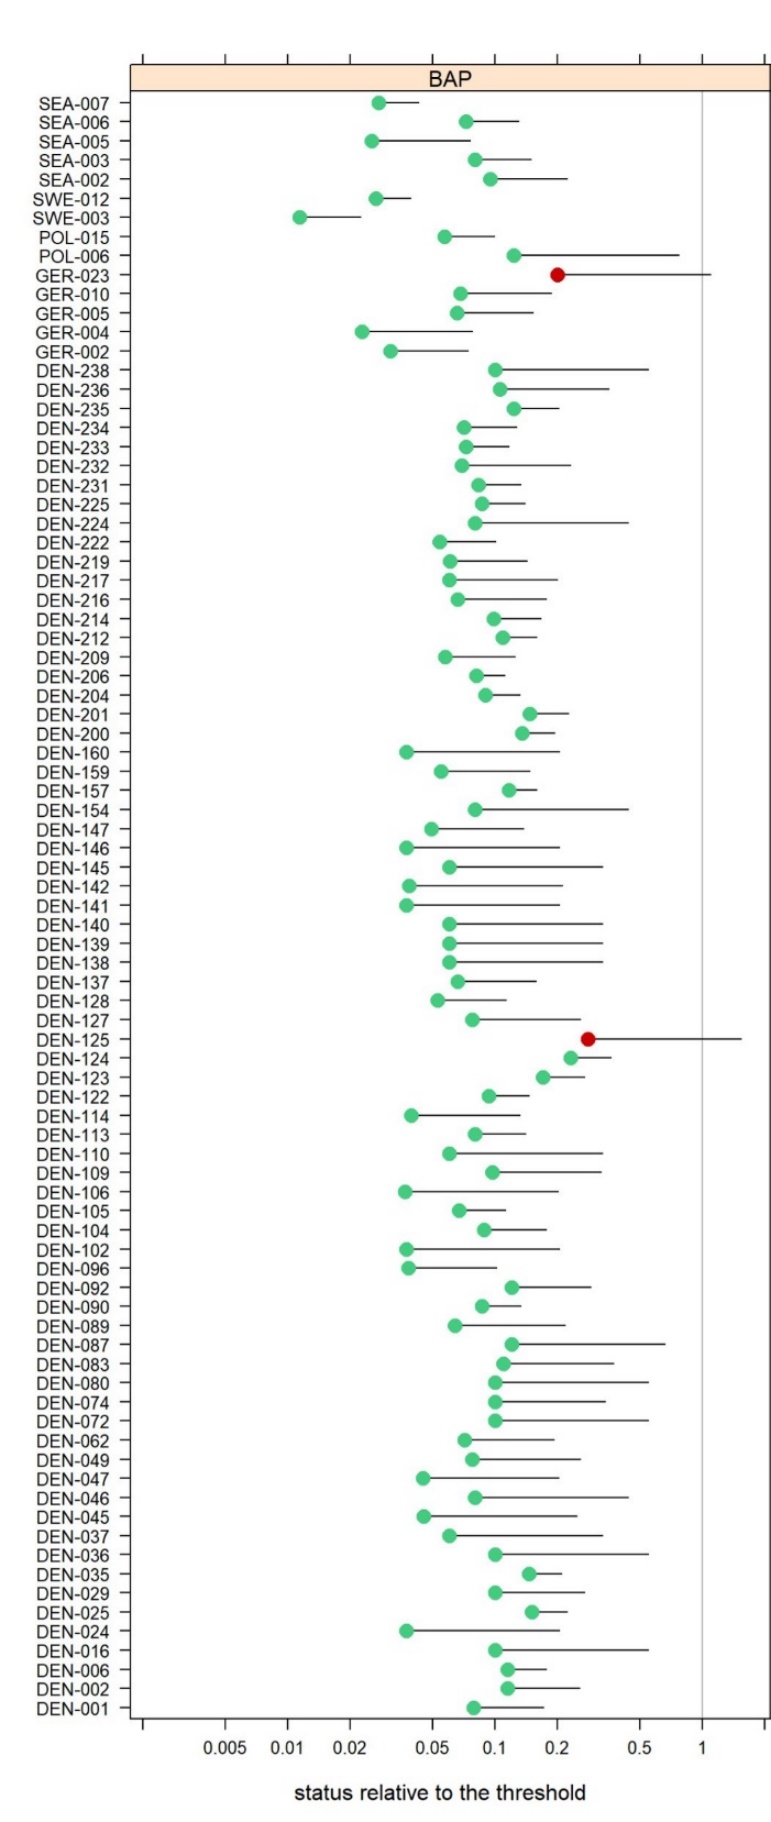
Figure 3. Overview of assessment unit level evaluation of benzo(a)pyrene (BAP) in biota relative to the agreed threshold value. The 95% confidence limit on the mean concentration is presented.
The assessment unit level evaluation is built on monitoring at 145 stations, of which circa 50 represent ‘full’ data series (i.e. more than 3 years of data for the period) to which distinct trends could be assigned statistically. Five of these stations showed downward trends (e.g. decreasing concentrations of benzo(a)pyrene in biota). These stations were located in the Great Belt, Kattegat (3) and Western Gotland basin regions. Eight of the stations evaluated failed to achieve the threshold value, these stations being located in generally in more southerly/south westerly regions of the Baltic Sea (Great Belt, The Sound, Kiel Bay, Arkona Basin, the Bay of Mecklenburg, and the Gdansk Basin) (Figure 4).
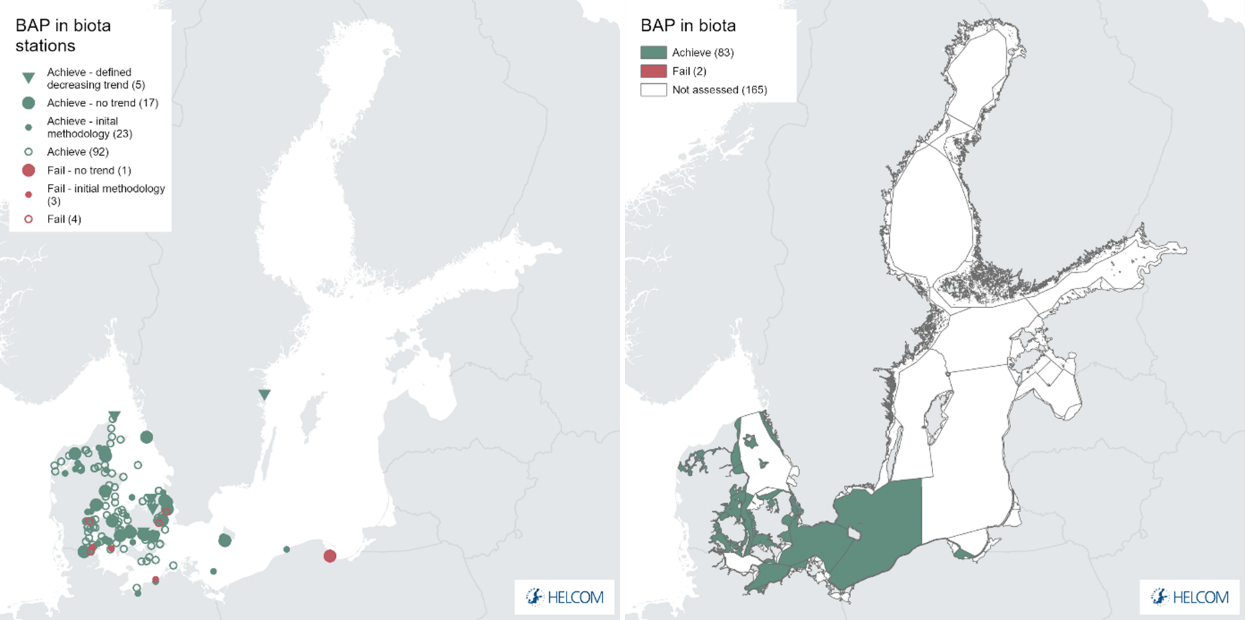
Figure 4. Benzo(a)pyrene concentration status per station (left) and aggregated assessment unit status evaluation (right). Green indicates that the threshold value is achieved and red that the threshold value is failed. Small open circles indicate a status assessment based on only 1-2 years of data (initial data), small filled circles indicate that data is not suitable to assess a trend (treated with initial methodology), large filled circles that no detectable concentration trends can be identified during the whole monitoring period (full data), and the filled arrow indicate that there is a statistically defined upward or downward trend during the monitoring period. See ‘data chapter’ for interactive maps and data at the HELCOM Map and Data Service.
Examples of different station level evaluations are provided in Figure 5 where a ‘full’ data station showing a distinct trend and a decreasing concentration (i.e. a downward pointing triangle from results Figure 2) and an initial station where less than three data points (and/or less-than values) are available within the current assessment period (‘initial’ data).
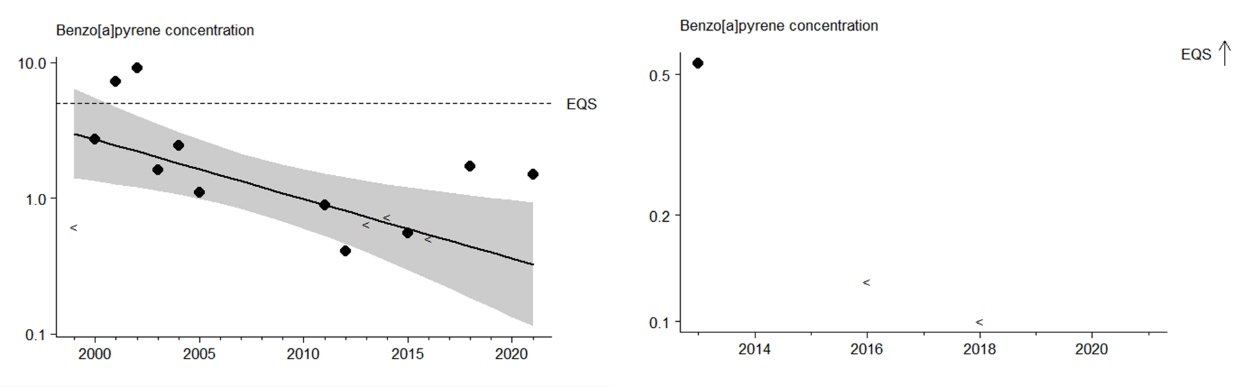
Figure 5. Examples of benzo(a)pyrene concentration in blue mussel (soft body) at two stations in the Kattegat and Bay of Mecklenburg, respectively, selected for illustrative purposes, showing a station with full evalluation possible (left) and initial status evaluation data (right).
Fluoranthene (in biota)
Two of the 84 assessment units evaluated for fluoranthene (FLU) in biota failed to achieve the threshold value. In general the mean values for the assessment units are well below the agreed threshold value, but in those instances where the threshold value is not acived (sub-GES, red) the 95% confidence level exceeeds the threshold value resulting in sub-GES status (Figure 6).
Figure 6. Overview of assessment unit level evaluation of fluoranthen in biota relative to the agreed threshold value. The 95% confidence limit on the mean concentration is presented.
The assessment unit level evaluation is built on monitoring at 144 stations, of which circa 50 represent ‘full’ data series (i.e. more than 3 years of data for the period) to which distinct trends could be assigned statistically. Six of these stations showed downward trends (e.g. decreasing concentrations of fluoranthene in biota). These stations were located in the Great Belt, Kattegat (3) and Arkona Basin regions. Three of the stations evaluated failed to achieve the threshold value, these stations being located in the Great Belt, Kiel Bay, and Kattegat and it is also significant that these all represented shorter time series (i.e. ‘initial’) data. A single station where a distinct increasing trend was recorded was located in the Great Belt assessment unit, however the station and assessment unit achieved GES (Figure 7).
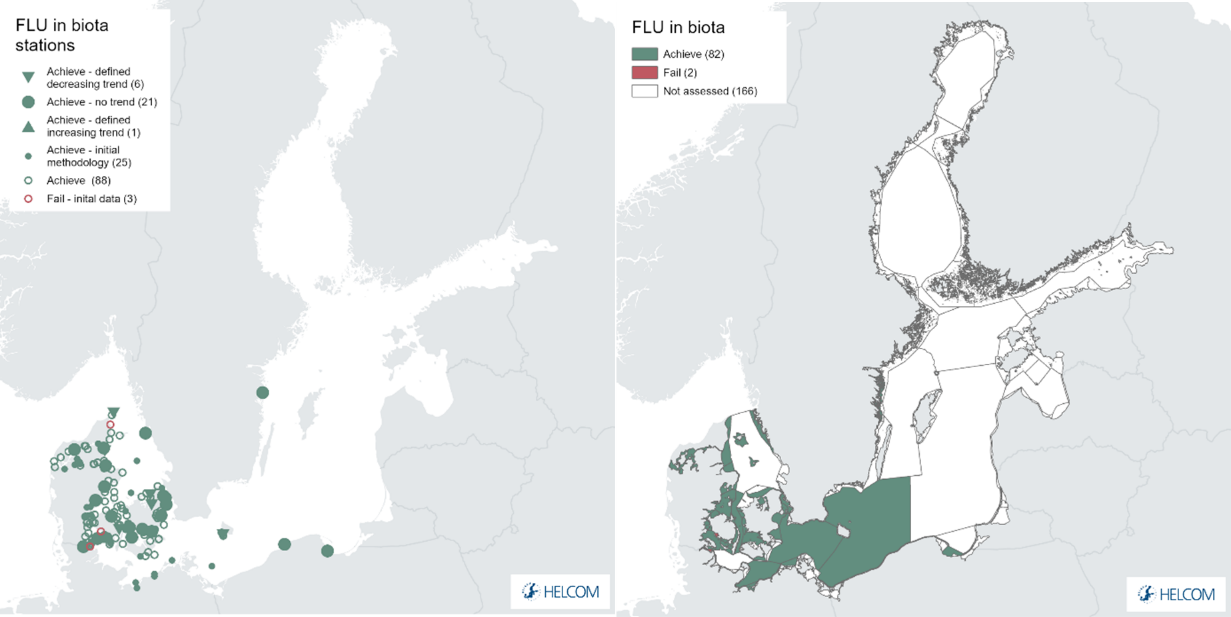
Figure 7. Fluoranthene concentration status per station (left) and aggregated assessment unit status evaluation (right). Green indicates that the threshold value is achieved and red that the threshold value is failed. Small open circles indicate a status assessment based on only 1-2 years of data (initial data), small filled circles indicate that data is not suitable to assess a trend (treated with initial methodology), large filled circles that no detectable concentration trends can be identified during the whole monitoring period (full data), and the filled arrow indicate that there is a statistically defined upward or downward trend during the monitoring period. See ‘data chapter’ for interactive maps and data at the HELCOM Map and Data Service.
Examples of different station level evaluations are provided in Figure 8 where a ‘full’ data station showing a distinct trend and a decreasing concentration (i.e. a downward pointing triangle from Figure 7) and a ‘full’ data station showing a distinct trend and an increasing concentration (i.e. an upward pointing triangle from Figure 7).
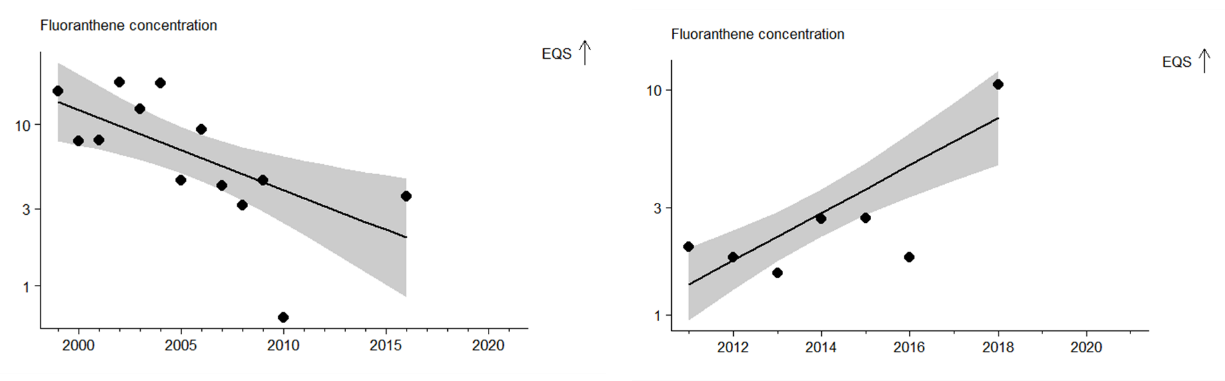 Figure 8. Examples of fluoranthene concentration in blue mussel (soft body) at two stations in the Kattegat and Great Belt, respectively, selected for illustrative purposes, showing a station with full evaluations with a distinct decreasing concentration trend (left) and full evaluation with a distinct increasing concentration trend (right).
Anthracene (in sediment)
Anthracene is monitored in sediments and across a wide spatial area. The sampling strategies for sediments are commonly less frequent than those for biota or water and this data is generally treated with the methodologies applied to ‘initial’ data (see Methodology below). Thirty-three assessment units are evaluated for anthracene concentration, of which 13 (of a possible 17) are in open sea assessment units. Four of the 13 open sea assessment units evaluated failed to achieve the threshold value and are thus in sub-GES condition. In comparison all but one of the 20 coastal stations failed to achieve the threshold value (i.e. only one is in GES) (Figure 9).
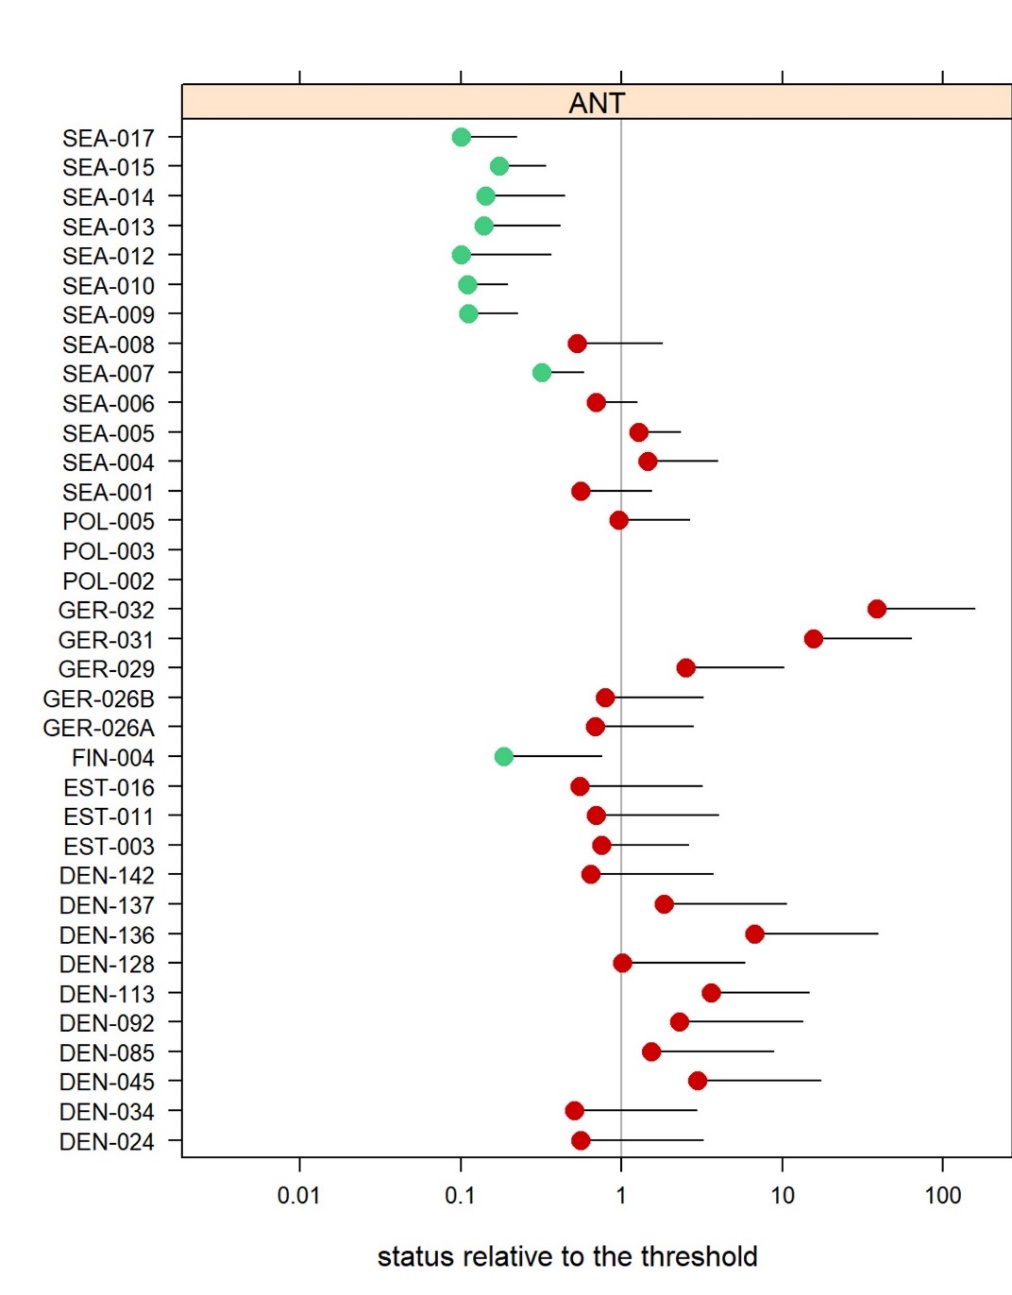
Figure 9. Overview of the assessment unit level evaluation of anthracene (ANT) in sediment relative to the agreed threshold value. The 95% confidence limit on the mean concentration is presented.
The assessment unit level evaluation is built on monitoring at 53 stations. No distinct trends were recorded at the evaluated stations, a large part due to the less frequent monitoring of sediment stations, and thus the application of the ‘initial’ methodology from which statistical trends are not fully applied (Figure 10).
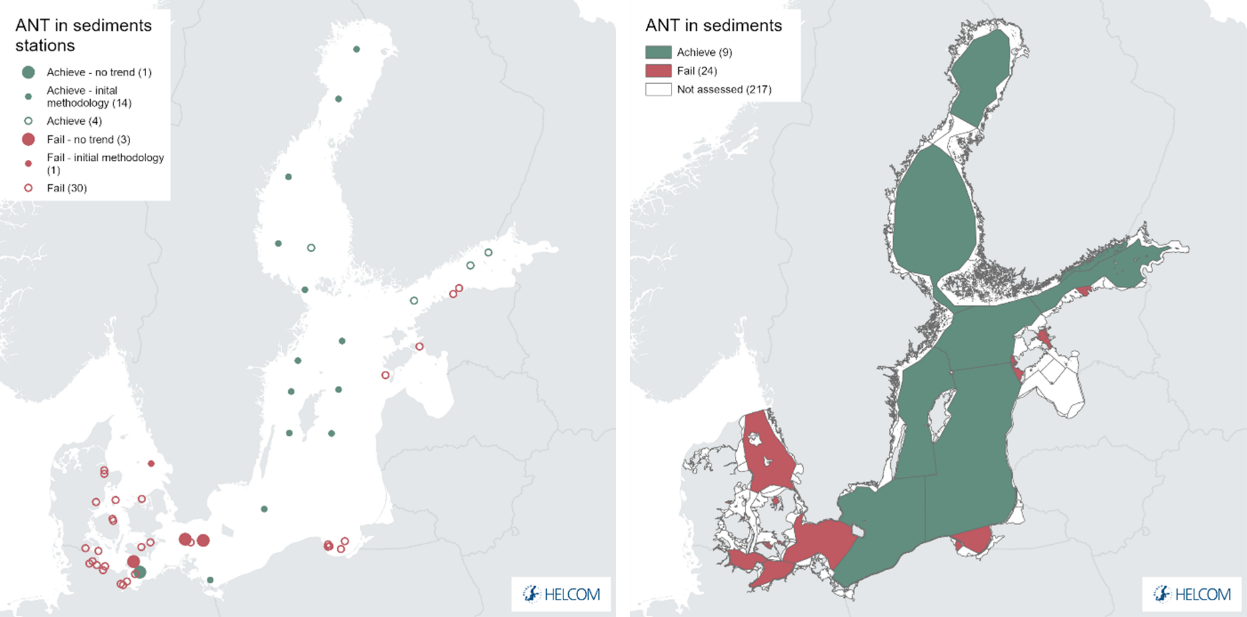
Figure 10. Anthracene concentration status per station (left) and aggregated assessment unit status evaluation (right). Green indicates that the threshold value is achieved and red that the threshold value is failed. Small open circles indicate a status evaluation based on only 1-2 years of data (initial data), small filled circles indicate that data is not suitable to assess a trend (treated with initial methodology), large filled circles that no detectable concentration trends can be identified during the whole monitoring period (full data), and the filled arrow indicate that there is a statistically defined upward or downward trend during the monitoring period. See ‘data chapter’ for interactive maps and data at the HELCOM Map and Data Service.
Fluoranthene (in sediment)
Fluoranthene is monitored in sediments and across a wide spatial area. The sampling strategies for sediments are commonly less frequent than those for biota or water and this data is generally treated with the methodologies applied to ‘initial’ data (see Methodology). 35 assessment units are evaluated for anthracene concentration, of which 13 (of a possible 17) are in open sea assessment units. All 13 open sea assessment units evaluated achieved the threshold value and are thus in GES. In comparison seven of the 22 coastal stations fails to achieve the threshold value (Figure 11).
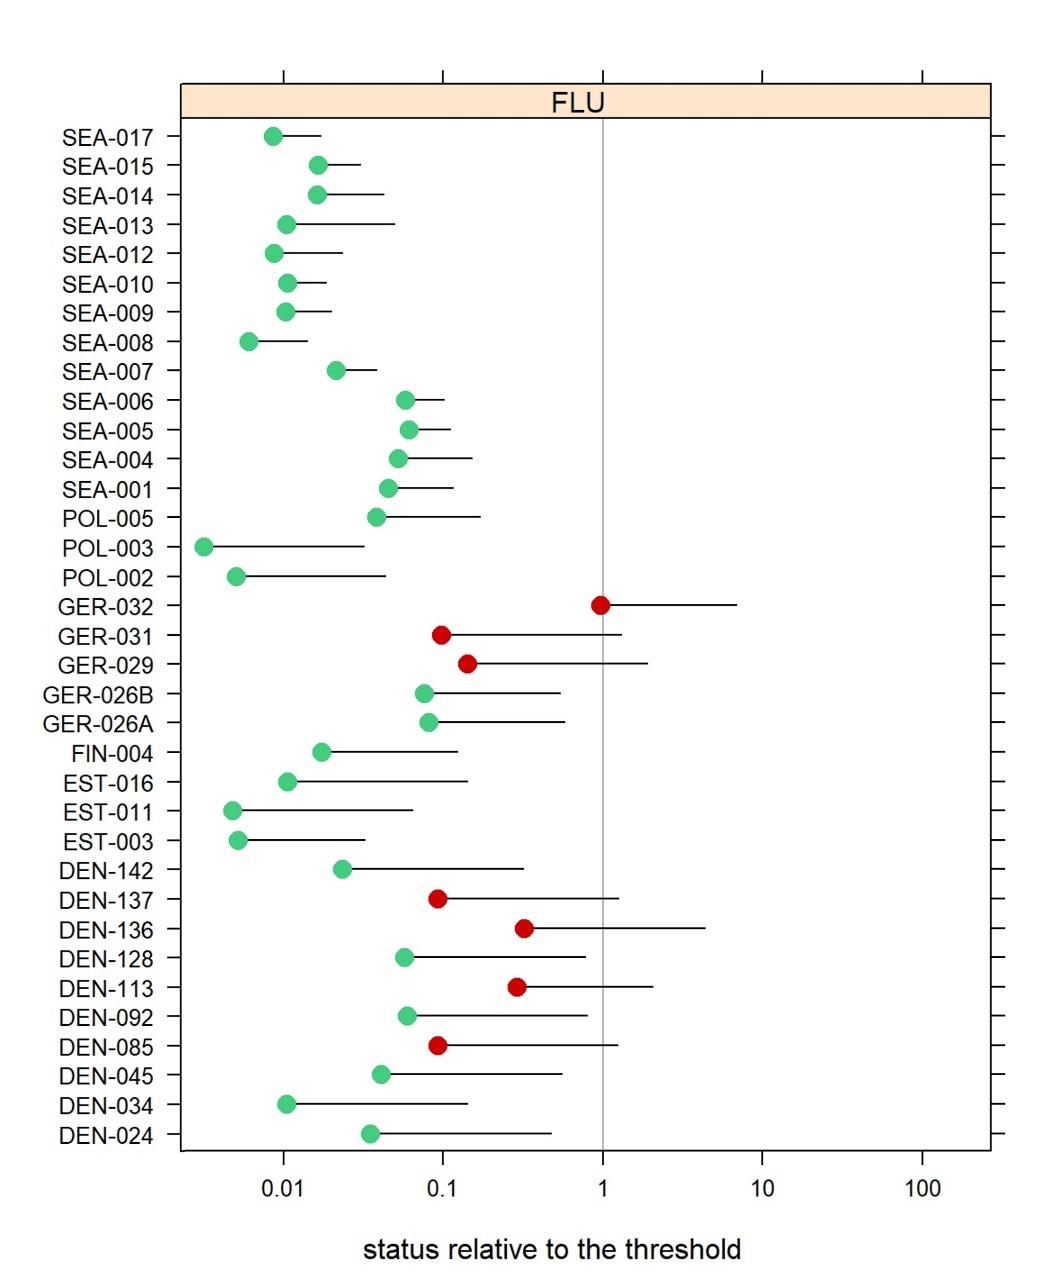
Figure 11. Overview of assessment unit level evaluation of fluoranthene in sediment relative to the agreed threshold value. The 95% confidence limit on the mean concentration is presented.
The assessment unit level evaluation is built on monitoring at 59 stations. Ten of these stations failed to achieve the threshold value and were sub-GES and with one exception no distinct trends were recorded. At one station, OMBMPM2 (Germany, SEA-005 – Bay of Mecklenburg) a distinct trend showing a decreasing concentration was recorded and the station was also in GES (Figure 12).
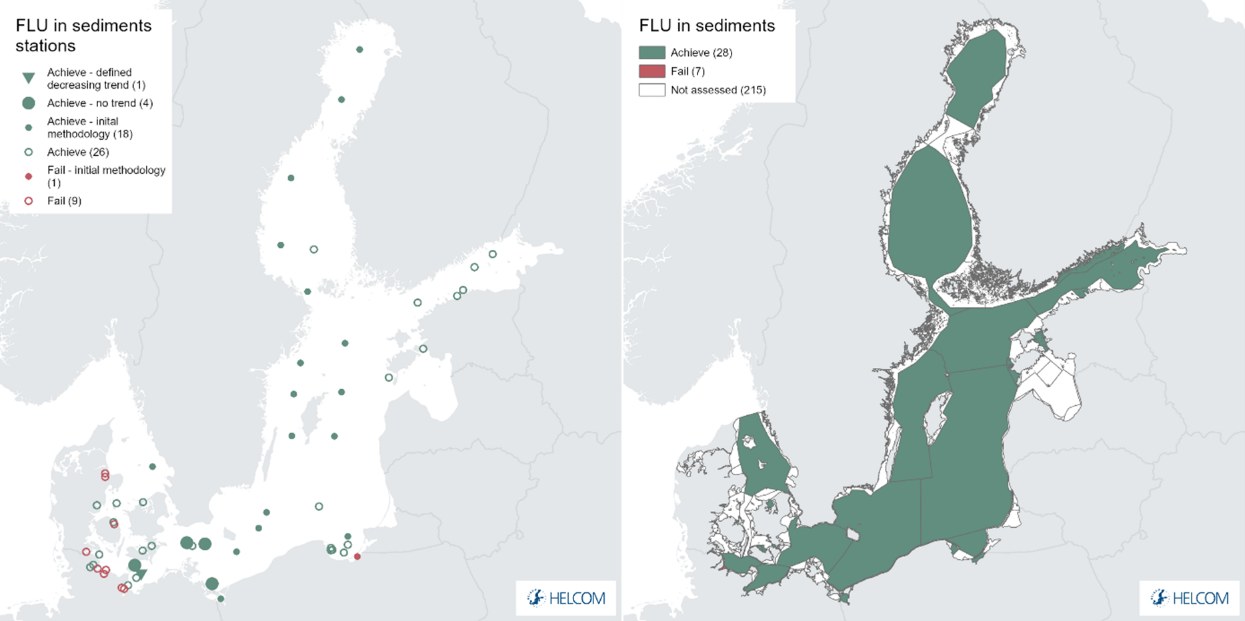
Figure 12. Fluoranthene concentration status per station (left) and aggregated assessment unit status evaluation (right). Green indicates that the threshold value is achieved and red that the threshold value is failed. Small open circles indicate a status evaluation based on only 1-2 years of data (initial data), small filled circles indicate that data is not suitable to assess a trend (treated with initial methodology), large filled circles that no detectable concentration trends can be identified during the whole monitoring period (full data), and the filled arrow indicate that there is a statistically defined upward or downward trend during the monitoring period. See ‘data chapter’ for interactive maps and data at the HELCOM Map and Data Service.
PAH metabolite – 1-hydroxypyrene (in biota)
The evaluation of the PAH metabolite 1-hydroxypyrene was carried out in 9 assessment units where German and Polish sampling occurred. Of these 9 assessment units 5 failed to achieve the threshold value and were sub-GES. These represented all but one of the 6 open sea assessment units evaluated (Figure 13).
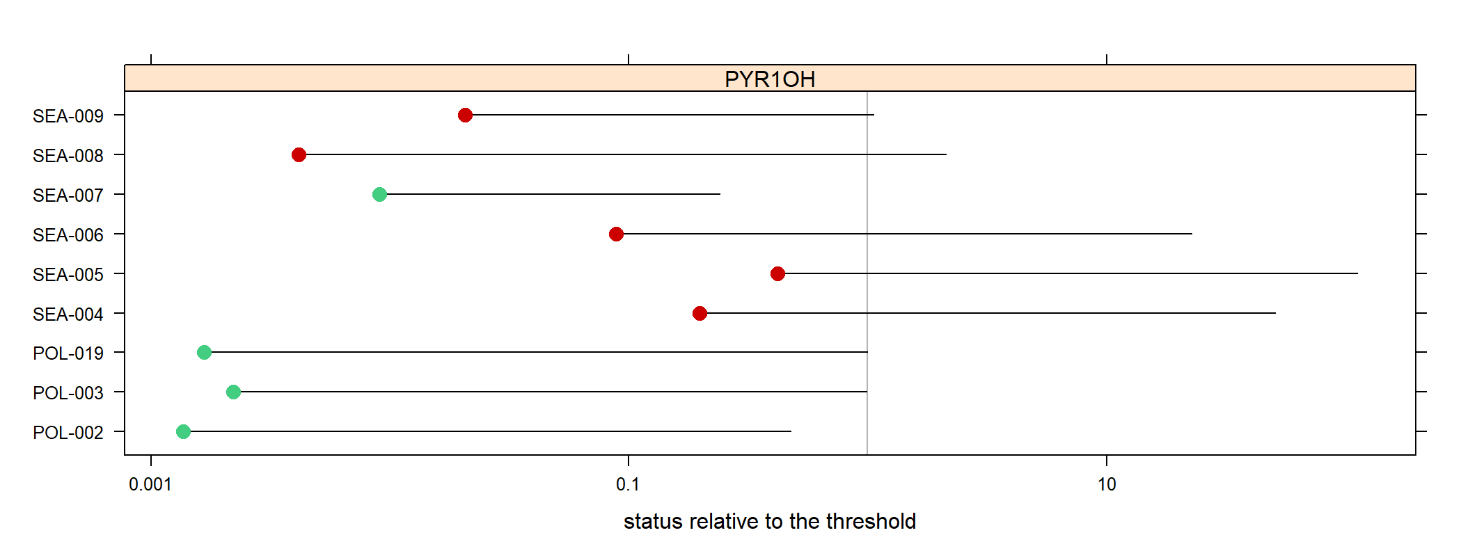
Figure 13. Overview of assessment unit level evaluation of PAH metabolite 1-hydroxypyrene (PYR1OH) in biota relative to the agreed threshold value. The 95% confidence limit on the mean concentration is presented.
The assessment unit level evaluation is built on monitoring at 15 stations, all but one of which independently achieved the threshold value. No distinct trends were recorded at the evaluated stations except for at ZPOM (Poland, SEA-007 – Bornholm Basin) where an increasing concentration trend was recorded (upward triangle, Figure 14). The discrepancy between the assessment unit level evaluation and that of the station level evaluation is due to the large variation in the regional dataset which influences the computation of the psi values applied to generate the assessment unit level results (see methodology section).
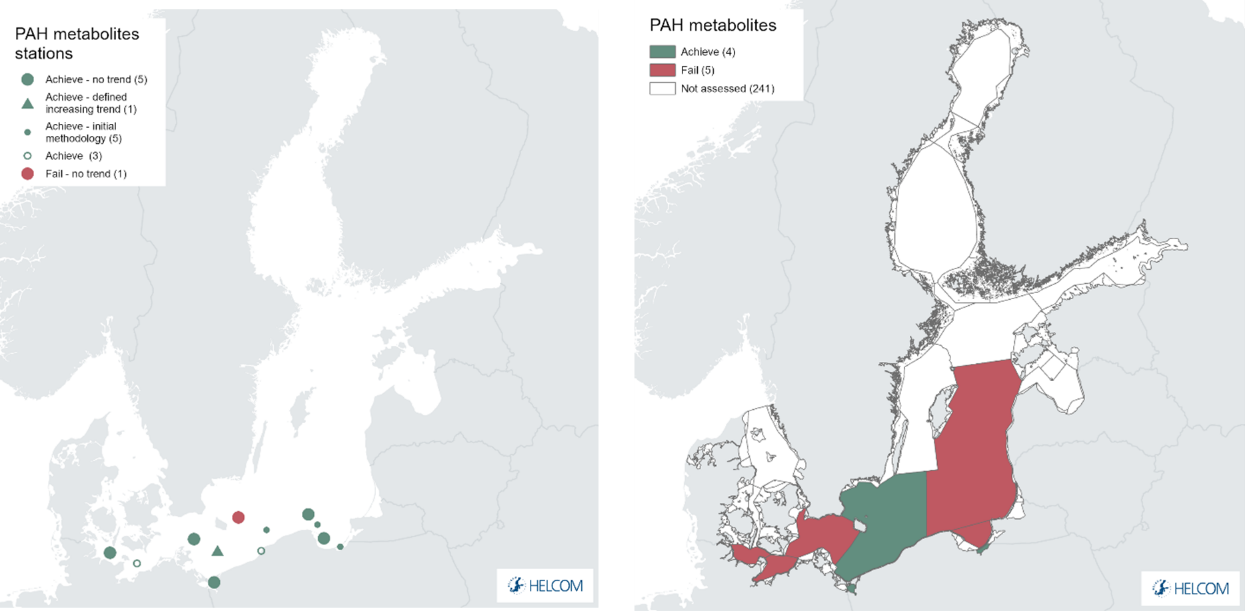
Figure 14. PAH metabolite 1-hydroxypyrene concentration status per station (left) and aggregated assessment unit status evaluation (right). Green indicates that the threshold value is achieved and red that the threshold value is failed. Small open circles indicate a status evaluation based on only 1-2 years of data (initial data), small filled circles indicate that data is not suitable to assess a trend (treated with initial methodology), large filled circles that no detectable concentration trends can be identified during the whole monitoring period (full data), and the filled arrow indicate that there is a statistically defined upward or downward trend during the monitoring period. See ‘data chapter’ for interactive maps and data at the HELCOM Map and Data Service.
This large variation in the dataset at the regional level is something that warrants further evaluation and work prior to the next holistic assessment. The results provided here offer a good overview of the situation, especially with regards to the station level outcomes. The variation across the data set at the regional level that influences the uncertainty and the psi value may relate to different methodologies applies in different countries (see illustration in Figure 15). Evaluation and harmonisation of this in the future may further improve the regional evaluation. The application of different methodologies may be the source of the apparent spread of results.
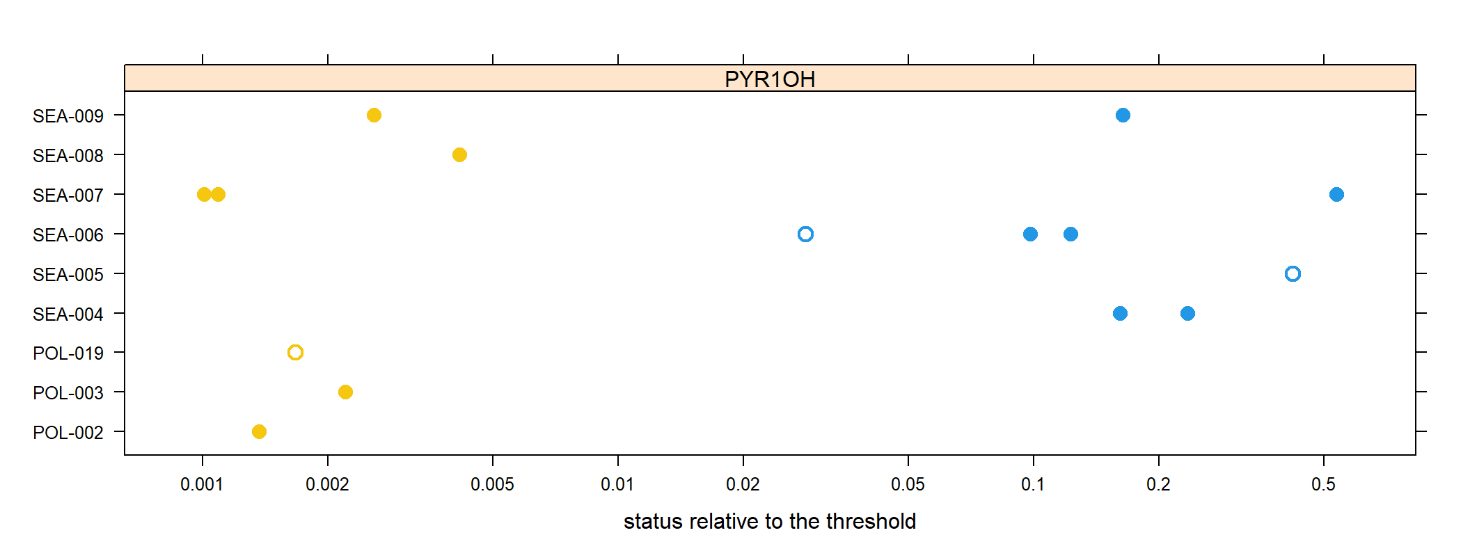
Figure 15. PAH metabolite 1-hydroxypyrene mean concentration at individual stations and identified by country (Yellow – Poland and Blue – Germany).
4.2 Trends
Examples of key trends at selected stations are provided above. For certain parameters, such as sediment analyses, assignment of statistical trends is not easy to achieve due to the low frequency of the monitoring applied. For other monitoring matrices the identification of statistical trends is viable and a small number of decreasing trends (i.e. concentrations becoming lower) have been identified.
For biota (of 289 stations, BAP and FLU) 11 downward trends (decreasing concentrations) were identified and a single upward trend. PAH metabolites are not included.
For sediment (of 112 stations, ANT and FLU) a single downward trend (decreasing concentrations) was identified.
4.3 Discussion
PAHs tend to associate with particulate material due to their low water solubility and hydrophobic nature. Deposition of these particles can lead to an accumulation of PAHs in the sediment, as evidenced by the higher relative proportion of sediment evaluations failing to achieve their threshold values (especially anthracene). Around 25% of coastal assessment units and 30% of open sea assessment units evaluated were sub-GES. The monitoring and evaluation of anthracene (or not monitoring it), or an evaluation in biota alone, appears to have an impact on the status evaluation as assessment units in which anthracene are evaluated are commonly sub-GES. This trend appears relevant for the open sea assessment units in more south-westerly areas of the Baltic Sea.
An overview of the outcomes for the open sea sub-basins are provided below (Table 3).
Table 3. Overview of evaluation outcomes and comparison with previous evaluation (using the OOAO evaluation outcomes per assessment unit, excluding PAH metabolites). Currently this approach is only applied for open sea assessment units.
| HELCOM Assessment unit name (and ID) | Threshold value achieved/failed – HOLAS II | Threshold value achieved/failed – HOLAS 3 | Distinct trend between current and previous evaluation. | Description of outcomes, if pertinent. |
| Kattegat (SEA-001) | Achieved | Failed | Status has changed from achieve to fail (i.e. a deterioration). It is understood that this is a result of more data being available in the current assessment period, and thus the 95% confidence level exceeds the threshold value despite the mean value being below. | The evaluation does not achieve GES (sub-GES) due to concentrations of anthracene in sediments exceeding the threshold value. |
| Great Belt (SEA-002) | Failed | Achieved | Status has changed from fail to achieve. This may represent an improvement in status but may also be linked to the evaluation of ANT in the previous assessment period and no available data for ANT in this evaluation as ANT more commonly fails its threshold value. | The evaluation achieves the threshold values evaluated (GES), based on the evaluation of BAP and FLU in biota. |
| The Sound (SEA-003) | Failed | Achieved | ||
| Kiel Bay (SEA-004) | Failed | Failed | No change in status between assessment periods. Anthracene is the main cause of sub-GES in both periods. | The evaluation does not achieve GES (sub-GES) due to concentrations of anthracene in sediments exceeding the threshold value. |
| Bay of Mecklenburg (SEA-005) | Failed | Failed | ||
| Arkona Basin (SEA-006) | Failed | Failed | ||
| Bornholm Basin (SEA-007) | Failed | Achieved | Status has changed from fail to achieve and appears to represent an improved status as four components were evaluated and achieve GES, whereas in the previous assessment period anthracene drove sub-GES outcomes. | The evaluation achieves the threshold values evaluated (GES), ANT and FLU in sediments. |
| Gdansk Basin (SEA-008) | Not evaluated | Failed | NA | The evaluation does not achieve GES (sub-GES) due to concentrations of anthracene in sediments exceeding the threshold value. |
| Eastern Gotland Basin (SEA-009) | Failed | Achieved | Status has changed from fail to achieve and appears to represent a more suitable data input. The status evaluation in the previous period was driven by to short time series (lower confidence ‘initial’ data) in biota. | The evaluation achieves the threshold values evaluated (GES), ANT and FLU in sediments. |
| Western Gotland Basin (SEA-010) | Achieved | Achieved | No change in status. | The evaluation achieves the threshold values evaluated (GES), ANT and FLU in sediments. |
| Northern Baltic Proper (SEA-012) | Achieved | Achieved | ||
| Gulf of Finland (SEA-013) | Not evaluated | Achieved | NA | The evaluation achieves the threshold values evaluated (GES), ANT and FLU in sediments. |
| Åland Sea (SEA-014) | Achieved | Achieved | No change in status. | The evaluation achieves the threshold values evaluated (GES), ANT and FLU in sediments. |
| Bothnian Sea (SEA-015) | Achieved | Achieved | ||
| Bothnian Bay (SEA-017) | Achieved | Achieved |
5 Confidence
The overall confidence of the evaluation is considered to be moderate, with a few assessment units achieving high and some achieving low confidence (see confidence map in Figure 16, and table in Annex 1).
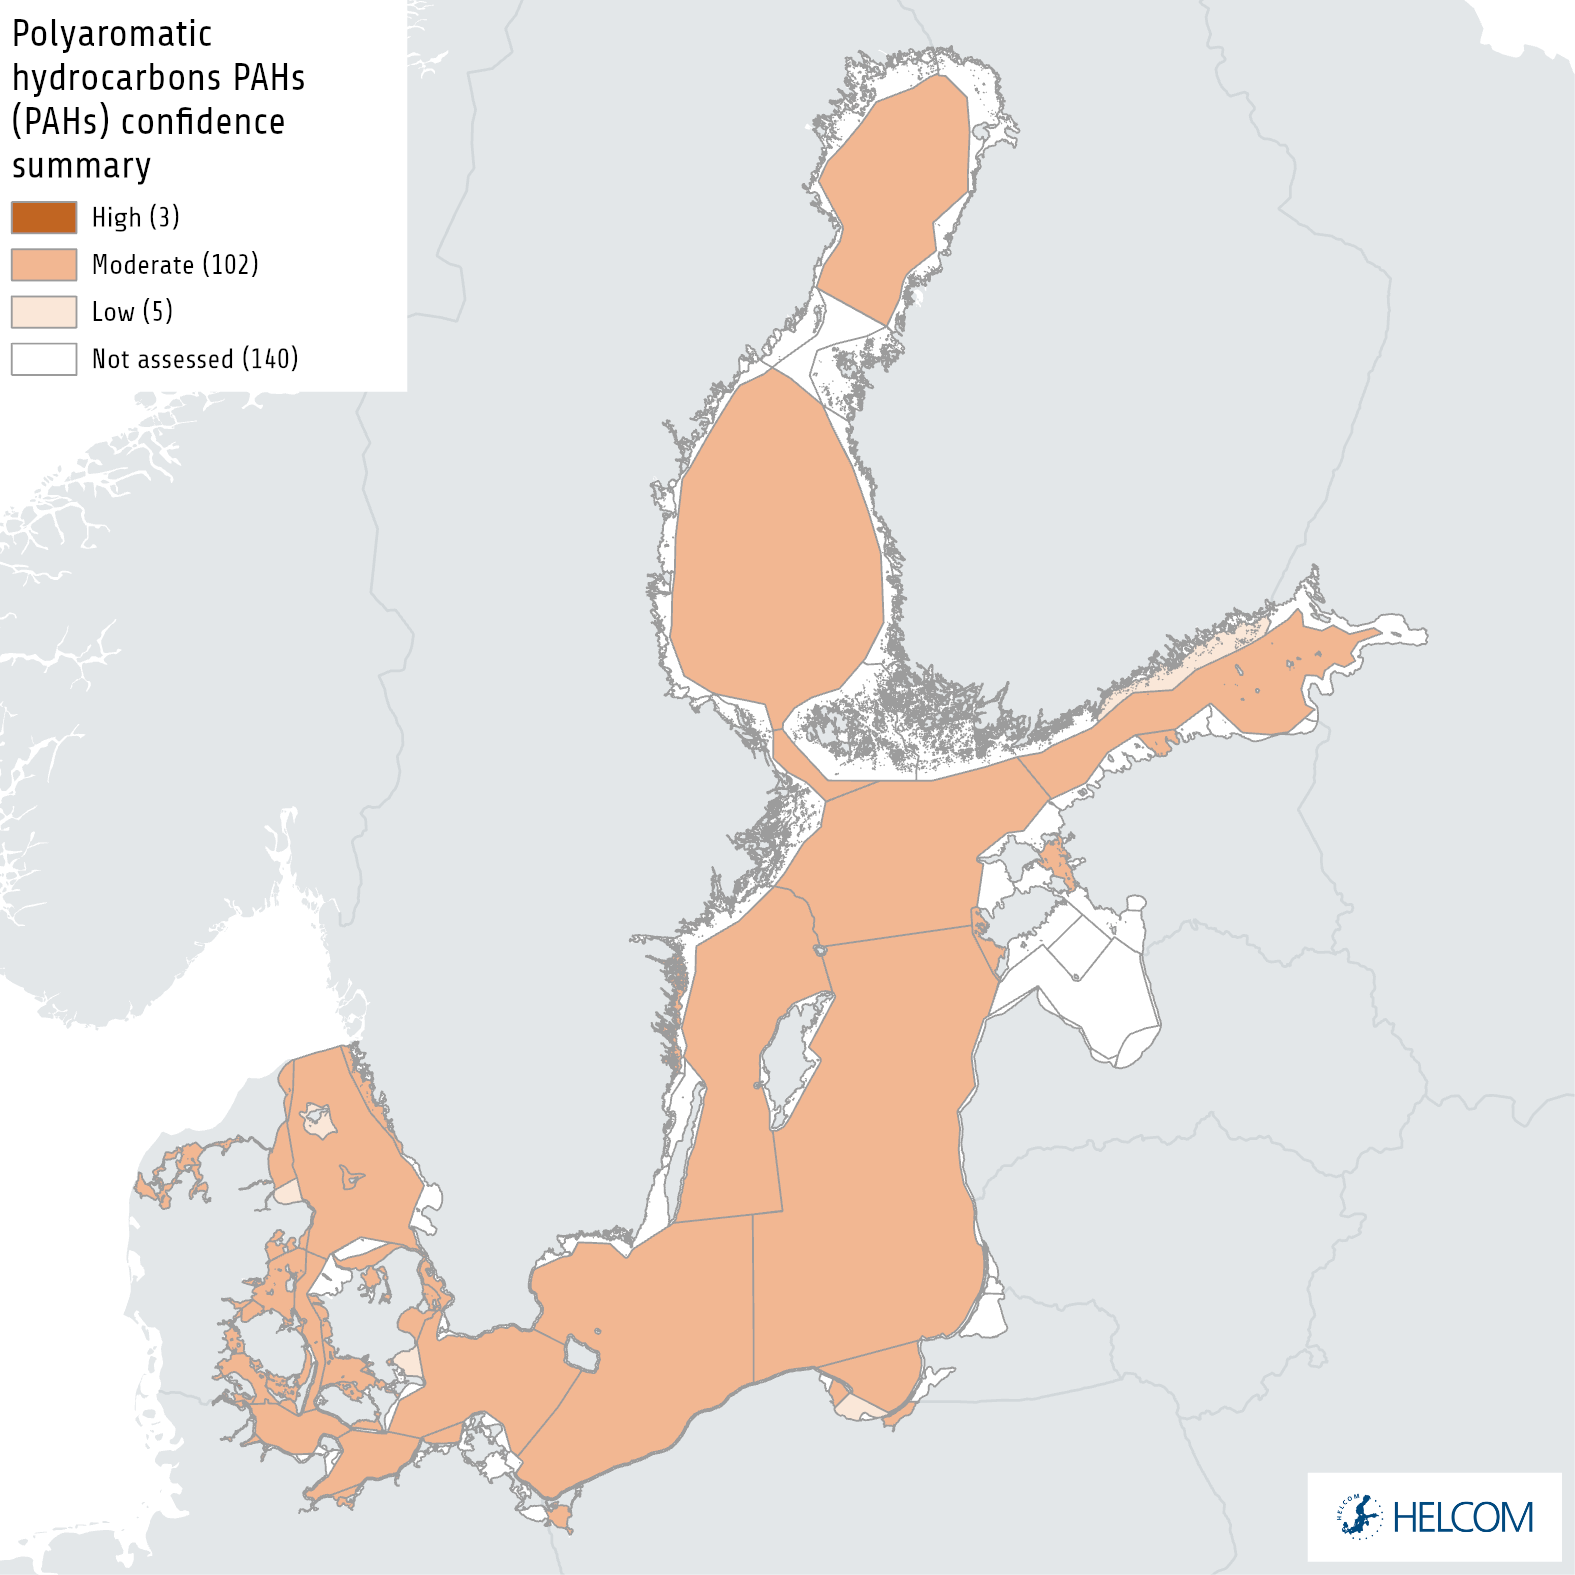
Figure 16. Map presenting the confidence in the overall evaluation based on a OOAO summary of confidence across all monitored matrices (see Annex 1). The evaluation is carried out using Level 4 HELCOM assessment units (defined in the HELCOM Monitoring and Assessment Strategy Annex 4).
Further monitoring data in the future will elongate the data series available and strengthen the confidence further. Certain assessment areas, where relevant, could further benefit from wider spatial monitoring of these substances.
The data used in this evaluation are considered to be reliable and the evaluation accurate, indicating a high confidence in the evaluation. The threshold value is based on an EU Environmental Quality Standard (EQS) which is considered to have a high confidence.
6 Drivers, Activities, and Pressures
Drivers are often large and complex issues that are difficult to quantify, though in certain instances proxies can be utilised to express them or changes in them. A driver for example may relate to globalisation or political will and, while difficult to quantify in terms of specific relevance to an indicator, changes in drivers can catalyse changes in activities that will consequently influence pressures for example resulting in altered levels of shipping and the subsequent pressures for that activity. A brief overview of key pressures and activities is provided in Table 4.
Some polyaromatic hydrocarbons (PAHs) are formed naturally, but the majority of PAHs in the marine environment stem from anthropogenic activity. Anthropogenic PAH sources in the marine environment include the release of crude oil products (petrogenic source) and all types of incomplete combustion of fossil fuels – coal, oil and gas or wood and waste incineration (pyrolytic sources) (Neff 2004).
Each source generates a characteristic PAH pattern enabling distinction of the sources in a sample by analyzing the concentration relationships of individual PAH compounds (Baumard et al. 1998, Sicre et al. 1987, Yunker et al. 2002). The PAH contamination in the Gulf of Finland and some areas in the western Baltic Sea (Sound, Belt Sea and Kattegat) have been identified as having a significant contribution of petrogenic PAHs, compared to the rest of the Baltic Sea where pyrolytic sources predominate. PAHs from pyrolytic sources may be introduced through atmospheric deposition, however no reliable information is available on the airborne deposition of PAHs to Baltic Sea surface waters (Pikkarainen 2004). In the areas where petrogenic PAHs are identified as a significant source, PAH contamination is likely to originate from atmospheric deposition combined with shipping activities.
It is noted, that alkylated PAH:s are a main part of PAHs from petrogenic sources. Since alkylated PAHs are not included within this indicator, this could lead to an underestimation of the PAH concentrations when the source is petrogenic.
PAH compounds are pervasive in the Baltic Sea. Anthracene has been detected in fish from Swedish monitoring stations selected to reflect reference conditions. Anthracene has also has been measured in sediment from the Stockholm area (with concentrations falling inversely with distance from central Stockholm) and homogeneous coastal samples, indicating small local impact. It has also been measured in detectable concentrations in water areas sampled with the use of passive sampling devices. Fluoranthene is frequently present in fish from Swedish background stations, and also found in sediment and sludge. It has been found in all water samples from Sweden taken by means of passive sampling devices, and it is detectable in groundwater samples (Swedish EPA 2009).
In offshore regions, a study by Kammann (2007) indicated no temporal trends of PAH contamination between 1997 and 2004, on the basis of PAH metabolites measured in dab and flounder caught in the North Sea and the western Baltic Sea in a study. Lower values than in North Sea (dab, cod, flounder, haddock) and Baltic Sea (flounder, cod, herring, Vuorinen et al. 2006; eelpout) have been detected in Barents Sea (cod) and near Iceland (dab). Higher concentrations are present in fish caught in harbour regions or in coastal areas (eelpout, Kammann and Gercken 2010).
Table 4. Brief summary of relevant pressures and activities with relevance to the indicator.
| | General | MSFD Annex III, Table 2a |
| Strong link | PAH introduced to the marine environment through spills of petrochemical substances and emissions from fuel consumption and maritime activities | Substances, litter and energy
– Input of other substances (e.g. synthetic substances, non-synthetic substances, radionuclides) – diffuse sources, point sources, atmospheric deposition, acute events |
| Weak link | Atmospheric deposition may be a significant pathway |
7 Climate change and other factors
Climate change in the Baltic Sea region is expected to have significant impacts on key processes in the marine environment (HELCOM and Baltic Earth 2021). While there are relatively few studies that fully explore the impacts of such changes on hazardous substances direct parameters such as changes in water temperature, atmospheric deposition, precipitation, river run off and sediment transportation could all alter the flow of contaminants to and within the marine environment. In addition, alterations in metabolic aspects as well as food web structure and function may also alter the transfer of contaminants within the ecosystem and food web and thus alter the levels of bioaccumulation (as well as possible effects).
Climate change related factors and the response to them may offer a complex picture for PAHs. On the one hand effort to reduce use of fossil fuels, move towards greener/cleaner alternatives as well as improved management and spill reduction could lower inputs further. Other factors such as release from fires (e.g. forest fires) may represent a significant future contributor to the pool of PAHs. However, other factors may also influence the existing pool of PAHs in the marine environment or its catchment area. Rainfall and river discharge are predicted to increase as a result of climate change especially in the northern Baltic, while some decreases in river inflow are expected in the south (HELCOM and Baltic Earth 2021). Increased rainfall and altered atmospheric conditions may also alter the current levels, rates and placement of the deposition of PAHs. This may result in the transport of PAHs and loading to the marine environment, especially in the coastal zone, where the marine environment becomes a sink or an extensive catchment area.
Altered sediments transport, as well as the disturbance of sediments in the marine environment, may alter the concentrations in water or subsequently the exposure to biota (directly or via food webs). Warmer waters may also influence rates at which accumulation takes place or relevant chemical processes involved in bioaccumulation or metabolism.
Recent studies have identified different behaviours of the PAH congeners due to climate change, for example particle bound congeners being less effected (Yu et al., 2019), and altered profiles of PAHs in particular the generation of metabolites often with unknown toxicity (Marquès et al., 2016). Such insights may be critical to review in the future as they could have relevance to the selection of congeners/metabolites and the requirements of monitoring to ensure GES is achieved.
8 Conclusions
Overall, the concentrations of PAHs in biota and sediment vary across the region. For open sea assessment units, the more southerly areas appear more strongly impacted (i.e. are often sub-GES). The accumulation and persistence in sediments (especially for anthracene), where monitored also appears to have a significant impact on the overall status in these regions.
8.1 Future work or improvements needed
The indicator is generally fully operational but increased spatial and temporal monitoring as well as further development and harmonisation related to analysis of metabolites would benefit the indicator and reduce uncertainties.
9 Methodology
9.1 Scale of assessment
The core indicator evaluation is carried out on the HELCOM assessment unit scale 4, including 17 open sea assessment units delimitated by the so called 1 nautical mile boundary from the baseline, and with the coastal areas split into WFD waterbodies or –types. The assessment units are defined in the HELCOM Monitoring and Assessment Strategy Annex 4.
9.2 Methodology applied
Assessment units are evaluated using the primary substance benzo(a)pyrene concentration measured in crustaceans. If no evaluation is possible using the primary substance, then the secondary substances can be used to develop an evaluation for an assessment unit.
Sediment measurements were normalized to 5% total organic content (TOC) before being evaluated against the threshold value.
Assessment methodology for contaminants in biota, sediment and water
The evaluation protocol is structured in three main parts, 1) changes in log concentrations over time are modelled, 2) check for compliance against threshold value and evidence for temporal change of contaminant concentration per station and 3) a spatial aggregation of status per assessment unit.
It should be noted that the evaluation protocol makes the assumption that monitoring data stems from the same monitoring stations during consecutive years. The stations used by the protocol are defined in the ICES Station Dictionary. Stations with similar station name are grouped together, but it is also possible to define a group of stations with different names to be defined as the same station in the Station Dictionary. Usually a station is defined in the Station Dictionary with coordinates and a valid box around these coordinates, but coordinates outside of the box will only give a warning when reporting the data, and are not used in the actual data extraction.
All initial data is handled in a highly precautionary manner to further ensure that the risk of false positives is minimalised. For all initial data the 95% confidence limit on the mean concentration, based on the uncertainty seen in longer time series throughout the HELCOM area, is used. Applying a precautionary approach, the 90% quantile (psi value, Ψ ) of the uncertainty estimates in the longer time series from the entire HELCOM region are used. The same approach is used for time series with three or more years of data, but which are dominated by less-than values (i.e. no parametric model can be fitted). The mean concentration in the last monitoring year (meanLY) is obtained by: restricting the time series to the period 2016-2021 (the last six monitoring years), calculating the median log concentration in each year (treating ‘less-than’ values as if they were above the limit of detection), calculating the mean of the median log concentrations, and then back-transforming (by exponentiating) to the concentration scale. The upper one-sided 95% confidence limit (clLY) is then given by:
 where n is the number of years with data in the period 2016-2021.
9.3 Monitoring and reporting requirements
Monitoring methodology
HELCOM common monitoring of relevance to the indicator is documented in the on-line HELCOM Monitoring Manual in the sub-programme: Contaminants in biota and sub-programme: Contaminants in sediment.
Monitoring guidelines on the determination of persistent organic compounds in biota are currently documented in the HELCOM COMBINE manual, and are under review.
Current monitoring
The monitoring activities relevant to the indicator that are currently carried out by HELCOM Contracting Parties are described in the HELCOM Monitoring Manual
Sub-programme: monitoring concepts table for biota and the monitoring concepts table for sediment.
PAHs are monitored in biota in Denmark, Poland and Sweden and in sediments in Denmark, Poland and Sweden.
PAH metabolites in fish bile are regularly monitored by Denmark, Germany and Poland. Pre-monitoring stage of PAH metabolites investigations exist in Finland and Poland.
Description of optimal monitoring
PAHs or their metabolites are not monitored adequately in the eastern parts of the Baltic Sea. Especially, the lack of monitoring in Gulf of Finland is noteworthy.
10 Data
The data and resulting data products (e.g. tables, figures and maps) available on the indicator web page can be used freely given that it is used appropriately and the source is cited.
Result: Polyaromatic hydrocarbons (PAHs) – Fluoranthene in biota
Result: Polyaromatic hydrocarbons (PAHs) – Anthracene in sediments
Result: Polyaromatic hydrocarbons (PAHs) – Fluoranthene in sediment
Result: Polyaromatic hydrocarbons (PAHs) – PAH metabolites in biota
Data: Hazardous substances in biota
Data: Hazardous substances in sediment
The core indicator evaluation is based on an extraction of data from the HELCOM COMBINE database, hosted by ICES. The database contains data from regular environmental monitoring carried out by the Contracting Parties of HELCOM.
The dataset has been used to evaluate the assessment period 2016-2021 for the purposes of the ‘Status of the Baltic Sea’ report.
11 Contributors
Martin M Larsen, Aarhus University Denmark, and Ulrike Kammann, Thünen Institute, Germany.
Rob Fryer, Marine Scotland (OSPAR).
HELCOM Expert Network on Hazardous Substances.
HELCOM Secretariat: Owen Rowe, Deborah Shinoda, Joni Kaitaranta, and Jana Wolf.
12 Archive
This version of the HELCOM core indicator report was published in April 2023:
The current version of this indicator (including as a PDF) can be found on the HELCOM indicator web page.
Earlier versions of this indicator are available at:
PAHs and their metabolites HELCOM core indicator 2018 (pdf)
HOLAS II component – Core indicator report – web-based version July 2017 (pdf)
13 References
Ariese F, Beyer J, Jonsson G, Porte Visa C, Krahn MM (2005) Review of analytical methods for determining metabolites of polycyclic aromatic compounds (PACs) in fish bile. ICES Techniques in Marine Environmental Sciences No. 39
Baumard P., Budzinski H., Garrigues P. (1998a). PAHs in Arcahon Bay, France: origin and biomonitoring with caged organisms. Marine Pollution Bulletin, 36 (8): 577–586.
Baumard, P., H. Budzinski & P. Garrigues (1998b): Polycyclic aromatic hydrocarbons in sediments and mussels of the western Mediterranean Sea, Environ. Toxicol. Chem. 17:765–776.
HELCOM (2010). Hazardous substances in the Baltic Sea – An integrated thematic assessment of hazardous substances in the Baltic Sea. Balt. Sea Environ. Proc. No. 120B.
HELCOM and Baltic Earth (2021) Climate Change in the Baltic Sea 2021 Fact Sheet. https://helcom.fi/wp-content/uploads/2021/09/Baltic-Sea-Climate-Change-Fact-Sheet-2021.pdf
Kammann U (2007) PAH metabolites in bile fluids of dab (Limanda limanda) and flounder (Platichthys flesus) – spatial distribution and seasonal changes. Environ Sci Pollut Res 14(2): 102–108.
Kammann U, Gercken J (2010) PAK-Metaboliten in Aalmuttern (Zoarces viviparus) aus der Wismar-Bucht. Umweltwiss Schadst Forsch. 22(5): 541–546.
Kennish, M.J. (1997) Practical Handbook of Estuarine and Marine Pollution. Marine Science Series, Boca Raton.
Knutzen J., (1995), Effects on marine organisms from polycyclic aromatic hydrocarbons (PAH) and other constituents of waste water from aluminium smelters with examples from Norway. Sci.Total.Environ., 163: 107–122.
Marquès M, Mari M, Audí-Miró C, Sierra J, Soler A, Nadal M, Domingo JL. Climate change impact on the PAH photodegradation in soils: Characterization and metabolites identification. Environ Int. 2016 Apr-May;89-90:155-65. doi: 10.1016/j.envint.2016.01.019. Epub 2016 Feb 6. PMID: 26859521.
Marston Ch.P., Pereira C., Ferguson J., Fischer K., Hedstrom O., Dashwood W-M., Baird W., (2001), Effect of a complex environmental mixture from coal tar containing polycyclic aromatic hydrocarbons (PAH) on the tumor initiation, PAH_DNA binding and metabolic activation of carcinogenic PAH in mouse epidermis, Carcinogenesis, 22: 1077–1086.
Neff, J.M. (2004): Bioaccumulation in marine organisms. Effect of contaminants from oil well produced water, Elsevier, Amsterdam, London, Tokio, 241–318 pp.
Pikkarainen, A.-L. (2004): Polycyclic aromatic hydrocarbons in Baltic Sea sediments. Polycyclic Aromatic Compounds, 24:667–679.
Sicre, M. A., J.C. Marty & A. Saliot (1987): Aliphatic and aromatic hydrocarbons in different sized aerosols over the Mediterranean Sea: occurrence and origin. Atmosphere and Environment 21:2247–2259.
Swedish EPA, 2009. Swedish Pollutant Release and Transfer Register [online: 2011-01-15].
Vuorinen PJ, Keinänen M, Vuontisjärvi H, Baršienė J, Broeg K, Förlin L, Gercken J, Kopecka J, Köhler A, Parkkonen J, Pempkowiak J, Schiedek D (2006): Use of biliary PAH metabolites as a biomarker of pollution in fish from the Baltic Sea. Mar Pollut Bull 53(8–9):523–537
Webster L., Twigg M., Megginson C., Walsham P., Packer G., Moffat C. (2003). Aliphatic hydrocarbons and polycyclic aromatic hydrocarbons (PAHs) in sediments collected from the 110 mile hole and along a transect from 58o58.32’N 1o10.38’W to the inner Moray Firth, Scotland. Journal of Environmental Monitoring, 5: 395–403.
Yong Yu, Athanasios Katsoyiannis, Pernilla Bohlin-Nizzetto, Eva Brorström-Lundén, Jianmin Ma, Yuan Zhao, Zhiyong Wu, Wlodzimierz Tych, David Mindham, Ed Sverko, Enzo Barresi, Helena Dryfhout-Clark, Phil Fellin, and Hayley Hung. Polycyclic Aromatic Hydrocarbons Not Declining in Arctic Air Despite Global Emission Reduction. Environmental Science & Technology 2019 53 (5), 2375-2382.
Yunker, M.B., R.W. Macdonald, R. Vingarzan, R.H. Mitchell, D. Goyette & S. Sylvestre, (2002): PAHs in the Fraser River basin: a critical appraisal of PAHs ratios as indicators of PAH source and composition. Organic Geochemistry 33:489–515.
14 Other relevant resources
Annex 1 Assessment unit level confidence summary
Confidence is evaluated per assessment unit based on a relative evaluation of following parameters for the copper indicator: 1) spatial component, 2) temporal component, 3) methodological component, and 4) the evaluation component. Despite the common approach applied with other indicators the information set out here is not directly comparable as it only focusses on an evaluation within each indicator (i.e. is relative only between the evaluated assessment units for copper) and it furthermore only addresses the evaluated units. More general information related to overarching confidence and required improvements are detailed in the main report.
The confidence for each component was applies based on a categorical approach using high, moderate and low. To achieve the overall summary confidence a score of 0.25 was applied to low, 0.5 to moderate and 1.0 to high with an average value calculated across the components and the same scores used to then select he final overall category.
Spatial component: Open sea and coastal areas were treated separately due to the scale of sea area being vastly different. The area (km2) for each evaluated assessment unit was divided by the total number of stations in the assessment unit and the resulting area per station was used to divide into three categories, roughly interpreted as stations addressing small, medium or large areas. If a large number (relatively) of stations were still available despite the area being large an increase of 1 category was applied.
Temporal component: The presence of ‘full’ and/or ‘initial’ data series was utilised to evaluate this. Where only a single initial data series/station was present a category of low was applied, where two initial data series were available a category of moderate was applied, where a single full data series was present a category of moderate was applied, and where two or more full data series were present a category of high was applied.
Methodological component: A score of high is applied to all evaluated assessment units since the indicator is evaluated using the MIME tool and applies a regionally agreed methodology and threshold values on national monitoring data.
Evaluation component: The standard error generated within the MIME assessment tool is utilised as a proxy for this component. In simple terms the basis of this evaluation is that standard error can be roughly equated to a coefficient of variance. This therefore provides a general confidence evaluation of the underlying data and variation within it. A categorical approach was applied where standard error values >0.70 were scored as low, 0.4-0.7 were scored as moderate and <0.4 were scored as high.
The confidence is provided for sediments and biota below (Annex 1 – Tables 1-5).
The overall confidence for the OOAO status evaluation is also generated using a OOAO approach from these tables below, suing the overall category.
Annex 1 – Table 1. Summary table showing categorical confidence per component and overall for fluoranthene in biota.
| Assessment Unit | Spatial | Temporal | Methodological | Evaluation | Overall |
| DEN-001 | High | Moderate | High | Low | Moderate |
| DEN-002 | High | High | High | Moderate | Moderate |
| DEN-006 | Moderate | High | High | High | Moderate |
| DEN-016 | High | Low | High | Low | Moderate |
| DEN-024 | Moderate | Low | High | Low | Moderate |
| DEN-029 | High | Moderate | High | Moderate | Moderate |
| DEN-035 | High | High | High | High | High |
| DEN-036 | High | Low | High | Low | Moderate |
| DEN-037 | High | Low | High | Low | Moderate |
| DEN-045 | Moderate | Low | High | Low | Moderate |
| DEN-046 | Low | Low | High | Low | Low |
| DEN-047 | High | Moderate | High | Moderate | Moderate |
| DEN-049 | High | Moderate | High | Low | Moderate |
| DEN-062 | High | Moderate | High | Moderate | Moderate |
| DEN-072 | High | Low | High | Low | Moderate |
| DEN-074 | High | Low | High | Low | Moderate |
| DEN-080 | High | Low | High | Low | Moderate |
| DEN-083 | High | Low | High | Low | Moderate |
| DEN-087 | High | Low | High | Low | Moderate |
| DEN-089 | High | Low | High | Low | Moderate |
| DEN-090 | Moderate | Moderate | High | High | Moderate |
| DEN-092 | High | Moderate | High | Moderate | Moderate |
| DEN-096 | Moderate | Moderate | High | Moderate | Moderate |
| DEN-102 | High | Low | High | Low | Moderate |
| DEN-104 | High | Moderate | High | High | Moderate |
| DEN-105 | High | High | High | High | High |
| DEN-106 | High | Low | High | Low | Moderate |
| DEN-109 | High | Moderate | High | Low | Moderate |
| DEN-110 | High | Low | High | Low | Moderate |
| DEN-113 | High | Moderate | High | Moderate | Moderate |
| DEN-114 | Moderate | Moderate | High | Low | Moderate |
| DEN-122 | High | High | High | High | High |
| DEN-123 | High | High | High | Low | Moderate |
| DEN-124 | High | High | High | Moderate | Moderate |
| DEN-125 | High | Low | High | Low | Moderate |
| DEN-127 | High | Moderate | High | Low | Moderate |
| DEN-128 | High | High | High | High | High |
| DEN-137 | High | High | High | Moderate | Moderate |
| DEN-138 | Moderate | Low | High | Low | Moderate |
| DEN-139 | Moderate | Moderate | High | High | Moderate |
| DEN-140 | Moderate | Low | High | Low | Moderate |
| DEN-141 | High | Low | High | Low | Moderate |
| DEN-142 | High | Low | High | Low | Moderate |
| DEN-145 | High | Low | High | Low | Moderate |
| DEN-146 | High | Low | High | Low | Moderate |
| DEN-147 | Moderate | High | High | High | Moderate |
| DEN-154 | Low | Low | High | Low | Low |
| DEN-157 | Moderate | High | High | High | Moderate |
| DEN-159 | High | Moderate | High | Moderate | Moderate |
| DEN-160 | High | Low | High | Low | Moderate |
| DEN-200 | Moderate | High | High | High | Moderate |
| DEN-201 | Moderate | High | High | High | Moderate |
| DEN-204 | Moderate | High | High | High | Moderate |
| DEN-206 | Low | High | High | High | Moderate |
| DEN-209 | Moderate | High | High | High | Moderate |
| DEN-212 | High | High | High | High | High |
| DEN-214 | Moderate | High | High | High | Moderate |
| DEN-216 | Moderate | High | High | Moderate | Moderate |
| DEN-217 | Moderate | Moderate | High | Low | Moderate |
| DEN-219 | Moderate | Moderate | High | Moderate | Moderate |
| DEN-222 | Low | High | High | High | Moderate |
| DEN-224 | Moderate | Low | High | Low | Moderate |
| DEN-225 | Moderate | High | High | High | Moderate |
| DEN-231 | High | Moderate | High | High | Moderate |
| DEN-232 | Moderate | Moderate | High | Low | Moderate |
| DEN-233 | Moderate | Moderate | High | High | Moderate |
| DEN-234 | Moderate | Moderate | High | Low | Moderate |
| DEN-235 | Moderate | High | High | High | Moderate |
| DEN-236 | Moderate | Moderate | High | Low | Moderate |
| DEN-238 | High | Low | High | Low | Moderate |
| GER-002 | High | Moderate | High | High | Moderate |
| GER-004 | Moderate | Moderate | High | High | Moderate |
| GER-005 | High | Moderate | High | High | Moderate |
| GER-010 | Moderate | Moderate | High | High | Moderate |
| GER-023 | High | Low | High | Low | Moderate |
| POL-006 | Low | Moderate | High | Low | Low |
| POL-015 | High | Moderate | High | Low | Moderate |
| SWE-003 | Low | Moderate | High | Moderate | Moderate |
| SWE-012 | Low | Moderate | High | Moderate | Moderate |
| SEA-002 | Moderate | Moderate | High | Moderate | Moderate |
| SEA-003 | High | Moderate | High | Moderate | Moderate |
| SEA-005 | Moderate | Moderate | High | High | Moderate |
| SEA-006 | Moderate | High | High | High | Moderate |
| SEA-007 | Low | Moderate | High | High | Moderate |
Annex 1 – Table 2. Summary table showing categorical confidence per component and overall for benzo(a)pyrene in biota.
| Assessment Unit | Spatial | Temporal | Methodological | Evaluation | Overall |
| DEN-001 | High | High | High | Moderate | Moderate |
| DEN-002 | High | Moderate | High | Moderate | Moderate |
| DEN-006 | High | High | High | High | High |
| DEN-016 | High | Low | High | Low | Moderate |
| DEN-024 | Moderate | Low | High | Low | Moderate |
| DEN-025 | High | Moderate | High | High | Moderate |
| DEN-029 | High | Moderate | High | Moderate | Moderate |
| DEN-035 | High | High | High | High | High |
| DEN-036 | High | Low | High | Low | Moderate |
| DEN-037 | High | Low | High | Low | Moderate |
| DEN-045 | Moderate | Low | High | Low | Moderate |
| DEN-046 | Low | Low | High | Low | Low |
| DEN-047 | High | Moderate | High | Low | Moderate |
| DEN-049 | High | Moderate | High | Low | Moderate |
| DEN-062 | High | Moderate | High | Moderate | Moderate |
| DEN-072 | High | Low | High | Low | Moderate |
| DEN-074 | High | Low | High | Low | Moderate |
| DEN-080 | High | Low | High | Low | Moderate |
| DEN-083 | High | Low | High | Low | Moderate |
| DEN-087 | High | Low | High | Low | Moderate |
| DEN-089 | High | Low | High | Low | Moderate |
| DEN-090 | Moderate | Moderate | High | High | Moderate |
| DEN-092 | High | Moderate | High | Moderate | Moderate |
| DEN-096 | High | Moderate | High | Moderate | Moderate |
| DEN-102 | High | Low | High | Low | Moderate |
| DEN-104 | High | Moderate | High | Moderate | Moderate |
| DEN-105 | High | High | High | High | High |
| DEN-106 | High | Low | High | Low | Moderate |
| DEN-109 | High | Moderate | High | Low | Moderate |
| DEN-110 | High | Low | High | Low | Moderate |
| DEN-113 | High | Moderate | High | High | Moderate |
| DEN-114 | High | Moderate | High | Low | Moderate |
| DEN-122 | High | Moderate | High | High | Moderate |
| DEN-123 | High | Moderate | High | High | Moderate |
| DEN-124 | High | High | High | High | High |
| DEN-125 | High | Low | High | Low | Moderate |
| DEN-127 | High | Moderate | High | Low | Moderate |
| DEN-128 | High | High | High | Moderate | Moderate |
| DEN-137 | High | Moderate | High | Moderate | Moderate |
| DEN-138 | Low | Low | High | Low | Low |
| DEN-139 | Moderate | Low | High | Low | Moderate |
| DEN-140 | Moderate | Low | High | Low | Moderate |
| DEN-141 | High | Low | High | Low | Moderate |
| DEN-142 | High | Low | High | Low | Moderate |
| DEN-145 | High | Low | High | Low | Moderate |
| DEN-146 | High | Low | High | Low | Moderate |
| DEN-147 | Moderate | High | High | High | Moderate |
| DEN-154 | Low | Low | High | Low | Low |
| DEN-157 | High | High | High | High | High |
| DEN-159 | High | Moderate | High | Moderate | Moderate |
| DEN-160 | High | Low | High | Low | Moderate |
| DEN-200 | High | High | High | High | High |
| DEN-201 | High | High | High | High | High |
| DEN-204 | High | High | High | High | High |
| DEN-206 | Low | High | High | High | Moderate |
| DEN-209 | High | Moderate | High | Moderate | Moderate |
| DEN-212 | High | High | High | High | High |
| DEN-214 | Moderate | High | High | High | Moderate |
| DEN-216 | Moderate | Moderate | High | Moderate | Moderate |
| DEN-217 | Moderate | Moderate | High | Low | Moderate |
| DEN-219 | Moderate | Moderate | High | Moderate | Moderate |
| DEN-222 | Low | High | High | High | Moderate |
| DEN-224 | Moderate | Low | High | Low | Moderate |
| DEN-225 | Moderate | High | High | High | Moderate |
| DEN-231 | High | Moderate | High | High | Moderate |
| DEN-232 | Moderate | Moderate | High | Low | Moderate |
| DEN-233 | Moderate | Moderate | High | High | Moderate |
| DEN-234 | Moderate | Moderate | High | High | Moderate |
| DEN-235 | High | High | High | High | High |
| DEN-236 | High | Moderate | High | Low | Moderate |
| DEN-238 | High | Low | High | Low | Moderate |
| GER-002 | High | Moderate | High | Moderate | Moderate |
| GER-004 | Moderate | Low | High | Low | Moderate |
| GER-005 | High | Moderate | High | Moderate | Moderate |
| GER-010 | Moderate | Low | High | Moderate | Moderate |
| GER-023 | High | Low | High | Low | Moderate |
| POL-006 | Low | Moderate | High | Low | Moderate |
| POL-015 | High | Moderate | High | High | Moderate |
| SWE-003 | Low | Moderate | High | Moderate | Moderate |
| SWE-012 | Low | Moderate | High | High | Moderate |
| SEA-002 | High | Moderate | High | Moderate | Moderate |
| SEA-003 | High | Moderate | High | High | Moderate |
| SEA-005 | Moderate | Moderate | High | Moderate | Moderate |
| SEA-006 | High | High | High | High | High |
| SEA-007 | Low | Moderate | High | High | Moderate |
Annex 1 – Table 3. Summary table showing categorical confidence per component and overall for anthracene in sediment.
| Assessment Unit | Spatial | Temporal | Methodological | Evaluation | Overall |
| DEN-024 | High | Low | High | Low | Moderate |
| DEN-034 | High | Low | High | Low | Moderate |
| DEN-045 | High | Low | High | Low | Moderate |
| DEN-085 | High | Low | High | Low | Moderate |
| DEN-092 | High | Low | High | Low | Moderate |
| DEN-113 | High | Low | High | Modertae | Moderate |
| DEN-128 | High | Low | High | Low | Moderate |
| DEN-136 | High | Low | High | Low | Moderate |
| DEN-137 | High | Low | High | Low | Moderate |
| DEN-142 | High | Low | High | Low | Moderate |
| EST-003 | High | Modertae | High | Modertae | Moderate |
| EST-011 | Modertae | Low | High | Low | Moderate |
| EST-016 | Modertae | Low | High | Low | Moderate |
| FIN-004 | Low | Low | High | Modertae | Moderate |
| GER-026A | High | Low | High | Modertae | Moderate |
| GER-026B | High | Low | High | Modertae | Moderate |
| GER-029 | High | Low | High | Modertae | Moderate |
| GER-031 | High | Low | High | Modertae | Moderate |
| GER-032 | High | Low | High | Modertae | Moderate |
| POL-005 | High | Modertae | High | Modertae | Moderate |
| SEA-001 | Low | Modertae | High | Modertae | Moderate |
| SEA-004 | High | High | High | Modertae | Moderate |
| SEA-005 | High | High | High | High | High |
| SEA-006 | Modertae | High | High | High | Moderate |
| SEA-007 | Low | High | High | High | Moderate |
| SEA-008 | High | Modertae | High | Modertae | Moderate |
| SEA-009 | Low | High | High | High | Moderate |
| SEA-010 | Modertae | High | High | High | Moderate |
| SEA-012 | Low | Modertae | High | Modertae | Moderate |
| SEA-013 | Modertae | Modertae | High | Modertae | Moderate |
| SEA-014 | High | Modertae | High | Modertae | Moderate |
| SEA-015 | Modertae | High | High | High | Moderate |
| SEA-017 | Low | High | High | High | Moderate |
Annex 1 – Table 4. Summary table showing categorical confidence per component and overall for fluoranthene in sediment.
| Assessment Unit | Spatial | Temporal | Methodological | Evaluation | Overall |
| DEN-024 | Moderate | Low | High | Low | Moderate |
| DEN-034 | Moderate | Low | High | Low | Moderate |
| DEN-045 | Moderate | Low | High | Low | Moderate |
| DEN-085 | High | Low | High | Low | Moderate |
| DEN-092 | High | Low | High | Low | Moderate |
| DEN-113 | High | Low | High | Low | Moderate |
| DEN-128 | High | Low | High | Low | Moderate |
| DEN-136 | High | Low | High | Low | Moderate |
| DEN-137 | High | Low | High | Low | Moderate |
| DEN-142 | High | Low | High | Low | Moderate |
| EST-003 | Moderate | Moderate | High | Low | Moderate |
| EST-011 | Moderate | Low | High | Low | Moderate |
| EST-016 | Moderate | Low | High | Low | Moderate |
| FIN-004 | Low | Low | High | Low | Low |
| GER-026A | High | Low | High | Low | Moderate |
| GER-026B | High | Low | High | Low | Moderate |
| GER-029 | High | Low | High | Low | Moderate |
| GER-031 | High | Low | High | Low | Moderate |
| GER-032 | High | Low | High | Low | Moderate |
| POL-002 | Moderate | Moderate | High | Low | Moderate |
| POL-003 | Moderate | Moderate | High | Low | Moderate |
| POL-005 | High | Moderate | High | Moderate | Moderate |
| SEA-001 | Low | Moderate | High | High | Moderate |
| SEA-004 | High | High | High | Moderate | Moderate |
| SEA-005 | High | High | High | High | High |
| SEA-006 | Moderate | High | High | High | Moderate |
| SEA-007 | Moderate | High | High | High | Moderate |
| SEA-008 | High | High | High | Moderate | Moderate |
| SEA-009 | Moderate | High | High | High | Moderate |
| SEA-010 | Moderate | High | High | High | Moderate |
| SEA-012 | Low | Moderate | High | Moderate | Moderate |
| SEA-013 | Moderate | Moderate | High | Moderate | Moderate |
| SEA-014 | High | Moderate | High | Moderate | Moderate |
| SEA-015 | Moderate | High | High | High | Moderate |
| SEA-017 | Low | High | High | High | Moderate |
Annex 1 – Table 5. Summary table showing categorical confidence per component and overall for PAH metabolites in biota.
| Assessment Unit | Spatial | Temporal | Methodological | Evaluation | Overall |
| POL-002 | Moderate | Moderate | High | Low | Moderate |
| POL-003 | Moderate | Moderate | High | Low | Moderate |
| POL-019 | High | Low | High | Low | Moderate |
| SEA-004 | High | High | High | Low | Moderate |
| SEA-005 | Moderate | Moderate | High | Low | Moderate |
| SEA-006 | High | High | High | Low | Moderate |
| SEA-007 | Moderate | High | High | Moderate | Moderate |
| SEA-008 | Moderate | Moderate | High | Low | Moderate |
| SEA-009 | Moderate | High | High | Low | Moderate |