 PBDEs
PBDEs
2 Relevance of the indicator
Polybrominated diphenyl ethers (PBDEs) are toxic and persistent substances that bioaccumulate in the marine food web. Increasing concentrations of PBDEs were detected in the environment in past decades as their use as commercial flame retardants increased. The use of most PBDE products has been banned in Europe and as a result decreasing concentrations are detected for some of the PBDE congeners.
2.1 Ecological relevance
General properties
PBDEs are hydrophobic or very hydrophobic substances, that are very likely to adsorb to particulate matter and not likely to volatilize from the water phase. Smaller PBDEs molecules are more toxic and bioaccumulative than larger ones. The biotic and abiotic debromination of highly brominated PBDEs, such as decaBDE, to these smaller forms is a possibility and justifies that monitoring is based on a broad set of congeners. The higher the degree of bromination, the lower the water solubility. Therefore, decaBDE is found only in low concentrations in fish, in contrast to lower-brominated PBDEs, which are more commonly found in marine organisms. PBDEs have the potential to photodegrade in the environment. According to EU-RAR (2000), concentrations increased with the age of the fish and were higher in seals than in fish in the Baltic Sea, indicating bioaccumulation and biomagnification.
The occurrence of PBDEs is widespread in the Baltic marine environment. It is probable that early legislative measures for penta- and octaBDE (banned in the EU since 2004) have already decreased levels in the Baltic Sea. DecaBDE (BDE 209) is the dominant congener from sources (e.g. WWTPs) and in the Baltic Sea sediments; it can also be found in Baltic Sea fish, although tetraBDE is the most dominant congener in biota. Because of the environmental problems of decaBDE and regulatory measures (listed under the Stockholm Convention in 2017), releases of decaBDE have been reduced. This is expected to lead – over time – to decreasing concentrations.
Main impacts on the environment and human health
PBDEs are categorized as endocrine disrupters (Category 2) for animals and humans. This means that the substances have the potential to disrupt endocrine functions, such as hormone regulation in the organisms. PBDEs have been shown to have endocrine-disrupting effects, in particular, on estrogen and thyroid hormone levels and functioning. They have further been shown to disturb development of the nervous system.
2.2 Policy relevance
The polybrominated diphenyl ethers (PBDEs) have mainly been used as flame retardants in plastic materials and polyurethane foams. PBDEs are diphenyl ethers with different degrees of bromination varying from 2 to 10. In total PBDEs have 209 different congeners. PentaBDEs refer to the congeners 82–127, 47 and 99 being the most abundant, octaBDEs refer to the congeners 194–205 and decaBDEs mainly refers to the congener 209.
PBDEs are on the HELCOM BSAP (Baltic Sea Action Plan) priority list and in the Stockholm Convention Annex A (Elimination). The use of substance groups pentaBDE and octaBDE is banned in the EU since 2004 (Commission regulation EC 552/2009). PentaBDE and octaBDE are not allowed to be placed on the market as substances, in mixtures or in articles in higher concentration than 0.1 % by weight. PentaBDE is included in Annex A (Elimination) in the Stockholm Convention and should no longer be on the EU market as well as hexaBDE and heptaBDE contained in octaBDE.
In 2017, DecaBDE was added in Annex A of Stockholm Convention with specific exemptions. The substance group decaBDE that is restricted but not completely banned, is currently found in biota and is able to degrade into lower brominated congeners. The European Food Safety Authority (EFSA) has encouraged countries to monitor decaBDE.
The use of PBDEs in electrical and electronic products (E&Es) was restricted even earlier than 2004 by the Directive 2002/95/EC (RoHS). Since 2008 this directive also covers decaBDE. This implies that the only permitted use of PBDEs in Europe is now the application of decaBDE in products other than E&Es. As a result of this new regulation, the majority of the previous use of decaBDE in the EU is now prohibited (corresponding to ca 80 percent of the total EU use in 2001). It is, however, still possible for industries to apply for exemptions for certain applications under the procedure laid out in article 5 of the RoHS Directive.
The substance groups pentaBDE and octaBDE have been prioritised through two consecutive prioritisation procedures under the WFD. PentaBDE was prioritised following COMMPS (Combined Monitoring-based and Modelling-based Priority Setting scheme) procedure in 2001, while octaBDE was prioritised in the context of the second European Commission proposal for a new list of priority substances, for the reason that they are PBT (Persistent, Bioaccumulative and Toxic) and vPvB (very Persistent and very Bioaccumulative) substances.
Although there is no production within the European Union, existing stocks of PBDE-containing products may still act as a diffuse source.
Table 1. Overview of key policy relevance elements.
| Baltic Sea Action Plan (BSAP) | Marine Strategy Framework Directive (MSFD) | |
| Fundamental link | Segment: Hazardous substances and litter goal
Goal: “Baltic Sea unaffected by hazardous substances and litter”
|
Descriptor 8 Concentrations of contaminants are at levels not giving rise to pollution effects.
|
| Complementary link | Segment: Biodiversity
Goal: “Baltic Sea ecosystem is healthy and resilient”
|
Descriptor 9 Contaminants in fish and other seafood for human consumption do not exceed levels established by Union legislation or other relevant standards.
(a) for contaminants listed in Regulation (EC) No 1881/2006, the maximum levels laid down in that Regulation, which are the threshold values for the purposes of this Decision; (b) for additional contaminants, not listed in Regulation (EC) No 1881/2006, threshold values, which Member States shall establish through
|
| Other relevant legislation: |
|
|
2.3 Relevance for other assessments
The status of hazardous substances is assessed using several core indicators. Each indicator focuses on one important aspect of the complex issue. In addition to providing an indicator-based evaluation of the concentration of polybrominated diphenyl ethers (PBDEs), this indicator will also contribute to the overall hazardous substances assessment along with the other hazardous substances core indicators. This indicator along with the other hazardous substances core indicators is used to develop an overall assessment of contamination status by inclusion in the integrated assessment of hazardous substances.
3 Threshold values
Good Environmental Status is determined when the concentrations of PBDEs are below the agreed threshold value (Table 2), as visualised in figure 1.
The threshold value applied for PBDEs is 0.0085 µg/kg fish wet weight (ww). The threshold value is an Environmental Quality Standard (EQS) for biota, where human health is considered the most critical end point for PBDEs and the EQS therefore defined for edible parts of fish. The threshold value represents a sum of PBDE congeners 28, 47, 99, 100, 153 and 154, with main contribution from penta- and octa-BDE while decaBDE is not included.
Good Environmental Status (GES), defined in accordance with the Marine Strategy Framework Directive 2008/56/EC (MSFD), is “concentrations of contaminants at levels not giving rise to pollution effects” (OJEC No. L164 25.6.2008, 2008). PBDEs are included on the priority list under the Water Framework Directive (2000/60/EC) under which the Quality Standards (QSs) have been developed. All QS are based on ecotoxicological studies and derived to protect freshwater and marine ecosystems from potential adverse effects of chemicals, as well as adverse effects on human health via drinking water and food from aquatic environments. QSs are derived for different protection goals. The most stringent of the QSs for the different protection goals is the base for the EQS (2013/39/EU).
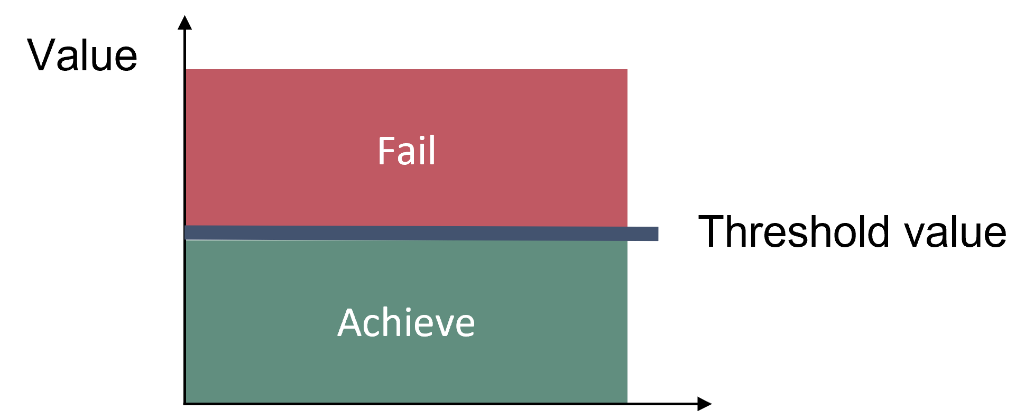
Figure 2. Schematic representation of the threshold value which indicates good status if the concentration is below the threshold value. The threshold value is EQS biota human health 0.0085 µg/kg fish wet weight (ww).
Table 2. Threshold value for the core indicator ‘PBDE. Underlined supporting parameters represent parameters without which the indicator evaluation cannot be applied. W = wet weight, MU = fillet, LI = liver, EP = epidermis, CORG = Organic Carbon, Al = Aluminium, Li = Lithium. Source for threshold value: PBDE EQS dossier 2011.pdf – CIRCABC – Europa EU.
| Indicator | Threshold value | Parameters (PARAM) / Parameter groups (PARGROUP)
(see also http://vocab.ices.dk/) |
Matrix | Species | Matrix | Basis | Supporting parameters and information |
| PBDEs | Primary threshold
EQS biota human health 0.0085 μg/kg ww 5% lipid content |
PARAM = BD28, BD47, BD99, BD100, BD153, BD154 | Biota | Herring & cod (open sea)
Flounder, sole, eelpout & Perch (coastal) |
MU, MU&EP, (‘fillet’), LI or whole fish | W | Lipid content |
| Secondary threshold:
Sediment QS from EQS dossier 310 µg/ kg dw benthic community protective 5% CORG normalisation |
Sediment
(surface, ICES ’upper sediment layer – 0-X cm’) |
All | CORG
Al Li Grain size |
3.1 Setting the threshold value(s)
In the case of the PBDEs, the EQS is based on the value derived for human health. The EQS is used as a threshold value although it has been noted that it is very low and the European Food Safety Authority (EFSA) has not endorsed it. Thus, it is unclear if the value is in accordance with the food safety risk assessments.
The EC Guidance Document No. 32 on biota monitoring (the implementation of EQSbiota) under the Water Framework Directive (European Commission 2014) was derived for harmonization purposes. This guidance document recommends that for lipid soluble, biomagnifying compounds such as PBDEs the fish assessed for EQS compliance should be at a trophic level of 4.5 for marine environments with a whole body lipid content of 5%. For practical reasons, the guidance opens up for adjustments of results from ongoing monitoring to meet this standard by the use of trophic magnification factors and trophic level. The EU directive on Environmental Quality Standards (2008/105/EC), Article 3, states that also long-term temporal trends should be assessed for substances that accumulate in sediment and/or biota.
In cases where it is not possible to evaluate the environmental status using biota-monitoring, a secondary threshold value based on concentration in sediment can be used as a complement. The threshold value for sediment is 310 µg kg-1 dry weight (dw). This value has been suggested by the working group on priority substances for the protection of the benthic community.
4 Results and discussion
The results of the indicator evaluation that underlie the key message map and information are provided below.
4.1 Status evaluation
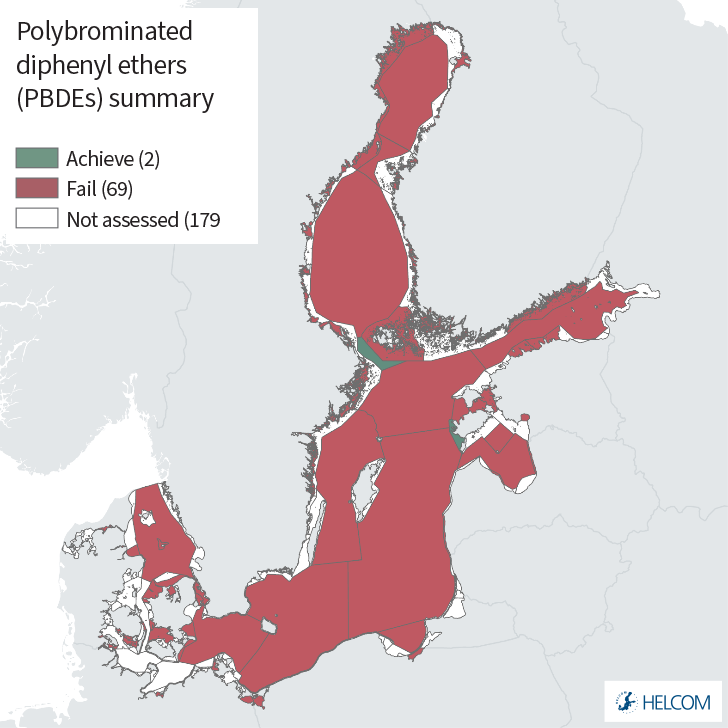
The data presented in this core indicator report were extracted from the HELCOM COMBINE data base, a compilation of data from the monitoring activities reported by all Baltic Sea countries. The report presents information on the current levels of PBDE in biota (fish) and sediment. Overall, the status of polybrominated diphenyl ethers (PBDEs) fail the EQS threshold value in all but two evaluated assessment units (Figure 1). Data is available across a wide spatial area and shows that the concentrations of PBDEs are above the threshold value in biota throughout the Baltic Sea.
PBDEs in biota
Good Environmental Status (GES) is achieved when concentrations of PBDEs are below the agreed threshold value. An evaluation was possible for 69 assessment units, of which 13 were open sea HELCOM sub-basins. All evaluated assessment units failed to achieved the threshold value (i.e. were sub-GES) (Figure 3).
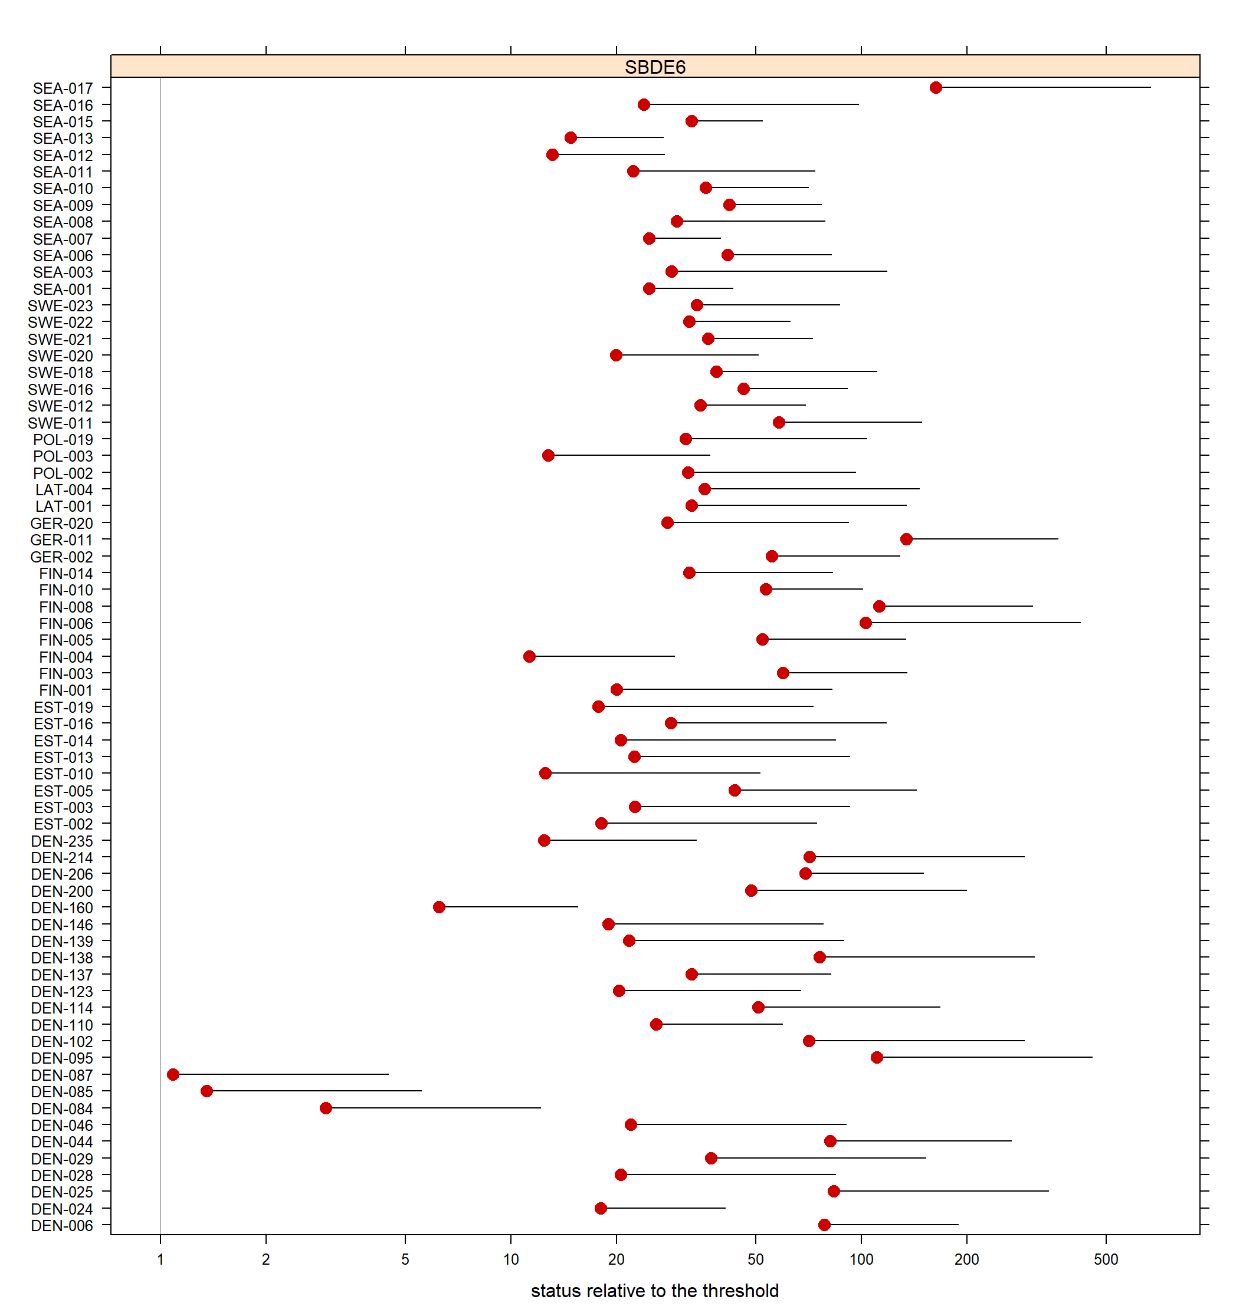
Figure 3. Overview of HELCOM Level 4 assessment units evaluated for PBDEs in biota. The 95% confidence limit on the mean concentration is presented. The threshold value is exceeded in all evaluated assessment units.
The assessment unit level evaluation is built on monitoring at 108 stations, of which circa 28 represent ‘full’ data series (i.e. more than 3 years of data for the period; see methodology) to which distinct trends could be assigned statistically. Five of these stations showed downward trends (e.g. decreasing concentrations of PBDEs). These stations were located in the following sub-basins, the Bornholm Basin, Northern Baltic Proper, The Quark, Eastern Gotland Basin and the Bothnian Bay. The other 23 stations with ‘full’ data series showed no distinct trends. Thus, no stations indicated increasing concentrations. The remaining stations represented ‘initial’ data sets (Figure 4).
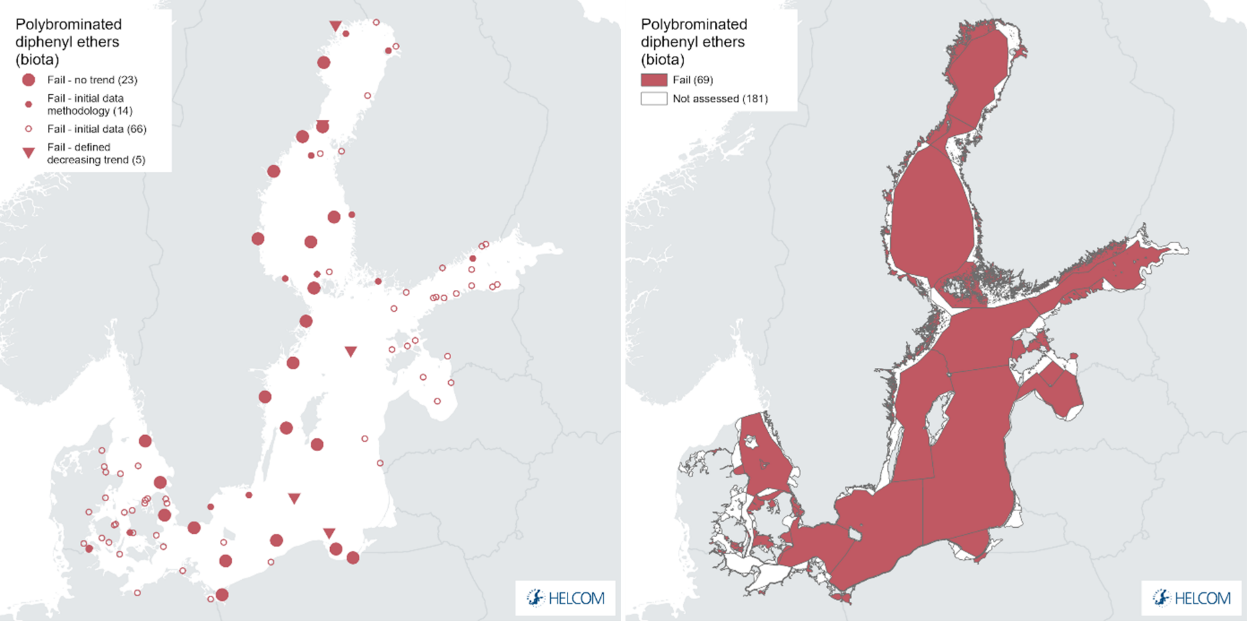
Figure 4. PBDE biota measurements per station in the Baltic Sea (left) and resulting status evaluation (right). Red colour indicates that the upper 95 % confidence interval for PBDE concentrations are above the threshold value. Small open circles indicate a status evaluation based on only 1-2 years of data, small filled circles indicate that there is not enough data to assess a statistical trend, large filled symbols indicate statistical trends assigned with circles indicating no detectable trend in concentration during the whole monitoring period and the filled arrows indicating significant upward or downward trend in concentration during the monitoring period. See ‘data chapter’ for interactive maps and data at the HELCOM Map and Data Service.
At some stations, for example along the Swedish, German and Polish coastlines long term time series are available, whereas other areas such as the Gulf of Finland, Gulf of Riga, Belt Sea and Kattegat are dominated by stations evaluated as ‘initial’ data series. Examples of different trend patterns at the station level (station time series) are presented in Figure 5 to show the difference between ‘full’ and ‘initial’ data series.
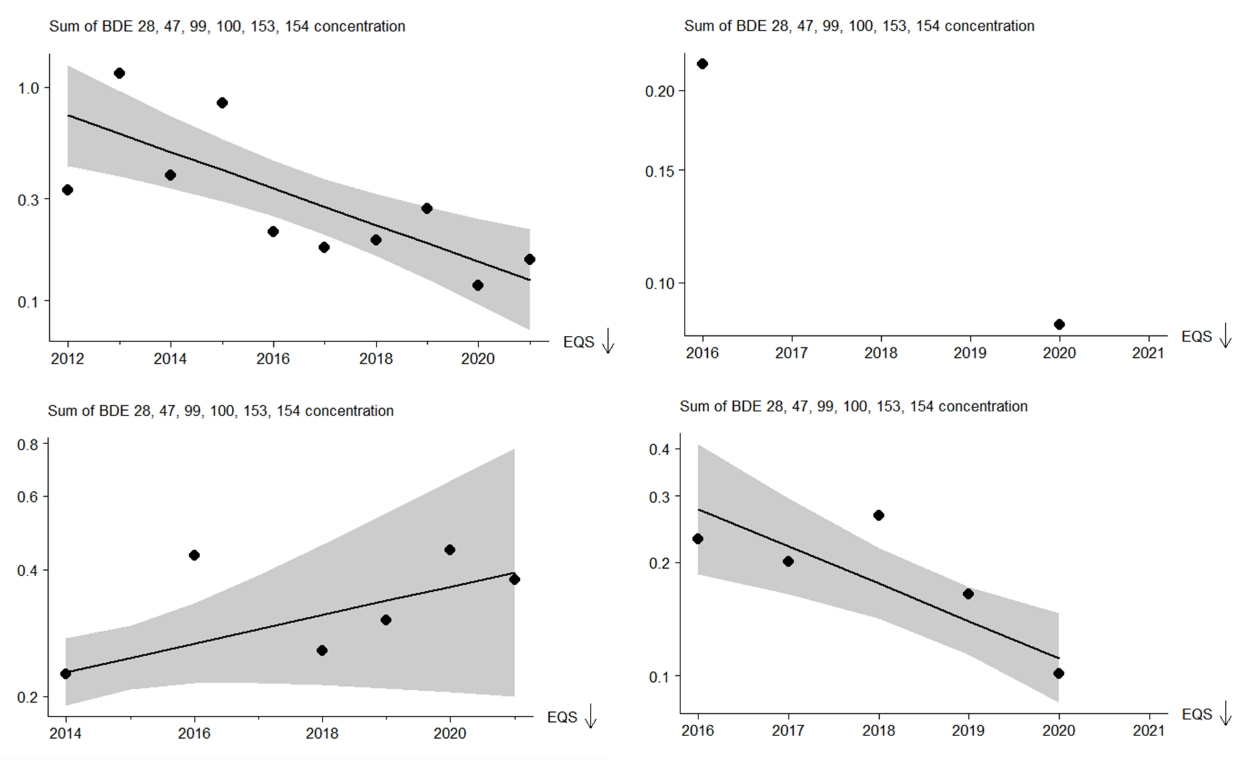
Figure 5. Examples of PBDE concentration in biota at two stations in the Eastern Gotland basin and Gulf of Finland, respectively, selected for illustrative purposes, showing a station with full evaluation possible (top left, Eastern Gotland Basin, downward pointing red triangle showing a distinct decreasing trend), an initial status evaluation data (top right, Gulf of Finland), a station with a ‘full’ data but no distinct trend (bottom left, Bothnian Sea, large red circle), and a station with full evaluation possible (bottom right, Northern Baltic Proper, downward pointing red triangle showing a distinct decreasing trend).
The threshold value of 0.0085 µg/kg ww defined by the Environmental Quality Standard (EQS) is exceeded everywhere, but there are regional/local differences in concentration.
Mean values for the monitoring stations range from 0.009 to 1.9736 µg/kg ww in fish. However, the PBDE levels in a single, widespread species, e.g. herring seems to vary less throughout the Baltic Sea than for other substances such as for example PCBs. Generally, PBDEs show higher concentrations in herring muscle in the Baltic compared to the Kattegat close to the North Sea (Soerensen and Faxneld 2022).
Some monitoring gaps exist across the Baltic region. For example in the Gulf of Finland and Gulf of Riga, the monitoring period is too short to evaluate the levels with high confidence (assigned to ‘initial’ data series).
PBDEs in sediment
Good Environmental Status (GES) is achieved when concentrations of PBDEs are below the threshold value. The threshold value for sediment is 310 µg kg-1 dry weight (dw). It should be noted, that this threshold value does not have the problems associated with the biota threshold value and is comparatively high. For sediments, an evaluation was possible for 12 assessment units, of which 9 were open sea HELCOM sub-basins. All evaluated assessment units were below the threshold value (i.e. they showed GES) (Figure 6).
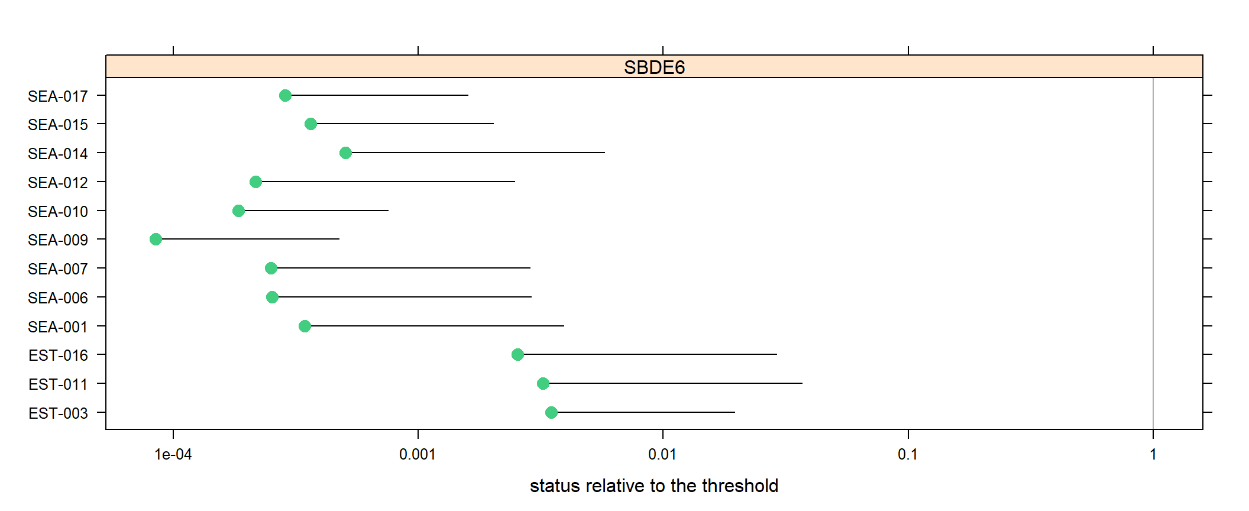
Figure 6. Overview of HELCOM Level 4 assessment units evaluated for PBDEs in sediment. The 95% confidence limit on the mean concentration is presented. The threshold value is exceeded in all evaluated assessment units.
The assessment unit level evaluation is built on monitoring at 18 stations, of which all are evaluated as ‘initial’ data series. This is in part due to the low monitoring frequency of sediment sampling. Consequently, no trends could be assigned to the stations (Figure 7).
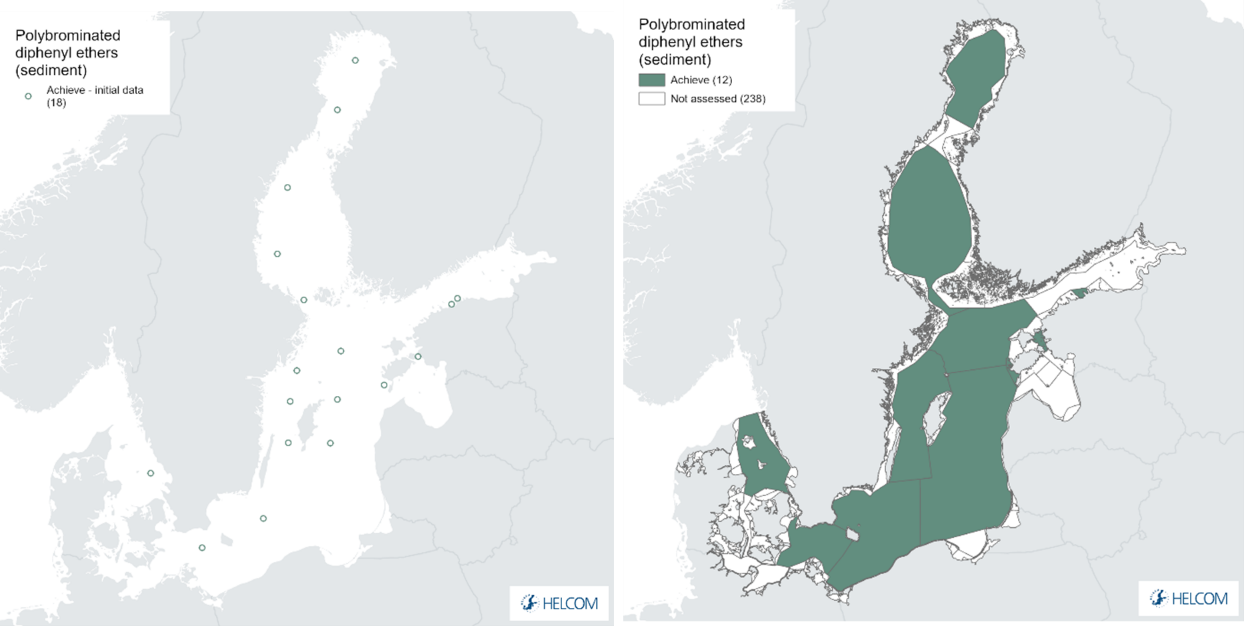
Figure 7. Station level evaluation (left) and status evaluation results at the assessment unit level (right) based on the evaluation of the indicator Polybrominated diphenyl ethers (PBDEs) in sediments. Green colour indicates that the upper 95 % confidence interval for PBDE concentrations are below the threshold value. Small open circles indicate a status evaluation based on only 1-2 years of data. The evaluation is carried out using Scale 4 HELCOM assessment units (defined in the HELCOM Monitoring and Assessment Strategy Annex 4). See ‘data chapter’ for interactive maps and data at the HELCOM Map and Data Service.
4.2 Trends
Examples of key trends at selected stations are provided above (Figure 5). A number of stations are evaluated as ‘initial’ data series due to limitations in the length or quality of the time series available (small symbols on maps). Increased temporal monitoring of these would provide stronger analytical potential in future evaluations. However, identification of statistical trends is viable and a small number of decreasing trends (i.e. concentrations becoming lower) have been identified. Concentrations of several PBDEs in the marine environment are declining (Soerensen and Faxneld 2022). Concentrations of PBDE show decreasing trend in herring muscle from 5 monitoring stations in the Baltic Sea (Figure 4), but in coastal areas the trend is less clear.
4.3 Discussion
PBDEs are known to have toxic effects, accumulate in biota and persist in the marine environment. All assessment units evaluated for biota fail to achieve the threshold value and are sub-GES, thus only one assessment unit achieve GES and this is a case when only sediment is analyzed. The threshold value for biota is considered to be very precautionary and is due for review by the EU Chemicals Working Group, but is applied in this evaluation in its currently agreed from.
An overview of the outcomes for the open sea sub-basins is provided below (Table 3).
Table 3. Overview of evaluation outcomes and comparison with previous evaluation (using the OOAO evaluation outcomes per assessment unit). Currently this approach is only applied for open sea assessment units.
| HELCOM Assessment unit name (and ID) | Threshold value achieved/failed – HOLAS II | Threshold value achieved/failed – HOLAS 3 | Distinct trend between current and previous evaluation. | Description of outcomes, if pertinent. |
| Kattegat (SEA-001) | Failed | Failed | No change between assessment periods. | The assessment unit is sub-GES. Failure of the threshold value for biota drives the assessment. |
| The Sound (SEA-003) | Failed | Failed | No change between assessment periods. | The assessment unit is sub-GES. Failure of the threshold value for biota drives the assessment. |
| Kiel Bay (SEA-004) | Failed | Not evaluated | No suitable data were available for the current assessment period. | NA |
| Bay of Mecklenburg (SEA-005) | Failed | Not evaluated | No suitable data were available for the current assessment period. | NA |
| Arkona Basin (SEA-006) | Failed | Failed | No change between assessment periods. | The assessment unit is sub-GES. Failure of the threshold value for biota drives the assessment. |
| Bornholm Basin (SEA-007) | Failed | Failed | No change between assessment periods. | The assessment unit is sub-GES. Failure of the threshold value for biota drives the assessment. |
| Gdansk Basin (SEA-008) | Failed | Failed | No change between assessment periods. | The assessment unit is sub-GES. Failure of the threshold value for biota drives the assessment. |
| Eastern Gotland Basin (SEA-009) | Failed | Failed | No change between assessment periods. | The assessment unit is sub-GES. Failure of the threshold value for biota drives the assessment. |
| Western Gotland Basin (SEA-010) | Failed | Failed | No change between assessment periods. | The assessment unit is sub-GES. Failure of the threshold value for biota drives the assessment. |
| Gulf of Riga (SEA-011) | Not evaluated | Failed | The availability of new data has facilitated an evaluation for this assessment period. | The assessment unit is sub-GES. Failure of the threshold value for biota drives the assessment. |
| Northern Baltic Proper (SEA-012) | Failed | Failed | No change between assessment periods. | The assessment unit is sub-GES. Failure of the threshold value for biota drives the assessment. |
| Gulf of Finland (SEA-013) | Failed | Failed | No change between assessment periods. | The assessment unit is sub-GES. Failure of the threshold value for biota drives the assessment. |
| Åland Sea (SEA-014 ) | Achieved | Achieved | No change between assessment periods. | The assessment unit is in GES. The evaluation is based only on data from the sediment matrix. |
| Bothnian Sea (SEA-015) | Failed | Failed | No change between assessment periods. | The assessment unit is sub-GES. Failure of the threshold value for biota drives the assessment. |
| The Quark (SEA-016) | Failed | Failed | No change between assessment periods. | The assessment unit is sub-GES. Failure of the threshold value for biota drives the assessment. |
| Bothnian Bay (SEA-017) | Failed | Failed | No change between assessment periods. | The assessment unit is sub-GES. Failure of the threshold value for biota drives the assessment. |
5 Confidence
The overall confidence of the evaluation is moderate, with a few (4) occurrences of low confidence and a single high confidence evaluation in certain assessment units (Figure 8 and further details in Annex 1).
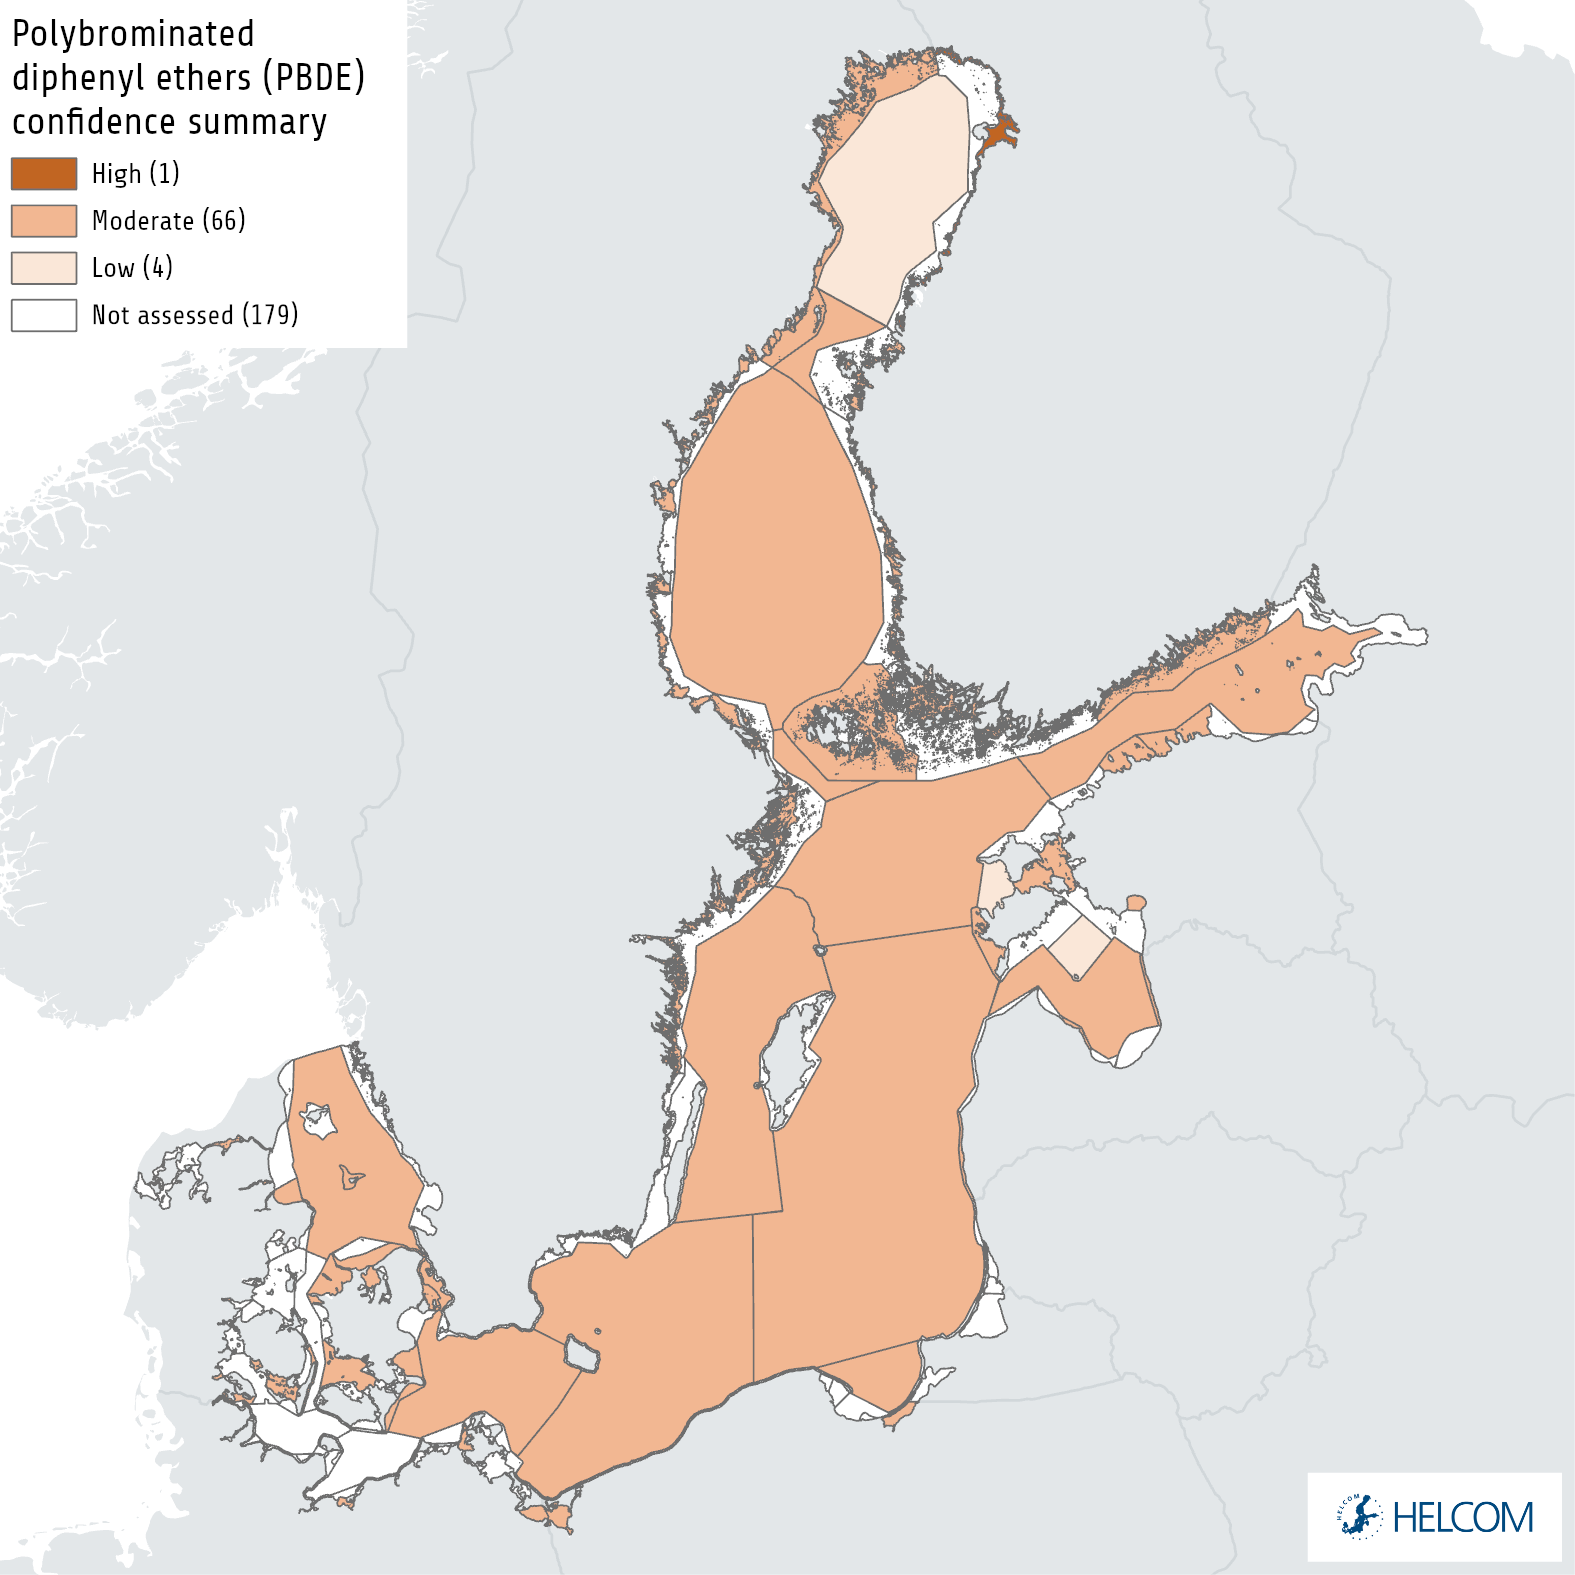
Figure 8. Confidence evaluation for PBDEs based on the One-Out-All-Out approach, ranging from high confidence to moderate and low confidence.
6 Drivers, Activities, and Pressures
Drivers are often complex issues that are difficult to quantify, though in certain instances proxies can be utilised to represent them or changes in them. A driver may for example relate to globalisation or political will and, while difficult to quantify in terms of specific relevance to an indicator, changes in drivers can catalyse changes in activities that will consequently influence pressures for example resulting in altered levels of shipping and the subsequent pressures for that activity. A brief overview of key pressures and activities is provided in the Table 4.
PBDEs mainly spread to the Baltic Sea via the atmosphere, rivers and waste water treatment plants (WWTPs). PBDEs are mainly discharged from landfills and waste sorting sites or deposited via atmosphere to the environment. The substances accumulate on waste sites as a result of production and use of flame-protected materials. More information on the occurrence of penta-, octa- and deca-BDE discharges is needed from the whole Baltic Sea area including from WWTPs.
Table 4. Brief summary of pressures and activities with relevance to the indicator.
| | General | MSFD Annex III, Table 2a |
| Strong link | Substances, litter and energy
|
|
| Weak link |
7 Climate change and other factors
There is no data on the influence of climate change on PBDE concentrations. Increased precipitation could increase the PBDE load via atmospheric deposition. If runoff increases, it is possible that PBDE from the terrestrial landscape might be transported to Baltic Sea via riverine input. Increased resuspension of marine sediments might also reveal buried PBDE from sediments.
However, it is unlikely that climate change has a significant impact on levels of PBDE in the environment. Climate change in the Baltic Sea region is expected to have significant impacts on key processes in the marine environment (HELCOM and Baltic Earth 2021). While there are relatively few studies that fully explore the impacts of such changes on hazardous substances direct parameters such as changes in water temperature, atmospheric deposition, precipitation, river run off and sediment transportation could all alter the flow of contaminants to and within the marine environment. In addition, alterations in metabolic aspects as well as food web structure and function may also alter the transfer of contaminants within the ecosystem and food web and thus alter the levels of bioaccumulation (as well as possible effects). More research is needed on the subject.
8 Conclusions
Overall, the concentrations of PBDEs do not achieve Good Environmental Status (sub-GES) for all but one of the evaluated assessment units. The sub-GES status is heavily influenced by the failure to achieve the threshold value in all evaluations applied for biota.
8.1 Future work or improvements needed
The indicator is generally fully operational but increased spatial and temporal monitoring would benefit the indicator and reduce uncertainties. Further development of the indicator to evaluate trends, in particular in sediments, may be of interest. Information on climate change impacts on PBDE is needed.
9 Methodology
The overall methodology is set out below.
9.1 Scale of assessment
The assessment is carried out at HELCOM assessment scale 4. The integrated assessment of hazardous substances is carried out at HELCOM assessment scale 3.
9.2 Methodology applied
The data may require transformation into the relevant unit and base for the threshold value which is µg kg-1 wet weight. Ideally, the data should be expressed in the same matrix as the indicator, which for the purposes of this evaluation is whole body concentrations in fish at a trophic level of 4.5 with a lipid content of 5%.
The majority of the PBDE data reported is analysed in muscle tissue. However, the EC Guidance Document No 32 (European Commission 2014) suggests that the assumption can be made that fat soluble compounds would be evenly distributed in the lipid within the whole organism. With this assumption, a whole body concentration would be possible to calculate from any analysed organ as long as the lipid content in the sample is known/analysed. To harmonize the evaluation across the entire Baltic Sea region, it is recommended to calculate the concentrations into corresponding values to a fish with a general fat content of 5%.
Data is to be normalised to lipid content according to the following equation, where Concnorm, lipid is lipid normalised concentration, Concmeasurement is the original value expressed in wet weight (ww) and lipid contentsample is the actual lipid content of the sample:
 In case information on lipid content is absent in the data, general fat content values derived in regional studies for the sampled matrix can be applied.
The EC guidance document (European Commission 2014) recommends to normalize fish to a trophic level of 4.5 for marine ecosystems to standardise for the biomagnification effect. For this evaluation, no adjustment for trophic level has been conducted but this is something that needs to be considered in future evaluations according to recommendations below.
Statistical evaluation
Assessment methodology for contaminants in biota, sediment and water
The evaluation protocol is structured in three main parts, 1) changes in log concentrations over time are modelled, 2) check for compliance against threshold value and evidence for temporal change of contaminant concentration per station and 3) a spatial aggregation of status per assessment unit.
It should be noted that the evaluation protocol makes the assumption that monitoring data stems from the same monitoring stations during consecutive years. The stations used by the protocol are defined in the ICES Station Dictionary. Stations with similar station name are grouped together, but it is also possible to define a group of stations with different names to be defined as the same station in the Station Dictionary. Usually, a station is defined in the Station Dictionary with coordinates and a valid box around these coordinates but coordinates outside of the box will only give a warning when reporting the data and are not used in the actual data extraction.
Overview
Time series of contaminant concentrations are assessed in three stages:
- For sediment, the concentrations are normalized prior to the evaluation to account for changes in the bulk physical composition of the sediment such as particle size distribution or organic carbon content. The concentrations are log transformed and changes in the log concentrations over time are modelled using linear mixed models. The type of temporal change that is considered depends on the number of years of data:
-
- 1-2 years: no model is fitted because there are insufficient data
- 3-4 years: concentrations are assumed to be stable over time and the mean log concentration is estimated
- 5-6 years: a linear trend in log concentration is fitted
- 7+ years: more complex (smooth) patterns of change over time are modelled
-
- The fitted models are used to assess status against available threshold value and evidence of temporal change in contaminant levels in the last twenty years
- The fitted models are also used for spatial aggregation to assess status against available threshold value and evidence of temporal change in contaminant levels on a scale 4 level HELCOM assessment unit.
All initial data is handled in a highly precautionary manner to further ensure that the risk of false positives is minimalised. For all initial data the 95% confidence limit on the mean concentration, based on the uncertainty seen in longer time series throughout the HELCOM area, is used. Applying a precautionary approach, the 90% quantile (psi value, Ψ ) of the uncertainty estimates in the longer time series from the entire HELCOM region are used. The same approach is used for time series with three or more years of data, but which are dominated by less-than values (i.e. no parametric model can be fitted). The mean concentration in the last monitoring year (meanLY) is obtained by: restricting the time series to the period 2016-2021 (the last six monitoring years), calculating the median log concentration in each year (treating ‘less-than’ values as if they were above the limit of detection), calculating the mean of the median log concentrations, and then back-transforming (by exponentiating) to the concentration scale. The upper one-sided 95% confidence limit (clLY) is then given by:
 , where n is the number of years with data in the period 2016-2021 (HELCOM 2018).
These stages are described in more detail in the link below. There is also information on how the methodology is adapted when there are ‘less-than’ measurements, i.e. some concentrations are reported as below the detection limit, and missing uncertainties, i.e. the analytical variability associated with some of the concentration measurements was not reported.
http://www.helcom.fi/action-areas/monitoring-and-assessment/monitoring-and-assessment-strategy
9.3 Monitoring and reporting requirements
Monitoring methodology
HELCOM monitoring of relevance to the indicator is documented in the on-line HELCOM Monitoring Manual in the sub-programme: Contaminants in biota. Monitoring guidelines on the determination of persistent organic compounds in biota are currently documented in the HELCOM COMBINE manual. The guidelines are to be updated and included in the HELCOM monitoring manual in the future.
The concentration of PBDEs in environmental monitoring is to be determined in an appropriate biota matrix that includes muscle of herring, perch, cod and eelpout. The basis for determination of the concentration is the lipid or wet weight with lipid content (%) in fish.
Current monitoring
The monitoring activities relevant to the indicator that are currently carried out by HELCOM Contracting Parties are described in the HELCOM Monitoring Manual
Sub-programme: Contaminants in biota monitoring concepts table
Denmark, Estonia, Finland, Germany, Latvia, Poland and Sweden presently monitor PBDEs in fish. Estonia and Sweden monitor PBDEs in sediments. Germany prepares for monitoring in sediment. Estonia and Latvia have screening or research data. No information is available from Russia.
When time series have started to accumulate data from the new monitoring stations in Finland, Lithuania and Poland, the monitoring of temporal trends of PBDEs will be considered adequate in the Baltic Sea. The current time series stations use highly mobile sample species (herring, cod and flounder) which makes the network of time series stations geographically representative. The adequacy of the current network could be further tested through power analysis.
10 Data
The data and resulting data products (e.g. tables, figures and maps) available on the indicator web page can be used freely given that it is used appropriately and the source is cited.
Result: Polybrominated diphenyl ethers (PBDEs) in biota
Result: Polybrominated diphenyl ethers (PBDEs) in sediment
Data: Hazardous substances in biota
Data: Hazardous substances in sediment
Data are extracted from the HELCOM COMBINE database, hosted by ICES. The data is based on regular monitoring activities carried out by Contracting Parties of HELCOM.
Most data sets cover only short time series which prevent temporal analyses. With the available data, status maps can be produced adequately for most parts of the western Baltic Sea, covering data up to 2016.
11 Contributors
Emmi Vähä, Finnish Environment Institute, and Anne L. Soerensen, Swedish Museum of Natural History.
Rob Fryer, Marine Scotland (OSPAR).
HELCOM Expert Network on Hazardous Substances.
HELCOM Secretariat: Owen Rowe, Deborah Shinoda, Joni Kaitaranta, and Jana Wolf.
12 Archive
This version of the HELCOM core indicator report was published in April 2023:
The current version of this indicator (including as a PDF) can be found on the HELCOM indicator web page.
Earlier versions of this indicator are available at:
Polybrominated diphenyl ethers PBDEs HELCOM core indicator 2018 (pdf)
HOLAS II component – Core indicator report – July 2017 (pdf)
13 References
European Commission 2008. Directive 2008/105/EC of the European Parliament and the Council on environmental quality standards in the field of water policy (Directive on Environmental Quality Standards). Off. J. Eur. Union L 348.
European Commission 2013. Directive 2013/39/EU of the European Parliament and of the Council of 12 August 2013 amending Directives 2000/60/EC and 2008/105/EC as regards priority substances in the field of water policy. Off. J. Eur. Union L 226: 1-17.
European Commission 2014. Guidance Document No. 32 on Biota Monitoring (the Implementation of EQSbiota) under the Water Framework Directive. Technical Report-2014-083.
EU-RAR 2000. European Union Risk assessment on pentabromodiphenyl ether. Final report. European Union Risk assessment report 5. 277 p. European Chemicals Bureau.
HELCOM (2018) Polybrominated diphenyl ethers PBDEs HELCOM core indicator 2018
HELCOM and Baltic Earth (2021) Climate Change in the Baltic Sea 2021 Fact Sheet. https://helcom.fi/wp-content/uploads/2021/09/Baltic-Sea-Climate-Change-Fact-Sheet-2021.pdf
Soerensen A.L., S. Faxneld (2022) Graphic and statistical overview of temporal trends and spatial variations within the Swedish National Monitoring Programme for Contaminants in Marine Biota (until 2020 year’s data), report 5:2022, Swedish Museum of Natural History, Stockholm, Sweden
14 Other relevant resources
Annex 1 Assessment unit level confidence summary
Confidence is evaluated per assessment unit based on a relative evaluation of following parameters for the copper indicator: 1) spatial component, 2) temporal component, 3) methodological component, and 4) the evaluation component. Despite the common approach applied with other indicators the information set out here is not directly comparable as it only focusses on an evaluation within each indicator (i.e. is relative only between the evaluated assessment units for copper) and it furthermore only addresses the evaluated units. More general information related to overarching confidence and required improvements are detailed in the main report.
The confidence for each component was applies based on a categorical approach using high, moderate and low. To achieve the overall summary confidence a score of 0.25 was applied to low, 0.5 to moderate and 1.0 to high with an average value calculated across the components and the same scores used to then select he final overall category.
Spatial component: Open sea and coastal areas were treated separately due to the scale of sea area being vastly different. The area (km2) for each evaluated assessment unit was divided by the total number of stations in the assessment unit and the resulting area per station was used to divide into three categories, roughly interpreted as stations addressing small, medium or large areas. If a large number (relatively) of stations were still available despite the area being large an increase of 1 category was applied.
Temporal component: The presence of ‘full’ and/or ‘initial’ data series was utilised to evaluate this. Where only a single initial data series/station was present a category of low was applied, where two initial data series were available a category of moderate was applied, where a single full data series was present a category of moderate was applied, and where two or more full data series were present a category of high was applied.
Methodological component: A score of high is applied to all evaluated assessment units since the indicator is evaluated using the MIME tool and applies a regionally agreed methodology and threshold values on national monitoring data.
Evaluation component: The standard error generated within the MIME assessment tool is utilised as a proxy for this component. In simple terms the basis of this evaluation is that standard error can be roughly equated to a coefficient of variance. This therefore provides a general confidence evaluation of the underlying data and variation within it. A categorical approach was applied where standard error values >0.70 were scored as low, 0.4-0.7 were scored as moderate and <0.4 were scored as high.
The confidence is provided for sediments and biota below (Annex 1 – Tables 1-2).
The overall confidence for the OOAO status evaluation is also generated using a OOAO approach from these tables below, suing the overall category.
Annex 1 – Table 1. Summary table showing categorical confidence per component and overall for PBDEs in biota.
| Assessment Unit | Spatial | Temporal | Methodological | Evaluation | Overall |
| DEN-006 | High | High | High | Moderate | Moderate |
| DEN-024 | High | Moderate | High | Moderate | Moderate |
| DEN-025 | High | Low | High | Low | Moderate |
| DEN-028 | Moderate | Low | High | Low | Moderate |
| DEN-029 | High | Low | High | Low | Moderate |
| DEN-044 | High | Low | High | Low | Moderate |
| DEN-046 | Moderate | Low | High | Low | Moderate |
| DEN-084 | High | Low | High | Low | Moderate |
| DEN-085 | High | Low | High | Low | Moderate |
| DEN-087 | High | Low | High | Low | Moderate |
| DEN-095 | High | Low | High | Low | Moderate |
| DEN-102 | High | Low | High | Low | Moderate |
| DEN-110 | High | High | High | Moderate | Moderate |
| DEN-114 | High | Low | High | Low | Moderate |
| DEN-123 | High | Low | High | Low | Moderate |
| DEN-137 | High | Moderate | High | Moderate | Moderate |
| DEN-138 | High | Low | High | Low | Moderate |
| DEN-139 | High | Low | High | Low | Moderate |
| DEN-146 | High | Low | High | Low | Moderate |
| DEN-160 | High | Moderate | High | Moderate | Moderate |
| DEN-200 | Moderate | Low | High | Low | Moderate |
| DEN-206 | Moderate | High | High | Moderate | Moderate |
| DEN-214 | High | Low | High | Low | Moderate |
| DEN-235 | High | Moderate | High | Moderate | Moderate |
| EST-002 | Moderate | Low | High | Low | Moderate |
| EST-003 | Moderate | Low | High | Low | Moderate |
| EST-005 | Moderate | Low | High | Low | Moderate |
| EST-010 | Low | Low | High | Low | Low |
| EST-013 | High | Low | High | Low | Moderate |
| EST-014 | Moderate | Low | High | Low | Moderate |
| EST-016 | Moderate | Low | High | Low | Moderate |
| EST-019 | Low | Low | High | Low | Low |
| FIN-001 | Low | Low | High | Low | Low |
| FIN-003 | High | Moderate | High | Moderate | Moderate |
| FIN-004 | Low | High | High | Moderate | Moderate |
| FIN-005 | Low | High | High | Moderate | Moderate |
| FIN-006 | Moderate | Low | High | Low | Moderate |
| FIN-008 | Moderate | High | High | Moderate | Moderate |
| FIN-010 | High | High | High | High | High |
| FIN-014 | Low | High | High | Moderate | Moderate |
| GER-002 | High | Moderate | High | Moderate | Moderate |
| GER-011 | High | Moderate | High | Moderate | Moderate |
| GER-020 | High | Low | High | Low | Moderate |
| LAT-001 | High | Low | High | Low | Moderate |
| LAT-004 | High | Low | High | Low | Moderate |
| POL-002 | High | High | High | Moderate | Moderate |
| POL-003 | High | High | High | Moderate | Moderate |
| POL-019 | High | Low | High | Low | Moderate |
| SWE-011 | Low | High | High | Moderate | Moderate |
| SWE-012 | Moderate | High | High | Moderate | Moderate |
| SWE-016 | Moderate | High | High | Moderate | Moderate |
| SWE-018 | Low | High | High | Moderate | Moderate |
| SWE-020 | High | High | High | Moderate | Moderate |
| SWE-021 | Moderate | High | High | Moderate | Moderate |
| SWE-022 | Moderate | High | High | Moderate | Moderate |
| SWE-023 | Low | High | High | Moderate | Moderate |
| SEA-001 | Moderate | High | High | Moderate | Moderate |
| SEA-003 | High | Low | High | Low | Moderate |
| SEA-006 | Moderate | High | High | Moderate | Moderate |
| SEA-007 | Moderate | High | High | High | Moderate |
| SEA-008 | Moderate | Moderate | High | Low | Moderate |
| SEA-009 | Moderate | High | High | Moderate | Moderate |
| SEA-010 | Low | Moderate | High | Moderate | Moderate |
| SEA-011 | Moderate | Low | High | Low | Moderate |
| SEA-012 | Low | Moderate | High | Moderate | Moderate |
| SEA-013 | Moderate | Moderate | High | Moderate | Moderate |
| SEA-015 | Moderate | High | High | High | Moderate |
| SEA-016 | Moderate | Low | High | Low | Moderate |
| SEA-017 | Low | Low | High | Low | Low |
Annex 1 – Table 2. Summary table showing categorical confidence per component and overall for PBDEs in sediments.
| Assessment Unit | Spatial | Temporal | Methodological | Evaluation | Overall |
| EST-003 | Low | Low | High | Moderate | Moderate |
| EST-011 | High | Low | High | Moderate | Moderate |
| EST-016 | High | Low | High | Moderate | Moderate |
| SEA-001 | Moderate | Low | High | Moderate | Moderate |
| SEA-006 | Moderate | Low | High | Moderate | Moderate |
| SEA-007 | Low | Low | High | Moderate | Moderate |
| SEA-009 | Low | Moderate | High | Moderate | Moderate |
| SEA-010 | Moderate | Moderate | High | Moderate | Moderate |
| SEA-012 | Low | Low | High | Moderate | Moderate |
| SEA-014 | Moderate | Low | High | Moderate | Moderate |
| SEA-015 | Low | Moderate | High | Moderate | Moderate |
| SEA-017 | Moderate | Moderate | High | Moderate | Moderate |