 PCBs, dioxins and furans
2 Relevance of the indicator
PCBs are synthetic chemicals which do not occur naturally in the environment. Due to their properties, PCBs have been used in a wide variety of applications and manufacturing processes, especially as plasticizers, insulators and flame-retardants. They are widely distributed in the environment through, for example, inappropriate handling of waste material or leakage from transformers, condensers and hydraulic systems. Long-term effects of PCBs include increased risk of cancer, infections, reduced cognitive function accompanied by adverse behavioural effects, as well as giving birth to infants of lower than normal birth weight (Carpenter 1998, Carpenter 2006). There are also indications that PCBs are associated with reproductive disorders in marine top predators.
Dioxins (PCDD/Fs) were never produced intentionally, but they are minor impurities in several chlorinated chemicals (e.g., PCBs, chlorophenols, hexachlorophene, etc.) and are formed in several industrial processes and from most combustion processes, such as municipal waste incineration and small-scale burning under poorly controlled conditions. The most relevant toxic effects of PCDD/Fs are developmental toxicity, carcinogenicity and immunotoxicity.
2.1 Ecological relevance
Polychlorinated biphenyls (PCBs) and PCDD/Fs (dioxins and furans) are persistent organic pollutants (POPs) that can cause severe, long-term impacts on wildlife, ecosystems, and human health. The substance groups are characterized by low water solubility and low vapour pressure. Due to their persistent and hydrophobic properties, the substances accumulate in sediments and organisms in the aquatic environment. In the environment, dioxins can undergo photolysis, however, they are generally very resistant to chemical and biological degradation.
Polychlorinated biphenyls (PCBs) consist of two linked benzene rings with chlorine atoms substituted for one or more hydrogen atoms. Theoretically, 209 congeners are possible, but only around 130 are found in commercial mixtures. Some PCBs are called dioxin-like (dl-PCBs) because they have a co-planar structure very similar to that of dioxins and have dioxin-like effects (i.e. four non-ortho substituted PCBs: CB-77, CB-81, CB-126, CB-169, IUPAC and eight mono-ortho substituted: CB-105, CB-118, CB-156, CB-157, CB-167, CB-114, CB-123, CB-189, IUPAC) (Burreau et al., 2006).
The name ’dioxin’ refers to polychlorinated dibenzo-p-dioxin (PCDD) and dibenzofuran (PCDF) compounds, i.e. two benzene rings with one (furans) or two (dioxins) oxygen bridges and substituted with 1–8 chlorine atoms. Of the 210 possible congeners, the 17 compounds (10 furans, 7 dioxins) substituted in positions 2, 3, 7 and 8 are considered to be of highest toxicological importance.
The non-dl-PCBs included in this core indicator report are essentially the 7 PCB congeners (with exception for CB-118 that is included in the dioxin like-PCBs) that have been monitored since the beginning of the HELCOM and OSPAR monitoring programmes. These PCBs are carefully selected mainly by ICES working groups due to their relatively uncomplicated identification and quantification in gas chromatograms and as they usually contribute a very high proportion of the total PCB content in environmental samples. These are the ‘ICES 7’: CB-28, CB-52, CB-101, CB-118, CB-138, CB-153 and CB-180.
Long-term effects of PCBs from human and laboratory mammal studies include increased risk of cancer, infections, reduced cognitive function accompanied by adverse behavioural effects, as well as giving birth to infants of lower than normal birth weight (Carpenter 1998, Carpenter 2006). There are also indications that PCBs are associated with reproductive disorders in marine top predators. PCBs are also assumed to cause reduced number of offspring in white-tailed sea eagles and uterine leiomyomas in grey seal in the Baltic Sea (Helander et al., 2002, Bäcklin et al., 2010).
The most relevant toxic effects of PCDD/Fs are developmental toxicity, carcinogenity and immunotoxicity. The sensitivity of various species to the toxic effects of PCDD/Fs varies significantly. 2,3,7,8-TCDD is the most toxic and well-studied congener and is used as a reference for all other related chemicals. Each of the 17 relevant congeners is assigned a toxic equivalency factor (TEF), where 2,3,7,8-TCDD equals 1 (Van den Berg et al., 1998; Van den Berg et al., 2006). Dioxin concentrations are commonly reported as toxic or TCDD equivalents (TEQ), which is the sum of the individual congener concentrations multiplied with its specific TEF.
2.2 Policy relevance
The “ICES 7” non-dioxin like PCBs (non-dl-PCBs), i.e. congeners CB-28, CB-52, CB-101, CB-138, and CB-180, and the dioxin like PCB (dl-PCB) CB-118, are listed as mandatory contaminants that should be analysed and reported within both HELCOM and OSPAR, and are classed as priority POPs under the Stockholm Convention. In the proposed revised guidelines for OSPAR the congeners CB-105 and CB-156 are added to this list. Non-dioxin like PCBs are not included in the Water Framework Directive (WFD) priority substance lists, but they are included in the Marine Strategy Framework Directive (MSFD).
The Helsinki Convention (both the original signed in 1974, and the updated version signed in 1992) has recommended special bans and restrictions on transport, trade, handling, use and disposal of PCBs. The Ministerial Declaration from 1998, within HELCOM and the 1995 Declaration of the Fourth international conference of the protection of the North Sea called for measures against toxic, persistent, bioaccumulating substances like PCBs to cease their inputs to the environment completely by the year 2020.
Dioxins and furans (PCDD/Fs) are included in several international agreements, of which the Stockholm Convention and the Convention on Long Range Transboundary Air are among the most important for the control and reduction of sources to the environment. World health organization (WHO) and Food and Agriculture Organization of the United Nations (FAO) have jointly established a maximum tolerable human intake level of dioxins via food, and within the EU there are limit values for dioxins in food and feed stuff (EC 2006). Several other EU legislations regulate dioxins, e.g. the plan for integrated pollution prevention and control (IPPC 2010/75/EC) and directives on waste incineration (EC, 2000, 2008). The EU has also adopted a Community Strategy for dioxins, furans and PCBs (EC, 2001). PCDD/Fs are currently not included in the Water Framework Directive but are on the list of substances to be revised for adoption in the near future. HELCOM has listed PCDD/Fs and dl-PCBs as prioritized hazardous substances of specific concern for the Baltic Sea (HELCOM, 2010a), like OSPAR on the List of Chemicals for Priority Action (OSPAR 2010a).
Under the Stockholm Convention, releases of unintentionally produced by-products listed in Annex C4, including dioxins and dl-PCBs, are subject to continuous minimization with the ultimate goal of elimination where feasible. The main tool for this is a National Action Plan which should cover the source inventories and release estimates as well as plans for release reductions. At the EU level, a Strategy for dioxins and PCBs was adopted in 2001. The Strategy includes actions in the area of feed and food contamination and actions related to the environment, including release reduction. Over the past decade, important legislation has been adopted to reduce the emissions of PCDD/Fs, in particular in the areas of waste incineration and integrated pollution prevention and control. Releases of POPs, including dioxins, from industrial installations have been regulated by the IPPC Directive and the Waste Incineration Directive, the former requiring Member States to establish permit conditions based on the Best Available Techniques (BAT) for a wide variety of industry sectors, and the latter setting maximum permissible limit values for PCDD/F emissions to air and water from waste incineration. Currently, the releases of these substances are regulated by the Directive on industrial emissions (IED, 2010/75/EU). The proper and timely implementation and enforcement of the IED remains a key priority in order to ensure the necessary reduction of emissions from major industrial sources. However, at present or in the near future, non-industrial sources are likely to exceed those from industrial ones (Quass et al., 2004).
This core indicator on PCBs, dioxins and furans addresses the Baltic Sea Action Plan’s (BSAP) Hazardous substances and litter segment goal of a “Baltic Sea unaffected by hazardous substances and litter” and also has relevance for elements of the Biodiversity and to a certain extent to Maritime activities segment goals: “The Baltic Sea ecosystem is healthy and resilient” and “Environmentally sustainable sea-based activities”, respectively.
In addition, the indicator is of direct relevance to Descriptor 8 and of significance for Descriptor 9 or the EU Marine Strategy Framework Directive (MSFD) as set out under the specific Descriptors and Criteria in Commission Decision (EU) 2017/848.
Table 1. Overview of key policy relevance elements.
| Baltic Sea Action Plan (BSAP) | Marine Strategy Framework Directive (MSFD) | |
| Fundamental link | Segment: Hazardous substances and litter goal
Goal: “Baltic Sea unaffected by hazardous substances and litter”
|
Descriptor 8 Concentrations of contaminants are at levels not giving rise to pollution effects.
|
| Complementary link | Segment: Biodiversity
Goal: “Baltic Sea ecosystem is healthy and resilient”
Segment: Sea-based activities Goal: “Environmentally sustainable sea-based activities”
|
Descriptor 9 Contaminants in fish and other seafood for human consumption do not exceed levels established by Union legislation or other relevant standards.
(a) for contaminants listed in Regulation (EC) No 1881/2006, the maximum levels laid down in that Regulation, which are the threshold values for the purposes of this Decision; (b) for additional contaminants, not listed in Regulation (EC) No 1881/2006, threshold values, which Member States shall establish through
|
| Other relevant legislation: |
|
|
2.3 Relevance for other assessments
The status of the Baltic Sea marine environment in terms of contamination by hazardous substances is assessed using several core indicators. Each indicator focuses on one important aspect of the complex issue. In addition to providing an indicator-based evaluation of the status of the Baltic Sea in terms of concentrations of PCBs, dioxins and furans in the marine environment, this indicator along with the other hazardous substances core indicators is used to develop an overall assessment of contamination status by inclusion in the integrated assessment of hazardous substances.
3 Threshold values
The core indicator evaluates whether an area reflects good status by comparing the concentration to a threshold value which should not be exceeded, as illustrated in Figure 2 and set out in Table 2.
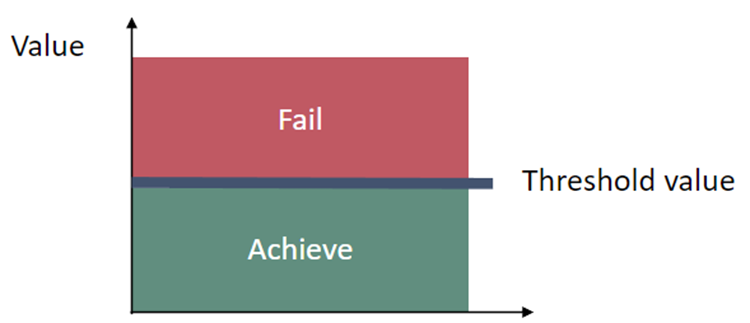
Figure 2. Schematic representation of the threshold value which indicates good status when the measured concentration is below the threshold value.
Table 2. Threshold value for the core indicator ‘PCBs, dioxins and furans’. Underlined supporting parameters represent parameters without which the indicator evaluation cannot be applied. Sources for threshold value: EQS biota human health 2013/39/EU and EC 1881/2006 and 1259/2011.
| Indicator | Threshold value | Parameters (PARAM) / Parameter groups (PARGROUP)
(see also http://vocab.ices.dk/) |
Matrix | Species | Matrix | Basis | Supporting parameters and information |
| dl-PCBs, dioxins and furans | Primary threshold
EQS biota human health: 0.0065 ng TEQ/kg ww 5% lipid content fish, crustaceans or molluscsS |
Dioxins and furans: PARGROUP = OC-DX | Biota | Herring & cod (open sea)
Flounder, sole, eelpout & Perch (coastal) |
MU, MU&EP, (‘fillet’), LI or whole fish | W | Lipid content |
| Non dl-PCBs (PCBs) | Primary threshold
EC 1881/2006 sum of congeners (28, 52, 101, 138, 153, 180) 75 μg/kg ww 5% lipid content fish muscle. |
Non-dioxin (PCB): PARGROUP = OC-CB | Biota | Herring & cod (open sea)
Flounder, sole, eelpout & Perch (coastal) |
MU, MU&EP, (‘fillet’), LI or whole fish | W | Lipid content |
3.1 Setting the threshold value(s)
The threshold value is defined based on Ecological Quality Standards (EQS) derived for the purposes of the EU Water Framework Directive, and where EQS values are not available the threshold is based on Environmental Assessment Criteria (EAC) values developed in the OSPAR framework.
The threshold value is matrix sensitive, and only applicable if the concentrations are measured in the appropriate matrix. For historical reasons, the Contracting Parties around the Baltic Sea have differing monitoring strategies. As a pragmatic approach, a threshold value is defined in this indicator (based on 2013/39/EU GES boundary), however if suitable monitoring data is not available in a region the secondary threshold value can be used for the evaluation.
The threshold value for PCB is defined for the Sum of 6 congeners (non-dioxin like) (Table 2). The selection of the sum of 6 congeners was a pragmatic decision to increase harmonisation in the evaluation and establish a viable standard for the process. The selection was based on a pragmatic review of the measured congeners but also taking into account the major contributors to the overall pool and the congeners that were considered as most indicative of key PCB patterns in relevant sampling matrices. The recommended 6 congeners (from ICES work) were taken onboard as a recommendation from the European Food Safety Authority as they were considered to offer the most appropriate evaluation of risk (EFSA 2005). Other congeners included in current monitoring programmes can be included when suitable boundary values become available. For dioxins, the threshold value is defined as the EQS-value for human consumption. However, this EQS value stems from the foodstuff legislation and is derived taking into consideration information beyond the environmental parameters, such as typical levels of contaminants in different foodstuff. The aim of the target value is to identify and prevent contaminated foodstuff from being placed on the market. Thus, the foodstuff threshold values do not cover all combinations of matrices and contaminants relevant for an environmental assessment of the marine environment. Because of this, a full equivalence between EQSs based on foodstuff threshold values and EQS based on toxicological evaluations should not be expected.
The EU directive on environmental quality standards (2008/105/EC and 2013/39/EU), Article 3, states that also long-term temporal trends should be assessed for substances that accumulate in sediment and/or biota.
The results are based on PCB concentrations in different fish species, but also different matrices, i.e., muscle and liver. To reduce the variability between different matrices, the threshold value is adapted to differences in lipid content of different matrices.
4 Results and discussion
The results of the indicator evaluation that underly the key message map and information are provided below.
4.1 Status evaluation
The data presented in this core indicator report were collected in the HELCOM COMBINE data base, a compilation of data from the monitoring activities reported by all Baltic Sea countries. The report presents information on the current levels of PCBs, dioxins and furans concentrations in biota (fish).
Non-dioxin like PCBs
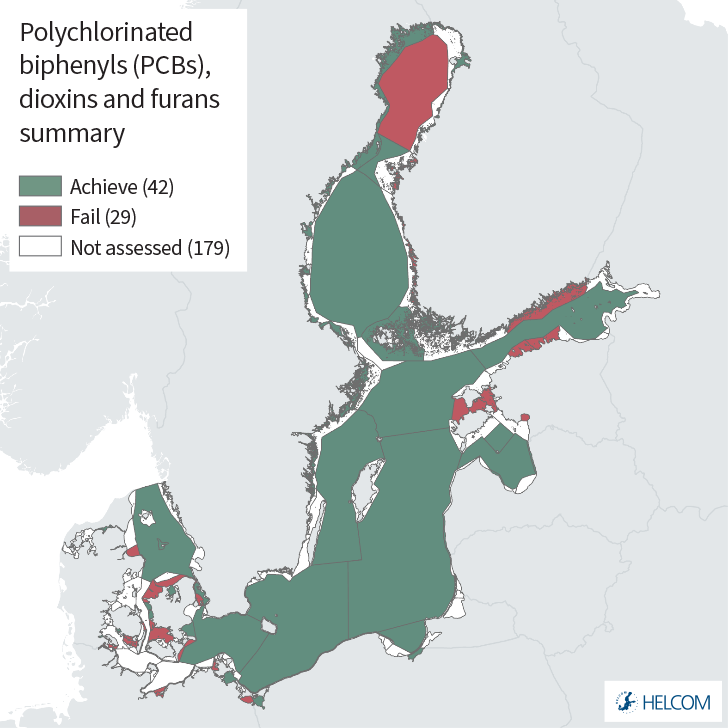
Good Environmental Status (GES) is achieved when concentrations of non-dioxin like PCB (Sum of 6 CB: 28, 52, 101, 138, 153 and 180 in fish) are below the agreed threshold value. An evaluation was possible for 71 assessment units, of which 13 were open sea HELCOM sub-basins. All open sea assessment units achieved the threshold value (i.e., were in GES) whereas 17 of the 58 coastal assessment units failed to achieve the threshold value (were sub-GES) (Figure 3).
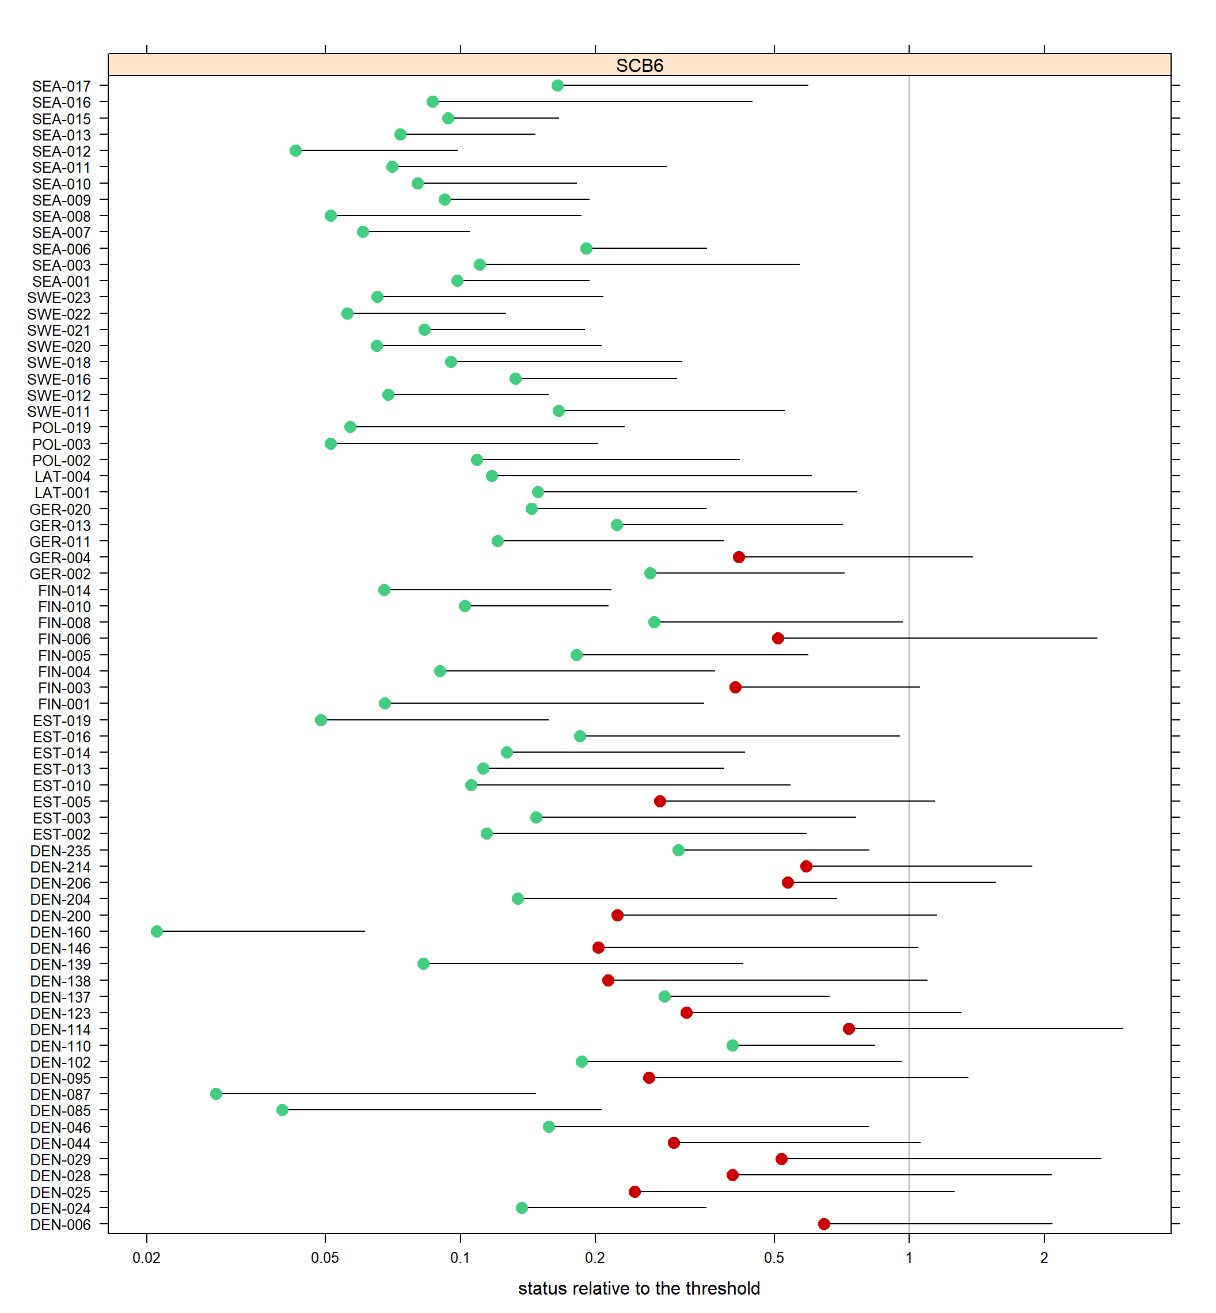
Figure 3. Overview of HELCOM Level 4 assessment units evaluated for PCBs Non-dioxin like PCBs in biota.
Filled circles represent a mean value for each assessment unit and the bar represents the upper 95% confidence limit. Green colour indicates that the assessed area achieves the threshold value and red colour that the assessed area fails the threshold.The assessment unit level evaluation is built on monitoring at 117 stations, of which circa 50 represent ‘full’ data series (i.e., more than 3 years of data for the period) to which distinct trends could be assigned statistically. Sixteen of these stations showed downward trends (e.g., decreasing concentrations of Non-dioxin like PCBs). These stations were located in large number of sub-basins, including the Arkona Basin, Bornholm Basin, Western Gotland Basin, Northern Baltic Proper, The Quark and the Bothnian Sea. All of these stations also achieved GES. With the exception of a single trend where a distinct increasing concentration was detected (The Quark (SWE-021), Holmöarna) other trends were stable or non-directional (Figure 4).
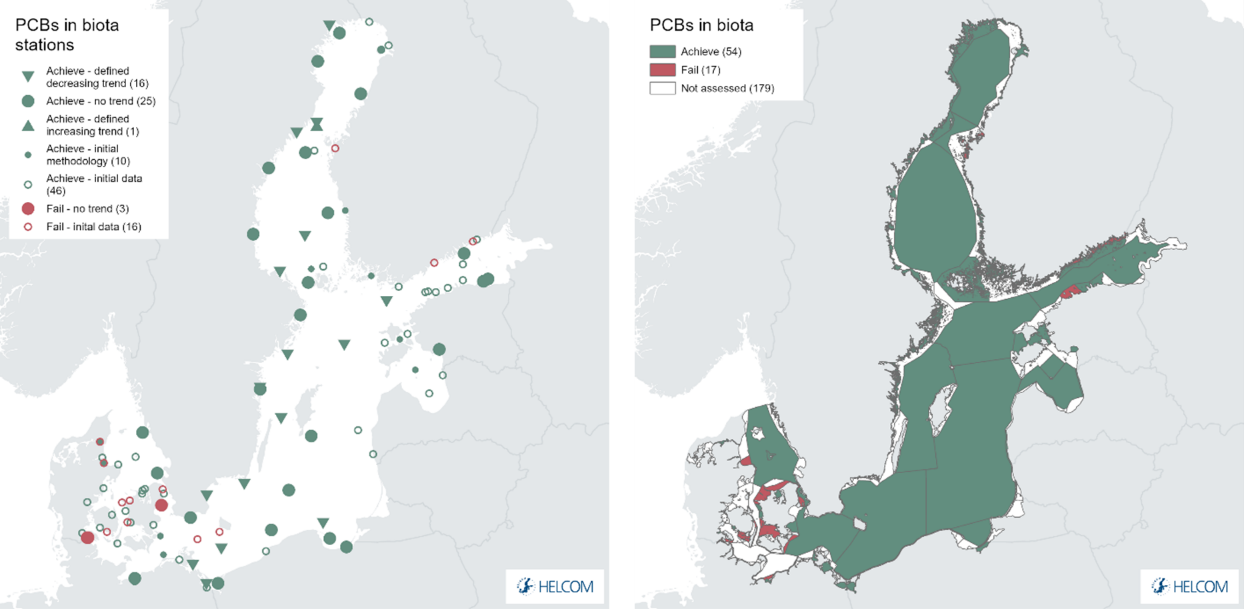
Figure 4. Spatial variation of the non-dioxin like PCBs (Sum of 6 PCB) sampling stations in biota (flounder, common dab, herring, cod, European perch, European sprat and eelpout) (left) and status evaluation in biota (right). Green colour indicates that the upper 95 % confidence interval for non-dioxin like PCBs concentration is below the threshold value (i.e. good status). Small open circles indicate a status evaluation based on only 1-2 years of data (initial data), small filled circles indicate that data is not suitable to assess a trend (treated with initial methodology), large filled circles that no detectable concentration trends can be identified during the whole monitoring period (full data), and the filled arrow indicate that there is a statistically defined upward or downward trend during the monitoring period. See ‘data chapter’ for interactive maps and data at the HELCOM Map and Data Service.
At some stations, especially along the coast in the Arkona Basin, Gulf of Finland (< 3 years data), Kattegat and in the Quark (< 3 years data), good status was not achieved. The concentrations of PCB showed no trend or were based on too few years of monitoring to do a trend evaluation. Examples of different trend patterns at the station level (station time series) are presented in Figure 5.
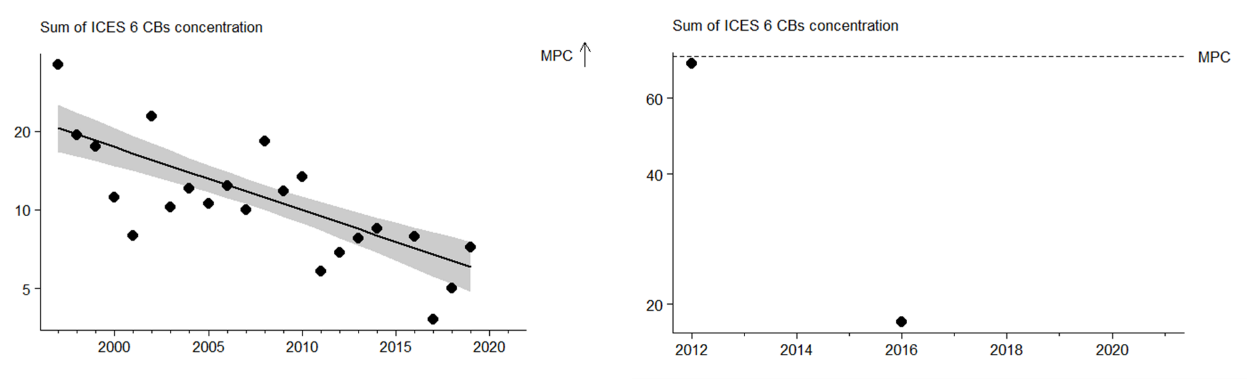
Figure 5. Examples of non-dioxin like PCB concentration in biota at two stations in the Bornholm Basin and Bothnian Bay, respectively, selected for illustrative purposes, showing a station with full evaluation possible (left, downward pointing green triangle showing a distinct decreasing trend) and initial status evaluation data (right). MPC stands for ‘maximum permissible concentration’.
The results are based on PCB concentrations in different fish species, but also different matrices, i.e., muscle and liver. To reduce the variability between different matrices, the threshold value is adapted to differences in lipid content of different matrices.
Dioxins, furans and dl-PCBs
Good status was achieved in terms of concentrations of dioxins and furans in fish in most of the evaluated assessment units during the period 2016-2021, as the average concentrations were below the threshold value of 0.0065 TEQ/kg ww (fish muscle, crustaceans or molluscs). While some assessment units had mean values below the threshold value, the variation in the data set and thus the 95% confidence limit on the mean concentration exceeding the threshold value results in sub-GES conditions. Few stations also recorded mean values above the threshold value (Figure 6). Overall, 18 of 51 evaluated assessment units were in sub-GES condition, only one of which was an open sea sub-basin (SEA-017, Bothnian Bay).
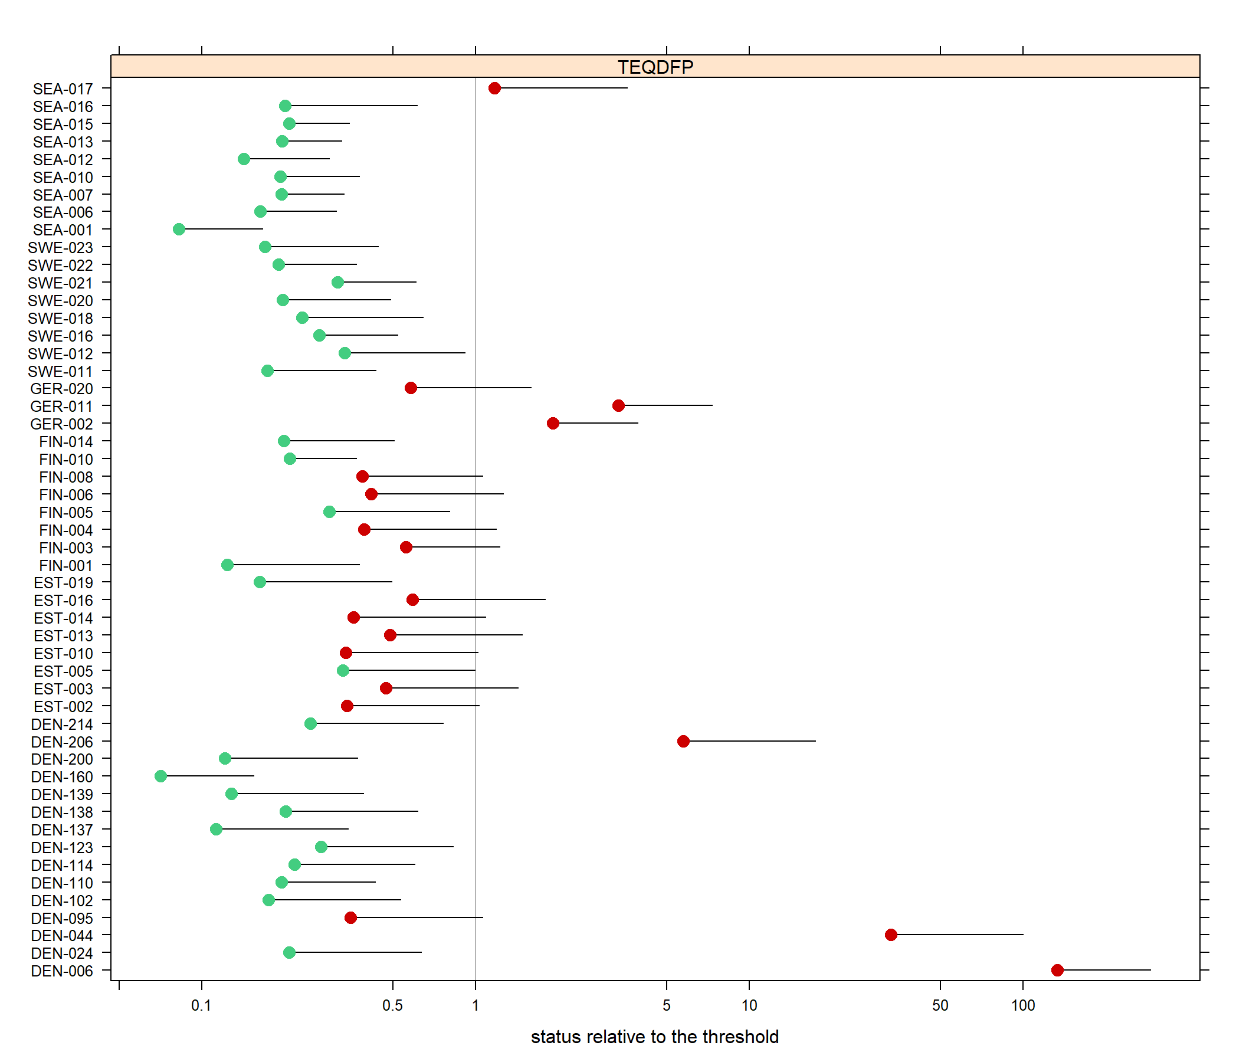
Figure 6. Overview of HELCOM Level 4 assessment units evaluated for Dioxins, furans and dl-PCBs in biota. Filled circles represent a mean value for each assessment unit and the bar represents the upper 95% confidence limit. Green colour indicates that the assessed area achieves the threshold value and red colour that the assessed area fails the threshold.
Eleven out of 77 evaluated stations failed to achieve the threshold value, these station evaluations forming the assessment unit level evaluation. Circa one third of the stations evaluated represented ‘full data’ and of these distinct downward trends (e.g., decreasing concentrations) were recorded in six instances (all stations also being in GES). These stations were located in the Bornholm Basin, Northern Baltic Proper, Bothnian Sea and Bothnian Bay sub-basins. With the exception of a single trend where a distinct increasing concentration was detected (The Quark (SWE-021), Holmöarna – though still in GES) other trends were stable or non-directional (Figure 7).
The results are based on dioxin and furan concentrations that are acquired from different fish species and in some cases different matrices (liver and muscle), which lead to an extra variability in the results due to species/matrices differences. However, to reduce the variability between different species/matrices, the threshold value is adapted to differences in lipid content of different species/matrices.
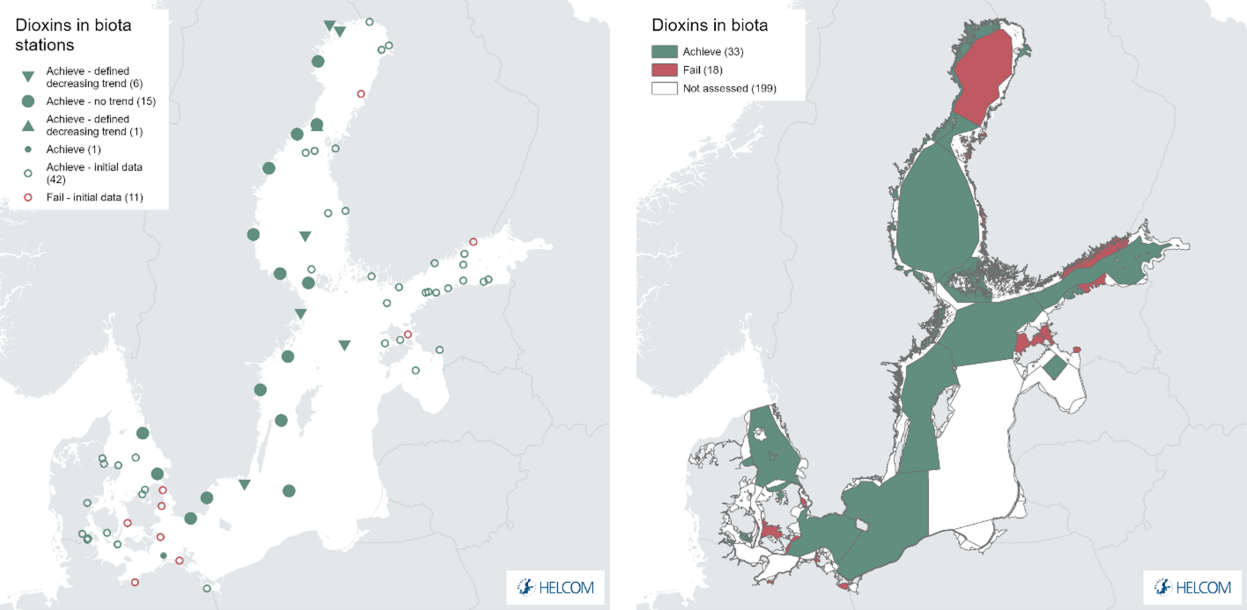
Figure 7. Spatial variation of dioxin and furan sampling stations in biota (European perch, European sprat, flounder, herring and eelpout) (left) and status evaluation by assessment unit (right). Green colour indicates that the upper 95 % confidence interval for dioxin like PCBs concentration is below the threshold value (i.e., good status). Small open circles indicate a status evaluation based on only 1-2 years of data (initial data), small filled circles indicate that data is not suitable to assess a trend (treated with initial methodology), large filled circles that no detectable concentration trends can be identified during the whole monitoring period (full data), and the filled arrow indicate that there is a statistically defined upward or downward trend during the monitoring period. See ‘data chapter’ for interactive maps and data at the HELCOM Map and Data Service.
At some stations, especially along the coast in the Bothnian Bay (< 3 years data), the Arkona Basin, Gulf of Finland (< 3 years data), Kattegat and in the Quark (< 3 years data), ‘initial’ data is available which limits the application of the full statistical analyses. The concentrations of PCB showed no trend or were based on too few years of monitoring to do a trend evaluation. Examples of different trend patterns at the station level (station time series) are presented in Figure 8.
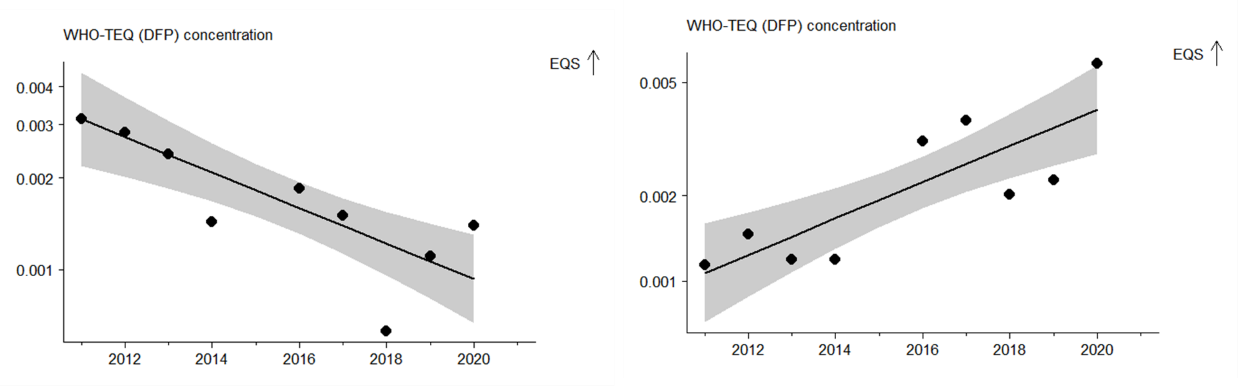
Figure 8. Examples of Dioxins, furans and dl-PCBs concentration in biota at two stations in the Bothnian Sea and The Quark, respectively, selected for illustrative purposes, showing a station with full evaluation possible (left, downward pointing green triangle showing a distinct decreasing trend) and a station with full evaluation possible (right, upward pointing green triangle showing a distinct increasing trend) (right).
4.2 Trends
Examples of key trends at selected stations are provided above. A number of stations are evaluated as ‘initial’ data series due to limitations in the length or quality of the time series available (small symbols on maps). Increased temporal monitoring of these would provide stronger analytical potential in future evaluations. However, identification of statistical trends is viable and a small number of decreasing trends (i.e. concentrations becoming lower) have been identified.
Overall, of 196 station level evaluations carried out 22 downward trends (decreasing concentrations) were identified and two upward trends.
4.3 Discussion
PCBs, dioxins and furans are persistent organic pollutants (POPs) that have a tendency to accumulate in biota. Around 50% of coastal assessment units but less than 10% of open sea assessment units evaluated were sub-GES (i.e. exceeded the threshold values for one or more of the evaluated parameters).
An overview of the outcomes for the open sea sub-basins is provided below (Table 3).
Table 3. Overview of evaluation outcomes and comparison with previous evaluation (using the OOAO evaluation outcomes per assessment unit). Currently this approach is only applied for open sea assessment units.
| HELCOM Assessment unit name (and ID) | Threshold value achieved/failed – HOLAS II | Threshold value achieved/failed – HOLAS 3 | Distinct trend between current and previous evaluation. | Description of outcomes, if pertinent |
| Kattegat (SEA-001) | Achieved | Achieved | No change between assessment periods, GES achieved in both. | Both parameters are evaluated, and both achieve the threshold value, indicating GES. |
| The Sound (SEA-003) | Achieved | Achieved | No change between assessment periods, GES achieved in both. | The threshold value is achieved for Non-dioxin like PCBs in biota, indicating GES. |
| Arkona Basin (SEA-006) | Achieved | Achieved | No change between assessment periods, GES achieved in both. | Both parameters are evaluated, and both achieve the threshold value, indicating GES. |
| Bornholm Basin (SEA-007) | Achieved | Achieved | No change between assessment periods, GES achieved in both. | Both parameters are evaluated, and both achieve the threshold value, indicating GES. |
| Gdansk Basin (SEA-008) | Achieved | Achieved | No change between assessment periods, GES achieved in both. | The threshold value is achieved for Non-dioxin like PCBs in biota, indicating GES. |
| Eastern Gotland Basin (SEA-009) | Achieved | Achieved | No change between assessment periods, GES achieved in both. | The threshold value is achieved for Non-dioxin like PCBs in biota, indicating GES. |
| Western Gotland Basin (SEA-010) | Achieved | Achieved | No change between assessment periods, GES achieved in both. | Both parameters are evaluated, and both achieve the threshold value, indicating GES. |
| Gulf of Riga (SEA-011) | Not evaluated | Achieved | NA. Data availability has facilitated an evaluation for the current assessment period. | The threshold value is achieved for Non-dioxin like PCBs in biota, indicating GES. |
| Northern Baltic Proper (SEA-012) | Achieved | Achieved | No change between assessment periods, GES achieved in both. | Both parameters are evaluated, and both achieve the threshold value, indicating GES. |
| Gulf of Finland (SEA-013) | Achieved | Achieved | No change between assessment periods, GES achieved in both. | Both parameters are evaluated and both achieve the threshold value, indicating GES. |
| Bothnian Sea (SEA-015) | Achieved | Achieved | No change between assessment periods, GES achieved in both. | Both parameters are evaluated, and both achieve the threshold value, indicating GES. |
| The Quark (SEA-016) | Achieved | Achieved | No change between assessment periods, GES achieved in both. | Both parameters are evaluated, and both achieve the threshold value, indicating GES. |
| Bothnian Bay (SEA-017) | Failed | Failed | No change between assessment periods, GES not achieved in either period. | The threshold value is achieved for Non-dioxin like PCBs but not for Dioxins, furans and dl-PCBs, indicating sub-GES. |
In general there have been decreases in concentration of PCBs with many areas, especially open sea areas, achieving the threshold value (i.e. being in GES). However, where assessed, quite a number of coastal areas are sub-GES (see Figure 1). Some countries, for example Sweden, provide clear guidance on dietary recommendations (Swedish Food Agency – Dioxins and PCBs in Swedish Food) to prevent serious detrimental impacts due to the strongly bioaccumulative nature of these substances and the potential for negative impacts. While these guidelines do acknowledge general declines in concentrations and there have been recent studies exploring the balance between the possible negative effects of contaminants in edible fish versus the health benefits provided by other compounds (fatty acids etc) now that contaminant load has decreased (e.g. Tuomisto et al, 2020), there remains precautionary guidance on this issue. The guidance acknowledges the fact that there are key life stages (e.g. childhood and pregnancy) where this issue is more pertinent and the combination of the knowledge base (e.g. depth of knowledge on effects), the failure to achieve the threshold value in a number of coastal areas (e.g. where recreational fishing most commonly occurs), and the likely occurrence of areas with elevate concentration that may not be fully covered by evaluation such as this indicator are understood to be behind the precautionary guidance.
5 Confidence
The overall confidence of the evaluation is moderate, with a few (2) occurrences of low confidence in certain assessment units (Figure 9 and further details in Annex 1).
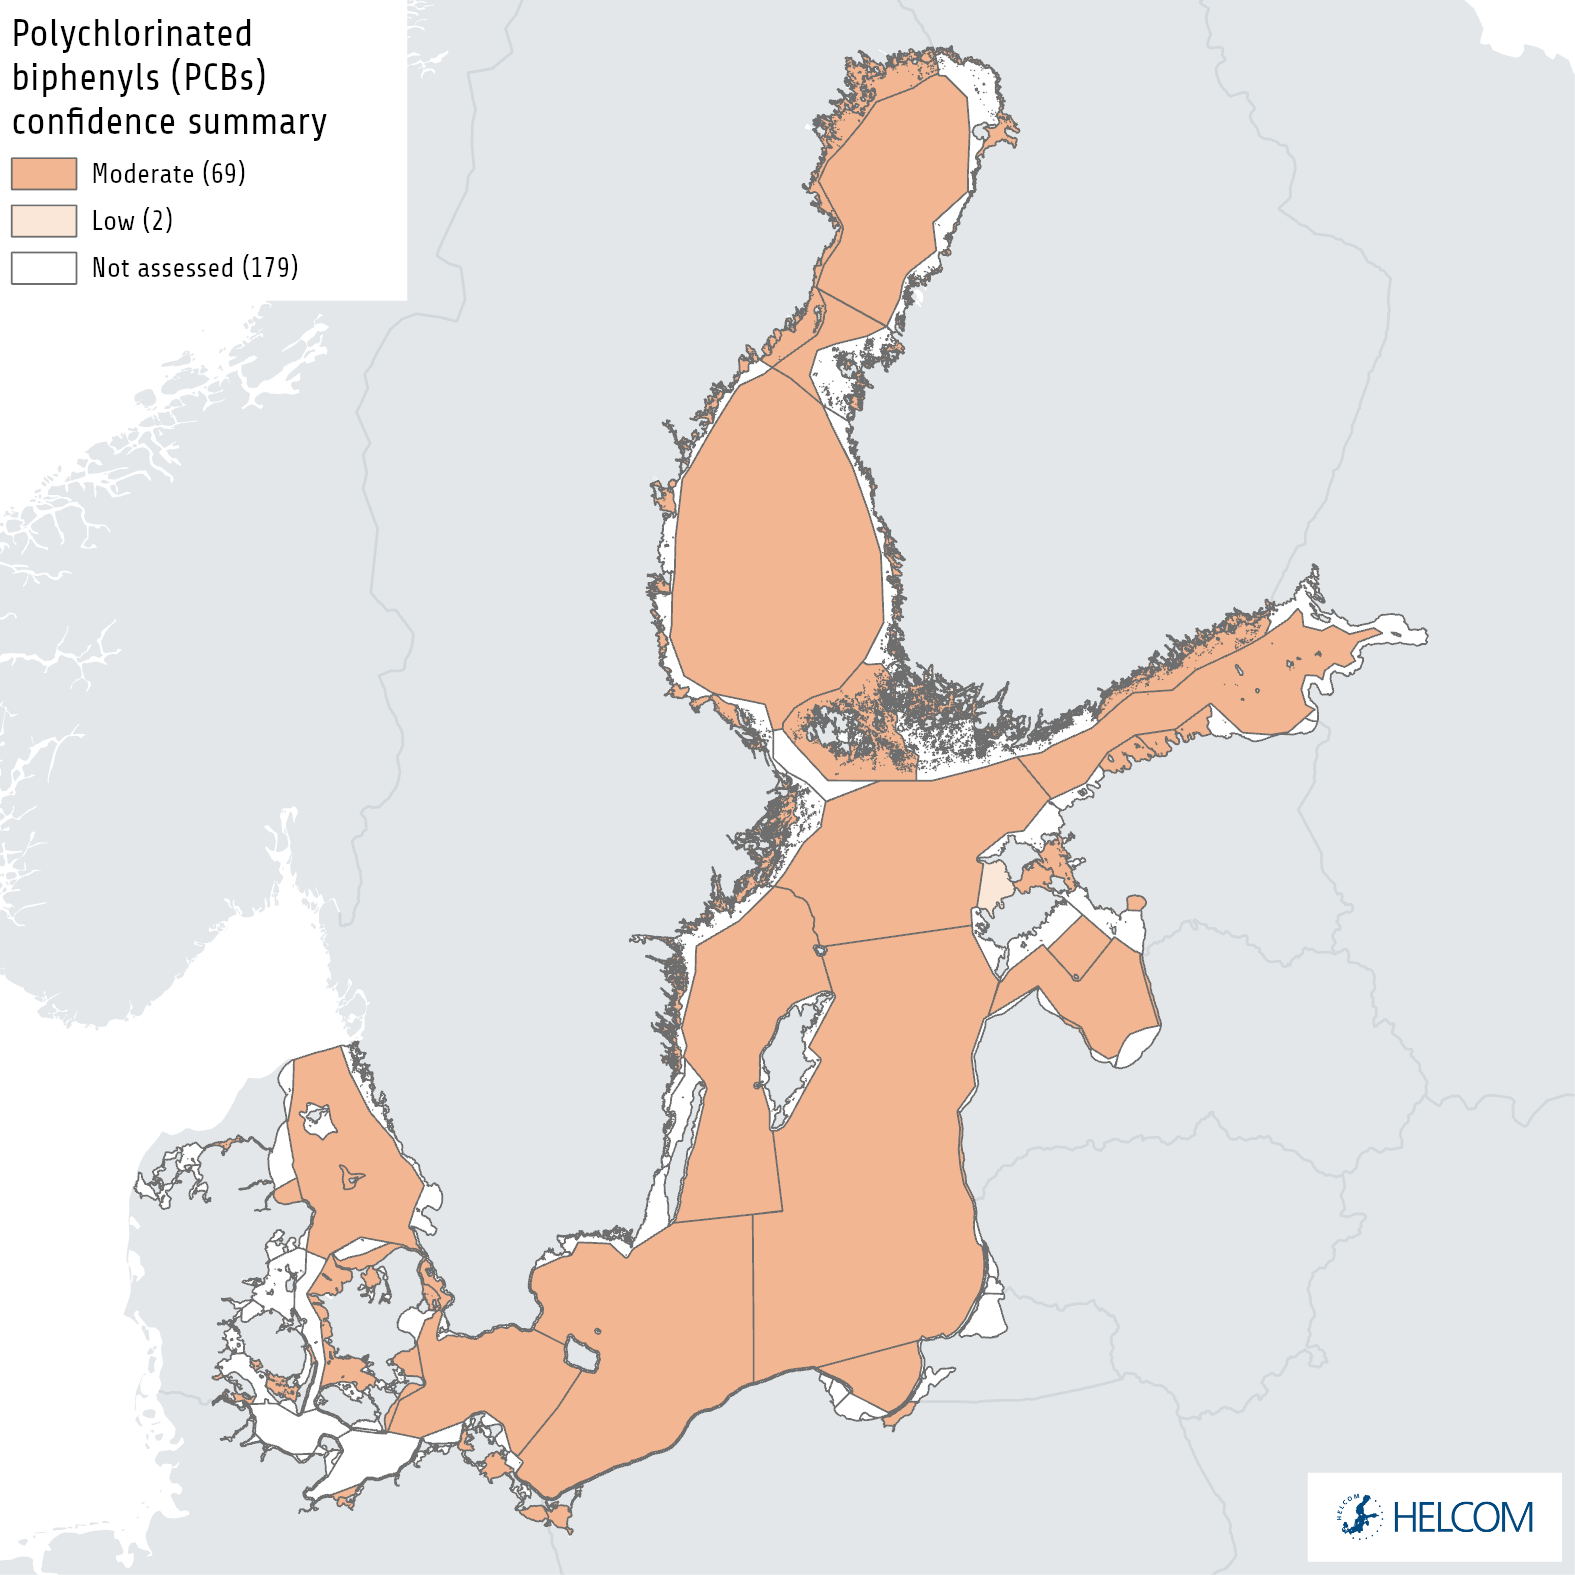
Figure 9. Map presenting the confidence in the overall evaluation based on a OOAO summary of confidence across all monitored matrices (see Annex 1). The evaluation is carried out using Level 4 HELCOM assessment units (defined in the HELCOM Monitoring and Assessment Strategy Annex 4).
The geographical resolution of the current dataset for the coverage of the whole Baltic Sea is high, though the indicator and the confidence in it would be further improved by increased temporal monitoring in certain instances. No detailed geographical studies to investigate the variability in dioxin and furan concentrations across the whole region have yet been carried out.
It should also be noted that the majority of the monitoring stations are selected as reference stations and potential local problems with PCBs, dioxins and furans may occur in areas not included in the current monitoring programmes.
The confidence of the threshold for the Sum of 6 PCBs is low as this value is derived from the food safety directive and is not an environmental quality standard, which is not available.
6 Drivers, Activities, and Pressures
Drivers are often large and complex issues that are difficult to quantify, though in certain instances proxies can be utilised to express them or changes in them. A driver for example may relate to globalisation or political will and, while difficult to quantify in terms of specific relevance to an indicator, changes in drivers can catalyse changes in activities that will consequently influence pressures for example resulting in altered levels of shipping and the subsequent pressures for that activity. A brief overview of key pressures and activities is provided in Table 4.
PCBs are synthetic chemicals and do not occur naturally in the environment. Due to their properties, PCBs have been used in a wide variety of applications and manufacturing processes, especially as plasticizers, insulators and flame-retardants. They are widely distributed in the environment through, for example, inappropriate handling of waste material or leakage from transformers, condensers and hydraulic systems. According to some estimates, the total global production of PCBs from 1930 until the bans that were implemented in most countries by the 1980s had already been in the order of 1.5 million tons.
Dioxins (PCDD/Fs) were never produced intentionally, but they are minor impurities in several chlorinated chemicals (e.g., PCBs, chlorophenols, hexachlorophene, etc.), and are formed in several industrial processes and from most combustion processes, such as municipal waste incineration and small-scale burning under poorly controlled conditions. Formerly, pulp bleaching using chlorine gas was an important source of PCDD/Fs.
Numerous recent reports and papers have shown differences in PCDD/F and dl-PCB concentrations in Baltic herring, sprat and salmon between the Baltic Sea basins (e.g., Bignert et al., 2017; Karl et al., 2010). Higher concentrations have been detected in the northern basins where dioxin and dl-PCB levels in herring exceed established maximum limit concentrations for human consumption. Regional variation within a sub-basin has been found in the Swedish coastal region of the Bothnian Sea (Bignert et al., 2007), where the concentrations are higher than in other Swedish areas (Bignert et al., 2017). Since the atmospheric deposition pattern (lowest in the north) is different compared to the patterns detected in the concentrations in fish (generally highest in the north), other factors or sources than atmospheric deposition are thus likely to be involved. The reasons remain unclear, but higher historical PCDD/F discharges from point sources in the northern basins have been suggested. In general, the contribution from the dl-PCBs to the TEQ is substantial and seems to increase the further north in the Baltic region the samples are collected.
Table 4. Brief summary of relevant pressures and activities with relevance to the indicator.
| | General | MSFD Annex III, Table 2a |
| Strong link | Substances, litter and energy
– Input of other substances (e.g. synthetic substances, non-synthetic substances, radionuclides) – diffuse sources, point sources, atmospheric deposition, acute events |
|
| Weak link |
7 Climate change and other factors
Climate change in the Baltic Sea region is expected to have significant impacts on key processes in the marine environment (HELCOM and Baltic Earth 2021). While there are relatively few studies that fully explore the impacts of such changes on hazardous substances direct parameters such as changes in water temperature, atmospheric deposition, precipitation, river run off and sediment transportation could all alter the flow of contaminants to and within the marine environment. In addition, alterations in metabolic aspects as well as food web structure and function may also alter the transfer of contaminants within the ecosystem and food web and thus alter the levels of bioaccumulation (as well as possible effects).
8 Conclusions
Overall, the concentrations of PCBs, dioxins and furans achieve Good Environmental Status (GES) for all but one of the evaluated open sea sub-basins, however the outcomes in coastal areas are more mixed with circa 50% of evaluated assessment units being sub-GES.
8.1 Future work or improvements needed
The indicator is generally fully operational but increased spatial and temporal monitoring would benefit the indicator and reduce uncertainties.
9 Methodology
The overall methodology is set out below.
9.1 Scale of assessment
PCBs, dioxin and furan are considered relevant substances to evaluate in the entire Baltic Sea area. Concentrations may be higher in the coastal areas compared to the offshore areas, and therefore the indicator is evaluated on HELCOM assessment unit scale 4.
The assessment units are defined in the HELCOM Monitoring and Assessment Strategy Annex 4.
9.2 Methodology applied
The data may require transformation into the relevant unit and base for the threshold value which is µg kg-1 wet weight. Ideally, the data should be expressed in the same matrix which for the purposes of the indicator evaluation ought to be whole body concentrations in fish at a trophic level of 4.5 with a lipid content of 5%.
The majority of the dioxin, furan and PCB data reported is analysed in muscle tissue. However, the EC Guidance Document No 32 (European Commission 2014) suggests that the assumption can be made that fat soluble compounds would be evenly distributed in the lipid within the whole organism. With this assumption, a whole body concentration would be possible to calculate from any analysed organ as long as the lipid content in the sample is known/ analysed. To harmonize the evaluation across the entire Baltic Sea region, it is recommended to calculate the concentrations into corresponding values to a fish with a general fat content of 5%.
Data is to be normalised to lipid content according to the following equation, where Concnorm, lipid is lipid normalised concentration, Concmeasurement is the original value expressed in wet weight (ww) and lipid contentsample is the actual lipid content of the sample:
 In case information on lipid content is absent in the data, general fat content values derived in regional studies for the sampled matrix can be applied.
For this evaluation no adjustment for trophic level has been done but is something that needs to be considered in future evaluations according to recommendations below.
The EC guidance document (European Commission 2014) recommends making recalculations so the concentrations are standardized to a fish at a trophic level of 4.5 for marine ecosystems to standardise for the biomagnification effect.
Statistical evaluation
The evaluation protocol is structured in three main parts, 1) changes in log concentrations over time are modelled, 2) check for compliance against threshold value and evidence for temporal change of contaminant concentration per station and 3) a spatial aggregation of status per assessment unit.
It should be noted that the evaluation protocol makes the assumption that monitoring data stems from the same monitoring stations during consecutive years. The stations used by the protocol are defined in the ICES Station Dictionary. Stations with similar station name are grouped together, but it is also possible to define a group of stations with different names to be defined as the same station in the Station Dictionary. Usually a station is defined in the Station Dictionary with coordinates and a valid box around these coordinates, but coordinates outside of the box will only give a warning when reporting the data, and are not used in the actual data extraction.
Overview
Time series of contaminant concentrations are assessed in three stages:
- The concentrations are log transformed and changes in the log concentrations over time are modelled using linear mixed models. The type of temporal change that is considered depends on the number of years of data:
-
- 1-2 years: no model is fitted because there are insufficient data
- 3-4 years: concentrations are assumed to be stable over time and the mean log concentration is estimated
- 5-6 years: a linear trend in log concentration is fitted
- 7+ years: more complex (smooth) patterns of change over time are modelled
-
- The fitted models are used to assess status against available threshold value and evidence of temporal change in contaminant levels in the last twenty years
- The fitted models are also used for spatial aggregation to assess status against available threshold value and evidence of temporal change in contaminant levels on a scale 4 level HELCOM assessment unit.
These stages are described in more detail in the link below. There is also information on how the methodology is adapted when there are ‘less-than’ measurements, i.e. some concentrations are reported as below the detection limit, and missing uncertainties, i.e. the analytical variability associated with some of the concentration measurements was not reported.
Assessment methodology for contaminants in biota, sediment and water
All initial data is handled in a highly precautionary manner to further ensure that the risk of false positives is minimalised. For all initial data the 95% confidence limit on the mean concentration, based on the uncertainty seen in longer time series throughout the HELCOM area, is used. Applying a precautionary approach, the 90% quantile (psi value, Ψ) of the uncertainty estimates in the longer time series from the entire HELCOM region are used. The same approach is used for time series with three or more years of data, but which are dominated by less-than values (i.e., no parametric model can be fitted). The mean concentration in the last monitoring year (meanLY) is obtained by: restricting the time series to the period 2016-2021 (the last six monitoring years), calculating the median log concentration in each year (treating ‘less-than’ values as if they were above the limit of detection), calculating the mean of the median log concentrations, and then back-transforming (by exponentiating) to the concentration scale. The upper one-sided 95% confidence limit (clLY) is then given by:
 where n is the number of years with data in the period 2016-2021 (HELCOM 2018).
9.3 Monitoring and reporting requirements
Monitoring methodology
Monitoring of PCBs, dioxins and furans in the Contracting Parties of HELCOM is described on a general level in the HELCOM Monitoring Manual in the sub-programme Concentration of Contaminants.
Specific monitoring guidelines have previously been documented in the HELCOM COMBINE manual, and are currently under review with the aim of being updated and included in the HELCOM Monitoring Manual.
Current monitoring
The monitoring activities relevant to the indicator that are currently carried out by HELCOM Contracting Parties are described in the HELCOM Monitoring Manual.
Sub-programme: monitoring concepts table for biota
The monitoring of temporal trends of PCBs is considered adequate in the Baltic Sea. There are no big gaps in the monitoring programme of PCBs. The monitoring of PCBs focuses on the seven classical “ICES 7” congeners: CB-28, CB-52, CB-101, CB-118, CB-138, CB-153 and CB-180. The time series stations use highly mobile sample species (herring, cod, common dab, eelpout, European sprat, European perch and flounder) which makes the network of time series stations as geographically representative for HELCOM sub-basins and coastal areas.
Monitoring of temporal trends of dioxin and furan is carried out by a few countries only.
Description of optimal monitoring
Monitoring stations for dioxins and furans seem to be lacking from the Åland Sea, Bay of Mecklenburg, Gulf of Riga, Kiel Bay and the Sound and increasing the spatial coverage of the monitoring program would allow for higher confidence evaluations from a scientific point of view. For temporal trend monitoring an annual sampling is required to detect trends more adequate than if sampling is only performed every second or third year. The present lack of monitoring stations and data for PCDD/Fs might also be a result of the high analytical costs which are contradicting the scientific demands.
Therefore, time series of dioxin and furan concentrations in fish are missing or too short to enable evaluation for several sub-basins in the Baltic Sea region.
10 Data
The data and resulting data products (e.g., tables, figures and maps) available on the indicator web page can be used freely given that it is used appropriately and the source is cited.
Result: Polychlorinated biphenyls, dioxins and furans in biota
Result: Polychlorinated biphenyls, dioxins and furans – dioxins in biota
Data: Hazardous substances in biota
Data: Hazardous substances in sediment
Data: Hazardous substances in water
Data are extracted from the HELCOM COMBINE database, hosted by ICES. The COMBINE data stem from regular environmental monitoring programmes of the coastal countries.
11 Contributors
Berit Brockmeyer, German Federal Maritime and Hydrographic Agency and Detlef Schulz-Bull, Leibniz Institute for Baltic Sea Research.
Rob Fryer, Marine Scotland (OSPAR).
HELCOM Expert Network on Hazardous Substances
HELCOM Secretariat: Owen Rowe, Deborah Shinoda, Joni Kaitaranta and Jana Wolf.
12 Archive
This version of the HELCOM core indicator report was published in April 2023:
The current version of this indicator (including as a PDF) can be found on the HELCOM indicator web page.
Earlier versions of this indicator are available at:
Polychlorinated biphenyls PCBs, dioxin and furan HELCOM core indicator 2018 (pdf)
HOLAS II component – core indicator report – web-based version July 2017 (pdf)
13 References
Bignert, A., Danielsson, S., Faxneld, S., Ek, C., Nyberg, E. 2017. Comments Concerning the National Swedish Contaminant Monitoring Programme in Marine Biota, 2017. 4:2017, Swedish Museum of Natural History, Stockholm, Sweden.
Bignert, A., Nyberg, E., Sundqvist, K.L., Wiberg, K., 2007. Spatial variation in concentrations and patterns of the PCDD/F and dioxin-like-PCB content in herring from the northern Baltic Sea. J. Environ. Monit. 9, 550–556.
Burreau S., Zebühr, Y., Bromar, D., and Ishaq, R. 2006. Biomagnification of PBDEs and PCBs in food webs from the Baltic Sea and northern Atlantic ocean. Sci. Tot. Environ. 366: 659–672.
Bäcklin, B-M., Madej, A., and Forsberg, M. 2010. Histolofy of ovaries and uteri and levels of plasma progesterone, ostradiol-17β and oestrone sulphate during the implantation period in mated and gonaotrophin-releasing hormone-treated mink (mustela vison) axposed to polychlorinated biphenlys. J. Appl. Tox. 17:297–306.
Carpenter, D., Arcaro, K., Bush, B., Niemi, W., Pang, S., and Vakharia, D. 1998. Human health and chemical mixtures: and overview. Env. Health Persp. 10+:1263–1270.
Carpenter, D. 2006. Polychlorinated biphenlys (PCBs): routes of exposure and effects on human health. Rev. Env. Health. 21, No 1.
EC, 2000. Directive 2000/76/EC of the European Parliament and of the Council of 4 December 2000 on the incineration of waste. Official Journal of the European Union L 332/91.
EC, 2001. Community Strategy for Dioxins, Furans and Polychlorinated Biphenyls. Communication from the Commission to the Council, the European Parliament and the Economic and Social Committee 593 final.
EC, 2006. Commission regulation (EC) No 1881/2006 of 19 December 2006 setting maximum levels for certain contaminants in foodstuffs. Official Journal of the European Union L 364/5.
EC, 2008. Directive 2008/1/EC of the European Parliament and of the Council of 15 January 2008 concerning integrated pollution prevention and control. Official Journal of the European Union L 24/8.
EC, 2010. Directive 2010/75/EU of the European Parliament and of the Council of 24 November 2010 on industrial emissions (Integrated Pollution Prevention And Control). Official Journal of the European Union L 334/17.
EC, 2011. Commission Regulation (EU) No 1259/2011 of 2 December 2011 amending Regulation (EC) No 1881/2006 as regards maximum levels for dioxins, dioxin-like PCBs and non dioxin-like PCBs in foodstuffs. Official Journal of the European Union L 320/18.
EC, 2013. Directive 2013/39/EU of the European Parliament and of the Council of 12 August 2013 amending Directives 2000/60/EC and 2008/105/EC as regards priority substances in the field of water policy. Official Journal of the European Union L 226/1.
EC, 2014. European Commission Guidance Document No 32.
Helander, B., Olsson, A., Bignert, A., Asplund, L., Litzén, K. 2002. The role of DDE, PCB, Coplanar PCB and eggshell parameters for reproduction in the white-tailed se eagle (Haliaeetus albicilla) in Sweden Ambio 31:387–403.
HELCOM, 2010a. Implementing HELCOM’s objective for hazardous substances, Recommendation 31E/1.
HELCOM, 2010b. Hazardous substances in the Baltic Sea – An integrated thematic assessment of hazardous substances in the Baltic Sea. Balt. Sea Environ. Proc. No. 120B. Available at: www.helcom.fi/publications
HELCOM and Baltic Earth (2021) Climate Change in the Baltic Sea 2021 Fact Sheet. https://helcom.fi/wp-content/uploads/2021/09/Baltic-Sea-Climate-Change-Fact-Sheet-2021.pdf
Karl, H., Bladt, A., Rottler, H., Ludwigs, R., Mathar, W., 2010. Temporal trends of PCDD, PCDF and PCB levels in muscle meat of herring from different fishing grounds of the Baltic Sea and actual data of different fish species from the Western Baltic Sea. Chemosphere 78:106–112.
OSPAR, 2010a. List of Chemicals for Priority Action, Ref. nr 2004-12.
Quass, U., Fermann, M., Broker, G., 2004. The European dioxin air emission inventory project – Final results. Chemosphere 54:1319–1327.
Tuomisto, J.T., Asikainen, A., Meriläinen, P. et al. 2020. Health effects of nutrients and environmental pollutants in Baltic herring and salmon: a quantitative benefit-risk assessment. BMC Public Health 20, 64.
Van den Berg, M., Birnbaum, L., Bosveld, A.T.C., Brunstrom, B., Cook, P., Feeley, M., Giesy, J.P., Hanberg, A., Hasegawa, R., Kennedy, S.W., Kubiak, T., Larsen, J.C., van Leeuwen, F.X.R., Liem, A.K.D., Nolt, C., Peterson, R.E., Poellinger, L., Safe, S., Schrenk, D., Tillitt, D., Tysklind, M., Younes, M., Waern, F., Zacharewski, T., 1998. Toxic equivalency factors (TEFs) for PCBs, PCDDs, PCDFs for humans and wildlife. Environ. Health Perspect. 106:775–792.
Van den Berg, M., Birnbaum, L.S., Denison, M., De Vito, M., Farland, W., Feeley, M., Fiedler, H., Hakansson, H., Hanberg, A., Haws, L., Rose, M., Safe, S., Schrenk, D., Tohyama, C., Tritscher, A., Tuomisto, J., Tysklind, M., Walker, N., Peterson, R.E., 2006. The 2005 World Health Organization reevaluation of human and mammalian toxic equivalency factors for dioxins and dioxin-like compounds. Toxicol. Sci. 93:223–241.
14 Other relevant resources
EC, 2000. Directive 2000/60/EC of the European Parliament and of the Council establishing a framework for the Community action in the field of water policy. Official Journal of the European Union L 327.
EC, 2009. Common implementation strategy for the Water Framework Directive (2000/60/EC), Guidance Document no.19, Guidance on surface water chemical monitoring under the Water Framework Directive. Technical Report-2009-025.
EC, 2016. Commission Recommendation (EU) 2016/688 of 2 May 2016 on the monitoring and management of the presence of dioxins and PCBs in fish and fishery products from the Baltic region. Official Journal of the European Union L 118/16.
EFSA (2005) Opinion of the Scientific Panel on contaminants in the food chain [CONTAM] related to the presence of non dioxin-like polychlorinated biphenyls (PCB) in feed and food. https://doi.org/10.2903/j.efsa.2005.284.
Isosaari, P., Kankaanpaa, H., Mattila, J., Kiviranta, H., Verta, M., Salo, S., Vartiainen, T., 2002. Spatial distribution and temporal accumulation of polychlorinated dibenzo-p-dioxins, dihenzofurans, and Biphenyls in the Gulf of Finland. Environ. Sci. Technol. 36:2560–2565.
Jensen, J.N. 2012. Temporal trends in contaminants in Herring in the Baltic Sea in the period 1980-2010. Baltic Sea Environment Fact Sheet 2012. Available at: http://www.helcom.fi/BSAP_assessment/ifs/ifs2012/en_GB/contaminants/
Karl, H., Ruoff, U., 2007. Dioxins, dioxin-like PCBs and chloroorganic contaminants in herring, Clupea harengus, from different fishing grounds of the Baltic Sea. Chemosphere 67_90–95.
Mehtonen, J. 2009 Hazardous substances of specific concern to the Baltic Sea – Final report of the Hazardous project. Balt. Sea Environ. Proc. No. 119.
Olsson, Bignert, Eckhéll, Johnsson. 2000. Comparison of temporal trends (1940s-1990s) of DDT and PCB in Baltic sediment and biota in relation to eutrophication. Ambio 29(4): 19–201.
OSPAR, 2010. Agreement on CEMP assessment criteria for the QSR 2010, OSPAR Commission, Ref no 2009-2.
SCHER, 2011. Scientific Committee on Health and Environmental Risks. Opinion on “Chemicals and the Water Framework Directive: Draft environmental quality standards”. DG Health & Consumer Protection, European Commission.
Schneider, R. and Leipe, T. 2007. Historical and recent contents of PCB and organochlorine pesticides in sediments from Baltic Sea Basins. ICES CM 2007 / I:08, 1-15Sundqvist, K.L., Tysklind, M., Geladi, P., Cato, I., Wiberg, K., 2009. Congener fingerprints of tetra- through octa-chlorinated dibenzo-p-dioxins and dibenzofurans in Baltic surface sediments and their relations to potential sources. Chemosphere 77:612–620.
Szlinder-Richert, J., Barska, I., Usydus, Z., Ruczynska, W., Grabic, R., 2009. Investigation of PCDD/Fs and dl-PCBs in fish from the southern Baltic Sea during the 2002–2006 period. Chemosphere 74:1509–1515.
Verta, M., Salo, S., Korhonen, M., Assmuth, T., Kiviranta, H., Koistinen, J., Ruokojarvi, P., Isosaari, P., Bergqvist, P.A., Tysklind, M., Cato, I., Vikelsoe, J., Larsen, M.M., 2007. Dioxin concentrations in sediments of the Baltic Sea – A survey of existing data. Chemosphere 67, 1762–1775.
Annex 1 Assessment unit level confidence summary
Confidence is evaluated per assessment unit based on a relative evaluation of following parameters for the indicator: 1) spatial component, 2) temporal component, 3) methodological component, and 4) the evaluation component. Despite the common approach applied with other indicators the information set out here is not directly comparable as it only focusses on an evaluation within each indicator (i.e. is relative only between the evaluated assessment units for) and it furthermore only addresses the evaluated units. More general information related to overarching confidence and required improvements are detailed in the main report.
The confidence for each component was applies based on a categorical approach using high, moderate and low. To achieve the overall summary confidence a score of 0.25 was applied to low, 0.5 to moderate and 1.0 to high with an average value calculated across the components and the same scores used to then select he final overall category.
Spatial component: Open sea and coastal areas were treated separately due to the scale of sea area being vastly different. The area (km2) for each evaluated assessment unit was divided by the total number of stations in the assessment unit and the resulting area per station was used to divide into three categories, roughly interpreted as stations addressing small, medium or large areas. If a large number (relatively) of stations were still available despite the area being large an increase of 1 category was applied.
Temporal component: The presence of ‘full’ and/or ‘initial’ data series was utilised to evaluate this. Where only a single initial data series/station was present a category of low was applied, where two initial data series were available a category of moderate was applied, where a single full data series was present a category of moderate was applied, and where two or more full data series were present a category of high was applied.
Methodological component: A score of high is applied to all evaluated assessment units since the indicator is evaluated using the MIME tool and applies a regionally agreed methodology and threshold values on national monitoring data.
Evaluation component: The standard error generated within the MIME assessment tool is utilised as a proxy for this component. In simple terms the basis of this evaluation is that standard error can be roughly equated to a coefficient of variance. This therefore provides a general confidence evaluation of the underlying data and variation within it. A categorical approach was applied where standard error values >0.70 were scored as low, 0.4-0.7 were scored as moderate and <0.4 were scored as high.
The confidence is provided for sediments and biota below (Annex 1 – Tables 1-2).
The overall confidence for the OOAO status evaluation is also generated using a OOAO approach from these tables below, suing the overall category.
Annex 1 – Table 1. Summary table showing categorical confidence per component and overall, for non-dioxin like PCB in biota.
| Assessment Unit | Spatial | Temporal | Methodological | Evaluation | Overall |
| DEN-006 | High | High | High | Low | Moderate |
| DEN-024 | High | Moderate | High | Moderate | Moderate |
| DEN-025 | High | Low | High | Low | Moderate |
| DEN-028 | Moderate | Low | High | Low | Moderate |
| DEN-029 | High | Low | High | Low | Moderate |
| DEN-044 | High | Moderate | High | Low | Moderate |
| DEN-046 | Moderate | Low | High | Low | Moderate |
| DEN-085 | High | Low | High | Low | Moderate |
| DEN-087 | High | Low | High | Low | Moderate |
| DEN-095 | High | Low | High | Low | Moderate |
| DEN-102 | High | Low | High | Low | Moderate |
| DEN-110 | High | High | High | Moderate | Moderate |
| DEN-114 | High | Low | High | Low | Moderate |
| DEN-123 | High | Low | High | Low | Moderate |
| DEN-137 | High | High | High | Moderate | Moderate |
| DEN-138 | High | Low | High | Low | Moderate |
| DEN-139 | High | Low | High | Low | Moderate |
| DEN-146 | High | Low | High | Low | Moderate |
| DEN-160 | High | Moderate | High | Moderate | Moderate |
| DEN-200 | Moderate | Low | High | Low | Moderate |
| DEN-204 | High | Low | High | Low | Moderate |
| DEN-206 | Moderate | Moderate | High | Moderate | Moderate |
| DEN-214 | High | Moderate | High | Low | Moderate |
| DEN-235 | High | High | High | Moderate | Moderate |
| EST-002 | Moderate | Low | High | Low | Moderate |
| EST-003 | Moderate | Low | High | Low | Moderate |
| EST-005 | Moderate | Low | High | Low | Moderate |
| EST-010 | Low | Low | High | Low | Low |
| EST-013 | High | Moderate | High | Low | Moderate |
| EST-014 | Moderate | Moderate | High | Low | Moderate |
| EST-016 | Moderate | Low | High | Low | Moderate |
| EST-019 | Low | Moderate | High | Low | Moderate |
| FIN-001 | Low | Low | High | Low | Low |
| FIN-003 | High | Moderate | High | Moderate | Moderate |
| FIN-004 | Low | Moderate | High | Low | Moderate |
| FIN-005 | Low | Moderate | High | Low | Moderate |
| FIN-006 | Moderate | Low | High | Low | Moderate |
| FIN-008 | Moderate | Moderate | High | Low | Moderate |
| FIN-010 | High | High | High | Moderate | Moderate |
| FIN-014 | Low | Moderate | High | Low | Moderate |
| GER-002 | High | Moderate | High | Low | Moderate |
| GER-004 | High | Moderate | High | Low | Moderate |
| GER-011 | High | Moderate | High | Low | Moderate |
| GER-013 | High | Moderate | High | Low | Moderate |
| GER-020 | High | High | High | Moderate | Moderate |
| LAT-001 | High | Low | High | Low | Moderate |
| LAT-004 | High | Low | High | Low | Moderate |
| POL-002 | High | Moderate | High | Low | Moderate |
| POL-003 | High | Moderate | High | Low | Moderate |
| POL-019 | High | Low | High | Low | Moderate |
| SWE-011 | Low | Moderate | High | Low | Moderate |
| SWE-012 | Moderate | High | High | Moderate | Moderate |
| SWE-016 | Moderate | High | High | Moderate | Moderate |
| SWE-018 | Low | Moderate | High | Low | Moderate |
| SWE-020 | High | Moderate | High | Low | Moderate |
| SWE-021 | Moderate | High | High | Moderate | Moderate |
| SWE-022 | Moderate | High | High | Moderate | Moderate |
| SWE-023 | Low | Moderate | High | Low | Moderate |
| SEA-001 | Moderate | High | High | Moderate | Moderate |
| SEA-003 | High | Low | High | Low | Moderate |
| SEA-006 | High | High | High | High | High |
| SEA-007 | Moderate | High | High | High | Moderate |
| SEA-008 | Moderate | Moderate | High | Low | Moderate |
| SEA-009 | Moderate | High | High | Moderate | Moderate |
| SEA-010 | Low | High | High | Moderate | Moderate |
| SEA-011 | Moderate | Low | High | Low | Moderate |
| SEA-012 | Low | High | High | Moderate | Moderate |
| SEA-013 | High | High | High | Moderate | Moderate |
| SEA-015 | Moderate | High | High | High | Moderate |
| SEA-016 | Moderate | Low | High | Low | Moderate |
| SEA-017 | Low | Moderate | High | Low | Moderate |
Annex 1 – Table 2. Summary table showing categorical confidence per component and overall, for Dioxins, furans and dl-PCBs in biota.
| Assessment Unit | Spatial | Temporal | Methodological | Evaluation | Overall |
| DEN-006 | High | Moderate | High | Moderate | Moderate |
| DEN-024 | High | Low | High | Moderate | Moderate |
| DEN-044 | High | Low | High | Moderate | Moderate |
| DEN-095 | High | Low | High | Moderate | Moderate |
| DEN-102 | High | Low | High | Moderate | Moderate |
| DEN-110 | High | Moderate | High | Moderate | Moderate |
| DEN-114 | High | Low | High | Moderate | Moderate |
| DEN-123 | High | Low | High | Moderate | Moderate |
| DEN-137 | High | Low | High | Moderate | Moderate |
| DEN-138 | High | Low | High | Moderate | Moderate |
| DEN-139 | High | Low | High | Moderate | Moderate |
| DEN-160 | High | Moderate | High | Moderate | Moderate |
| DEN-200 | Moderate | Low | High | Moderate | Moderate |
| DEN-206 | Moderate | Low | High | Moderate | Moderate |
| DEN-214 | High | Low | High | Moderate | Moderate |
| EST-002 | Moderate | Low | High | Moderate | Moderate |
| EST-003 | Moderate | Low | High | Moderate | Moderate |
| EST-005 | Moderate | Low | High | Moderate | Moderate |
| EST-010 | Moderate | Low | High | Moderate | Moderate |
| EST-013 | High | Low | High | Moderate | Moderate |
| EST-014 | Moderate | Low | High | Moderate | Moderate |
| EST-016 | Moderate | Low | High | Moderate | Moderate |
| EST-019 | Moderate | Low | High | Moderate | Moderate |
| FIN-001 | Moderate | Low | High | Moderate | Moderate |
| FIN-003 | Moderate | Moderate | High | Moderate | Moderate |
| FIN-004 | Low | Low | High | Moderate | Moderate |
| FIN-005 | Moderate | Low | High | Moderate | Moderate |
| FIN-006 | Moderate | Low | High | Moderate | Moderate |
| FIN-008 | Moderate | Low | High | Moderate | Moderate |
| FIN-010 | High | Moderate | High | Moderate | Moderate |
| FIN-014 | Low | Moderate | High | Moderate | Moderate |
| GER-002 | High | Moderate | High | Moderate | Moderate |
| GER-011 | High | Moderate | High | Moderate | Moderate |
| GER-020 | High | Low | High | Moderate | Moderate |
| SWE-011 | Low | Moderate | High | Moderate | Moderate |
| SWE-012 | Moderate | Moderate | High | Moderate | Moderate |
| SWE-016 | Moderate | High | High | Moderate | Moderate |
| SWE-018 | Moderate | Moderate | High | Moderate | Moderate |
| SWE-020 | High | Moderate | High | Moderate | Moderate |
| SWE-021 | Moderate | High | High | Moderate | Moderate |
| SWE-022 | Moderate | High | High | High | Moderate |
| SWE-023 | Low | Moderate | High | Moderate | Moderate |
| SEA-001 | Moderate | High | High | Moderate | Moderate |
| SEA-006 | Moderate | High | High | High | Moderate |
| SEA-007 | Moderate | High | High | High | Moderate |
| SEA-010 | Moderate | High | High | Moderate | Moderate |
| SEA-012 | Moderate | High | High | Moderate | Moderate |
| SEA-013 | High | Moderate | High | High | Moderate |
| SEA-015 | Moderate | High | High | High | Moderate |
| SEA-016 | High | Low | High | Moderate | Moderate |
| SEA-017 | Low | Low | High | Moderate | Moderate |