 PFOS
PFOS
2 Relevance of the indicator
PFOS is a persistent, bioaccumulative and toxic compound with possible effects on the immune, reproductive and developmental systems as well as lipid metabolism in organisms. It is considered a global environmental contaminant. PFOS has been produced since the 1950s and has been used for production of fluoropolymers and to provide grease, oil and water resistance to materials such as textiles, carpets, paper and coatings in general. PFOS has also been used widely in firefighting foams.
Measurements of PFOS concentrations provide information on the contaminant load of the Baltic Sea, the presence of PFOS in biological samples also reflects the bioavailable part of the contaminant. Predators (particularly top predators) and humans are exposed to the contaminant through consumption of the species assessed in this indicator.
2.1 Ecological relevance
Perfluorooctane sulphonate (PFOS), perfluoro octanoic acid (PFOA) and other perfluorinated compounds are considered global environmental contaminants. PFOS and PFOA are chemically and biologically inert and very stable (Poulsen et al. 2005). PFOS meets the P (Persistent) and vP (very Persistent) criteria due to slow degradation. PFOS is also bioaccumulative (B) and toxic (T) (OSPAR 2005). PFOA is considered very persistent (vP) and toxic (T), but not bioaccumulative (Van der Putte et al. 2010). It has a capacity to undergo long-range transportation.
PFOS related substances and PFOA are members of the larger family of perfluoroalkylated substances (PFAS). Perflurorooctanesulfonyl fluoride (POSF) is used to make PFOS and PFOS-based compounds. The POSF-derived substances (PFOS-related compounds) ultimately degrade to form PFOS. Some 100–200 PFOS-related compounds have been identified (KEMI 2006). PFOS binds to blood proteins and bioaccumulates in the liver, egg yolks, serum, and gall bladder unlike most persistent organic pollutants that typically accumulate into fat (Renner 2001; Nordén et al. 2013; Goeritz et al. 2013; Shi et al. 2012).
PFOS has been shown to disturb the immune system, development and reproduction (endocrine disruption) of organisms and influence lipid metabolism. It is also suspected to induce liver necrosis. Falandysz et al. (2006) have suggested that the consumption of contaminated fish from the Baltic Sea contributes significantly to human blood levels of perfluoroalkyl compounds.
Due to PFOSs bioaccumulative properties, marine mammals have considerably higher concentrations than marine and freshwater fish, and were found to have the highest PFOS concentrations amongst all Nordic biota (HELCOM 2010). Several hundreds to one thousand μg kg−1 ww of PFOS have been found in the livers of grey seals (in the southern Baltic Proper and Bothnian Sea; Nordic Council of Ministers 2004), harbour seals (Great Belt and the Sound; Nordic Council of Ministers 2004) as well as ringed seals (Bothnian Bay; Kannan et al. 2002). In the eggs of common guillemots (Western Gotland Basin), observed PFOS concentrations have mostly been 500-1000 μg kg−1 ww for the past two decades (Soerensen and Faxneld 2022). An OSPAR risk assessment (OSPAR 2005) on the marine environment concluded that the major area of concern for PFOS is the secondary poisoning of top predators, such as seals and predatory birds.
The evaluations in this core indicator are made based on concentrations mainly measured in fish, usually from reference areas with no point source pollution. The case studies and measurements from marine mammals in the Baltic Sea, highlight that PFOS may pose more severe contamination risks to the Baltic Sea than the current indicator evaluation would suggest.
In recent years, a few studies has been published that together capture the spatial variability of PFAS across most of the Baltic Sea (excluding the Gulf of Finland and the Gulf of Riga) (Ngyuen et al. 2017; Joers et al. 2019). Short chain (C≤9) PFCAs dominated in the surface water with only 10-20% coming from PFOS. PFOS offshore surface water concentrations were found to increase from the Bothnian Bay (0.1-0.9 ng/L) to the Southern Baltic and Belt Sea (0.5-2.5 ng/L; Ngyuen et al. 2017). Both ΣPFAS and PFOA were also found to increase from the Bothnian Bay (1.2-4.7 ng/L and 0.2-0.5 ng/L) to the Southern Baltic and Belt Sea (3.5-14.0 ng/L and 0.6-1.3 ng/L; Ngyuen et al. 2017). PFAS concentrations from along the German coastline (2-9 ng/L) supported the presence of higher concentrations in the South (Joers et al. 2019).
Joseffson et al. (2022) presents PFAS concentrations in Baltic Sea sediments that extent from the Bothnian Bay to the Belt Sea (excluding the Gulf of Finland and the Gulf of Riga). The report presents two full surveys from 2014 and 2020/21. The results show ΣPFAS and PFOS of 0.4-2.5 ug/kg dw and 0.2-1.1 ug/kg dw, respectively, in the Baltic Proper, southern Baltic Sea and North Sea but significantly higher concentrations in the Bothnian Sea and Bay (7-26 ug/kg dw and 3.3-6.6 ug/kg dw, respectively). In the southern Baltic and Kattegat, Joers et al. (2019) found ΣPFAS and PFOS concentrations comparable to the findings by Josefsson et al. (2022) for the same areas. PFOS levels of up to 0.9 μg kg−1 ww have been reported from the Gulf of Finland close to Helsinki (Nodic Council of Ministers, 2004) and of 0.03-0.9 μg kg−1 dw in surface sediments from the Gulf of Gdansk (Falandysz et al. 2012). Along the German Baltic Sea coast, concentrations of PFOS in sediments were in the order of 0.02-0.67 μg kg-1 dw (Theobald et al. 2007). The 8-17 times higher PFAS values in the Bothnian Bay and Sea were dominated by PFOS, PFOA and PFNA, while PFOS and PFUnDA were highest at more southerly stations (Josefsson et al. 2022). The reason for the high concentrations is unknown and the spatial pattern is not mimicked by ΣPFAS or PFOS in water (Ngyuen et al. 2017) or herring (Soerensen and Faxneld 2020)
The most important route of exposure of PFOS for humans is uptake from food (especially fish), drinking water and exposure to indoor dust (FOI 2013).
2.2 Policy relevance
The core indicator on PFOS concentrations addresses the Baltic Sea Action Plan’s (BSAP) hazardous substances segment’s goal of the ‘Baltic Sea unaffected by hazardous substances and litter’ and the underlying ecological objectives ‘Concentrations of hazardous substances close to natural levels’ and ‘All fish safe to eat’. There also relevance to the Biodiversity segment goal of ‘Baltic Sea ecosystem is healthy and resilient’.
The core indicator is relevant to the following specific BSAP commitment:
- ‘Agree to start by 2008 to work for strict restrictions on the use in the whole Baltic Sea catchment area of the Contracting States.’
PFOS is included in the HELCOM list of substances or substance groups of specific concern to the Baltic Sea which was adopted as part of the BSAP.
The core indicator also addresses the following qualitative descriptors of the MSFD for determining good environmental status (European Commission 2008a), in particular being of direct relevance to Descriptor 8 and of significance for Descriptor 9 as set out under the specific Descriptors and Criteria in Commission Decision (EU) 2017/848.
PFOS is included on the revised list of the EU Priority Substances (European Commission 2013) and in the Stockholm Convention list of persistent organic pollutants (POPs), Annex B, which requires the parties to the convention to restrict the production and use of the substance.
The production and use of PFOS has been regulated in some countries (e.g. US, Canada, and the EU), but large-scale PFOS production continues in other parts of the world, e.g. China. PFOS has been produced and used since the 1950s, but due to findings of detectable concentrations in human blood in the general population and negative health effects on living organisms, PFOS was phased out in 2002 by its main producer 3M.
Table 1. Overview of key policy relevance elements.
| Baltic Sea Action Plan (BSAP) | Marine Strategy Framework Directive (MSFD) | |
| Fundamental link | Segment: Hazardous substances and litter goal
Goal: “Baltic Sea unaffected by hazardous substances and litter”
|
Descriptor 8 Concentrations of contaminants are at levels not giving rise to pollution effects.
|
| Complementary link | Segment: Biodiversity
Goal: “Baltic Sea ecosystem is healthy and resilient”
|
Descriptor 9 Contaminants in fish and other seafood for human consumption do not exceed levels established by Union legislation or other relevant standards.
(a) for contaminants listed in Regulation (EC) No 1881/2006, the maximum levels laid down in that Regulation, which are the threshold values for the purposes of this Decision; (b) for additional contaminants, not listed in Regulation (EC) No 1881/2006, threshold values, which Member States shall establish through
|
| Other relevant legislation: |
|
|
2.3 Relevance for other assessments
The status of the Baltic Sea marine environment in terms of contamination by hazardous substances is assessed using several core indicators. Each indicator focuses on one important aspect of the complex issue. In addition to providing an indicator-based evaluation of the status of the Baltic Sea in terms of concentrations of PFOS in the marine environment, this indicator along with the other hazardous substances core indicators are used to achieve an overall assessment of hazardous substances.
3 Threshold values
Good status is achieved when the concentration of perfluorooctane sulphonate (PFOS) in fish is below 9.1 µg/ kg muscle wet weight (PFOS EQS dossier, 2011). An alternative, secondary threshold value at 0.00013 µg/l is set for marine water (PFOS EQS dossier, 2011). While biota is the primary threshold matrix, the environmental status is set based on the lowest status for either matrixes if both biota and water (secondary threshold) is evaluated (Table 2).
The threshold value is an environmental quality standard (EQS), derived at EU level as a substance included on the list of priority substances under the Water Framework Directive (European Commission 2000, 2013). Good environmental status within the MSFD is defined as ‘concentrations of contaminants at levels not giving rise to pollution effects’. A conceptual visualisation is provided in Figure 2.

Figure 2. Good environmental status (GES) is achieved if the concentration of PFOS in fish is below the threshold value of 9.1 µg/ kg muscle wet weight. The threshold value is an environmental quality standard (EQS) derived at EU level as a substance included on the list of priority substances under the Water Framework Directive.
For harmonization purposes the EC Guidance Document No. 32 on biota monitoring (the implementation of EQSbiota) under the WFD was developed (European Commission 2014). This guidance document recommends that the results from the monitoring should be standardized to represent fish at a trophic level of 4, which is an estimate of the general trophic level in commercial fish in Europe. The recommendation to obtain PFOS data in fish at a trophic level of 4 is to adjust the values from monitoring in accordance with trophic magnification factors and trophic level. No such harmonization was done for this evaluation.
Article 3 of the EU Directive on environmental quality standards (EQSD) states that also long-term temporal trends should be assessed for substances that accumulate in sediment and/or biota, such as PFOS (European Commission 2008a). A trend indicates if the status of the environment is improving and approaching the threshold value or if the status is deteriorating.
Table 2. Threshold value for the core indicator addressing PFOS. Underlined supporting parameters represent parameters without which the indicator evaluation cannot be applied. MU = muscle, MU&EP = muscle and skin, LI = liver.
| Indicator | Threshold value | Parameters (PARAM) / Parameter groups (PARGROUP)
(see also http://vocab.ices.dk/) |
Matrix | Species | Matrix | Basis | Supporting parameters and information |
| PFOS | Primary threshold
EQS biota human health 9.1 μg/kg ww |
PARAM = PFOS | Biota | Herring & cod (open sea)
Flounder, sole, eelpout & Perch (coastal) |
MU, MU&EP, (‘fillet’), LI or whole fish | W | (lipid content) |
| Secondary threshold
EQS water EQS AA – 0.00013 µg/l |
Water | WT (All – unfiltered is preference) | Surface water layer (≤ 5.5 m) |
3.1 Setting the threshold value(s)
The EQS for PFOS is based on the QS set for biota to protect human health (9.1 µg/ kg fish ww), defined for edible parts in fish (the fillet consisting of muscle tissue). QSs are derived from ecotoxicological studies to protect freshwater and marine ecosystems from potential adverse effects of chemicals, as well as adverse effects on human health via drinking water and food from aquatic environments. QSs are derived for different protection goals, i.e.: pelagic and benthic communities, top-predators in these ecosystems, and human health. The most stringent of these QSs (in this case QS set for biota to protect human health) is the basis for the EQS (PFOS EQS dossier, 2011).
The alternative secondary threshold value set at 0.00013 µg/l for marine water is derived within the EQS process by using a bioconcentration factor (BCF) and biomagnification factor (BMF) for PFOS and represents the corresponding water concentration to the selected QS biota, secondary poisoning (PFOS EQS dossier, 2011).
To set the PFOS QSs and finally determine the EQS, studies on acute and chronic toxicity effects of PFOS to aquatic life was reviewed. The key studies are presented in the PFOS EQS dossier (2011). These include studies on marine and freshwater algae and aquatic plants, invertebrates, fish, mammals and birds. The human health QS, which was found to be the most stringent of the QSs, was derived based on the mammalian oral toxicity studies with a main focus on results from a subchronic study on the Cynomolgus monkey (Seacat et al, 2002). A tolerable daily intake (TDI) of 0.15 ug/kg bw/day was determined using an uncertainty factor of 200 to the NOAEL of 0.03mg/kg bw/d. The TDI was used as the threshold level (TL) when estimating the QSbiota, hh (µg/ kg fish ww) using the equation from European Commission (2011):
 where the fishery products do not exceed 10% of the TL for a 70 kg human consuming 0.115 kg/d of fishery products.
This EQS only considers PFOS, which has historically been the most widespread PFAS. However, a new indicator focussed on the sum of PFAS is currently being drafted. This indicator will focus on the sum of PFAS present in the environment and include information on the toxicity of the individual PFAS substances (EU, 2021).
4 Results and discussion
The results of the indicator evaluation that underlie the key message map and information are provided below.
4.1 Status evaluation
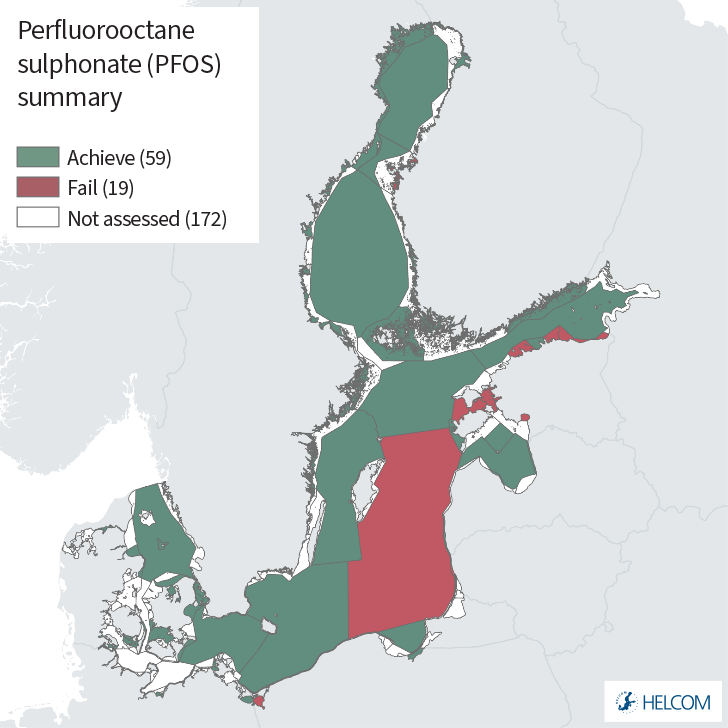
The data presented in this core indicator report were extracted from the HELCOM COMBINE data base, a compilation of data from the monitoring activities reported by all Baltic Sea countries. The report presents information on the current levels of PFOS in biota (fish) and water. Overall, the status of PFOS fail the EQS threshold value (sub-GES) in circa 25% of evaluated assessment units (Figure 1), though failure to achieve GES is generally associated with evaluation of the secondary threshold value for water.
PFOS in biota
All scale 4 assessment units evaluated (including 76% of open sea sub-basins) for the primary matrix, biota, achieved good status during the period 2016-2021, except for coastal assessment unit FIN-006 in The Quark sub-basin. It should be noted that the assessment unit failing the threshold only had one short data series (i.e. ‘initial’ data, see Methodology). The primary threshold value is set to 9.1 µg/kg wet weight in fish muscle (or 9.1 ng/g ww) with the protection goal of human health generally not exceeded (Figure 3).
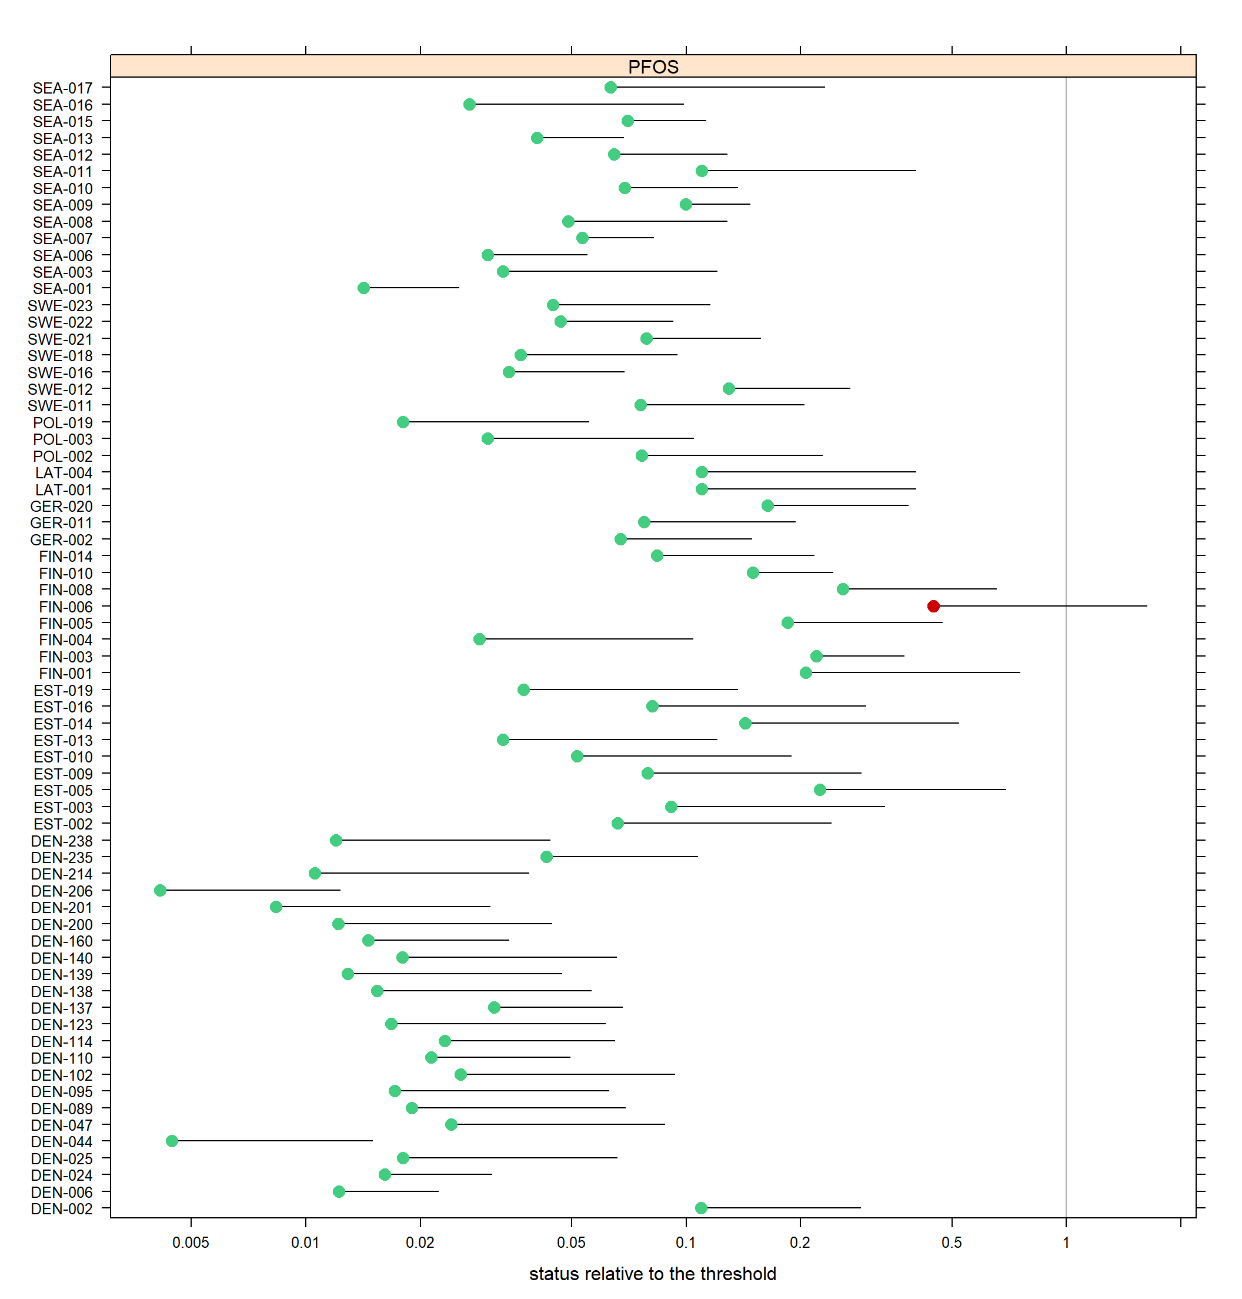
Figure 3: Concentrations of PFOS in fish relative to the threshold value. Filled circles represent a mean value for each assessment unit and the bar represents the upper 95% confidence limit. Green colour indicates that the assessed area achieves the threshold value and red colour that the assessed area fails the threshold.
There are currently smaller areas in the Baltic Sea (including open sea sub-basins) that are not covered by any PFOS monitoring (Figure 4). There are also areas where the results are only based on measurements of 1-2 years (‘initial’ data: open circles in Figure 4). Thus, increased monitoring frequency is needed to enable a stronger and higher confidence status evaluation for the entire Baltic Sea.
The assessment unit level evaluation is built on monitoring at 121 stations, of which 40 represent ‘full’ data series (i.e. more than 3 years of data for the period; see methodology) to which distinct trends could be assigned statistically. Seven of these stations showed downward trends (e.g. decreasing concentrations of PFOS). These stations were located in the following sub-basins, the Bornholm Basin (3), Arkona Basin, Gdansk Basin, Great Belt and The Sound, and all achieved the threshold value (were in GES). The other 32 stations with ‘full’ data series showed no distinct trends and only one of these stations failed to achieve the threshold value (was sub-GES). A single station located in the Bothnian Sea (west Norrskär) was recorded to show an increasing trend in concentrations, but still achieved the threshold value (was in GES). The remaining stations represented ‘initial’ data sets, The only other stations to fail the threshold value were ‘initial’ stations located in coastal areas of the Gulf of Finland (Vanhankaupunginlahti) and The Quark (Vaskiluoto) sub-basins (Figure 4).
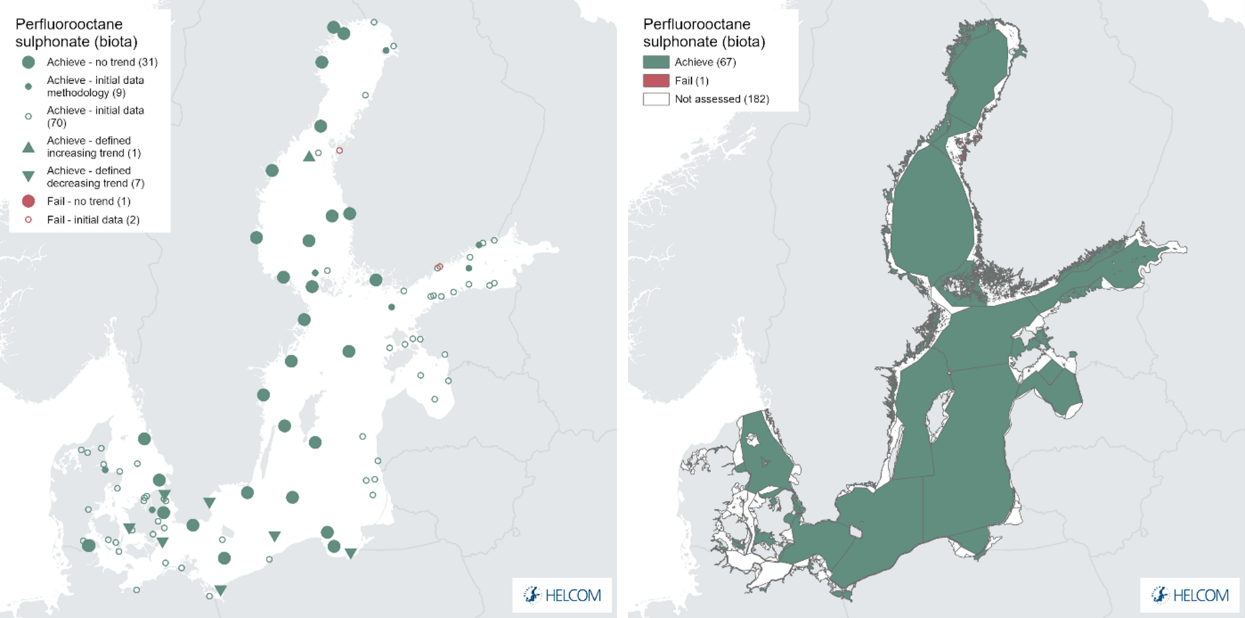
Figure 4: Spatial distribution of PFOS monitoring stations for biota (herring, cod, perch, eelpout and European flounder are represented) (left) and status evaluation by assessment unit in biota (right). Green colour indicates that the upper 95 % confidence interval for PFOS concentration is below the threshold value (i.e. good status). Small open circles indicate a status evaluation based on only 1-2 years of data (initial data), small filled circles indicate that data is not suitable to assess a trend (treated with initial methodology), large filled circles that no detectable concentration trends can be identified during the whole monitoring period (full data), and the filled arrow indicate that there is a statistically defined upward or downward trend during the monitoring period. See ‘data chapter’ for interactive maps and data at the HELCOM Map and Data Service.
It is important to be aware that the results used for this core indicator are mainly (but not completely) based on fish from stations considered as reference stations with no local pollution. There are most likely local areas within the Baltic Sea where the pollution load of PFOS is higher than presented in the evaluation outcome of this indicator.
Areas such as the Gulf of Finland, Gulf of Riga, Belt Sea and Kattegat are dominated by stations evaluated as ‘initial’ data series (Figure 4). Examples of different trend patterns at the station level (station time series) are presented in Figure 5 to show the difference between ‘full’ and ‘initial’ data series.
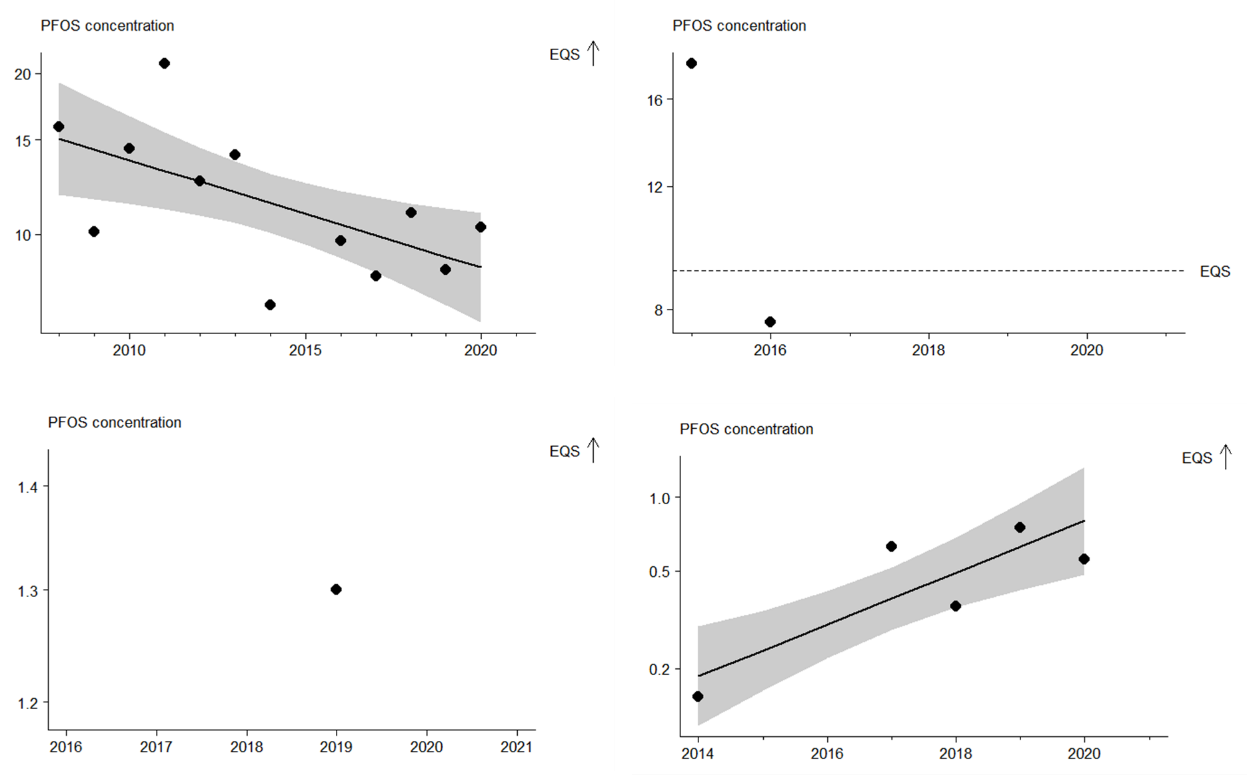
Figure 5. Examples of PFOS concentration trends (μg/kg ww) in biota from: the Bornholm Basin, Västra Hanöbukten station (top left – distinct decreasing trend – in GES, ‘full data’), the gulf of Finland, Vanhankaupunginlahti station (top right – sub-GES, ‘initial data’), the gulf of Riga, SJA8835000 station (bottom left – in GES, ‘initial data’), and the Bothnian Sea, west Norrskär station (bottom right – distinct increasing trend – in GES, ‘full data’).
PFOS in water
Concentrations of PFOS have also been monitored in surface water by some countries (Estonia, Germany, Lithuania and Poland). When these results are assessed for the QS(secondary poisoning) set in water, all but two of the evaluated assessment units fail to achieve the threshold value (Figure 6). The water QS is derived from biota QS and the difference in PFOS status between biota and water are most likely due to uncertainties in translation of biota QS into water QS. The translation involves assumptions of bioconcentration factors and biomagnification factors with a precautionary approach and may lead to a stricter QS value in water than in biota.
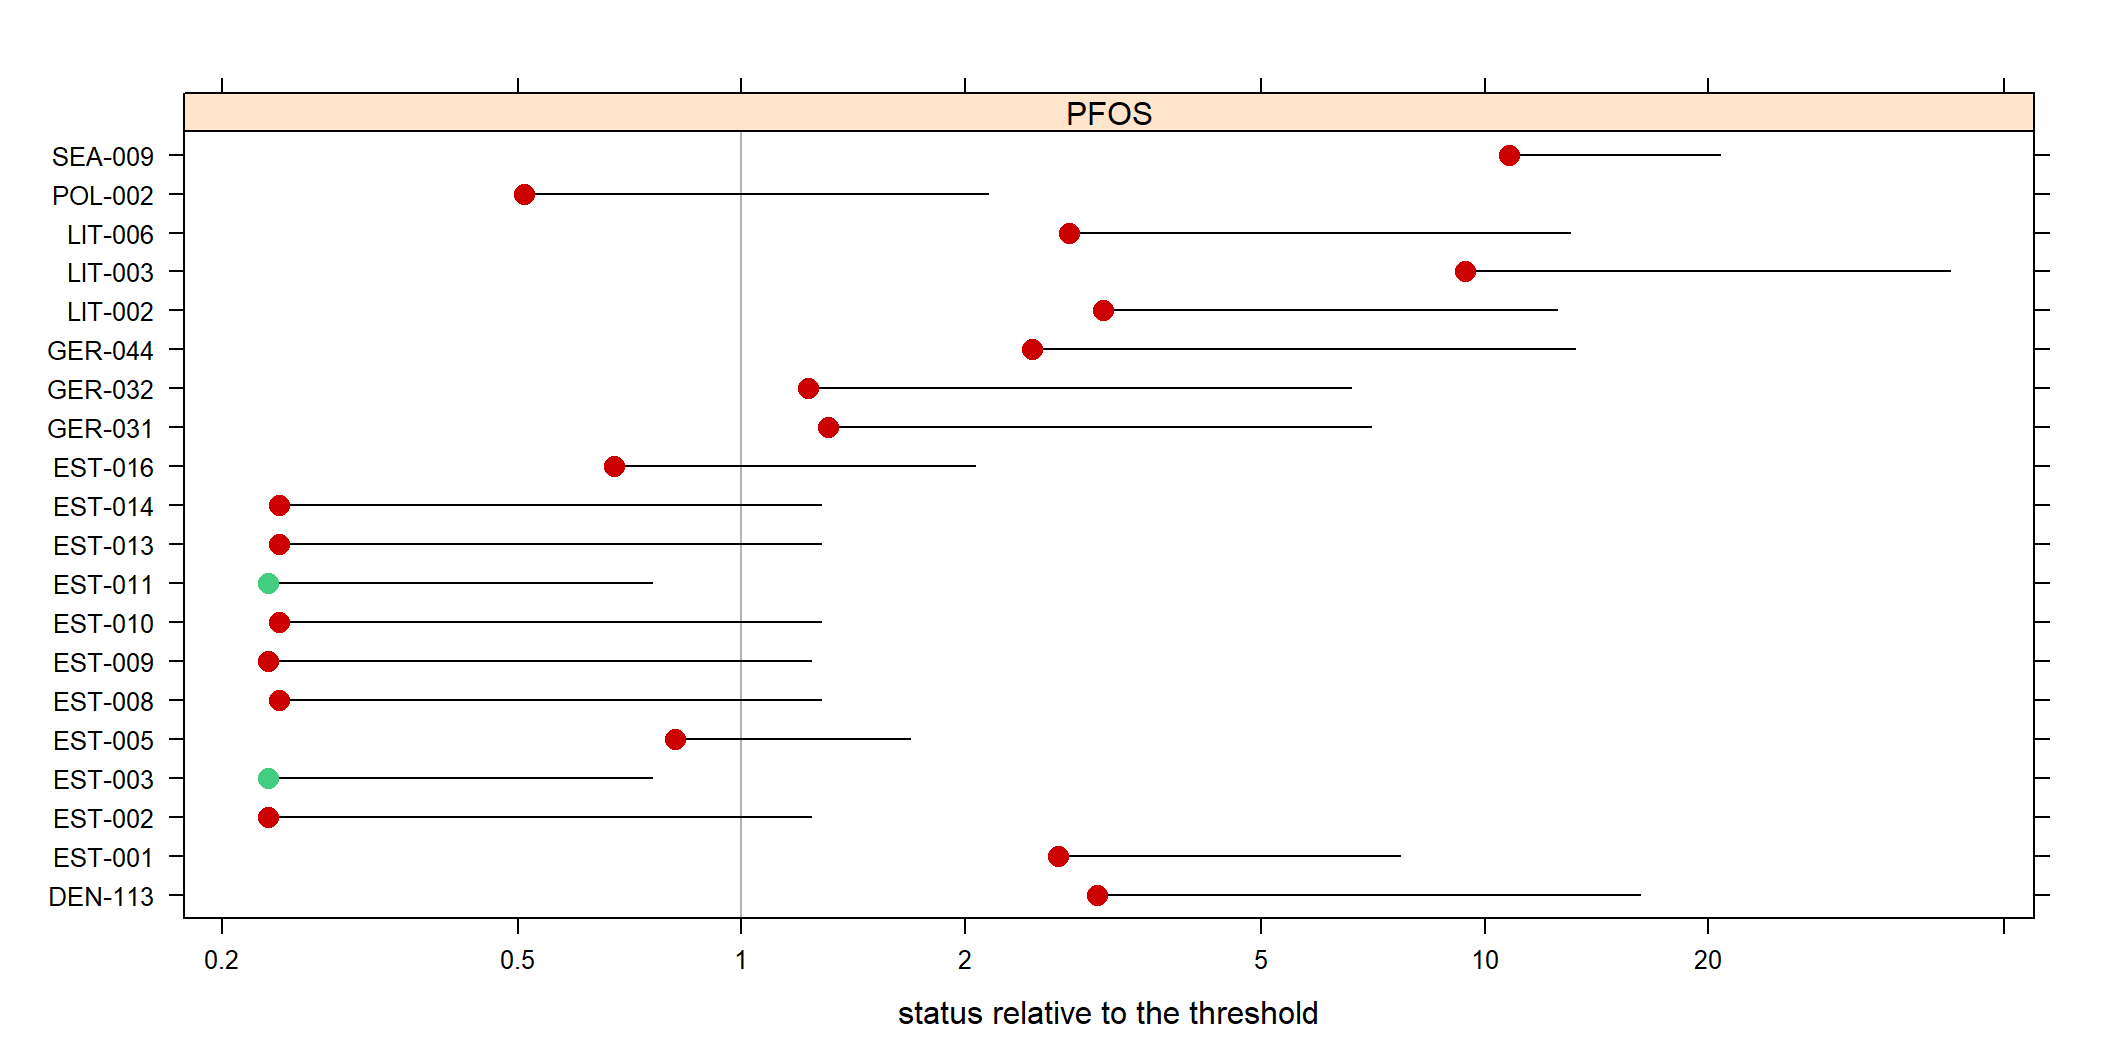
Figure 6: Concentrations of PFOS in water relative to the threshold value. Filled circles represent a mean value for each assessment unit and the bar represents the upper 95% confidence limit. Green colour indicates that the assessed area achieves the threshold value and red colour that the assessed area fails the threshold.
There are large areas of the Baltic Sea that are not evaluated for the secondary monitoring matrix of water and in places where water is monitored the stations are currently exclusively evaluated as ‘initial’ data due to the type of available data (Figure 7).
The assessment unit level evaluation is built on monitoring at 33 stations, all of which represent ‘initial’ data series (i.e. 2 or less years of data for the period; see methodology). Six of these stations were located in a single open sea assessment unit (sub-basin) and all others were located in coastal assessment units. Thirteen of the 33 stations achieved the threshold value (were in GES) while the remainder were sub-GES (Figure 7).
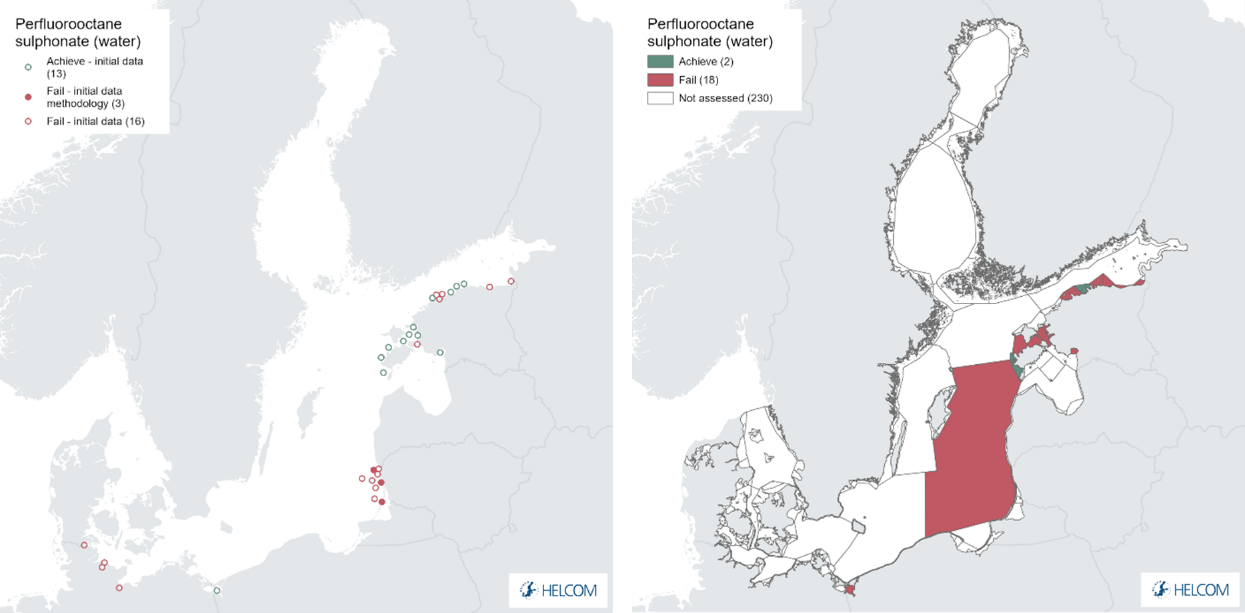
Figure 7: Spatial distribution of PFOS monitoring stations for the secondary threshold evaluation in seawater (left) and status evaluation by assessment unit in seawater (right). Green colour indicates that the upper 95 % confidence interval for PFOS concentration is below the threshold value (i.e. good status). Small open circles indicate a status evaluation based on only 1-2 years of data (initial data), small filled circles indicate that data is not suitable to assess a trend (treated with initial methodology), large filled circles that no detectable concentration trends can be identified during the whole monitoring period (full data), and the filled arrow indicate that there is a statistically defined upward or downward trend during the monitoring period. The evaluation is carried out using scale 4 HELCOM assessment units (defined in the HELCOM Monitoring and Assessment Strategy Annex 4). See ‘data chapter’ for interactive maps and data at the HELCOM Map and Data Service.
4.2 Trends
Increasing PFOS concentrations have been shown in biota time series starting in the 1970s and 1980s (Soerensen and Faxneld 2022). However, constant or downward trends are seen in herring from the Bothnian Sea, the offshore station in the Northern Baltic Proper and in Kattegat in the more recent time period (Figure 4) in the current evaluation. Examples of key trends at selected stations are provided above (Figure 5). A number of stations are evaluated as ‘initial’ data series due to limitations in the length or quality of the time series available (small symbols on maps). Increased temporal monitoring of these would provide stronger analytical potential in future evaluations. However, identification of statistical trends is viable and a small number of decreasing trends (i.e. concentrations becoming lower) have been identified. Trends were only possible to evaluate for monitoring carried out in biota, the primary threshold value, and where distinct trends were identified the large majority (7) showed decreasing concentrations, a single station showing a trend for increasing concentrations.
4.3 Discussion
PFOS is known to have toxic effects, accumulate in biota and persist in the marine environment. Although regulation and bans have been implemented it remains a group of substances of priority and potential concern due to the vast array of closely related compounds and the large pool of PFOS/PFAS substances already present in items and materials which may have the potential to spread PFAS to the marine environment. All but one assessment units evaluated for biota, applying the primary threshold value, achieve the threshold value and are in GES. On the other hand the large majority of evaluations against the secondary threshold value in water fail to achieve the threshold value. The secondary threshold value is designed to be applied in areas where an evaluation in biota is not possible to achieve and it is possible that it is more precautionary (i.e. results in a greater likelihood to fail the threshold value) due to uncertainties in its derivation from the biota EQS. However, there is good reasons for continuing the evaluations of water since PFOS often enters the marine environment through discharges into the water column and only subsequently enter biota.
As the tissue utilized for biota monitoring may differ, a conversion factor is applied to ensure the measured concentrations are correctly evaluated against the threshold value (Figure 8). In the case of PFOS a conversion factorliver/muscle of 17.9 is applied to reflect higher accumulation in liver as compared to muscle (Faxneld et al., 2014).
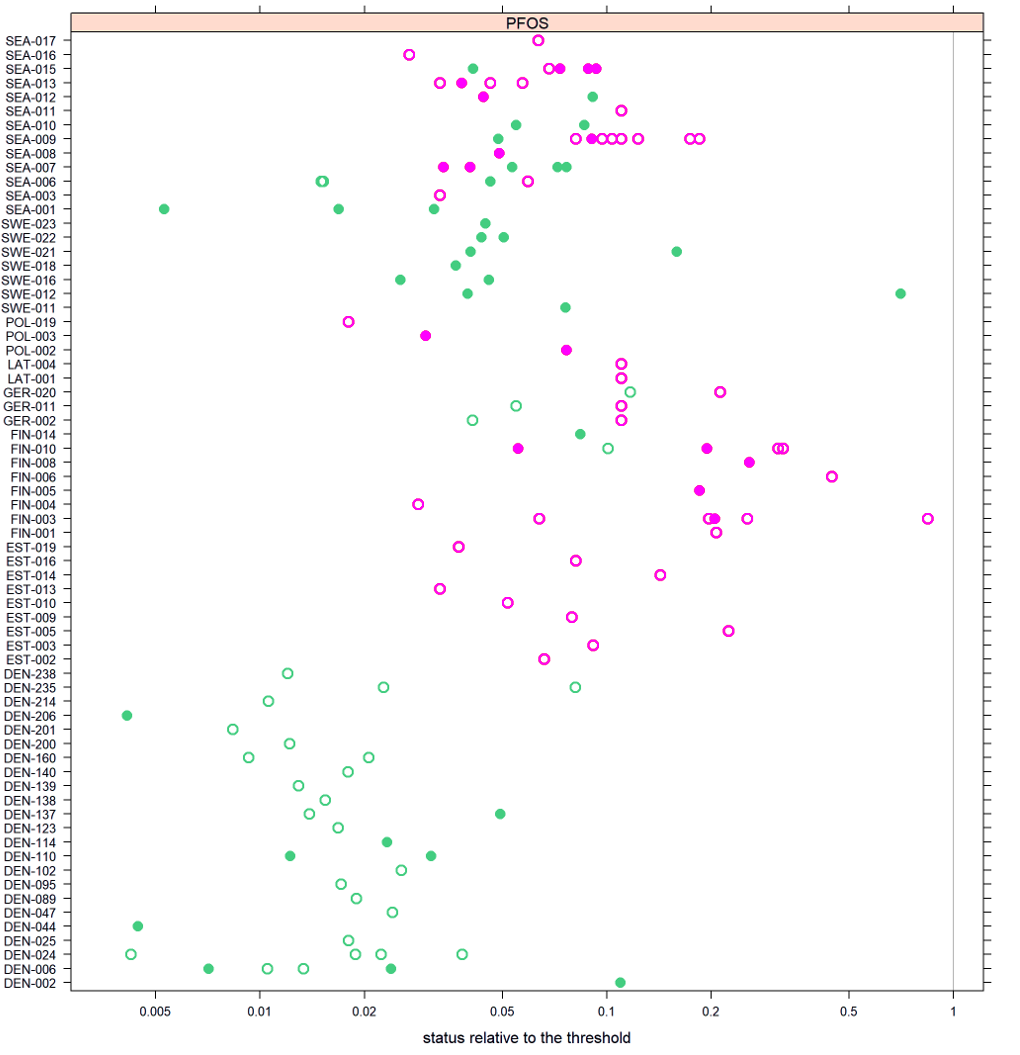
Figure 8. The same assessment units as shown in Figure 3 are presented but each assessment unit visualises the individual stations included in making the assessment unit level status evaluation. Potential difference in evaluation outcome due to different sampling matrices do not appear to occur (though there are limited stations assessing both): Purple = fish liver (converted to a muscle concentration using a conversion factor of 17.9), and green = fish muscle.
An overview of the outcomes for the open sea sub-basins is provided below (Table 3).
Table 3. Overview of evaluation outcomes and comparison with previous evaluation (using the OOAO evaluation outcomes per assessment unit). Currently this approach is only applied for open sea assessment units.
| HELCOM Assessment unit name (and ID) | Threshold value achieved/failed – HOLAS II | Threshold value achieved/failed – HOLAS 3 | Distinct trend between current and previous evaluation. | Description of outcomes, if pertinent. |
| Kattegat (SEA-001) | Achieved | Achieved | Status (in GES) remains constant in both assessment periods. | GES is achieved, with all 3 stations being ‘full’ data and all achieving the threshold value (no distinct trends) for biota. |
| Great Belt (SEA-002) | Not evaluated | Not evaluated | NA | NA |
| The Sound (SEA-003) | Not evaluated | Achieved | Greater data availability allows an evaluation in this assessment period, GES being achieved. | GES is achieved, with a single ‘initial’ data station achieving the threshold value for biota. |
| Kiel Bay (SEA-004) | Not evaluated | Not evaluated | NA | NA |
| Bay of Mecklenburg (SEA-005) | Not evaluated | Not evaluated | NA | NA |
| Arkona Basin (SEA-006) | Achieved | Achieved | Status (in GES) remains constant in both assessment periods. | GES is achieved, with one ‘full’ data station and three ‘initial’ and all achieving the threshold value (no distinct trends) for biota. |
| Bornholm Basin (SEA-007) | Achieved | Achieved | Status (in GES) remains constant in both assessment periods. | GES is achieved, with all 5 stations being ‘full’ data and all achieving the threshold value (3 downward trends) for biota. |
| Gdansk Basin (SEA-008) | Achieved | Achieved | Status (in GES) remains constant in both assessment periods. | GES is achieved, with a single ‘full’ data station and achieving the threshold value (no distinct trends) for biota. |
| Eastern Gotland Basin (SEA-009) | Failed | Failed | Status (sub-GES) remains constant in both assessment periods. This is based on a OOAO approach where the overall evaluation is driven by monitoring in water. | GES is not achieved (sub-GES, with 2 stations being ‘full’ data and 8 ‘initial’ and all achieving the threshold value (no distinct trends) for biota. However, 6 ‘initial’ water stations all fail to achieve the threshold value. |
| Western Gotland Basin (SEA-010) | Achieved | Achieved | Status (in GES) remains constant in both assessment periods. | GES is achieved, with 2 stations being ‘full’ data and both achieving the threshold value (no distinct trends) for biota. |
| Gulf of Riga (SEA-011) | Not evaluated | Achieved | Greater data availability allows an evaluation in this assessment period, GES being achieved. | GES is achieved, with a single ‘initial’ data station achieving the threshold value for biota. |
| Northern Baltic Proper (SEA-012) | Achieved | Achieved | Status (in GES) remains constant in both assessment periods. | GES is achieved, with 1 ‘full’ and 1 ‘initial’ data station both achieving the threshold value (no distinct trends) for biota. |
| Gulf of Finland (SEA-013) | Achieved | Achieved | Status (in GES) remains constant in both assessment periods. | GES is achieved, with 5 stations being ‘initial’ data and all achieving the threshold value (no distinct trends) for biota. |
| Åland Sea (SEA-013) | Not evaluated | Not evaluated | NA | NA |
| Bothnian Sea (SEA-015) | Achieved | Achieved | Status (in GES) remains constant in both assessment periods. | GES is achieved, with 4 stations being ‘full’ data and one ‘initial’ and all achieving the threshold value for biota, though one showed an increasing concentration trend. |
| The Quark (SEA-016) | Achieved | Achieved | Status (in GES) remains constant in both assessment periods. | GES is achieved, with a single ‘initial’ data station achieving the threshold value (no distinct trends) for biota. |
| Bothnian Bay (SEA-017) | Achieved | Achieved | Status (in GES) remains constant in both assessment periods. | GES is achieved, with a single ‘initial’ data station achieving the threshold value (no distinct trends) for biota. |
5 Confidence
The geographical resolution for the coverage of the whole Baltic Sea is relatively good and has improved since the previous evaluation (HOLAS II) but certain areas are characterised by many stations only having short (one to a few years) of observations and no detailed geographical studies to investigate the variability have yet been carried out. The conversion of PFOS concentrations in liver to muscle values introduces uncertainties into the status evaluation (see 9.2 Methodology Applied). In addition, the trophic level of the fish used for monitoring (predominantly herring, which has a trophic level of approximately 3 in the Baltic Sea) is lower than recommended for the threshold, thus leading to possible underestimations in relation to the threshold.
Despite the uncertainties described above, and since most evaluations are well below the threshold value, the confidence in the evaluation of the aggregated assessment units is considered in general to be moderate, with some assessment units having high or low confidence (Figure 9 and further details in Annex 1).
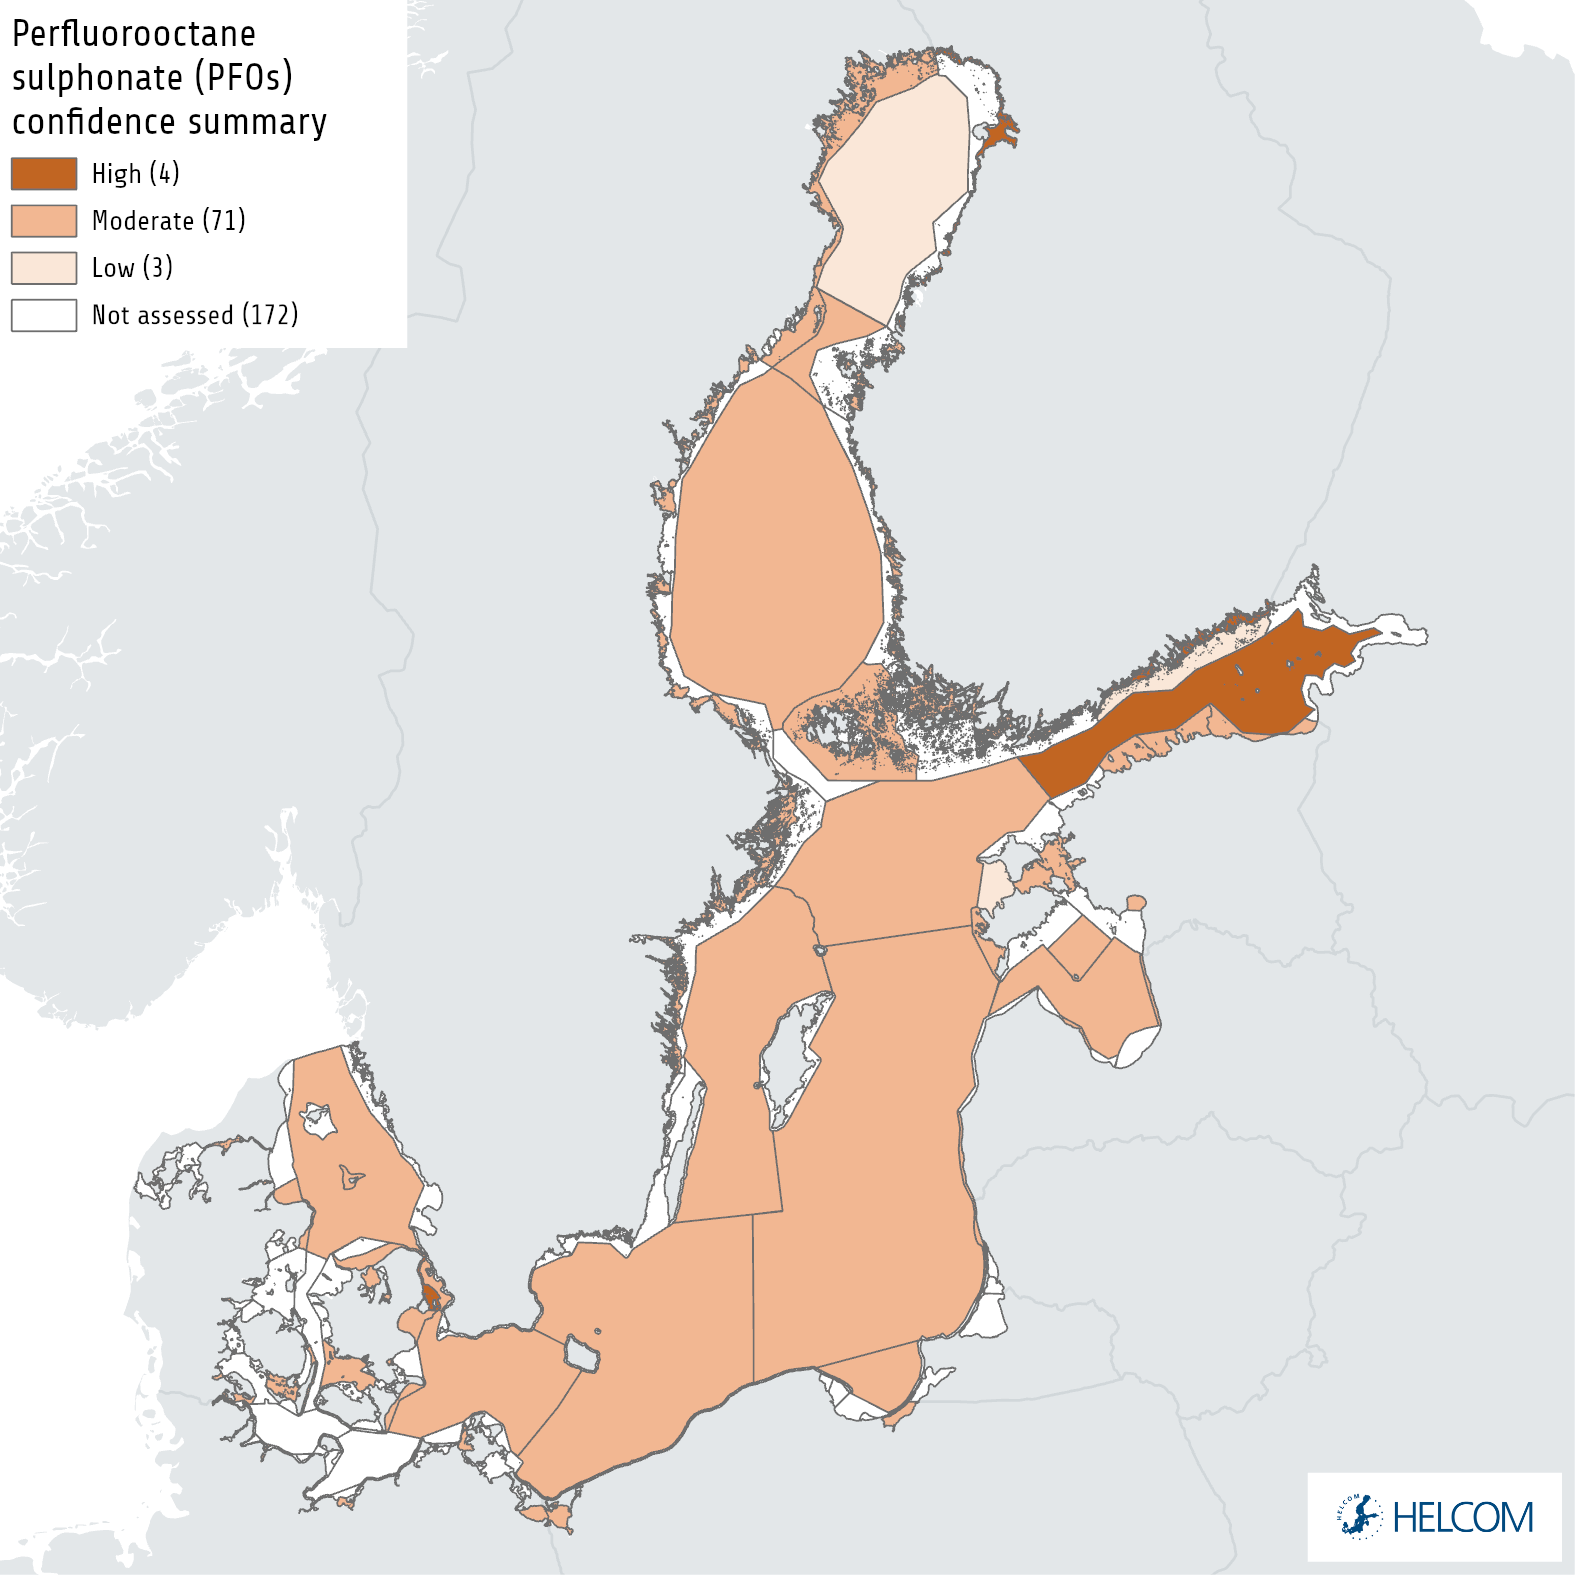
Figure 9. Map presenting the confidence in the overall evaluation based on a OOAO summary of confidence across all monitored matrices (see Annex 1). The evaluation is carried out using Level 4 HELCOM assessment units (defined in the HELCOM Monitoring and Assessment Strategy Annex 4).
6 Drivers, Activities, and Pressures
Drivers are often complex issues that are difficult to quantify, though in certain instances proxies can be utilised to represent them or changes in them. A driver may for example relate to globalisation or political will and, while difficult to quantify in terms of specific relevance to an indicator, changes in drivers can catalyse changes in activities that will consequently influence pressures for example resulting in altered levels of production and the subsequent pressures for that activity. A brief overview of key pressures and activities is provided in Table 4.
PFOS is both intentionally produced as well as formed as an unintended transformation product from related anthropogenic chemicals. PFOS is still produced in several countries, such as China. Some PFAS have been manufactured for more than five decades. They are applied in industrial processes (e.g., production of fluoropolymers) and in commercial products such as water- and stain-proofing agents and fire-fighting foams, electric and electronic parts, photo imaging, hydraulic fluids and textiles (Paul et al. 2009).
The American company 3M was the main producer of PFOS and its related substances until 2002. They started the production of perfluorochemicals already in 1949. The production of PFOS increased between 1966 and 1990 and peaked between 1990 and 2000. In 2003, China started a large-scale production of PFOS. Between 2003 and 2008 China was both the main global producer and user of PFOS substances. However, also Japan and Germany produced PFOS during the same period, but after 2007 PFOS has not been produced in Germany (Carloni 2009).
The major transport ways of PFOS to the Baltic Sea has been shown to be rivers (77%) but also atmospheric deposition (20%). Wastewater treatment plants on the other hand were shown to have a negligible contribution (less than 2%) (Filipovic et al. 2013). The sources of PFOS to the atmosphere are still not clear, but a major contributor is believed to be transformation of precursor compounds (FOSA (Perfluorooctane sulfonamide) and FOSE (Perfluorooctane sulfonamidoethanol)) that have been emitted from production facilities and fluorochemical products (Armitage et al. 2009). Seventy-eight percent of the total PFOS in the Baltic Sea was estimated to be stored in the water column (Filipovic et al. 2013).
PFAS can be introduced into the environment both from point sources (e.g. landfills, manufacturing plants, application of firefighting foam containing PFOS) and non-point sources such as atmospheric deposition and degradation of precursors (Ahrens & Bundschuh 2014). High amounts of PFOS have been found in both sludge and groundwater close to military air base sites and airports where firefighting foam has been used to prevent fires (FOI 2013; Arias et al. 2015). Furthermore high levels of PFAS, including PFOS, have been found close to industries producing fluortelomers (Wang et al. 2014; Shan et al. 2014).
Table 4. Brief summary of relevant pressures and activities with relevance to the indicator.
| | General | MSFD Annex III, Table 2a |
| Strong link | Use of synthetic compounds to increase grease, oil and water resistance of materials
Use of firefighting foams |
Substances, energy and litter
– Input of other substances (e.g. synthetic substances, non-synthetic substances, radionuclides) – diffuse sources, point sources, atmospheric deposition, acute events |
| Weak link |
7 Climate change and other factors
Precipitation and river discharge are predicted to increase as a result of climate change in especially the northern Baltic, while some decreases in river inflow are expected in the south (HELCOM 2021). While both are sources of PFOS (and precursors) to the Baltic Sea, river inputs are currently deemed to be the more important source currently delivering 77% of the PFOS load (Johansson and Undeman, 2020; Filipovic et al. 2013). However, increased precipitation could increase leaching of PFOS from contaminated sites and thus contribute to increases in the PFOS loading to Baltic Sea. The increase in PFOS loads due to increasing precipitation and river discharge could partly counteract the current decline in inputs due to the decrease in emissions.
Long chained PFAAs like PFOS have a high water solubility but are still found in the sediments (Josefsson 2022) and burial account for around 10% of the PFOS loss in the Baltic (Filipovic et al. 2013). Climate induced increases in sediment transport in coastal areas (HELCOM, 2021) could therefore cause a release of buried PFOS back into the water column. However, an increase in dissolved organic carbon and humic acids in the northern Baltic in combination with an increase in surface-water temperature could also result in a faster sedimentation of PFOS (Jia et al. 2010). Maybe more importantly, if an increase in river discharge also result in an increase in water outflow from the Baltic to the North Sea, this is likely to increase the loss of PFOS as outflow through the Danish straits are the largest sink of PFOS from the Baltic (~90% of total loss; Filipovic et al. 2013).
Climate models project slight increases in wind speed in the northern Baltic and decreases in the south (HELCOM, 2021) but it could be the increase in extreme situations with wind gusts associated with thunderstorms and an increase of 5% in wave height in the north and east of the Baltic that affect PFOS the most. Recent studies have shown that PFOS concentrations are enriched in sea spray aerosols (Johansson et al. 2019) and an increase in wave activity could lead to an increased loss of PFOS from the water to land.
The Baltic Sea average surface-water temperature has increased by around +0.6°C/decade for 1990- 2018 (Siegel and Gerth 2019). A further increase in surface water-temperature is one of the most certain future consequences of climate change in the Baltic Sea (HELCOM 2021). The increase in surface-water temperature is likely to have direct effect on fish body growth, recruitment, and mortality. Increases in growth rate (already a factor today across monitoring data covering a wide range of average temperature from the northern to the southern Baltic Sea; Soerensen and Faxneld 2022) can affect the biomagnification through increased growth dilution. The effects from changes in recruitment and mortality are less straightforward but is part of the indirect climate impact on the overall ecosystem and food web dynamics. The sum of direct climate change parameters (temperature, radiation, salinity, river discharge, precipitation, wind etc.) will affect the oxygen content, microbial communities and food web dynamics (stocks and species; HELCOM 2021). Changes in living conditions and food web structure could change the flow of PFOS through the food web, which will likely affect the overall biomagnification. Further, different species likely has different ability to biotransform PFOS precursors, thus a change in the food web structure could cause a change in the biotransformation. However, more work is needed to understand if climate induced food web changes will lead to an increase or decrease in concentrations in top predators.
8 Conclusions
Overall, the concentrations of PFOS achieve Good Environmental Status (GES) for almost all assessment units evaluated assessment units when the primary threshold value for biota is applied. Where sub-GES status occurs it is heavily influenced by the failure to achieve the threshold value against the secondary threshold value for water.
8.1 Future work or improvements needed
A new PFAS EQS focusing on the accumulated effect of PFAS rather than just PFOS is currently under preparation (EU, 2021). It should be considered if this new EQS should be used in future evaluations instead of focusing solely on PFOS. Introducing this new EQS would allow for an evaluation of the combined toxicity risks posed by PFASs in the Baltic Sea. This is especially important as PFOS trends are currently levelling off or decreasing in the Baltic Sea due to the phase out of precursor compounds, while other PFASs follow different temporal and spatial patterns.
Available studies on liver to muscle conversion factors for PFOS indicate that the variability in conversion factor between species is much larger than within species (Soerensen et al. 2022; Larsen and Bossi 2019). More data on conversion factors for especially herring, cod, eelpout and European flounder are needed to lower the uncertainty associated with the tissue contaminant conversion.
The recommended trophic level for contaminant evaluation is 4.5 (European Commission, 2014). For this evaluation, no adjustment for trophic level was done. A uniform approach where all observations are normalised to the same trophic level should be considered for future evaluations. As the food web in the Baltic Sea is usually relative short (trophic level: herring ~3-4, cod ~4-5, white tailed sea eagle ~4) a lower trophic level than 4.5 (representing one trophic level below top predators) could be considered for evaluation in the Baltic Sea if the focus is on overall good environmental status.
Exploring the possibility and suitability of adding additional fish species (e.g. roach, bream) could be explored to evaluate if the spatial distribution of these species can support improved coverage and improved confidence of the indicator in the future.
9 Methodology
The overall methodology is set out below.
9.1 Scale of assessment
PFOS is considered a global pollutant, widely distributed in biological samples and even present in samples from remote places such as the Arctic region. The PFOS core indicator is therefore relevant for the whole Baltic Sea and can be applied in all regions.
The core indicator evaluates the status with regard to concentration of PFOS using HELCOM assessment unit scale 4 (division of the Baltic Sea into 17 sub-basins and further division into coastal and offshore areas and division of the coastal areas by WFD water types or water bodies). This division is applied in order to take into account the different routes by which PFOS enters the Baltic Sea – via air and via run-off from land, including also potential point sources.
The assessment units are defined in the HELCOM Monitoring and Assessment Strategy Annex 4.
9.2 Methodology applied
Data processing
The threshold value is defined with the protection goal to prevent adverse effects on human health via consumption of fishery products. As human fish consumption is mainly focused on muscle fillet of fish, the status evaluation is calculated based on PFOS concentrations in fish muscle. Some data may therefore require transformation into the relevant matrix and unit given for the threshold value, which is µg/kg wet weight.
Ideally, the data should be analyzed in the same matrix, which for the purposes of the indicator evaluation is muscle fillet concentrations in fish, representing a trophic level of 4 (European Commission 2014). However, the majority of the PFOS data reported are analysed in liver tissue in different fish species at varying trophic levels. PFOS concentration values that are originally measured in fish liver are therefore converted to a muscle concentrations. This has been done using conversion factors generated by Faxneld et al. (2014). The conversion was performed with the use of the general conversion factors for ‘all species’ (liver:muscle ratio: 17.9), see Table 5.
Table 5. Mean liver:muscle ratios for PFOS with 95% confidence intervals within parentheses. The column indicated “all species” includes herring, perch (marine and limnic), eelpout, pike, arctic char and cod. Data taken from (Faxneld et al. 2014).
| All species | Herring | Perch | Eelpout | |
| PFOS | 17.9 (16-20) | 19.0 (17-21) | 18.2 (16-20) | 11.1 (6.0-16) |
As seen on the conversion factors (Table 5), liver concentrations are higher than muscle concentrations and several studies have reported that PFOS accumulate in protein rich tissue, with liver being one of the tissues where the highest concentrations are found (Goeritz et al. 2013; Shi et al. 2012). Comparing liver concentrations directly to the EQS value set for muscle fillet could therefore lead to a false positive. However, it is of great importance to be aware of the uncertainties introduced to the results in the conversion procedure.
No correction for trophic level has been made. The monitored species are at a lower trophic level than the general trophic level estimated for commercial fish and suggested by the EC Guidance Document No. 32 (European Commission 2013), implying a risk of underestimation of the concentrations, since PFOS biomagnifies in the food web. The information on trophic level, is lacking for the reported results and a proper trophic magnification factor (TMF) has not been agreed upon yet. It is therefore presently not possible to translate the results to the recommended trophic level 4 for the status evaluation. The results should therefore be considered tentative at this time.
New studies have been published on conversion factors recently but given the fish species dependence on the conversion factor (Larsen and Bossi 2019; Soerensen et al. 2022), more studies on relations between liver, muscle and whole body concentrations of PFOS in relevant Baltic Sea fish species are needed in order to improve the comparisons to the threshold value.
Statistical evaluation
The evaluation protocol is structured in three main parts, 1) changes in log concentrations over time are modelled, 2) check for compliance against threshold value and evidence for temporal change of contaminant concentration per station and 3) a spatial aggregation of status per assessment unit.
It should be noted that the evaluation protocol makes the assumption that monitoring data stems from the same monitoring stations during consecutive years. The stations used by the protocol are defined in the ICES Station Dictionary. Stations with similar station name are grouped together, but it is also possible to define a group of stations with different names to be defined as the same station in the Station Dictionary. Usually a station is defined in the Station Dictionary with coordinates and a valid box around these coordinates, but coordinates outside of the box will only give a warning when reporting the data, and are not used in the actual data extraction.
Overview
Time series of contaminant concentrations are assessed in three stages:
- The concentrations are log transformed and changes in the log concentrations over time are modelled using linear mixed models. The type of temporal change that is considered depends on the number of years of data:
-
- 1-2 years: no model is fitted because there are insufficient data
- 3-4 years: concentrations are assumed to be stable over time and the mean log concentration is estimated
- 5-6 years: a linear trend in log concentration is fitted
- 7+ years: more complex (smooth) patterns of change over time are modelled
-
- The fitted models are used to assess status against available threshold value and evidence of temporal change in contaminant levels in the last twenty years
- The fitted models are also used for spatial aggregation to assess status against available threshold value and evidence of temporal change in contaminant levels on a scale 4 level HELCOM assessment unit.
These stages are described in more detail in the link below. There is also information on how the methodology is adapted when there are ‘less-than’ measurements (treated as ‘initial’ data), i.e. some concentrations are reported as below the detection limit, and missing uncertainties, i.e. the analytical variability associated with some of the concentration measurements was not reported.
Assessment methodology for contaminants in biota and water
All initial data is handled in a highly precautionary manner to further ensure that the risk of false positives is minimalised. For all initial data the 95% confidence limit on the mean concentration, based on the uncertainty seen in longer time series throughout the HELCOM area, is used. Applying a precautionary approach, the 90% quantile (psi value, Ψ ) of the uncertainty estimates in the longer time series from the entire HELCOM region are used. The same approach is used for time series with three or more years of data, but which are dominated by less-than values (i.e. no parametric model can be fitted). The mean concentration in the last monitoring year (meanLY) is obtained by: restricting the time series to the period 2016-2021 (the last six monitoring years), calculating the median log concentration in each year (treating ‘less-than’ values as if they were above the limit of detection), calculating the mean of the median log concentrations, and then back-transforming (by exponentiating) to the concentration scale. The upper one-sided 95% confidence limit (clLY) is then given by:
 , where n is the number of years with data in the period 2016-2021 (HELCOM 2018).
9.3 Monitoring and reporting requirements
Monitoring methodology
HELCOM PFAS guidelines describing monitoring methods, reporting, storage and quality control for PFAS biota monitoring within HELCOM was published in 2019 (HELCOM 2019). Additional information about monitoring in the region is documented in the HELCOM Monitoring Manual under the sub-programme: Contaminants in biota.
Current monitoring
Monitoring activities relevant to the indicator, currently carried out by HELCOM Contracting Parties are described in the HELCOM Monitoring Manual in the relevant Monitoring Concept Table.
Sub-programme: Contaminants in biota
Denmark, Sweden, Finland, Poland, and Germany monitor PFOS concentrations in their national monitoring programmes. Germany began monitoring of PFOS in water in 2017 and in biota in 2018. Lithuania monitors PFOS in water, sediments and biota every 3 years since 2015 resulting in one sample per station so far. Estonia has included PFOS analyses in coastal waters (water, sediment and biota) from 2017. PFOS is not included in the monitoring programmes in Latvia and no information is available from Russia.
Description of optimal monitoring
The core indicator for PFOS has increased its geographical coverage in national monitoring programmes in recent years but better time series data is needed to enable evaluation of temporal trends. It is therefore vital that the stations added in recent years are sampled regularly in the future.
The performance of existing monitoring should be evaluated in relation to the monitoring objectives, but first there is a need to quantify these objectives. These quantitative objectives need to be specified for each kind of monitoring, e.g. temporal trend-, incident-, geographical (spatial)- and compliance monitoring for environmental status and/or human exposure. For example, for temporal trend monitoring: what statistical power is required, during what time period should a certain trend be possible to detect and with what specified power (with certain one-or two-tailed statistical tests at a specified significant level)? With these definitions at hand it is possible to estimate e.g. required sample sizes and sampling frequencies. It can be shown that for a monitoring period of 12 years or shorter, generally the power to detect trends will decrease substantially if the sampling is carried out every second or every third year compared to annual sampling. For geographical studies the required spatial resolution should be determined. For compliance monitoring, it is imperative to know the distance to target levels (and variance) before sample sizes are estimated.
Time series of PFOS concentrations in fish are missing or too short to enable evaluation for several sub-basins in the Baltic Sea region. The geographical resolution is generally too poor to make reliable generalized maps from interpolation of the existing stations using Krieging. No serious attempts to study patterns of variation in fish (coastal- offshore) through variograms have been made that could give guidance to the uncertainty and to the distance between sites needed to achieve required confidence in generalized maps.
10 Data
The data and resulting data products (e.g. tables, figures and maps) available on the indicator web page can be used freely given that it is used appropriately and the source is cited.
Result: Perflurooctane sulphonate (PFOS) in biota
Result: Perflurooctane sulphonate (PFOS) in water
Data: Hazardous substances in biota
Data: Hazardous substances in water
The data used in the evaluation is based on data from the HELCOM COMBINE database to which Contracting Parties report regular monitoring data. The data are extracted based on the HELCOM core indicator extraction table.
11 Contributors
Anne L. Soerensen, Swedish Museum of Natural History and Emmi Vähä, Finnish Environment Institute
Rob Fryer, Marine Scotland (OSPAR).
HELCOM Expert Network on Hazardous Substances.
HELCOM Secretariat: Owen Rowe, Deborah Shinoda, Joni Kaitaranta, Jana Wolf, Jannica Haldin.
12 Archive
This version of the HELCOM core indicator report was published in April 2023:
The current version of this indicator (including as a PDF) can be found on the HELCOM indicator web page.
Earlier versions of this indicator are available below:
Perfluorooctane sulphonate PFOS HELCOM core indicator 2018 (pdf)
HOLAS II component – Core indicator report – web-based version March 2017 (pdf)
13 References
Ahrens, L., Bundschuh, M. (2014) Fate and effects of poly- and perfluoroalkyl substances in the aquatic environment: a review. Environmental toxicology and chemistry 33: 1921-1929.
Arias, V.A., Mallavarapu, M., Naidu, R. (2015) Identification of the source of PFOS and PFOA contamination at a military air base site. Environ. Monit. Assess. 187: 4111.
Armitage, J.M., Schenker, U., Scheringer, M., Martin, J.W., Macleod, M., Cousins, I.T. (2009) Modeling the global fate and transport of perfluoroctane sulfonate (PFOS) and precursor compounds in relation to temporal trends in wildlife exposure. Environ. Sci. Technol. 43: 9274-9280.
Carloni, D. (2009) Perfluoroctane sulfonate (PFOS) production and use: past and current evidence. Report prepared for UNIDO. 56 pp.
EU (2021), Per- and Polyfluoroalkyl Substances (PFAS). Draft EQS Dossier on PFAS. Prepared by Joint Research Center, Ispra, Italy, for European Union (EU), Brussels, Belgium. https://circabc.europa.eu/ui/group/9ab5926d-bed4-4322-9aa7-9964bbe8312d/library/2b6dfb19-ae52-415f-bdcc-2c39f9eb4647/details. Proposal available at: https://environment.ec.europa.eu/publications/proposal-amending-water-directives_en
European Commission (2000) Directive 2000/60/EC of the European Parliament and of the Council of 23 October 2000 establishing a framework for Community action in the field of water policy. Off. J. Eur. Union L 327.
European Commission (2008a) Directive 2008/105/EC of the European Parliament and the Council on environmental quality standards in the field of water policy (Directive on Environmental Quality Standards). Off. J. Eur. Union L 348.
European Commission (2008b) Directive 2008/56/EC of the European Parliament and the Council establishing a framework for community action in the field of marine environmental policy (Marine Strategy Framework Directive). Off. J. Eur. Union L 164: 19-40.
European Commission (2011) Common Implementation Strategy for the Water Framework Directive (2000/60/EC): Guidance Document no 27 – Technical Guidance for Deriving Environmental Quality Standards
European Commission (2013) Directive 2013/39/EU of the European Parliament and of the Council of 12 August 2013 amending Directives 2000/60/EC and 2008/105/EC as regards priority substances in the field of water policy. Off. J. Eur. Union L 226: 1-17.
European Commission (2014) Guidance Document No. 32 on biota monitoring (the implementation of EQSbiota) under the Water Framework Directive. Technical Report-2014-083.
Falandysz, J., Taniyasu, S., Gulkowska, A., Yamashita, N., Schulte-Oehlmann, U. (2006) Is fish a major source of fluorinated surfactants and repellents in humans living on the Baltic Coast? Environmental Science and Technology 40: 748-751.
Falandysz, J., P. Rostkowski, G. Jarzynska, J.J. Falandysz, S. Taniyasu, N. Yamashita (2012) Determination of perfluorinated alkylated substances in sediments and sediment core from the Gulf of Gdansk, Baltic Sea. Journal of Environmental Science and Health, Part A, 47, 428-434, doi: 10.1080/10934529.2012.646133
Faxneld, S., Danielsson, S., Nyberg, E. (2014) Distribution of PFAS in liver and muscle of herring, perch, cod, eelpout, arctic char and pike from limnic and marine environments in Sweden. Report 9: 2014, History, S.M.o.N., Swedish Museum of Natural History.
Filipovic, M., Berger, U., McLachlan, M.S. (2013) Mass balance of perfluoroalkyl acids in the Baltic Sea. Environmental science & technology 47: 4088-4095.
FOI (2013) Perfluorerade ämnen i jord, grundvatten och ytvatten. (In Swedish). Berglind, R., Helldén, J., Johansson, N., Liljedahl, B., Sjöström, J. Report FOI-R-3705-SE. 99 pages.
Goeritz, I., Falk, S., Stahl, T., Schäfers, C., Schlechtriem, C., (2013) Biomagnification and tissue distribution of perfluoroalkyl substances (PFASS) in market-size rainbow trout (oncorhynchus mykiss). Environmental Toxicology and Chemistry 32(9): 2078-2088.
HELCOM (2010) Hazardous substances in the Baltic Sea – An integrated thematic assessment of hazardous substances in the Baltic Sea. Balt. Sea Environ. Proc. No. 120B.
HELCOM (2019) Technical annex on the determination of Per- and polyfluoroalkyl substances (PFASs) in biota. Technical annex prepared by HELCOM EXPERT NETWORK ON HAZARDOUS SUBSTANECS (EN-HZ).
HELCOM (2021) Climate Change in the Baltic Sea Fact Sheet 2021. Available at: https://helcom.fi/baltic-sea-climate-change-fact-sheet-new-publication-shows-latest-scientific-knowledge-on-climate-change-in-the-baltic-sea/
Jia, C., C. You, G. Pan (2010) Effect of temperature on the sorption and desorption of perfluorooctane sulfonate on humic acid, Journal of Environmental Science, 22(3), 355-361
Joers, H, C. Apel, R. Ebinghaus (2019) Emerging per- and polyfluoroalkyl subtsances (PFASs) in surface water and sediment of the North and Baltic Seas, Science of the Total Environment 686, 360-369
Johansson, J. and E. Undeman (2020) Perfluorooctane sulfonate (PFOS) and other perfluorinated alkyl substances (PFASs) in the Baltic Sea – Sources, transport routes and trends. Helcom Baltic Sea Environment Proceedings n°173
Johansson, J.H., M.E. Salter, J.C. Acosta Navarro, C. Leck, E.D. Nilsson, I.T. Cousins (2019) Global transport of perfluoroalkyl acids via sea spray aerosol, Environmental Science Processes and Impacts, 21, 635, doi: 10.1039/c8em00525g
Joseffson S. (2022) Contaminants in Swedish offshore sediments 2003-2021, Report 2022:08 from the Geological Survey of Sweden. Available at: http://www.diva-portal.org/smash/get/diva2:1666574/FULLTEXT01.pdf
Kannan, K., Corsolini, S., Falandysz, J., Oehme, G., Focardi, S., Giesy, J.P. (2002) Perfluorooctanesulfonate and related fluorinated hydrocarbons in Marine Mammals, Fishes, and Birds from Coasts of the Baltic and the Mediterranean Seas. Environ. Sci. Technol. 36: 3210-3216.
KEMI (2006) Perfluorinated substances and their uses in Sweden. Swedish Chemical Agency (KEMI) Report 7/06. 58 pp.
Larsen, M., R. Bossi (2019) Omregning af indhold af PFAS mellem muskel og lever i fisk, Technical report 199 from DCE. Available at: https://dce2.au.dk/pub/TR199.pdf
Nordén, M., Berger, U., Engwall, M. (2013) High levels of perfluoroalkyl acids in eggs and embryo livers of great cormorant (Phalacrocorax carbo sinensis) and herring gull (Larus argentatus) from Lake Vänern, Sweden. Environ. Sci. Pollut. Res. 20: 8021-8030.
Nordic Council of Ministers (NMR) (2004) Perfluorinated Alkylated Substances (PFAS) in the Nordic Environment. Prepared by Kallenborn, R., Berger, U., Järnberg, U. TemaNord 2004: 552. Nordic Council of Ministers, Copenhagen (ISBN 92-893-1051-0, ISSN 0908-6692).
Ngyuen, M.A., K. Wiberg, E. Ribeli, S. Josefsson, M. Futter, J. Gustavsson, L. Ahrens (2017) Spatial distribution and source tracing of per- and polyfluoroalkyl substances (PFASs) in surface water in Northern Europe, Environmental Pollution 220, 1438-1446, doi: 10.1016/j.envpol.2016.10.089
OSPAR (2005) OSPAR background document on perfluorooctane sulphonate. 46 pp. OSPAR Commission. Updated in 2006.
Paul, A.G., Jones, K.C., Sweetman, A.J. (2009) A first global production, emission, and environmental inventory for perfluorooctane sulfonate. Environ. Sci. Technol. 43: 386-392.
PFOS EQS dossier (2011) PERFLUOROOCTANE SULPHONATE (PFOS) [Online]. Supporting background documents 2012 Priority Substances proposal – EQS dossiers: The European Commission. Available at: https://circabc.europa.eu/sd/a/027ff47c-038b-4929-a84c-da3359acecee/PFOS%20EQS%20dossier%202011.pdf
Poulsen, P., Jensen, A., Wallström, E. (2005) More environmentally friendly alternatives to PFOS-compounds and PFOA. Environmental Project No. 1013. Danish Environmental Protection Agency. 162 pp.
Renner, R. (2001) Growing concern over perfluorinated chemicals. Environ. Sci. Technol. 35: 154A-160A.
Seacat A.M., Thomford, P.J, K.J. Hansen, G.W. Olsen, M.T. Case, J.L. Butenhoff (2002) Subchronic toxicity studies on perfluoroctanesulfonate potassium salt in Cynomolgus monkeys. Toxicological Sciences 68, 249-264, doi: 10.1093/toxsci/68.1.249
Siegel, H., M. Gerth, (2019) Sea Surface Temperature in the Baltic Sea 2018. 7pp. Available at: https://helcom.fi/wp-content/uploads/2020/07/BSEFS-Sea-Surface-Temperature-in-the-Baltic-Sea-2018.pdf
Shan, G., Wei, M., Zhu, L., Liu, Z., Zhang, Y. (2014) Concentration profiles and spatial distribution of perfluoroalkyl substances in an industrial center with condenced fluorochemical facilities. Science of the total environment 490: 351-359.
Shi, Y., Wang, J., Pan, Y., Cai, Y. (2012) Tissue distribution of perfluorinated compounds in farmed freshwater fish and human exposure by consumption. Environ Toxicol Chem 31: 717–723.
Soerensen A.L., S. Faxneld (2022) Graphic and statistical overview of temporal trends and spatial variations within the Swedish National Monitoring Programme for Contaminants in Marine Biota (until 2020 year’s data), report 5:2022, Swedish Museum of Natural History, Stockholm, Sweden
Soerensen A.L., S. Faxneld, M. Sköld (2022) Converting environmental quality standards for evaluation of fish contaminant monitoring data – tissue conversion factors for mercury, cadmium, lead and selected PFASs, report 1:2022, Swedish Museum of Natural History, Stockholm, Sweden
Theobald, N., Gerwinski, W., Caliebe, C., Haarich, M. (2007) Entwicklung und Validierung einer Methode zur Bestimmung von poly-fluorierten organischen Substanzen in Meerwasser, Sedimenten und Biota; Untersuchungen zum Vorkommen dieser Schadstoffe in der Nord- und Ostsee. (In German). Umweltbundesamt Texte 41/07. ISSN 1862–4804.
Van der Putte, I., Murin, M., Van Velthoven, M., Affourtit, F. (2010) Analysis of the risks arising from the industrial use of Perfuorooctanoic acid (PFOA) and Ammonium Perfluorooctanoate (APFO) and from their use in consumer articles. Evaluation of the risk reduction measures for potential restrictions on the manufacture, placing on the market and use of PFOA and APFO. RPS Advies B.V. 82 pp. + annexes.
Wang, P., Lu, Y., Wang, T., Fu, Y., Zhu, Z., Liu, S., Xie, S., Xiao, Y., Giesy J.P. (2014) Occurrence and transport of 17 perfluoroalkyl acids in 12 coastal rivers in south Bohai coastal region of China with concentrated fluoropolymer facilities. Environmental pollution 190: 115-122.
14 Other relevant resources
Berger, U., Glynn, A., Holmström, K.E., Berglund, M., Halldin Ankarberg, E., Törnkvist, A. (2009b) Fish consumption as a source of human exposure to perfluorinated alkyl substances in Sweden – Analysis of edible fish from Lake Vättern and the Baltic Sea. Chemosphere 76: 799–804.
Lilja, K., Norström, K., Remberger, M., Kaj, L., Engelrud, L., Junedahl, E., Viktor T., Brorström-Lundén, E. (2009) The screening of selected hazardous substances in the eastern Baltic marine environment. IVL, Report B1874.
SEPA (2006) Perfluoroalkylated acids and related compounds (PFAS) in the Swedish environment. Prepared for Swedish Environment Protection Agency by Järnberg, U., Holmström, K., van Bavel, B., Kärrman, A.
SCHER (2011) Scientific Committee on Health and Environmental Risks. Opinion on “Chemicals and the Water Framework Directive: Draft environmental quality standards”. DG Health & Consumer Protection, European Commission.
Strand, J., Bossi, R., Sortkjær, O., Landkildehus, F., Larsen, M.M. (2007) PFAS og organotinforbindelser i punktkilder og det akvatiske miljø (PFAS and organotin compounds in point source effluents and in aquatic environment) (in Danish). DMU (NERI) Rapport 608. 49 pp.
Annex 1 Assessment unit level confidence summary
Confidence is evaluated per assessment unit based on a relative evaluation of following parameters for the copper indicator: 1) spatial component, 2) temporal component, 3) methodological component, and 4) the evaluation component. Despite the common approach applied with other indicators the information set out here is not directly comparable as it only focusses on an evaluation within each indicator (i.e. is relative only between the evaluated assessment units for copper) and it furthermore only addresses the evaluated units. More general information related to overarching confidence and required improvements are detailed in the main report.
The confidence for each component was applies based on a categorical approach using high, moderate and low. To achieve the overall summary confidence a score of 0.25 was applied to low, 0.5 to moderate and 1.0 to high with an average value calculated across the components and the same scores used to then select he final overall category.
Spatial component: Open sea and coastal areas were treated separately due to the scale of sea area being vastly different. The area (km2) for each evaluated assessment unit was divided by the total number of stations in the assessment unit and the resulting area per station was used to divide into three categories, roughly interpreted as stations addressing small, medium or large areas. If a large number (relatively) of stations were still available despite the area being large an increase of 1 category was applied.
Temporal component: The presence of ‘full’ and/or ‘initial’ data series was utilised to evaluate this. Where only a single initial data series/station was present a category of low was applied, where two initial data series were available a category of moderate was applied, where a single full data series was present a category of moderate was applied, and where two or more full data series were present a category of high was applied.
Methodological component: A score of high is applied to all evaluated assessment units since the indicator is evaluated using the MIME tool and applies a regionally agreed methodology and threshold values on national monitoring data.
Evaluation component: The standard error generated within the MIME assessment tool is utilised as a proxy for this component. In simple terms the basis of this evaluation is that standard error can be roughly equated to a coefficient of variance. This therefore provides a general confidence evaluation of the underlying data and variation within it. A categorical approach was applied where standard error values >0.70 were scored as low, 0.4-0.7 were scored as moderate and <0.4 were scored as high.
The confidence is provided for biota below (Annex 1 – Tables 1-2).
The overall confidence for the OOAO status evaluation is also generated using a OOAO approach from these tables below, suing the overall category.
Annex 1 – Table 1. Summary table showing categorical confidence per component and overall for PFOS in biota.
| Assessment unit | Spatial | Temporal | Methodological | Evaluation | Overall |
| DEN-002 | High | Low | High | Moderate | Moderate |
| DEN-006 | High | High | High | High | High |
| DEN-024 | High | Moderate | High | High | Moderate |
| DEN-025 | High | Low | High | Low | Moderate |
| DEN-044 | High | Low | High | Low | Moderate |
| DEN-047 | High | Low | High | Low | Moderate |
| DEN-089 | High | Low | High | Low | Moderate |
| DEN-095 | High | Low | High | Low | Moderate |
| DEN-102 | High | Low | High | Low | Moderate |
| DEN-110 | High | High | High | Moderate | Moderate |
| DEN-114 | High | Low | High | Moderate | Moderate |
| DEN-123 | High | Low | High | Low | Moderate |
| DEN-137 | High | High | High | Moderate | Moderate |
| DEN-138 | High | Low | High | Low | Moderate |
| DEN-139 | High | Low | High | Low | Moderate |
| DEN-140 | High | Low | High | Low | Moderate |
| DEN-160 | High | Moderate | High | Moderate | Moderate |
| DEN-200 | High | Low | High | Low | Moderate |
| DEN-201 | High | Low | High | Low | Moderate |
| DEN-206 | Moderate | Low | High | Moderate | Moderate |
| DEN-214 | High | Low | High | Low | Moderate |
| DEN-235 | High | Moderate | High | Moderate | Moderate |
| DEN-238 | High | Low | High | Low | Moderate |
| EST-002 | High | Low | High | Low | Moderate |
| EST-003 | High | Low | High | Low | Moderate |
| EST-005 | High | Low | High | Low | Moderate |
| EST-009 | High | Low | High | Low | Moderate |
| EST-010 | Moderate | Low | High | Low | Moderate |
| EST-013 | High | Low | High | Low | Moderate |
| EST-014 | High | Low | High | Low | Moderate |
| EST-016 | High | Low | High | Low | Moderate |
| EST-019 | Moderate | Low | High | Low | Moderate |
| FIN-001 | Moderate | Low | High | Low | Moderate |
| FIN-003 | High | High | High | High | High |
| FIN-004 | Low | Low | High | Low | Low |
| FIN-005 | Moderate | Low | High | Moderate | Moderate |
| FIN-006 | High | Low | High | Low | Moderate |
| FIN-008 | High | Low | High | Moderate | Moderate |
| FIN-010 | High | High | High | High | High |
| FIN-014 | Low | Low | High | Moderate | Moderate |
| GER-002 | High | Moderate | High | Moderate | Moderate |
| GER-011 | High | Moderate | High | Moderate | Moderate |
| GER-020 | High | Moderate | High | Moderate | Moderate |
| LAT-001 | High | Low | High | Low | Moderate |
| LAT-004 | High | Low | High | Low | Moderate |
| POL-002 | High | Moderate | High | Moderate | Moderate |
| POL-003 | High | Moderate | High | Low | Moderate |
| POL-019 | High | Low | High | Moderate | Moderate |
| SWE-011 | Moderate | Moderate | High | Moderate | Moderate |
| SWE-012 | High | High | High | Moderate | Moderate |
| SWE-016 | High | High | High | Moderate | Moderate |
| SWE-018 | Moderate | Moderate | High | Moderate | Moderate |
| SWE-021 | High | High | High | Moderate | Moderate |
| SWE-022 | High | High | High | Moderate | Moderate |
| SWE-023 | Low | Moderate | High | Moderate | Moderate |
| SEA-001 | Moderate | High | High | High | Moderate |
| SEA-003 | High | Low | High | Low | Moderate |
| SEA-006 | Moderate | High | High | High | Moderate |
| SEA-007 | Moderate | High | High | High | Moderate |
| SEA-008 | Moderate | High | High | Moderate | Moderate |
| SEA-009 | High | High | High | High | High |
| SEA-010 | Low | High | High | Moderate | Moderate |
| SEA-011 | Moderate | Low | High | Low | Moderate |
| SEA-012 | Low | High | High | Moderate | Moderate |
| SEA-013 | High | High | High | High | High |
| SEA-015 | Moderate | High | High | High | Moderate |
| SEA-016 | High | Low | High | Low | Moderate |
| SEA-017 | Low | Low | High | Low | Low |
Annex 1 – Table 2. Summary table showing categorical confidence per component and overall for PFOS in water.
| Assessment unit | Spatial | Temporal | Methodological | Evaluation | Overall |
| DEN-113 | High | Low | High | Low | Moderate |
| EST-001 | High | Moderate | High | Moderate | Moderate |
| EST-002 | Moderate | Low | High | Low | Moderate |
| EST-003 | High | Moderate | High | Low | Moderate |
| EST-005 | High | Moderate | High | Moderate | Moderate |
| EST-008 | High | Low | High | Low | Moderate |
| EST-009 | High | Low | High | Low | Moderate |
| EST-010 | Low | Low | High | Low | Low |
| EST-011 | High | Moderate | High | Low | Moderate |
| EST-013 | High | Low | High | Low | Moderate |
| EST-014 | Moderate | Low | High | Low | Moderate |
| EST-016 | High | Moderate | High | Moderate | Moderate |
| GER-031 | High | Low | High | Low | Moderate |
| GER-032 | High | Low | High | Low | Moderate |
| GER-044 | High | Low | High | Low | Moderate |
| LIT-002 | High | Moderate | High | Low | Moderate |
| LIT-003 | High | Low | High | Low | Moderate |
| LIT-006 | High | Moderate | High | Low | Moderate |
| POL-002 | High | Low | High | Low | Moderate |
| SEA-009 | Moderate | Moderate | High | High | Moderate |