 Ringed seal abundance
2.1 Ecological relevance
The population trends and abundance of seals reflect changes in the number of marine top predators in the Baltic Sea. Being top predators of the marine ecosystem, marine mammals are good indicators of the state of food webs, levels of hazardous substances and direct human disturbance. Seals are exposed to bottom-up effects of ecosystem changes at lower trophic levels, but also to variations in climate (length of seasons and ice conditions) and human impacts. These pressures can affect seals indirectly through e.g., decline of fish stocks, levels of harmful substances, reproductive success in addition to causing direct mortality by hunting or by-catch. The vulnerability of seals to these pressures make them good indicators for measuring the environmental status of ecosystems.
The growth rate of a population is the result of age-specific mortality rates and age-specific fecundity rates. It is therefore a sensitive parameter signalling if mortality or fecundity rates change. Depleted, undisturbed ringed seal populations are expected to grow by 10% per year. Significantly decreasing growth rates can be signs of density-dependence for example due to limiting food or other resources (Svensson et al. 2011), the functional factors of carrying capacity. However, decreasing growth can also indicate impaired health caused by contaminants or diseases, as well as excessive hunting or high levels of by-catches.
2.2 Policy relevance
The core indicator(s) on the population trends and abundance of Baltic seals addresses the Baltic Sea Action Plan (BSAP 2021) Biodiversity segment goal of a “Baltic Sea ecosystem [that] is healthy and resilient”. The ecological objectives under this goal are also clearly relevant: ‘Viable populations of all native species’, ‘Natural distribution, occurrence and quality of habitats and associated communities’, and ‘Functional, healthy and resilient food webs’.
The HELCOM Recommendation 27/28-2 Conservation of seals in the Baltic Sea area outlines the conservation goals of seals agreed on at HELCOM. The recommendation is implemented to reach the BSAP goals. The recommendation conservation goals are used as the basis for defining this indicator’s threshold value.
The indicator also has clear relevance for the EU Marine Strategy Framework Directive (MSFD), for those Contracting Parties that are also EU Member States. In particular the relevance is high for MSFD Descriptor 1 that addresses species and habitats and also for Descriptor 4 that addresses ecosystems, including food webs.
A summary overview of policy linkages is provided in Table 1, below.
In some Contracting Parties, the indicator also has potential relevance for implementation of the EU Habitats Directive. The WFD includes status categories for coastal waters as well as environmental and ecological objectives. The EU Habitats Directive (European Commission 1992) specifically states that long-term management objectives should not be influenced by socio-economic considerations, although they may be considered during the implementation of management programmes provided the long-term objectives are not compromised. All seals in Europe are also listed under the EU Habitats Directive Annex II, and member countries are obliged to monitor the status of seal populations.
Table 1. Overview of policy relevance for this indicator.
| Baltic Sea Action Plan (BSAP) | Marine Strategy Framework Directive (MSFD) | |
| Fundamental link | Segment: Biodiversity
Goal: “Baltic Sea ecosystem is healthy and resilient”
|
Descriptor 1 Species groups of birds, mammals, reptiles, fish and cephalopods.
|
| Complementary link | Segment: Biodiversity
Goal: “Baltic Sea ecosystem is healthy and resilient”
Segment: Hazardous substances and litter goal Goal: “Baltic Sea unaffected by hazardous substances and litter”
|
Descriptor 1 Species groups of birds, mammals, reptiles, fish and cephalopods.
Descriptor 4 Ecosystems, including food webs.
Descriptor 8 Concentrations of contaminants are at levels not giving rise to pollution effects.
|
| Other relevant legislation: |
|
|
2.3 Relevance for other assessments
The status of biodiversity is assessed using several core indicators. Each indicator focuses on one important aspect of this complex issue. In addition to providing an indicator-based evaluation of the population trends and abundance of seals, this indicator will also contribute to the overall biodiversity assessment, along with the other biodiversity core indicators.
The results are utilised in the HELCOM Biodiversity integrated assessment (BEAT tool) to support an overall evaluation of marine mammals.
Status for the population trends and abundance of seals in the Baltic Sea is determined by comparing population data with threshold values that have been defined based on concepts developed for the conservation of seals, in particular the HELCOM Recommendation 27/28-2 ‘Conservation of seals in the Baltic Sea area’, which states that the population size is to be managed with the long-term objective of allowing seal populations to recover towards carrying capacity.
Good status is achieved for population trends and abundance of seals in a management unit if the population is above the Limit Reference Level (LRL). Good status for abundance is achieved in a management unit if the population is above the Limit Reference Level (LRL). HELCOM set a LRL of 10,000 individuals for all the Baltic seal species for each ecologically and genetically isolated population. The LRL corresponds to the safe biological level and minimum viable population size. The LRL of 10,000 implies a population with approximately 5,000 adult seals (and thus 2,500 adult female seals). LRL has been calculated based on estimates of minimum viable population sizes based on different extinction risk levels (1, 3, 5 and 10%) for genetically and ecologically isolated populations. Although several values were modelled for these parameters, the set LRL only reflects one of these percentage values: 1% extinction risk over 100 years. For ringed seals the results of the line-transect surveys represent number of seals hauled out on ice during the survey. The hauled-out fraction of the total population is currently unknown, but it has recently varied a lot depending on ice-conditions. At the moment, the results of the surveys can only be taken as minimum abundance estimate.
The growth rate aspect of the threshold value is assessed separately for populations at and below the Target reference level (TRL). TRL is the level where the growth rate starts to level off and the population asymptotically approaches the current carrying capacity level.
- For populations that have reached the TRL, good status is defined as ‘No decline in population size exceeding 10% occurred over a period up to 10 years’
- For populations below TRL, good status is defined as 3% below the maximum rate of increase for seal species, i.e. 7% annual rate of increase for ringed seals.
The approach, methods and data used to define the threshold values for abundance and growth rates are explained in detail in the previous indicator report Population trends and abundance of seals HELCOM core indicator 2018 (pdf).
The results of the indicator evaluation that underlie the key message map and information are provided below.
4.1 Status evaluation
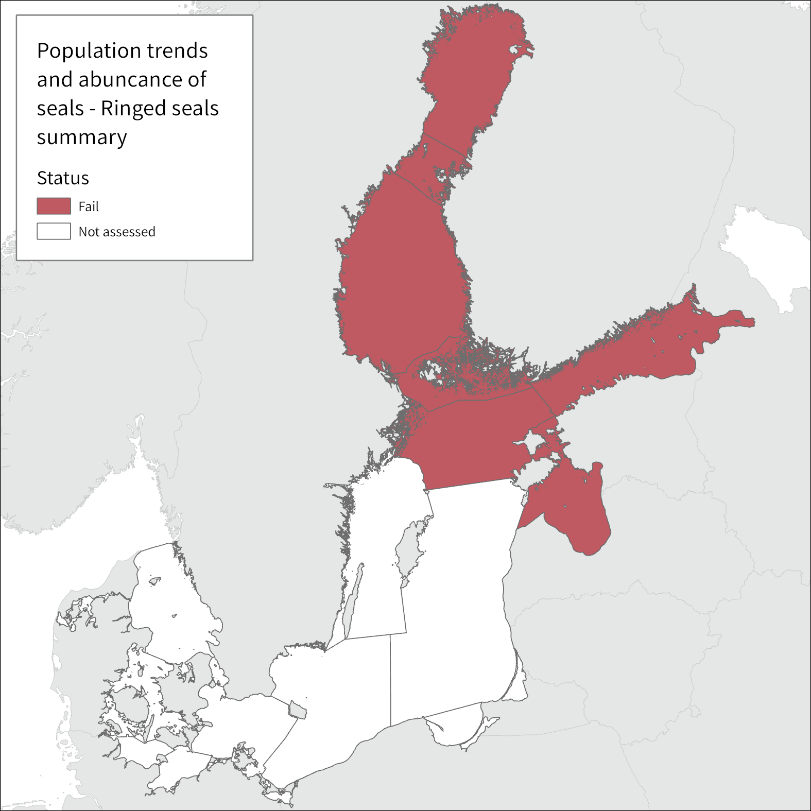
Both ringed seal management units fail to achieve good environmental status the population growth rates are below the threshold value for good status (Figure 2).
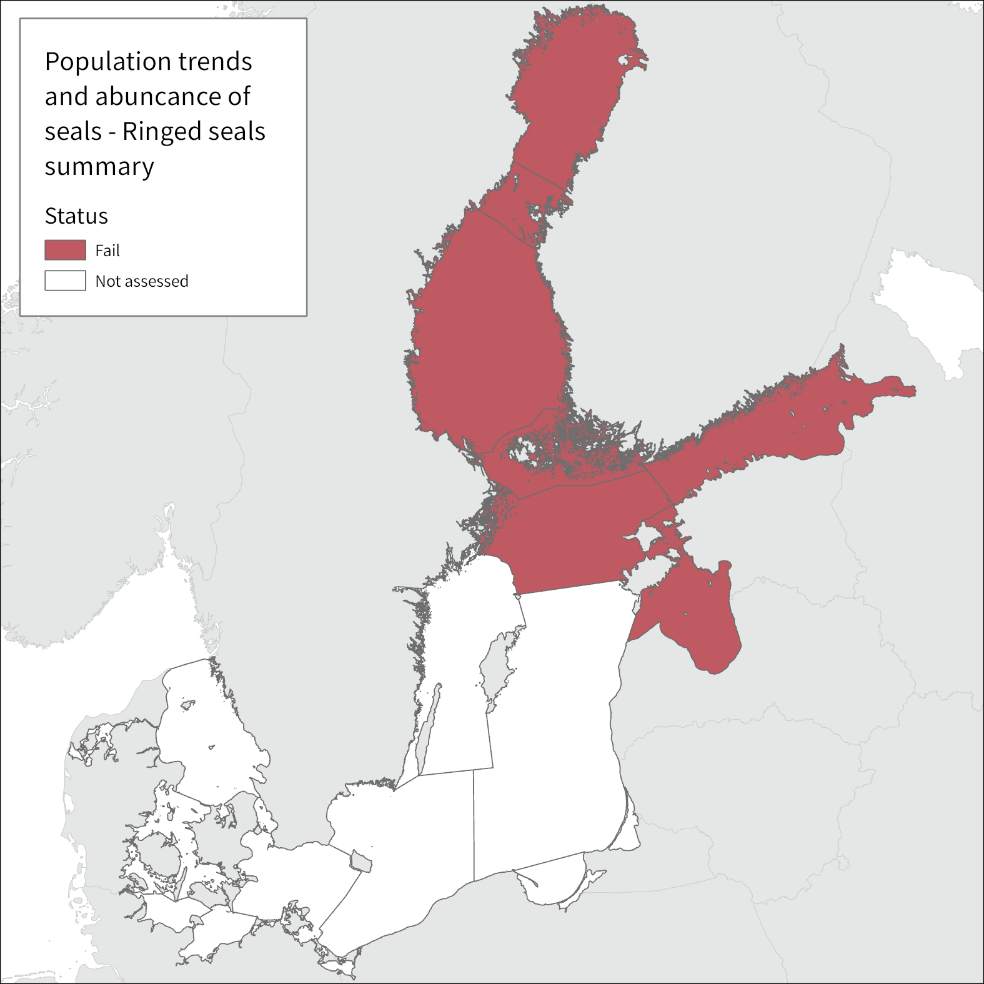
Figure 2. Ringed seals in the two management units (1 – the Bothnian Bay and 2 – the southern unit encompassing the Archipelago Sea, the Gulf of Finland and the Gulf of Riga including Estonian coastal waters) do not achieve good status.
Bothnian Bay ringed seal management unit
Population trend evaluation: The ringed seal population in the Bothnian Bay management unit was growing with annual rate of 4.6% during 1988-2012. For a later part of that period, growth rate tends to be somewhat higher, but given the interannual variation in the survey results, average annual growth rate varies depending on the exact period of years selected: it was 4.9% for 2000-2012, 5.6% for 2002-2012, 6.8% for 2003-2012 and 5.5% for 2004-2012 (Figure 3). A Bayesian analysis gives 80 % support for a growth rate ≥ 5.0 % during 2003-2012 which is well below the threshold value of 7%.
However, the growth rate could only be calculated until 2012. Since then, inventory results have been anomalously high with extreme inter-annual variation, the results do not fit with the previous trend-lines and show “increases” that are not biologically possible. The ice-conditions are changing in Bothnia Bay and it is hypothesised that the inconsistent survey results are a result of an increased fraction of the total population being observed hauled-out on the ice during the survey period, likely due to lower ice-coverage and earlier ice-breakup. These results are excluded from the trend analysis as statistical outliers and because they likely do not reflect the same fraction of the population as earlier surveys and strongly reflect variations in ice (Table 2). Due to exceptionally mild winters in recent years, the compact pack ice and fast ice, which are the most preferred habitats of ringed seals, have started to break up during or before the survey time. In these circumstances, new features in the hauling out behaviour of ringed seals has been observed. In survey years where there have been a lot of cracks in the pack and fast ice in the time of the surveys, seals have been observed hauled-out on the ice in large groups. This phenomenon was not observed in years prior to 2012 where seals were mostly observed individually or in pairs or groups of a few individuals and there was more intact fast and pack ice. Even if trend calculation for recent years is not possible, no improvement of the population growth rate is expected given deteriorating breeding conditions and increased hunting pressure. There have, however, been no indication of a major decrease in the population. Based on available data the Bothnian Bay management unit of ringed seals do not achieve good environmental status for population trend.
Population abundance evaluation: The survey results from 2015, a year with very limited ice-cover and early ice-breakup revealed that the population size most probably exceeded 20 000 animals in the Bothnian Bay management unit. During this assessment period the highest estimated number of hauled-out seals was 14602 individuals. This is well above the LRL of 10 000 animals and the Bothnia Bay ringed seal population achieve good environmental status for population abundance. The proportion of the true population hauled-out on the ice during the survey remains uncertain.
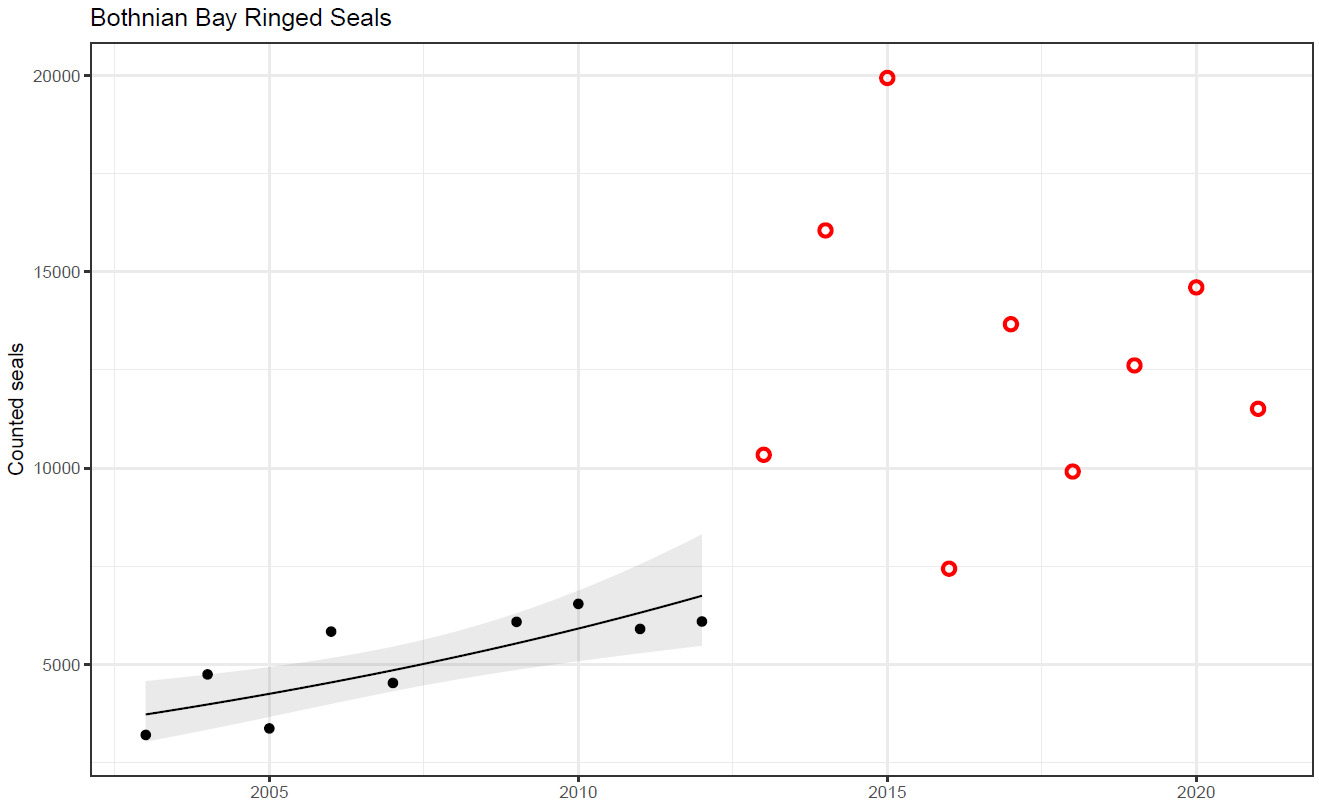
Figure 3. The estimated number of ringed seals hauled out on the ice during moult 2003-2021. The annual growth rate of ringed seals in the Bothnian Bay during 2003-2012 was 6.8 %, while the Bayesian analysis showed 80% support for a growth rate ≥5.0 %. The growth rate was under the threshold of 7%. After 2012 (red circles) the data is not comparable as a different fraction of the seal population is hauling-out, making them incomparable statistical outliers. The criteria for good status are not met based on growth rate 2003-2012 and there is no evidence of improvement. Modelled count index and 95% confidence interval around index are provided with a black line and grey area.
Table 2. Annual ringed seal survey results from the Bothnian Bay showing the number of observed ringed seals on the survey strips, fraction of the area covered with the survey strips and the estimated number of seals hauled out on the ice (calculated from the first two variables).
| Year | Observed | Sampling fraction | Hauling out |
| 2003 | 426 | 13.3 | 3203 |
| 2004 | 631 | 13.3 | 4744 |
| 2005 | 448 | 13.3 | 3368 |
| 2006 | 776 | 13.3 | 5835 |
| 2007 | 602 | 13.3 | 4526 |
| 2008 | |||
| 2009 | 809 | 13.3 | 6083 |
| 2010 | 1740 | 26.6 | 6541 |
| 2011 | 785 | 13.3 | 5902 |
| 2012 | 3241 | 53.2 | 6092 |
| 2013 | 1375 | 13.3 | 10338 |
| 2014 | 4222 | 26.3 | 16053 |
| 2015 | 3441 | 17.26 | 19936 |
| 2016 | 502 | 6.75 | 7437 |
| 2017 | 2332 | 17,07 | 13664 |
| 2018 | 1331 | 13,43 | 9911 |
| 2019 | 1842 | 14,6 | 12615 |
| 2020 | 3154 | 21,6 | 14602 |
| 2021 | 2486 | 21,6 | 11509 |
Southern ringed seal management unit
In the southern ringed seal management unit (i.e. Gulf of Riga, Gulf of Finland and the Archipelago Sea) improving trends have not been observed and the counted number of individuals only sum up to a small fraction of the LRL. Due to lack of ice in most years, survey methods for ice-free circumstances have been under development in all the three areas. The western Estonia population has been surveyed with these methods five times during this assessment period (2016, 2018-2021). The results have been at approximately same level compared to the earlier surveys over ice and indicate a stable trend at around 1000 ringed seals and the total population size is estimated to 1500 individuals (Figure 4, Jüssi & Jüssi, 2017). In the Archipelago Sea, ice-free methods are still under development. Based on the sporadic surveys over ice and the incomplete counts in ice-free winters, no indication of an increasing trend can be derived (M. Ahola, pers. comm.). The best estimates for the total population size in the area are at the level of 200 animals (Ahola & Nordström, 2017). In the Gulf of Finland three traditional aerial surveys in sufficient ice conditions have been conducted (2017, 2018, 2021). The results varied around 100 ringed seals, with no sign of increase, (M. Verevkin & M. Jüssi, unpublished data). These are alarmingly low numbers and trends. Thus, the Southern ringed seal management unit clearly does not achieve good environmental status for population abundance or growth rate.
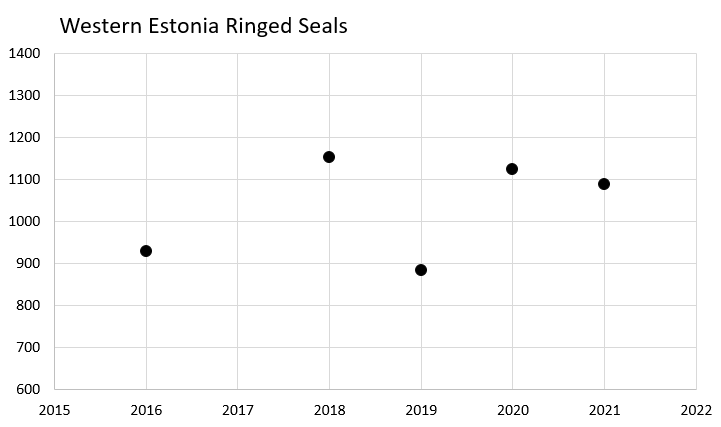
Figure 4. The number of ringed seals hauled out in Western Estonia on land in ice-free years during moult 2016-2021. The few data-points do not indicate any change in the abundance, but a longer time-series is needed for drawing further conclusions.
4.2 Trends
The status of the Population trends and abundance – indicator for both ringed seal management units remained the same as in the previous assessment (HOLAS II).
4.3 Discussion text
Table 3. Overview of evaluation outcomes and comparison with previous evaluations.
| HELCOM Assessment unit name (management areas) | Threshold value achieved/failed | Distinct trend between current and previous evaluation. | Description of outcomes, if pertinent. |
| Bothnian Bay | failed | In the previous indicator report (during HOLAS II) GES was not achieved | Taken into account deteriorating breeding conditions and increased hunting pressure, no status improvement is anticipated. |
| Southern management unit (subpopulations in Archipelago Sea, Gulf of Finland, Western Estonia) | failed | In the previous indicator report (during HOLAS II) GES was not achieved | Taken into account deteriorating breeding conditions and increased hunting pressure, no status improvement is anticipated. |
5 Confidence
Although it is important for management to obtain better data from the southern part of the population, in terms of evaluation under this indicator it can be confidently stated that the stocks in the Southern management unit are very far from good status both with respect to abundance as well as growth rate, which is why the confidence of the evaluation is high. The Bothnian Bay management unit exceeds the LRL based on the number of seals estimated to be hauled out on the ice. However, the growth rate is uncertain as is the fraction of the population observed on ice. The original assumptions of the survey method were that the same fraction of the population haul out on the ice and that the seals are evenly distributed on the ice- allowing data to be scaled up from the line-transect to encompass the whole ice-covered area. Due to the high inter-annual variation in survey results after 2012, due to the changed haul-out behaviour of the seals during the survey period, tracking accurate trends in the Bothnian Bay is currently not possible. Therefore, the confidence of the evaluation is low. Even in the absence of the trend, no status improvement can be foreseen considering deteriorating breeding conditions and increased hunting pressure.
Historically, hunting of seals has been a major human pressure on all the seal species in the Baltic Sea. A coordinated international campaign was initiated in the beginning of the 20th century with the aim of exterminating the seals (Anon 1895). Bounty systems were introduced in Denmark, Finland and Sweden over the period 1889-1912, and very detailed bounty statistics provide detailed information on the hunting pressure. The original population sizes have been estimated to be about 180,000 ringed seals in the Baltic (Harding & Härkönen 1999).
The hunting pressure resulted ringed seals to decline to about 25,000 seals in the 1940s (Harding & Härkönen 1999). After these heavy reductions, populations appear to have been stable up to the 1960s (Harding & Härkönen 1999).
Then, in the beginning of the 1970s, grey seals were observed aborting near full term foetuses, and only 17% of ringed seal females were fertile (Helle 1980). Later investigations showed a linkage to a disease syndrome including reproductive disorder, caused by organochlorine pollution, in both grey seals and ringed seals (Bergman & Olsson 1985). The reduced fertility resulted in population crashes, where numbers of ringed and grey seals dwindled to approximately 3,000 of each species in the beginning of the 1980s (Harding & Härkönen 1999). Increasing numbers of these species were only recorded after levels of PCB in biota decreased by the end of the 1980s.
Incidental catches of seals in fisheries are known to have substantial effects on the population growth rate of ringed seal subspecies such as the Saimaa and Ladoga ringed seals (Sipilä 2003). The current knowledge on the level of incidental catches of Baltic seal species is limited to a few dedicated studies which suggest that this factor can be substantial. An analysis of reported incidentally caught grey seals estimated that approximately 2,000 grey seals are caught annually in the Baltic fisheries (Vanhatalo et al. 2014), but numbers of incidentally caught ringed seals and harbour seals are not known. Hunting of ringed seals has increased in the last few years with current quotas for in Sweden at 420 individuals (protective hunt) and 375 in Finland (quota-based regular hunt).
Most haul-out sites of harbour and grey seals in the Baltic are protected during critical periods of time, since seals are vulnerable to disturbance during the lactation period. For ringed seals only a very few protected areas are established, since they are primarily hauling out on ice. However, with decreasing ice-cover ringed seals are increasingly dependent on land haul-outs especially in the southern management unit, but also in the Bothnian Bay during the ice-free times of the year. Currently land-haulouts across the range are not well known.
Table 4. Brief summary of relevant pressures and activities with relevance to the indicator.
| | General | MSFD Annex III, Table 2a | ||
| Strong link | The main pressures affecting the abundance and growth rate of Baltic seal populations include hunting, by-catches, and disturbance
The effects of climate change are a threat to the ringed seal that breeds on sea ice |
Biological disturbance:
-selective extraction of species, including incidental non-target catches (e.g. by commercial and recreational fishing) |
||
| Weak link |
|
Contamination by hazardous substance:
– introduction of synthetic compounds – introduction of non-synthetic substances and compounds |
Climate change is expected to have significant impacts on the Baltic Sea ecosystem (HELCOM and Baltic Earth, 2021). Climate change poses a pressure on species breeding on ice because shorter and warmer winters lead to more restricted areas of suitable ice fields (Meier et al. 2004, 2022). In addition to decreasing amount of habitat, the deteriorating ice-conditions are likely to reduce reproductive success of ringed seals. Ringed seals are adapted to breed in lairs they burrow in the drifted snow on ice. The lairs protect the pups both against predation and harsh weather. As a result, the predicted rate of climate warming is likely to cause extirpation of the southern subpopulations (Sundqvist et al. 2012, Meier et al. 2022). Consequently, ringed seals are predicted to be negatively affected by a warmer climate.
Both the Bothnian Bay and the Southern ringed seal management unit fail to achieve good environmental status.
8.1 Future work or improvements needed
Further research and relevant quantitative measures for the ice quality are needed to gain a better understanding the haulout behaviour of ringed seals, calibrating the survey results in different ice-conditions to establish reliable trend indexes and for estimating the true population size.
The Baltic ringed seal is distributed in the Gulf of Bothnia (first management unit) and the Archipelago Sea, Gulf of Finland and Gulf of Riga (second management unit). Ringed seals from both areas have shown a high degree of site fidelity (Härkönen et al. 2008) and it is unlikely that extensive migrations occur at current low population numbers, although some individuals may show more extensive movements during foraging season (Oksanen et al. 2015). However, more research is needed to understand the population structure and possible gene flow between the management units. Current degree of gene-flow and connections even between the three southern areas are poorly known. Therefore, it is unclear if they should be assessed separately or kept as one unit. Monitoring on all of them have been challenged by the degraded ice-conditions which have also likely negatively affected reproductive success in these subpopulations. Thus, better knowledge on the population structure in the southern management unit is needed. Still, it is clear that the status of abundance and population trend of the southern sub-populations is not good.
9.1 Scale of assessment
This core indicator evaluates the population trends and abundance of seals using HELCOM assessment unit scale 2 (division of the Baltic Sea into 17 sub-basins). The assessment units are defined in the HELCOM Monitoring and Assessment Strategy Attachment 4.
The existing management units of seals are based on the distribution of seal populations. The management units typically encompass a handful of HELCOM scale 2 assessment units. Evaluations are therefore done by grouping HELCOM assessment units to align with the management units defined for each seal population.
Monitoring of ringed seal populations is based on aerial transect sampling surveys over ice-covered areas in the Bothnian Bay. This method has been poorly applicable for the southern management unit and therefore methods for counting ringed seals at their land haul-outs have been under development for the southern sub-populations.
Ringed seals in the Bothnian Bay management unit are surveyed using aerial transect sampling methodology during their moult on the ice (HELCOM Monitoring Manual in the Sub-programme: Seal Abundance). Monitoring area varies between years with the area which is covered by ice in the time of surveys. This method has been poorly applicable for the southern management unit and therefore methods for ice-free circumstances have been under development for all southern sub-populations. Current monitoring covers all haul-out areas which are used by ringed seals in most areas, but in the Archipelago Sea haulouts in some parts of the area are still inadequately mapped.
9.2 Methodology applied
This core indicator evaluates whether good status is achieved by determining the growth rate of the population as well as the population size over a specified time period. The data collected and used in this indicator are based on national aerial surveys described in Galatius et al. (2014).
Each assessment unit is evaluated against two threshold values, for population growth rate and the Limit Reference Level (LRL). The overall status of seals in each management unit only achieves good status if both threshold values are met.
Time series of data are used as input values in Bayesian analysis with uninformative priors, where it is evaluated whether observed data support the set threshold value. In this process, 80% support for a growth rate ≥ the threshold value is required. If the unit fails to achieve good status, the probability distribution is used to evaluate the confidence of the assessment. The package ‘bayesm’ in the program R has been used for the analysis. For further details, see the previous indicator report.
9.3 Monitoring and reporting requirements
Monitoring methodology
HELCOM common monitoring relevant for the seal population trends is documented on a general level in the HELCOM Monitoring Manual under the Sub-programme: Seal Abundance.
Detailed descriptions of the survey methodology and analysis of results are given in the HELCOM monitoring guidelines.
Current monitoring
The monitoring activities relevant to the indicator that are currently carried out by HELCOM Contracting Parties are described in the HELCOM Monitoring Manual in the Monitoring Concept Table.
The data and resulting data products (e.g. tables, figures and maps) available on the indicator web page can be used freely given that it is used appropriately and the source is cited. The indicator should be cited as following:
HELCOM (2018) Population trends and abundance of seals. HELCOM core indicator report. Online. [Date Viewed], [Web link].
ISSN: 2343-2543
Result: Population trends and abundance of seals – Ringed seal
Data: Population trends and abundance of seals – Ringed seal
Status assessments are to be accomplished by the Lead and co-Lead countries. The outcome of such assessments will be presented and discussed at the next HELCOM Seal Expert Group meeting.
This indicator report for HOLAS 3 was prepared by Markus Ahola, Anders Galatius and Anja Carlsson. The assessment principles, methodology and background information are largely based on the previous assessment report by Tero Härkönen, Anders Galatius, Morten Tange Olsen, Markus Ahola, Karin Hårding, Olle Karlsson, Mervi Kunnasranta, Lena Avellan, Petra Kääriä, Minna Pyhälä, Owen Rowe.
This version of the HELCOM core indicator report was published in April 2023:
The current version of this indicator (including as a PDF) can be found on the HELCOM indicator web page.
Earlier versions of the indicator report are available:
Population trends and abundance of seals HELCOM core indicator 2018 (pdf)
Core indicator report – web-based version January 2016 (pdf)
Extended core indicator report – outcome of CORESET II project (pdf)
Population growth rate, abundance and distribution of marine mammals 2013 (pdf)
Ahola, M. & Nordström, M. 2017. The Southern subpopulations of the Baltic ringed seal –The Archipelago Sea. – In: Halkka, A. & Tolvanen, P. (eds.). The Baltic Ringed Seal – An Arctic Seal in European Waters – WWF Finland report 36.
Anon. (1895) Svensk fiskeritidskrift 1895.
Bergman, A., Olsson, M. (1985) Pathology of Baltic grey seal and ringed seal females with special reference to adrenocortical hyperplasia: Is environmental pollution the cause of a widely distributed disease syndrome. Finnish Game Res. 44: 47-62.
European Commission (1992) Council Directive 92/43/EEC of 21 May 1992 on the conservation of natural habitats and of wild fauna and flora (Habitats Directive). Off. J. Eur. Union 206: 7–50.
Galatius, A., Ahola, M., Härkönen, T., Jüssi, I., Jüssi, M., Karlsson, O., Verevkin, M. (2014) Guidelines for seal abundance monitoring in the HELCOM area 2014. Available at: http://helcom.fi/Documents/Action%20areas/Monitoring%20and%20assessment/Manuals%20and%20Guidelines/Guidelines%20for%20Seal%20Abundance%20Monitoring%20HELCOM%202014.pdf
Harding, K.C., Härkönen, T.J. (1999) Development in the Baltic grey seal (Halichoerus grypus) and ringed seal (Phoca hispida) populations during the 20th century. Ambio 28: 619-627.
Harkonen, T., Bäcklin, B.-M., Barrett, T., Anders Bergman, A., Corteyn, M., Dietz, R., Harding, K., Malmsten, J., Roos, A., Teilmann, T. (2008) Mass mortality in harbour seals and harbour porpoises caused by an unknown pathogen. The Veterinary Record 162: 555-556.
Harkonen, T., Jüssi, M., Jüssi, I., Verevkin, M., Dmitrieva, L., Helle, E., Sagitov, R., Harding, K.C. (2008) Seasonal activity budget of adult Baltic ringed seals (Phoca hispida botnica). PLoS ONE 3(4): e2006.doi:10.1371/journal.pone.0002006.
HELCOM and Baltic Earth, 2021. Climate Change in the Baltic Sea 2021 Fact Sheet.
Helle, E. (1980) Lowered reproductive capacity in female ringed seals (Pusa hispida) in the Bothnian Bay, northern Baltic Sea, with special reference to uterine occlusions. Annales Zoologica Fennici 17: 147-158.
Jüssi, I. & Jüssi, M. 2017. The Southern subpopulations of the Baltic ringed seal –The Estonian coast. – In: Halkka, A. & Tolvanen, P. (eds.). The Baltic Ringed Seal – An Arctic Seal in European Waters – WWF Finland report 36
Meier, H.E.M., Döscher, R., Halkka, A. (2004) Simulated distributions of Baltic Sea-ice in the warming climate and consequences for the winter habitat of the Baltic Ringed Seal. Ambio 33: 249–256.
Meier, H. E. M., Kniebusch, M., Dieterich, C., Gröger, M., Zorita, E., Elmgren, R., Myrberg, K., Ahola, M., Bartosova, A., Bonsdorff, E., Börgel, F., Capell, R., Carlén, I., Carlund, T., Carstensen, J., Christensen, O. B., Dierschke, V., Frauen, C., Frederiksen, M., Gaget, E., Galatius, A., Haapala, J. J., Halkka, A., Hugelius, G., Hünicke, B., Jaagus, J., Jüssi, M., Käyhkö, J., Kirchner, N., Kjellström, E., Kulinski, K., Lehmann, A., Lindström, G., May, W., Miller, P., Mohrholz, V., Müller-Karulis, B., Pavón-Jordán, D., Quante, M., Reckermann, M., Rutgersson, A., Savchuk, O. P., Stendel, M., Tuomi, L., Viitasalo, M., Weisse, R., and Zhang, W. 2021. Climate Change in the Baltic Sea Region: A Summary, Earth Syst. Dynam. 13: 457-593, https://doi.org/10.5194/esd-13-457-2022.
Sipilä, T. (2003) Conservation biology of Saimaa ringed seal (Phoca hispida saimensis) with reference to other European seal populations. PhD Thesis. Available at: http://ethesis.helsinki.fi/julkaisut/mat/ekolo/vk/sipila/conserva.pdf?q=phoca.
Svensson, C.J., Hansson, A., Harkonen, T., Harding, K. (2011) Detecting density dependence in growing seal populations. Ambio (2011) 40: 52–59. DOI 10.1007/s13280-010-0091-7.
Sundqvist, L., Harkonen, T., Svensson, C.J., Harding, K.C. (2012) Linking climate trends to population dynamics in the Baltic ringed seal – Impacts of historical and future winter temperatures. Ambio. DOI 10.1007/s13280-012-0334-x.
Vanhatalo, J., Vetemaa, M., Herrero, A., Aho, T., Tiilikainen, R. (2014) By-Catch of Grey Seals (Halichoerus grypus) in Baltic Fisheries—A Bayesian Analysis of Interview Survey. PLoS ONE 9(11): e113836. doi:10.1371/journal.pone.0113836.