 TBT and imposex
2 Relevance of the indicator
Organotin, and in particular TBT, has been shown to be very toxic to marine life, resulting in changes in oyster shells and interfering with the marine gastropods female reproductive organ, an effect known as imposex, causing sterility in some sensitive species. TBT is bioaccumulated by marine organisms causing harmful effects that mainly depend on the level of its final concentration in the tissues. Mussels are not able to degrade TBT by de-butylation, as fish and some marine gastropods are. Levels can be high in top-predators (Strand et al, 2005; Law et al, 2012). That is why the concentrations of TBT, especially those of importance to ecosystem or human health, have to be monitored.
TBT and triphenyltin (TPT) were introduced in antifouling paints in the 1960s, but soon after, effects on growth and shell formation were found in French oyster grounds, and shortly after, also the effect on marine gastropods reproductive system was discovered. This led to a ban on use of these paints on pleasure boats, and eventually followed up by a total ban on TBT in antifouling paints (782/2003/EC (EC, 2003)) effective from 2008 (OSPAR, 2014).
2.1 Ecological relevance
Since 1960, the tri-substituted OTC (TBT and TPT) has been used extensively as biocide in antifouling paints for boats. It was very efficient and considered to have a low toxicity to mammals. The use has been restricted in many countries, starting in France 1982, because of the recognised adverse effects of these compounds on the aquatic ecosystem. The European Union, Regulation 782/2003/EC requires TBT-free anti-fouling systems to be used from 1 July 2003, and removal of TBT containing paints from 2008.
The uses of TBT and TPT, their persistence, their tendency to bioaccumulate through the food chain (in particular fish and seafood), their high toxicity to aquatic organisms even at levels below 1 ng/l in water, and their complex toxicity profile in experimental animals cause concerns about risks to humans and non-human organisms. Apart from the discovery that organotins were causing deformation and reproductive failure for oysters in France in the 1970s, and at the same time discovery of the imposex effect of masculinisation of female gastropods, these were later followed by observation of masculinisation of fish (Shimasaki et al., 2003), suggesting that these compounds are strong endocrine disruptors (WHO-IPCS, 1999a, b).
2.2 Policy relevance
The core indicator on TBT concentrations and imposex addresses the Baltic Sea Action Plan’s (BSAP) Hazardous substances and litter segment goal of a “Baltic Sea unaffected by hazardous substances and litter” and also has relevance for elements of the Biodiversity and Maritime activities segment goals: “The Baltic Sea ecosystem is healthy and resilient” and “Environmentally sustainable sea-based activities”, respectively.
In addition, the indicator is of direct relevance to Descriptor 8 and of significance for Descriptor 9 or the EU Marine Strategy Framework Directive (MSFD) as set out under the specific Descriptors and Criteria in Commission Decision (EU) 2017/848.
TBT and its compounds are included in the EU WFD (in water). Part of the EU food directives set limits in a range of fish species, shellfish and other seafood. In the OSPAR Coordinated Environmental Monitoring Programme (CEMP), TBT and imposex are to be measured on a mandatory basis in sediment and marine gastropod (OSPAR 2010).
Article 3 of the EU directive on environmental quality standards states that also long-term temporal trends should be assessed for substances that accumulate in sediment and/or biota (European Commission 2008a).
An overview of policy relevance is provided in Table 1.
Table 1. Overview of key policy relevance elements.
| Baltic Sea Action Plan (BSAP) | Marine Strategy Framework Directive (MSFD) | |
| Fundamental link | Segment: Hazardous substances and litter goal
Goal: “Baltic Sea unaffected by hazardous substances and litter”
|
Descriptor 8 Concentrations of contaminants are at levels not giving rise to pollution effects.
|
| Complementary link | Segment: Biodiversity
Goal: “Baltic Sea ecosystem is healthy and resilient”
Segment: Sea-based activities Goal: “Environmentally sustainable sea-based activities”
|
Descriptor 9 Contaminants in fish and other seafood for human consumption do not exceed levels established by Union legislation or other relevant standards.
(a) for contaminants listed in Regulation (EC) No 1881/2006, the maximum levels laid down in that Regulation, which are the threshold values for the purposes of this Decision; (b) for additional contaminants, not listed in Regulation (EC) No 1881/2006, threshold values, which Member States shall establish through
|
| Other relevant legislation: |
|
|
2.3 Relevance for other assessments
The status of the Baltic Sea marine environment in terms of contamination by hazardous substances is assessed using several core indicators. Each indicator focuses on one important aspect of this complex issue. In addition to providing an indicator-based evaluation of the status of the Baltic Sea in terms of concentrations of TBT in the marine environment, this indicator along with the other hazardous substances core indicators contributes to the overall assessment of hazardous substances via inclusion in the integrated assessment of hazardous substances (though only the TBT concentrations part are included, with Imposex included in the Biological Effects overview).
3 Threshold values
Good Status is achieved if the concentrations of TBT are below the specified threshold values, as visualised in the conceptual figure below (Figure 2).
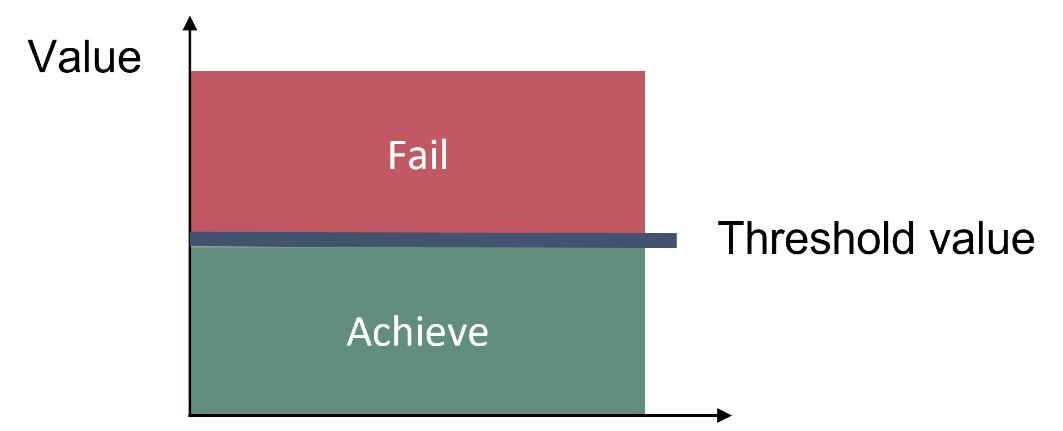
Figure 2. Good status is achieved for each monitored matrix if the concentrations of TBT are below the threshold values listed in Table 2.
The good status thresholds for TBT are based on Environmental Quality Standards (EQS) for water and biota (Table 2) which have been defined at EU level for substances included in the priority list under the Water Framework Directive, WFD (European Commission 2000, 2013).
The threshold value is applicable if concentrations are measured in the appropriate matrix. For historical reasons, the countries around the Baltic Sea have differing monitoring strategies. As a pragmatic approach, a threshold value is defined for primary matrix (sediment). However, if suitable monitoring data is not available in a region the secondary threshold value can be used for the evaluation of alternative matrices (biota, water) (Table 2). Under the WFD, Member States may establish other values than EQS for alternative matrices if specific criteria are met (see Art 3.3. in European Commission 2008a, revised in European Commission 2013).
It is important to note, especially when comparing between this and prior indicator evaluations, that as part of the process to achieve regional agreement and move this indicator to a core indicator that would be included in the integrated assessment for HOLAS 3 the threshold value applied for sediment has changed between the two assessment periods. The primary threshold value for sediment was lowered from 1.6 (in HOLAS 2) to 1.3 μg /kg dw sediment (5% TOC) based on new analyses carried out.
Table 2. Threshold value for TBT and imposex (EQS – Environmental Quality Standard, AA- Annual Average Concentration, QS – Quality Standard, BAC = Background assessment criteria). Underlined supporting parameters represent parameters without which the indicator evaluation can not be applied. SED – sediment, CORG – organic carbon, AL – Aluminium, LI – Lithium, D- dry weight. Gercken & Sordyl 2009; Magnusson et al. 2016; OSPAR (2010a) EcoQO and EG HAZ 16-2021 document 3-4.
| Indicator | Threshold value | Parameters (PARAM) / Parameter groups (PARGROUP)
(see also http://vocab.ices.dk/) |
Matrix | Species | Matrix | Basis | Supporting parameters and information |
| TBT | Primary threshold
QS 1.3 μg /kg dw sediment (5% TOC) |
PARAM = TBSN+ | Sediment | All (surface, ICES ’upper sediment layer – 0-X cm’) | D | CORG
Al Li Grain size |
|
| Secondary threshold
EQS water (AA): 0.2 ng/l water |
PARAM = TBSN+ | Water | (All – unfiltered is preference) | Surface water layer (≤ 5.5 m) | |||
| TBT and imposex | Primary threshold
Gercken & Sordyl 2009; Magnusson et al 2016k EAC: Peringia ulvae: 0.1 VDSI Nucella lapillus: 2.0 VDSI Neptunea antiqua: 2.0 VDSI Hinia reticulata: 0.3 VDSI Buccinum undatum: 0.3 VDSI Littorina littorea: <0.3 ISI |
Imposex: PARAM = VDS, VDSI, INTS, INTSI, IMPF%, IMPS, IMPSI, PCI, %FemalePOP
Assisting parameters: PARAM = MBSN+, DBSN+, TBSN+, TPSN+ |
Biota | Gastropods | All | D |
3.1 Setting the threshold value(s)
The threshold values are based on established threshold value setting approaches or published parameters required for carrying out such evaluations. Environmental Quality Standards (EQS) and Quality Standards (QS) are developed following the approach set out in the Derivation of environmental quality standards (EQS) for the aquatic environment following the EU Guidance Document No. 27. Technical Guidance Document for Deriving Environmental Quality Standards (EU, 2018). The application of this approach to develop the primary threshold value applied for sediment is set out in EG HAZ 16-2021 document 3-4 and its application was subsequently approved in HOD 61-2021 (document 5-1-Rev.1 and Workspace ATT. 21 Rev.1).
4 Results and discussion
The results of the indicator evaluation that underlie the key message map and information are provided below.
4.1 Status evaluation
The data presented in this core indicator report were collected in the HELCOM COMBINE data base, a compilation of data from the monitoring activities reported by all Baltic Sea countries. The report presents information on the current levels of TBT concentrations in selected marine monitoring matrices: seawater, biota (mussels, marine gastropods) and sediments. Fish data have not been used, as currently no thresholds have been defined or agreed for TBT in this matrix.
Seawater
The agreed secondary threshold value for TBT in water is the EQS value (AA-EQS) of 0.2 ng/l. This monitoring matrix is a secondary one since the preferred matrices for monitoring in the HELCOM COMBINE monitoring programme are biota and sediment.. As a result, relatively little data is available for TBT in water.
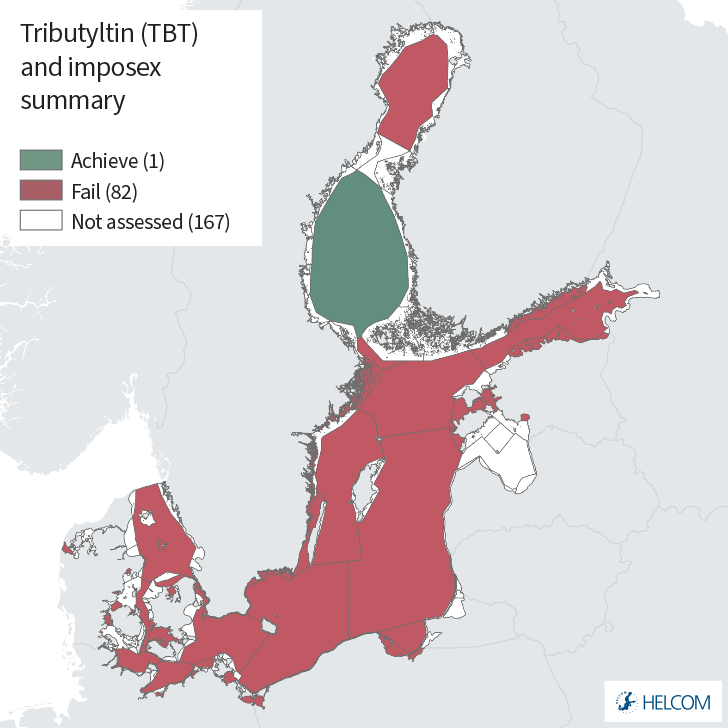
Of the 42 Level 4 HELCOM assessment units evaluated for seawater only one achieved the threshold value and represents Good Environmental Status, assessment unit POL-002, situated in the Bornholm Basin/Pomeranian Bay area (Figure 3). Data is available from Estonia, Germany, Lithuania and Poland.
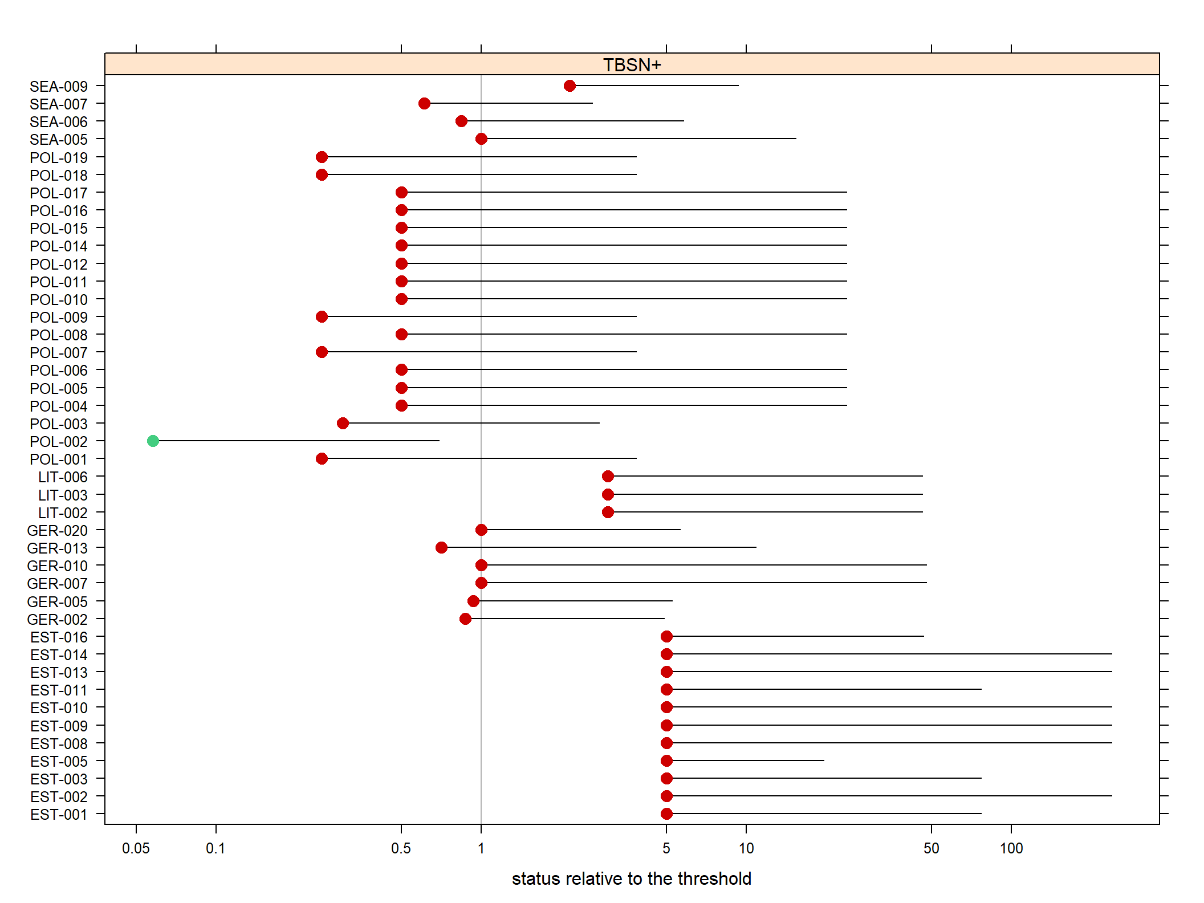
Figure 3. Overview of HELCOM Level 4 assessment units evaluated for TBT in water. Only POL-002 achieved GES, see discussion below. Filled circles represent a mean value for each assessment unit and the bar represents the upper 95% confidence limit. Green colour indicates that the assessed area achieves the threshold value and red colour that the assessed area fails the threshold.
Most samples were above the average annual concentration EQS (AA-EQS) of 0.2 ng/l. The AA-EQS is considered to be high. For example, compared to the OSPAR (Oslo-Paris Convention for the Protection of the Marine Environment of the North-East Atlantic) Environmental Assessment Criteria (EACs) in seawater (0.01-0.1 ng/l). The 2004 revision of OSPAR EACs suggested using the AA-EQS as the lower and MAC-EQS as the upper EAC value. Hence, the AA-EQS is considered to be the relevant threshold value, not MAC-EQS that would normally be used for spot samples.
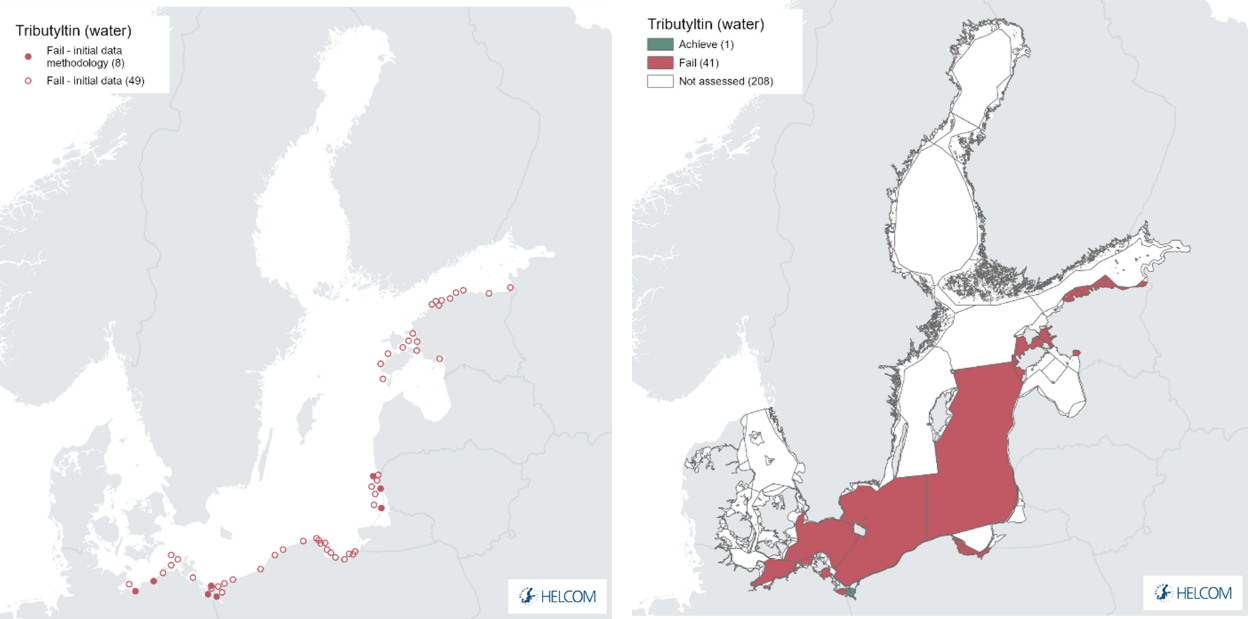
Figure 4. Station based evaluation of TBT in seawater (left) and assessment unit status evaluation (right). Small filled circles represent results based on three-four years and empty circles represent results based on <3 years, initial status evaluation. The evaluation is carried out using Level 4 HELCOM assessment units (defined in the HELCOM Monitoring and Assessment Strategy Annex 4). See ‘data chapter’ for interactive maps and data at the HELCOM Map and Data Service.
The evaluation in water covers 38 coastal assessment units (HELCOM Level 4) and 4 open sea assessment units, totalling 57 individual monitoring stations (Figure 4). It should also be noted that the POL-002 assessment unit fails to achieve the threshold value at the individual station level but when the assessment unit level evaluation is applied the assessment unit achieves GES. This deviation between the two evaluations is due to the methodology where a re-scaling of the results occurs between the two components to take into account the regional uncertainty estimates when evaluatinh assessment unit level status. In such instances, the final evaluation should be considered with caution as there are significant uncertainties in the final outcome.
It is important to note that with a quantification limit (QL) around 0.06-1 ng/l, even the newest, best method with QL at 0.06 ng/l is at 30% of the AA-EQS, which is the minimum performance criteria for methods of analysis used in the Water Framework Directive set by the European Commission (2009). In fact, typically results are below detection limits, which in some cases was above the AA-EQS. Thus, the outcome is indicated as failing the threshold (red) due to the detection limits being above the AA-EQS in some of the results (see Figure 5).
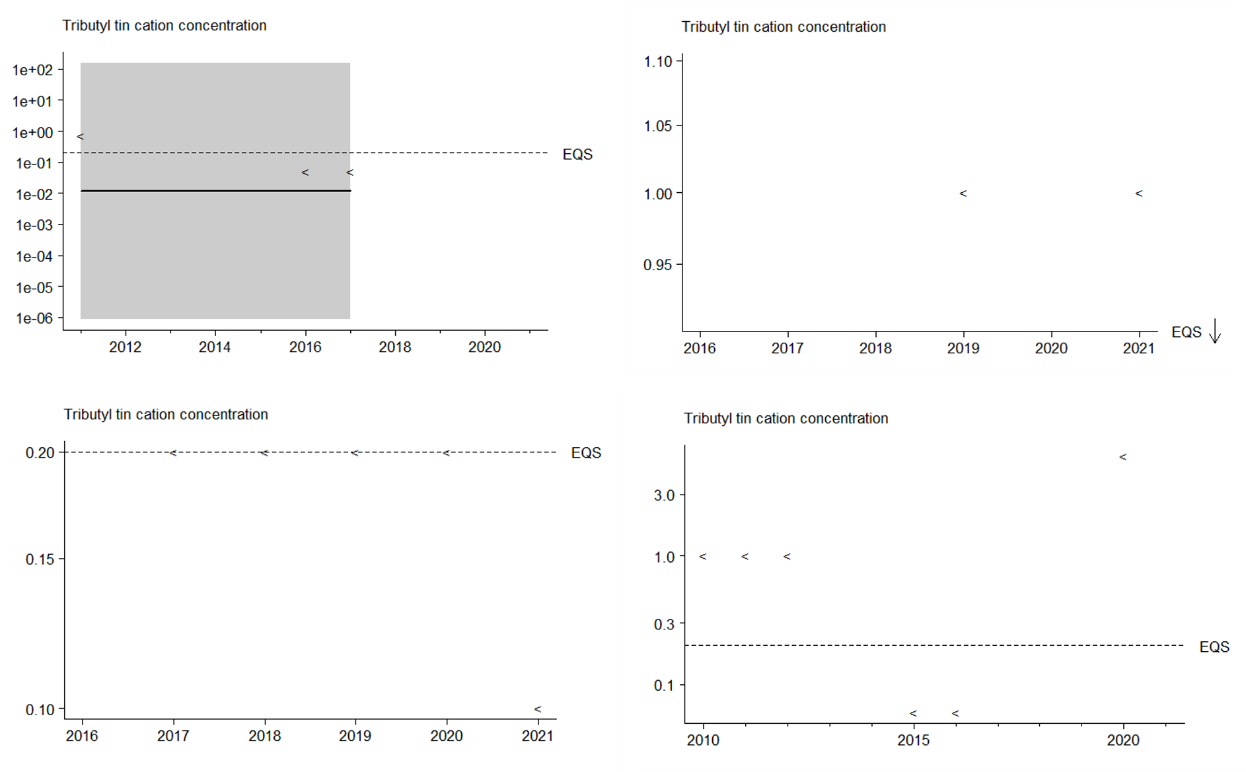
Figure 5. Selected stations: Poland (in unit POL-002, top left – grey colour- confidence level 95% range), Estonia (in unit EST-005, top right), Germany (in unit GER-002, bottom left), and Lithuania (in unit POL-006, bottom right). Typically results are below detection limits, which in some cases was above the AA-EQS. The < symbol indicates data are below the threshold value but due to analytical limits of quantification a defined sample value is not given, so called ‘less-than’ values.
Marine Gastropods (biota)
The biological effect on the reproductive organs of marine gastropods, known as imposex, has been classified after the Vas deference Sequence (VDS). Overall 14 coastal assessment units (HELCOM Level 4) and 3 open sea assessment units were evaluated. These included the following species Peringia ulvae, Neptunea antiqua, Littorina littorea, Tritia nitida / reticulata, and Buccinum undatum. In all evaluated assessment units the relevant threshold values were not achieved and thus all are evaluated to be sub-GES (Figure 6).
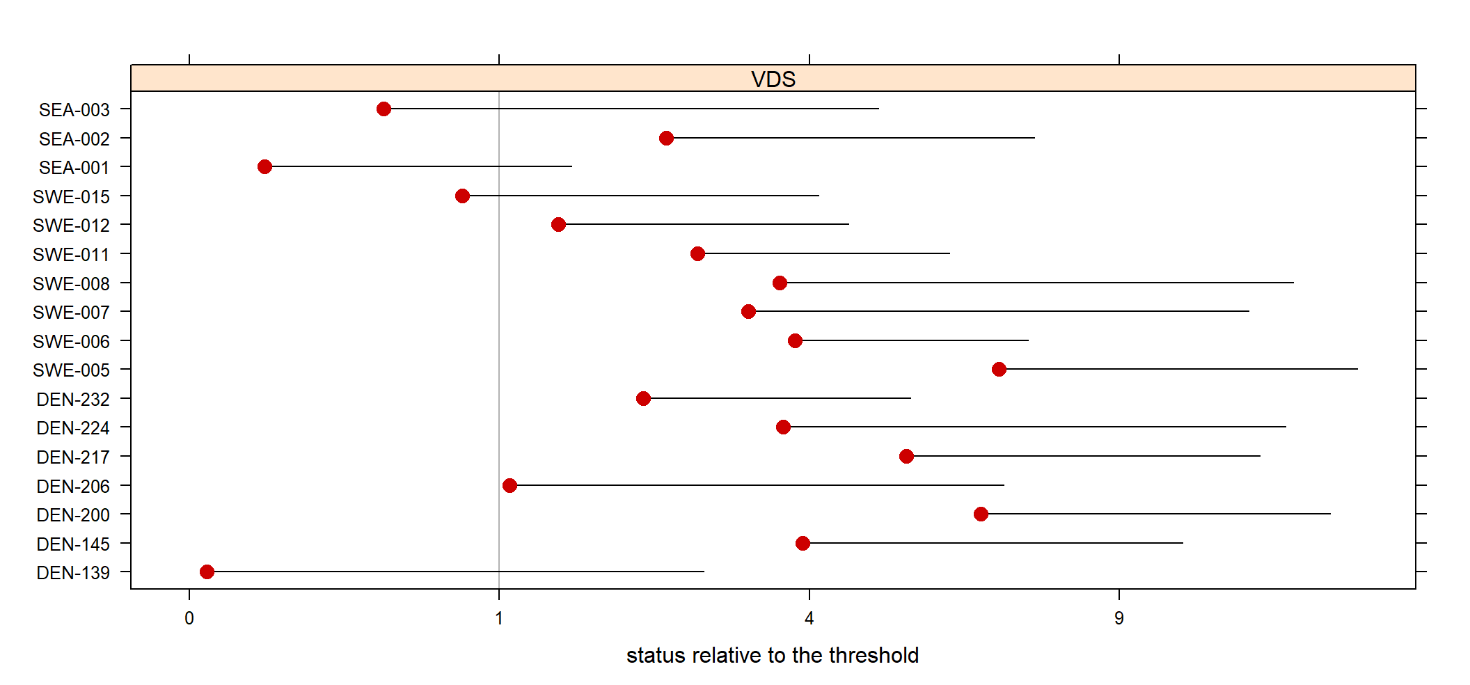
Figure 6. Overview of HELCOM Level 4 assessment units evaluated for Imposex (Biota). Filled circles represent a mean value for each assessment unit and the bar represents the upper 95% confidence limit. Green colour indicates that the assessed area achieves the threshold value and red colour that the assessed area fails the threshold.
VDS is measured at 37 monitoring stations of which 4 of these individual stations achieved the threshold value. The majority of stations showed no distinct trends (large, filled circles), however there were 4 stations at which decreasing trends were recorded (downward pointing triangles) and one station where an increasing trend was recorded (upward pointing triangle) (Figure 7).
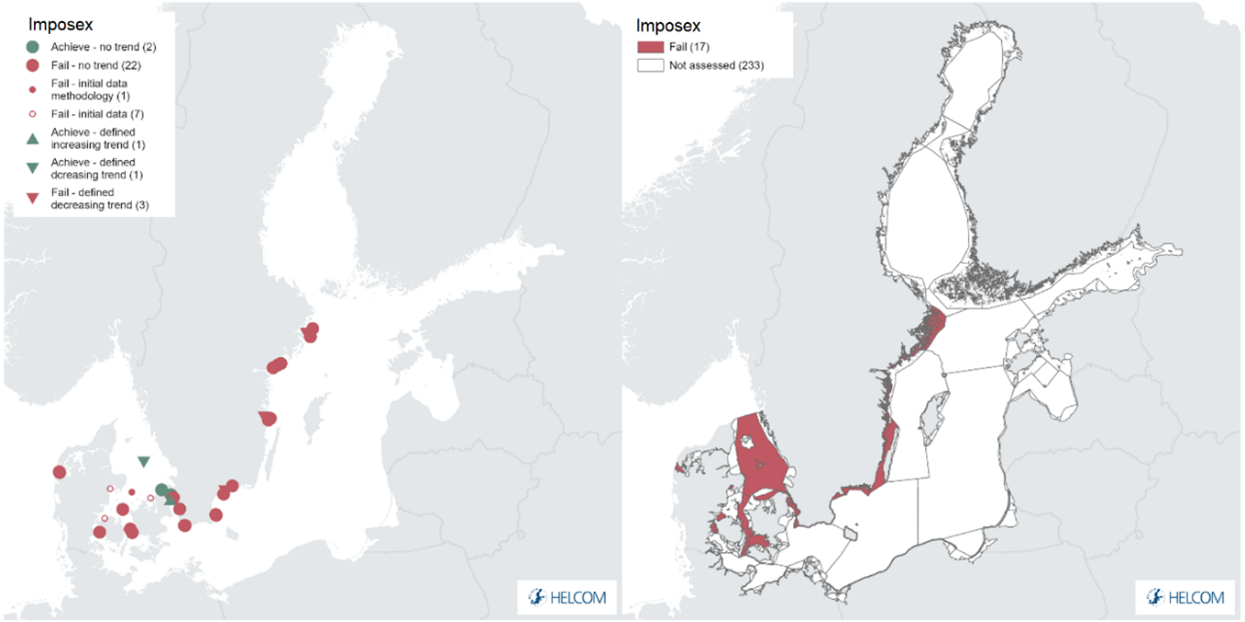
Figure 7. Map presenting status based on imposex effect in (biota) marine gastropods at each sampling station (left). Green colour represents achieving the threshold value (i.e. GES) and red colour represents failing the threshold value (sub-GES). Filled large circles represent results based on five or more years of data, full evaluation (see Methodology), small filled circles represent results based on three-four years and empty circles represent results based on <3 years, initial status evaluation. Triangles indicate trends: downward (decreasing concentrations) or upwards (increasing concentrations). The evaluation is carried out using Level 4 HELCOM assessment units (defined in the HELCOM Monitoring and Assessment Strategy Annex 4). See ‘data chapter’ for interactive maps and data at the HELCOM Map and Data Service.
The decreasing levels of TBT occur in areas with heavy ship traffic, The Sound and the Kattegat, as also seen in the previous evaluation. This is in agreement with earlier findings in the North Sea area, where 48% of the imposex stations showed decreasing trends (https://oap.ospar.org/en/ospar-assessments/intermediate-assessment-2017/ pressures-human-activities/contaminants/imposex-gastropods/).
The species available in the North Sea area are generally more sensitive to TBT (due to salinity restriction for the sensitive species) than most of the species found in the Baltic Sea area, and many of the time trends include data dating back to before the international ban on TBT in antifouling paints. The majority of the stations however did not show distinct trends. An overview of trends from different stations is presented in Figure 8, utilising selected example stations.
The biological effects therefore support the observations of TBT in mussels and water, generally indicating a reduction in contamination levels. But even so, most stations are still not at GES. As most stations are time trend stations, the biological effects measurements generally have a high confidence rating.
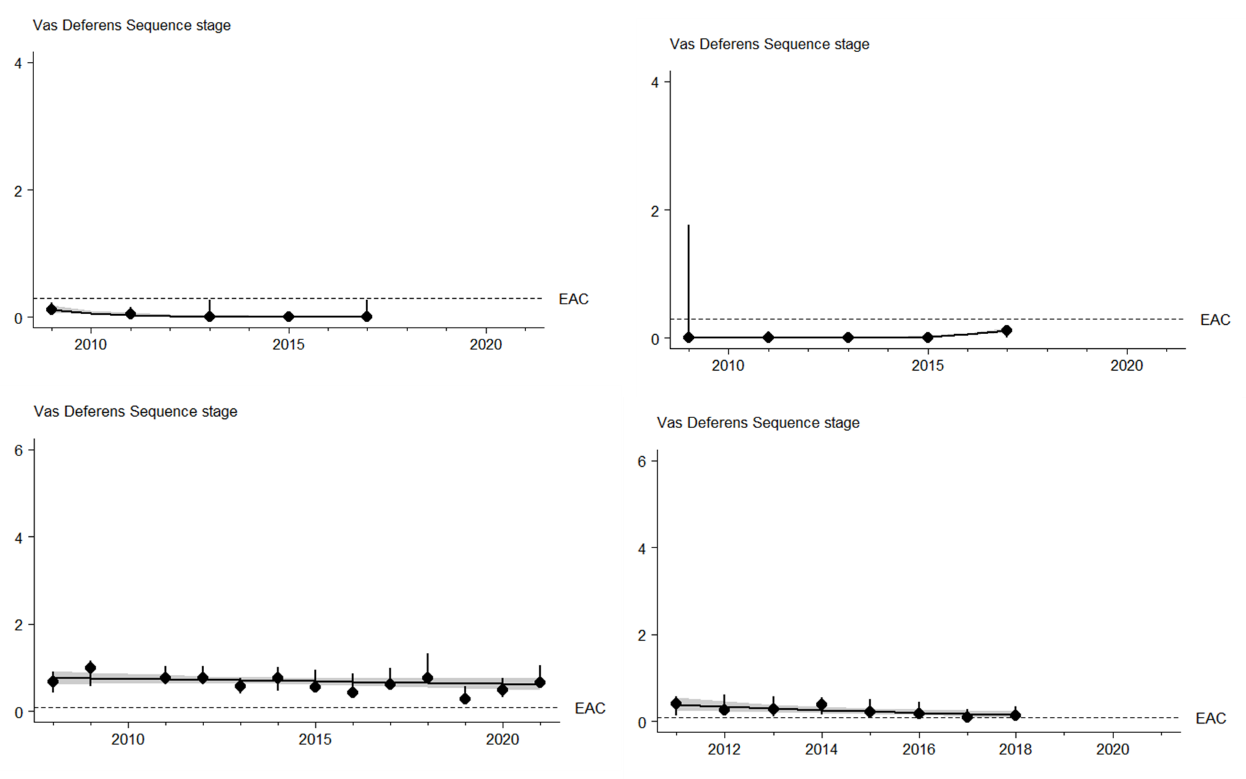
Figure 8. Long-term trends of VDS stage in gastropods at selected stations to illustrate key trend types (grey colour- confidence level 95% range (see Methodology)). Denmark (Top left, DMU D9 – Kattegat, downward trend ‘green’), Denmark (Top right, DMU D14 – The Sound, increasing trend ‘green’), Sweden (Bottom left, Oxelösunds marina – Western Gotland basin, no distinct trend ‘red’), and Trelleborg referens – Arkona Basin, no distinct trend ‘red’).
Sediment
Samples were available from Denmark, Estonia, Finland, Germany, Poland and Sweden. All data are analysed using the ‘initial’ approach, in part due to the nature of the monitoring applied for sediments (less frequent sampling since sediments are commonly considered to be a more stable sink for contaminants as compared to changes in water for example). 34 assessment units were evaluated (Level 4 assessment units), including 13 open sea assessment units. Of the evaluated assessment units only one, SEA-015, was deemed to achieve its threshold value and thus be in GES (Figure 9 and figure 10).
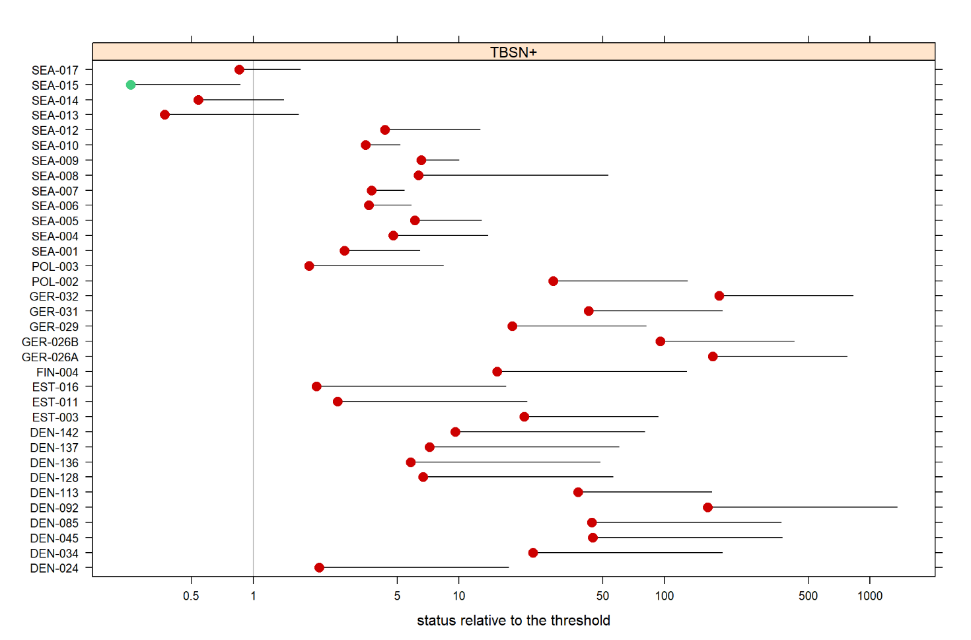
Figure 9. Overview of HELCOM Level 4 assessment units evaluated for TBT in sediments. Filled circles represent a mean value for each assessment unit and the bar represents the upper 95% confidence limit. Green colour indicates that the assessed area achieves the threshold value and red colour that the assessed area fails the threshold.
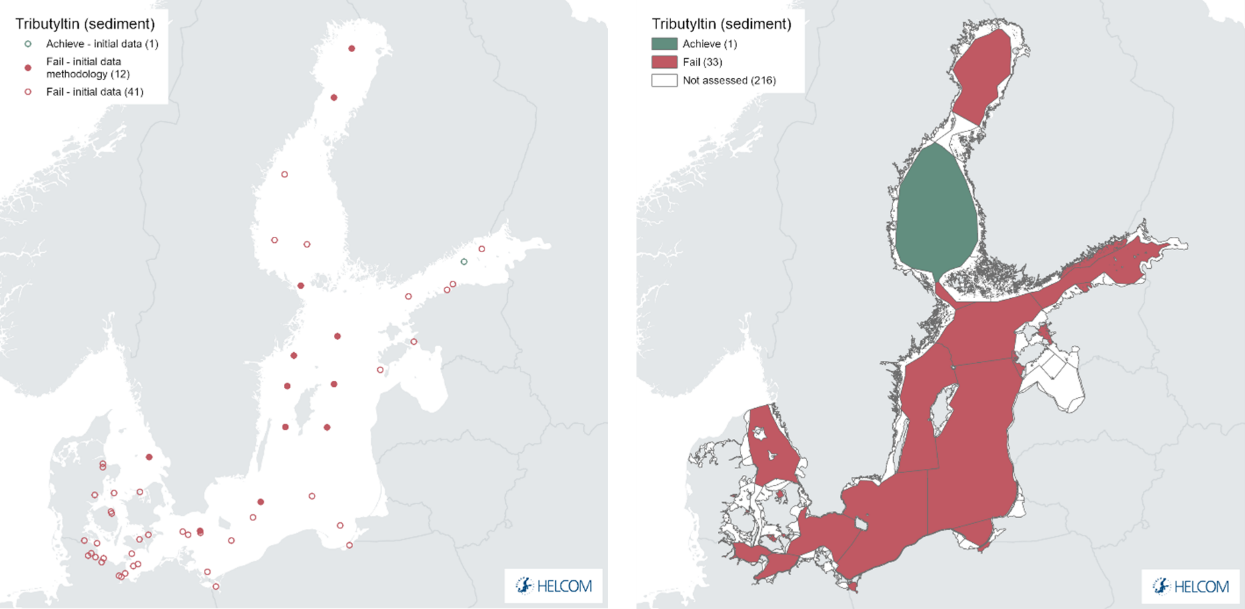
Results figure 10. Map presenting station-based evaluation of TBT in sediment (left) and assessment unit evaluation (right). Green colour represents achieved threshold value (GES) and red colour represents failed threshold value (sub-GES). Small filled circles represent results based on three-four years and empty circles represent results based on <3 years, initial status evaluation (see Methodology). The evaluation is carried out using Level 4 HELCOM assessment units (defined in the HELCOM Monitoring and Assessment Strategy Annex 4). See ‘data chapter’ for interactive maps and data at the HELCOM Map and Data Service.
Of the 54 stations evaluated, only one station LL3A in SEA-013 (Gulf of Finland) achieved the threshold value and was identified as in GES. This station however is, when combined with other stations within the assessment unit, not sufficient to retain the mean value above GES (i.e. the assessment unit level is sub-GES). On the other hand, stations within assessment unit SEA-015 (Bothnian Sea) generally fail their individual threshold values but when aggregated to an assessment unit level mean value, inclusive of the regional uncertainties, the assessment unit itself is in GES. This evaluation should be treated with some caution as there is likely some underlying uncertainties at the level where evaluations are close to the threshold value.
4.2 Trends
Examples of key trends at selected stations are provided above. For certain parameters, such as sediment analyses, assignment of statistical trends is not easy to achieve due to the nature and frequency of the monitoring applied. For other monitoring matrices the identification of statistical trends is viable and a small number of decreasing trends (i.e. concentrations becoming lower) have been identified.
For water (of 42 stations) no distinct trends were recorded.
For biota (of 37 stations) 4 downward trends (decreasing concentrations) were identified and a single upward trend.
For sediment (of 54 stations) no distinct trends were recorded.
TBT is highly persistent thus the few identified decreasing trends and the increasing trend from a single station are considered a positive sign that implemented measures have had an impact and controlled further inputs to a valuable level.
4.3 Discussion
TBT is slowly degraded to DBT, MBT and finally tin. The process is however very slow, especially in anoxic sediments, so the sediment concentration is expected to be above the QS many years ahead, but to eventually follow the decreasing pattern as initial signs seen from the imposex and biota results. An overview of the current evaluation results and a comparison to the prior test evaluation are provided in Table 3.
Table 3. Overview of evaluation outcomes and comparison with previous evaluation (using the OOAO evaluation outcomes per assessment unit). Currently this approach is only applied for open sea assessment units.
| HELCOM Assessment unit name (and ID) | Threshold value achieved/failed – HOLAS II | Threshold value achieved/failed – HOLAS 3 | Distinct trend between current and previous evaluation. | Description of outcomes, if pertinent. |
| Kattegat (SEA-001) | Failed | Failed | No change in status is observed. TBT is slow to degrade. | The threshold value is not achieved where evaluated for sediment, thus status is sub-GES. |
| Great Belt (SEA-002) | Failed | Failed | No change in status is observed. TBT is slow to degrade. | The threshold value is not achieved where evaluated for sediment, thus status is sub-GES. |
| The Sound (SEA-003) | Failed | Failed | No change in status is observed. TBT is slow to degrade. | The threshold value is not achieved where evaluated for sediment, thus status is sub-GES. |
| Kiel Bay (SEA-004) | Failed | Failed | No change in status is observed. TBT is slow to degrade. | The threshold value is not achieved where evaluated for sediment, thus status is sub-GES. |
| Bay of Mecklenburg (SEA-005) | Failed | Failed | No change in status is observed. TBT is slow to degrade. | The threshold value is not achieved where evaluated for sediment, thus status is sub-GES. |
| Arkona Basin (SEA-006) | Failed | Failed | No change in status is observed. TBT is slow to degrade. | The threshold value is not achieved where evaluated for sediment, thus status is sub-GES. |
| Bornholm Basin (SEA-007) | Failed | Failed | No change in status is observed. TBT is slow to degrade. | The threshold value is not achieved where evaluated for sediment, thus status is sub-GES. |
| Gdansk Basin (SEA-008) | Not assessed | Failed | No change in status is observed. TBT is slow to degrade. | The threshold value is not achieved where evaluated for sediment, thus status is sub-GES. |
| Eastern Gotland Basin (SEA-009) | Failed | Failed | No change in status is observed. TBT is slow to degrade. | The threshold value is not achieved where evaluated for sediment, thus status is sub-GES. |
| Western Gotland Basin (SEA-010) | Failed | Failed | No change in status is observed. TBT is slow to degrade. | The threshold value is not achieved where evaluated for sediment, thus status is sub-GES. |
| Northern Baltic Proper (SEA-012) | Failed | Failed | No change in status is observed. TBT is slow to degrade. | The threshold value is not achieved where evaluated for sediment, thus status is sub-GES. |
| Gulf of Finland (SEA-013) | Not assessed | Failed | No change in status is observed. TBT is slow to degrade. | The threshold value is not achieved where evaluated for sediment, thus status is sub-GES. |
| Åland Sea (SEA-014) | Failed | Failed | No change in status is observed. TBT is slow to degrade. | The threshold value is not achieved where evaluated for sediment, thus status is sub-GES. |
| Bothnian Sea (SEA-015) | Failed | Achieved | The threshold value is achieved but there are uncertainties to be considered as stations in the assessment unit did not achieve GES. | |
| Bothnian Bay (SEA-017) | Failed | Failed | No change in status is observed. TBT is slow to degrade. | The threshold value is not achieved where evaluated for sediment, thus status is sub-GES. |
5 Confidence
The overall confidence of the evaluation is considered to be moderate, with a few assessment units achieving high and some achieving low confidence (see confidence map Figure 11, and table in Annex 1).
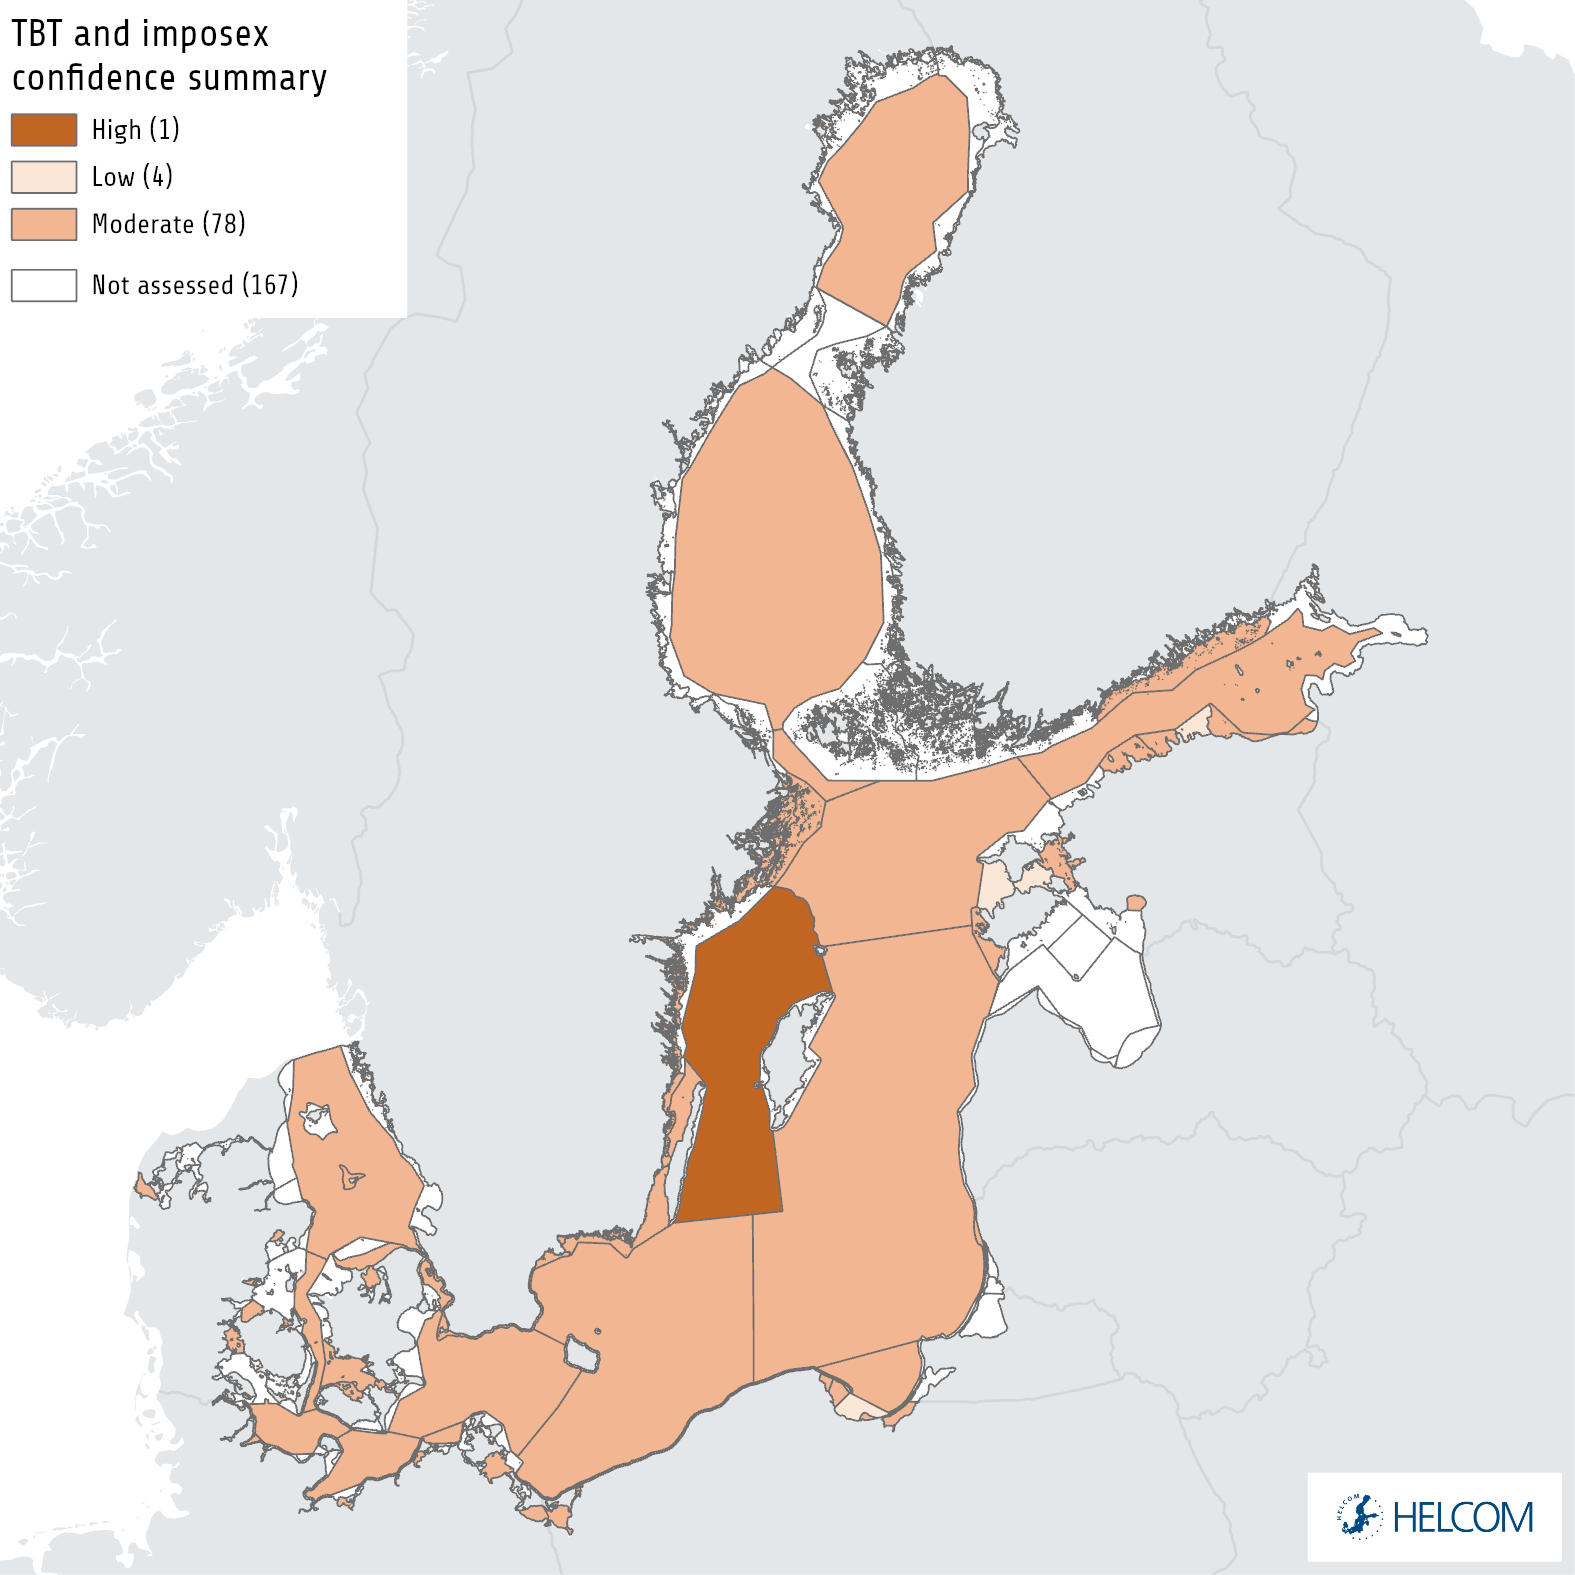
Results figure 11. Map presenting the confidence in the overall evaluation based on a OOAO summary of confidence across all monitored matrices (se Annex 1). The evaluation is carried out using Level 4 HELCOM assessment units (defined in the HELCOM Monitoring and Assessment Strategy Annex 4).
6 Drivers, Activities, and Pressures
Drivers are often large and complex issues that are difficult to quantify, though in certain instances proxies can be utilised to express them or changes in them. A driver for example may relate to globalisation or political will and, while difficult to quantify in terms of specific relevance to an indicator, changes in drivers can catalyse changes in activities that will consequently influence pressures for example resulting in altered levels of shipping and the subsequent pressures for that activity. A brief overview of key pressures and activities is provided in Table 4.
After the ban on TBT in antifouling paints, few uses of organotins as pesticides (mainly phenyltins) are still legal. The major source is now its release from impacted sediments in harbour areas and shipping routes (dredging) and illegal use of TBT-containing antifouling paints. Studies in Sweden have also shown that the supply of TBT via contaminated port areas and the management of boats on land are of great importance for continued distribution to the marine environment. High concentrations have been found in stormwater drainage systems (up to 40 000 ng/l in water and up to 285 000 mg/kg TS in the sludge) and in dirt samples (up to 39000 mg/kg TS) sampled close to harbour areas (Bengtsson & Wernersson, 2012).
Table 4. Brief summary of relevant pressures and activities with relevance to the indicator.
| General | MSFD Annex III, Table 2a | |
| Strong link | Shipping, leisure boating, maritime activities, dredging and disposal/disturbance of dredged material. | Substances, litter and energy
– Input of other substances (e.g. synthetic substances, non-synthetic substances, radionuclides) – diffuse sources, point sources, atmospheric deposition, acute events |
| Weak link | Disturbance of material or displacement from marinas and onshore deposits. |
7 Climate change and other factors
Climate change in the Baltic Sea region is expected to have significant impacts on key processes in the marine environment (HELCOM and Baltic Earth 2021). While there are relatively few studies that fully explore the impacts of such changes on hazardous substances direct parameters such as changes in water temperature, atmospheric deposition, precipitation, river run off and sediment transportation could all alter the flow of contaminants to and within the marine environment. Disturbance of historic deposits of TBT, for example in old port areas could conceivably represent a major new source of contamination in such circumstances. In addition, alterations in metabolic aspects as well as food web structure and function may also alter the transfer of contaminants within the ecosystem and food web and thus alter the levels of bioaccumulation (as well as possible effects).
8 Conclusions
Overall, the concentrations of TBT and the respective impacts on biota indicate that the Baltic Sea is not in Good Environmental Status (sub-GES). The indication that there generally are not increasing concentrations occurring is indicative of the fact that the prior bans on the application of TBT in antifouling paints has been successful in controlling further inputs.
8.1 Future work or improvements needed
The indicator is generally fully operational but increased spatial and temporal monitoring as well as improved analytical approaches for certain matrices would benefit the indicator and reduce uncertainties.
9 Methodology
9.1 Scale of assessment
The assessment of the present environmental status in respect of TBT content has been carried out in all assessment units at level 4.
The core indicator evaluates the status with regard to concentrations of TBT using HELCOM assessment unit Level 4 (division of the Baltic Sea into 17 sub-basins and further division into coastal and offshore areas). The assessment units are defined in the HELCOM Monitoring and Assessment Strategy Annex 4.
9.2 Methodology applied
To evaluate contamination status of Baltic Sea, the ratio of concentration of TBT in the biotic and abiotic elements of marine environment to the specified concentration (threshold) levels are used. Data are extracted from the HELCOM COMBINE database as specified in the extraction table to ensure that the values are from the appropriate measurement matrices (Table 2).
All available data on TBT concentrations in seawater, molluscs and sediments from 2016 to 2021 (longer historic data used in trend assessment where available), reported by HELCOM Contracting Parties to the HELCOM COMBINE database, were used to assess the state of the Baltic Sea environment for this assessment period (2016-2021). Also imposex in marine gastropods, as VDS, was used.
A two-way approach was used to determine the representative concentrations of the individual TBT and imposex in the individual matrices. In the case of stations where long-term data series exist, the agreed script (MIME Script) was used. This method allows determination of the upper value of the 95% confidence level, which is regarded as a representative concentration. In the case of stations where data are from 1-2 years only, the average values were calculated and these values were defined as initial status evaluation station data. The lower confidence of these data was taken into account during assessment process.
All initial data is handled in a highly precautionary manner to further ensure that the risk of false positives is minimalised. For all initial data the 95% confidence limit on the mean concentration, based on the uncertainty seen in longer time series throughout the HELCOM area, is used. Applying a precautionary approach, the 90% quantile (psi value, Ψ ) of the uncertainty estimates in the longer time series from the entire HELCOM region are used. The same approach is used for time series with three or more years of data, but which are dominated by less-than values (i.e. no parametric model can be fitted). The mean concentration in the last monitoring year (meanLY) is obtained by: restricting the time series to the period 2016-2021 (the last six monitoring years), calculating the median log concentration in each year (treating ‘less-than’ values as if they were above the limit of detection), calculating the mean of the median log concentrations, and then back-transforming (by exponentiating) to the concentration scale. The upper one-sided 95% confidence limit (clLY) is then given by
 where n is the number of years with data in the period 2016-2021 (HELCOM 2018).
9.3 Monitoring and reporting requirements
Monitoring methodology
HELCOM common monitoring of relevance to the indicator is described on a general level in the HELCOM Monitoring Manual in the programme topic: Concentrations of contaminants and Biological effects of contaminants (imposex) [still under development]
Quality assurance in the form of international workshops and proficiency testing has been organized annually by QUASIMEME starting from development exercises in 1998, with two rounds each year for water, sediment and biota.
Current monitoring
The monitoring activities relevant to the indicator that is currently carried out by HELCOM Contracting Parties are described in the HELCOM Monitoring Manual in the relevant Monitoring Concept Tables.
Sub-programme: Contaminants in biota
Sub-programme: Contaminants in water
Sub-programme: Contaminants in sediment
Concentrations of TBT and imposex are monitored regularly in few countries, mainly in the more saline parts of the Baltic Sea. Monitoring is performed in sediment (Denmark, Sweden, Germany, Lithuania), mussels and fish liver (several contracting partners but no threshold for fish livers) and Water (Germany, Lithuania and Poland). Imposex is reported by Denmark and Sweden.
The number of sediment and biota monitoring stations per sub-basin is indicated in Monitoring Figure 1.
Description of optimal monitoring
TBT concentrations are spatially highly varying in the Baltic Sea. Therefore, a dense network of monitoring stations is needed to have reliable overviews of the state of the environment. The monitoring should contain both mussels and marine gastropods. Current levels are close to detection limits in pristine areas away from ship routes and harbours with historic contaminations.
Sediment monitoring can complement the evaluation. Sediment represents longer timespans than biota (typically years vs. months), and is available in all places, whereas especially local species are not always available for spatial surveys. Time-trends from dated sediment cores in undisturbed (anoxic) areas can be a valuable source of information on the development in concentrations from before monitoring was started and even back to pre-industrialized times.
Water monitoring is generally at levels close to or below the current quantification levels, and can only be recommended with quantification levels around 0.05 ng/l or preferably better.
Monitoring of TBT is relevant in the entire sea area.
10 Data
The data and resulting data products (e.g. tables, figures and maps) available on the indicator web page can be used freely given that it is used appropriately and the source is cited.
Result: TBT and imposex in biota
Result: TBT and imposex in sediment
Result: TBT and imposex in water
Data: Hazardous substances in biota
Data: Hazardous substances in sediment
Data: Hazardous substances in water
The indicator is based on data held in the HELCOM COMBINE database hosted at the International Council for the Exploration of the Seas (ICES), derived from harmonised national monitoring.
11 Contributors
Martin M. Larsen, Aarhus University Denmark, and Marina Magnusson, Marine Monitoring Sweden.
Rob Fryer, Marine Scotland (OSPAR).
HELCOM Expert Network on Hazardous Substances.
HELCOM Secretariat: Owen Rowe, Deborah Shinoda, Joni Kaitaranta, and Jana Wolf.
12 Archive
This version of the HELCOM core indicator report was published in April 2023:
The current version of this indicator (including as a PDF) can be found on the HELCOM indicator web page.
Earlier versions of the core indicator report:
Tributyltin TBT and imposex HELCOM core indicator 2018 (pdf)
HOLAS II component – Core indicator report – web-based version July 2017 (pdf)
13 References
Bengtsson, H, & Wernersson A., 2012: TBT, koppar, zink och irgarol i dagvatten, slam och mark i småbåtshamnar, Västra Götalands län 2011. 2012:16.
European Commission (2000) Directive 2000/60/EC of the European Parliament and of the Council of 23 October 2000 establishing a framework for Community action in the field of water policy. Off. J. Eur. Union L 327.
European Commission (2008a) Directive 2008/105/EC of the European Parliament and the Council on environmental quality standards in the field of water policy (Directive on Environmental Quality Standards). Off. J. Eur. Union L 348.
European Commission (2009) Commision Directive 2009/90/EC of 31 july 2009 Laying down, pursuant to directive 2000/60/EC of the European Parliament and of the Council, technical specifications for chemical analysis and monitoring of water status.
European Commission (2013) Directive 2013/39/EU of the European Parliament and of the Council of 12 August 2013 amending Directives 2000/60/EC and 2008/105/EC as regards priority substances in the field of water policy. Off. J. Eur. Union L 226: 1-17.
Gercken J. and Sordyl H., 2009. Pilotstudien zum biologischen Effektmonitoring in Küsten- und Binnengewässern Mecklenburg-Vorpommerns , Schriftenreihe des Landesamtes für Umwelt, Naturschutz und Geologie Mecklenburg-Vorpommern 2009, Heft 2, 134pp (In German)
Law, R.J., Bolam, T., James, D., Deaville, R., Reid, R.J., Penrose, R., Jepson, P.D. (2012) Butyltin compounds in liver of harbor porpoises (Phocoena phocoena) from the UK prior to and following the ban on the use of tributyltin in antifouling paints (1992-2005 & 2009). Marine Pollution Bulletin 64, 2576-2580.
OSPAR (2010a) EcoQO on imposex in dogwhelks and other selected gastropods. QUALITY STATUS REPORT 2010 Evaluation of the OSPAR system of EcoQOs for the North Sea,
OSPAR (2010b) OSPAR Quality Status Report 2010. OSPAR Commission, London. 176 pp. Available at: http://qsr2010.ospar.org/en/downloads.html
OSPAR (2014) Imposex and TBT: Status, trends and effects in marine molluscs: An improving situation? HASEC14 AS01
Shimasaki, Y., Kitano, T., Oshima, Y., Inoue, S., Imada, N. and Honjo, T. 2003. Tributyltin causes masculinization in fish. Environ Toxicol Chem.; 22(1):141-4.
Strand, J. Larsen M.L. and Lockyer, C. (2005) Accumulation of organotin compounds and mercury in harbour porpoises (Phocoena phocoena) from the Danish waters and West Greenland. Science of the Total Environment 350, 59–71
WHO-IPCS. 1999a. Concise International Chemical Assessment 13: Triphenyltin compounds. World Health Organization, Geneva.
WHO-IPCS. 1999b. Concise International Chemical Assessment 14: Tributyltin oxide. World Health Organization, Geneva.
14 Other relevant resources
Bignert, A., Berger, U., Borg, H., Danielsson S., Eriksson, U., Faxneld, S., Haglund, P., Holm, K., Nyberg, E., Nylund, K. (2012) Comments Concerning the National Swedish Contaminant Monitoring Programme in Marine Biota. Report to the Swedish Environmental Protection Agency 2012. 228 pp.
Bignert, A., Danielsson, S., Faxneld, S., Nyberg, E., Vasileiou, M., Fång, J., Dahlgren, H., Kylberg, E., Staveley Öhlund, J., Jones, D., Stenström, M., Berger, U., Alsberg, T., Kärsrud, A.-S., Sundbom, M., Holm,K., Eriksson, U., Egebäck, A.-L., Haglund, P., Kaj, L. (2015) Comments Concerning the National Swedish Contaminant Monitoring Programme in Marine Biota 2015, 2:2015. Swedish Museum of Natural History, Stockholm, Sweden.
EFSA Journal (2004) Opinion of the Scientific Panel on Contaminants in the Food Chain on a request from the Commission to assess the health risks to consumers associated with exposure to organotins in foodstuffs 102, 1-119
European Commission (2006a) Commission Regulation (EC) No 1881/2006 of 19 December 2006 setting maximum levels for certain contaminants in foodstuffs. Off. J. Eur. Union L 364.
European Commission (2006b) Directive 2006/113/EC of the European Parliament and of the Council of 12 December 2006 on the quality required of shellfish waters. Off. J. Eur. Union L 376.
European Commission (2008b) Directive 2008/56/EC of the European Parliament and the Council establishing a framework for community action in the field of marine environmental policy (Marine Strategy Framework Directive). Off. J. Eur. Union L 164: 19-40.
European Commission (2010) Commission Decision of 1 September 2010 on criteria and methodological standards on good environmental status of marine waters (2010/477/EU). Off. J. Eur. Union L232: 12-24.
European Commission (2017) Commission Decision (EU) 2017/848 laying down criteria and methodological standards on good environmental status of marine waters and specifications and standardised methods for monitoring and assessment, and repealing Decision 2010/477/EU.
HELCOM (2010) Hazardous substances in the Baltic Sea – An integrated thematic assessment of hazardous substances in the Baltic Sea. Balt. Sea Environ. Proc. No. 120B.
Jensen, J.N. (2012) Temporal trends in contaminants in Herring in the Baltic Sea in the period 1980-2010. HELCOM Baltic Sea Environment Fact Sheet 2012.
Law, R., Hanke, G., Angelidis, M., Batty, J., Bignert, A., Dachs, J., Davies, I., Denga, Y., et al. (2010) MARINE STRATEGY FRAMEWORK DIRECTIVE Task Group 8 Report Contaminants and pollution effects. JRC Scientific and Technical Reports.
Magnusson, M., Andersson, S., Bergkvist, J., & Granmo, Å., 2016: Biologiska effekter av organiska tennföreningar. Havet 2015/2016 s. 95-97. Havs och vattenmyndigheten. ISBN 978-91-87967-12-2. (In Swedish)
OSPAR (2008) Monitoring and Assessment Series Publication Number No. 379
OSPAR (2009) Draft Agreement on CEMP Assessment Criteria for the QSR 2010. Meeting of the Environmental Assessment and Monitoring Committee (ASMO), Bonn, Germany, 20 – 24 April 2009.
OSPAR CEMP Assessment Manual. Co-ordinated Environmental Monitoring Programme Assessment Manual for contaminants in sediment and biota. OSPAR Commission, London. 39 pp.
Annex 1 Assessment unit level confidence summary
Confidence is evaluated per assessment unit based on a relative evaluation of following parameters for the indicator: 1) spatial component, 2) temporal component, 3) methodological component, and 4) the evaluation component. Despite the common approach applied with other indicators the information set out here is not directly comparable as it only focusses on an evaluation within each indicator (i.e. is relative only between the evaluated assessment units) and it furthermore only addresses the evaluated units. More general information related to overarching confidence and required improvements are detailed in the main report.
The confidence for each component was applied based on a categorical approach using high, moderate and low. To achieve the overall summary confidence a score of 0.25 was applied to low, 0.5 to moderate and 1.0 to high with an average value calculated across the components and the same scores used to then select he final overall category.
Spatial component: Open sea and coastal areas were treated separately due to the scale of sea area being vastly different. The area (km2) for each evaluated assessment unit was divided by the total number of stations in the assessment unit and the resulting area per station was used to divide into three categories, roughly interpreted as stations addressing small, medium or large areas. If a large number (relatively) of stations were still available despite the area being large an increase of 1 category was applied.
Temporal component: The presence of ‘full’ and/or ‘initial’ data series was utilised to evaluate this. Where only a single initial data series/station was present a category of low was applied, where two initial data series were available a category of moderate was applied, where a single full data series was present a category of moderate was applied, and where two or more full data series were present a category of high was applied.
Methodological component: A score of high is applied to all evaluated assessment units since the indicator is evaluated using the MIME tool and applies a regionally agreed methodology and threshold values on national monitoring data.
Evaluation component: The standard error generated within the MIME assessment tool is utilised as a proxy for this component. In simple terms the basis of this evaluation is that standard error can be roughly equated to a coefficient of variance. This therefore provides a general confidence evaluation of the underlying data and variation within it. A categorical approach was applied where standard error values >0.70 were scored as low, 0.4-0.7 were scored as moderate and <0.4 were scored as high.
The confidence is provided for water, sediments and biota below (Annex 1 – Tables 1-3).
The overall confidence for the OOAO status evaluation is also generated using a OOAO approach from these tables below, suing the overall category.
Annex 1 – Table 1. Summary table showing categorical confidence per component and overall for water.
| Assessment unit | Spatial component | Temporal component | Methodological component | Evaluation component | Overall category |
| EST-001 | Moderate | Moderate | High | Moderate | Moderate |
| EST-002 | Low | Low | High | Low | Low |
| EST-003 | Moderate | Moderate | High | Moderate | Moderate |
| EST-005 | Moderate | High | High | High | Moderate |
| EST-008 | High | Low | High | Low | Moderate |
| EST-009 | High | Low | High | Low | Moderate |
| EST-010 | Low | Low | High | Low | Low |
| EST-011 | Moderate | Moderate | High | Moderate | Moderate |
| EST-013 | Moderate | Low | High | Low | Moderate |
| EST-014 | Low | Low | High | Low | Low |
| EST-016 | Moderate | Moderate | High | Moderate | Moderate |
| GER-002 | High | Low | High | Moderate | Moderate |
| GER-005 | High | Low | High | Moderate | Moderate |
| GER-007 | High | Low | High | Low | Moderate |
| GER-010 | Moderate | Low | High | Low | Moderate |
| GER-013 | Moderate | Low | High | Moderate | Moderate |
| GER-020 | Moderate | Low | High | Moderate | Moderate |
| LIT-002 | High | Low | High | Moderate | Moderate |
| LIT-003 | High | Low | High | Moderate | Moderate |
| LIT-006 | Moderate | Low | High | Moderate | Moderate |
| POL-001 | High | Low | High | Moderate | Moderate |
| POL-002 | Moderate | Moderate | High | Moderate | Moderate |
| POL-003 | Moderate | Moderate | High | Moderate | Moderate |
| POL-004 | Moderate | Low | High | Low | Moderate |
| POL-005 | Moderate | Low | High | Low | Moderate |
| POL-006 | Low | Low | High | Low | Low |
| POL-007 | High | Low | High | Moderate | Moderate |
| POL-008 | High | Low | High | Low | Moderate |
| POL-009 | High | Low | High | Moderate | Moderate |
| POL-010 | High | Low | High | Low | Moderate |
| POL-011 | High | Low | High | Low | Moderate |
| POL-012 | High | Low | High | Low | Moderate |
| POL-014 | High | Low | High | Low | Moderate |
| POL-015 | High | Low | High | Low | Moderate |
| POL-016 | Moderate | Low | High | Low | Moderate |
| POL-017 | High | Low | High | Low | Moderate |
| POL-018 | High | Low | High | Moderate | Moderate |
| POL-019 | High | Low | High | Moderate | Moderate |
| SEA-005 | High | Low | High | Moderate | Moderate |
| SEA-006 | High | Moderate | High | Moderate | Moderate |
| SEA-007 | Moderate | Moderate | High | High | Moderate |
| SEA-009 | Moderate | High | High | High | Moderate |
Annex 1 – Table 2. Summary table showing categorical confidence per component and overall for biota.
| Assessment unit | Spatial | Temporal | Methodological | Evaluation | Overall category |
| DEN-139 | Moderate | Low | High | Moderate | Moderate |
| DEN-145 | High | Moderate | High | Moderate | Moderate |
| DEN-200 | Moderate | Moderate | High | Moderate | Moderate |
| DEN-206 | Low | Moderate | High | Moderate | Moderate |
| DEN-217 | Moderate | Moderate | High | Moderate | Moderate |
| DEN-224 | Moderate | Low | High | Moderate | Moderate |
| DEN-232 | High | High | High | Moderate | Moderate |
| SWE-005 | High | High | High | Moderate | Moderate |
| SWE-006 | Moderate | High | High | High | Moderate |
| SWE-007 | Moderate | Moderate | High | Moderate | Moderate |
| SWE-008 | Low | Moderate | High | Low | Moderate |
| SWE-011 | Moderate | High | High | High | Moderate |
| SWE-012 | Moderate | High | High | Moderate | Moderate |
| SWE-015 | Low | High | High | Moderate | Moderate |
| SEA-001 | Low | High | High | Moderate | Moderate |
| SEA-002 | Moderate | High | High | Moderate | Moderate |
| SEA-003 | High | Moderate | High | Moderate | Moderate |
Annex 1 – Table 3. Summary table showing categorical confidence per component and overall for sediment.
| Assessment unit | Spatial | Temporal | Methodological | Evaluation | Overall category |
| DEN-024 | Moderate | Low | High | Low | Moderate |
| DEN-034 | Moderate | Low | High | Low | Moderate |
| DEN-045 | Moderate | Low | High | Low | Moderate |
| DEN-085 | High | Low | High | Low | Moderate |
| DEN-092 | High | Low | High | Low | Moderate |
| DEN-113 | High | Low | High | Moderate | Moderate |
| DEN-128 | High | Low | High | Low | Moderate |
| DEN-136 | High | Low | High | Low | Moderate |
| DEN-137 | High | Low | High | Low | Moderate |
| DEN-142 | High | Low | High | Low | Moderate |
| EST-003 | Moderate | Moderate | High | Moderate | Moderate |
| EST-011 | Moderate | Low | High | Low | Moderate |
| EST-016 | Moderate | Low | High | Low | Moderate |
| FIN-004 | Low | Low | High | Low | Moderate |
| GER-026A | High | Low | High | Moderate | Moderate |
| GER-026B | High | Low | High | Moderate | Moderate |
| GER-029 | High | Low | High | Moderate | Moderate |
| GER-031 | High | Low | High | Moderate | Moderate |
| GER-032 | High | Low | High | Moderate | Moderate |
| POL-002 | Moderate | Low | High | Moderate | Moderate |
| POL-003 | Moderate | Low | High | Moderate | Moderate |
| SEA-001 | Low | Moderate | High | Moderate | Moderate |
| SEA-004 | Moderate | Moderate | High | Moderate | Moderate |
| SEA-005 | High | High | High | High | High |
| SEA-006 | High | High | High | High | High |
| SEA-007 | High | High | High | High | High |
| SEA-008 | Moderate | Low | High | Low | Moderate |
| SEA-009 | Moderate | High | High | High | Moderate |
| SEA-010 | High | High | High | High | High |
| SEA-012 | Low | Low | High | Moderate | Moderate |
| SEA-013 | Moderate | Moderate | High | Moderate | Moderate |
| SEA-014 | Moderate | Moderate | High | Moderate | Moderate |
| SEA-015 | Moderate | Moderate | High | Moderate | Moderate |
| SEA-017 | Moderate | Moderate | High | High | Moderate |