 Total Allowable Catch
Key message
Fisheries contribute substantially to the blue economy and are central in the cultural heritage of the Baltic Sea. However, commercially targeted species are affected by selective removal by fisheries that decreases their density and biomass. In order to protect marine ecosystems and regulate interactions between ecosystems and fishery activity, efficient measures are required in the Baltic Sea region. Various drivers determine the negotiations and agreements over TACs in the Baltic Sea region. Political will is the main driver to manage and protect important fish stocks with concrete actions in the Baltic Sea. In addition, the socio-economic setting of fisheries is another important driver regarding the consequences of limitations on the sector.
The European Commission prepares proposals for measures and instruments for resource conservation including fishing quotas and fishing effort limitations after a consultative process. As a part of this process, scientific bodies, predominantly ICES (International Council for the Exploration of the Sea), are requested to provide information about the state of fish stocks and advise on maximum catch levels. Member States then negotiate TACs (Total Allowable Catches, i.e., a catch limit set for a particular fish stock, for a year or a fishing season) and quotas for commercially important fish stocks of the Baltic (cod, herring, sprat, salmon and plaice).
While defining catch quotas, consideration of scientific advice is vital in order to achieve sustainable fisheries management and restore fish populations to healthy levels. In the Baltic Sea countries, the percentage by which TACs were set above the scientific advice declined between 2001 and 2021 (from 51% to 1% in all Baltic Sea countries). However, among ten stocks with quota assessments, 3 to 6 TACs were set above advice each year in HOLAS 3 assessment period (2016 – 2021).
Citation
The data and resulting data products (e.g. tables, figures and maps) available on the indicator web page can be used freely given that it is used appropriately and the source is cited. The indicator should be cited as follows:
HELCOM (2023). Total Allowable Catch. HELCOM driver indicator report. Online. [Date Viewed], [Web link].
ISSN 2343-2543
Background
Commercial fish are a vital component of Baltic Sea ecosystems and provide critical goods and services for the region’s human population. Approximately one hundred fish species live in the Baltic Sea. However, the major commercial fish species of high value in the Baltic Sea are cod, herring, and sprat. Flatfish species like flounder and plaice are also utilized, especially in the southern part of the Baltic Sea. Overall, nearly 90% of the total fish catch consists of herring, sprat, cod, and flounder (FAO FishStat Database). Fisheries contribute substantially to coastal economies and are central in the cultural heritage of the Baltic Sea. In 2019 the Baltic Sea commercial fishing sector employed an estimated 4068 full time equivalent people and created a gross value added of 122 million euros (STECF 2020).
In order to protect marine ecosystems and regulate interactions between ecosystems and fishery activity, efficient measures are required in the Baltic Sea region. All Baltic coastal states, except Russia, are members of the European Union, with their fishing activities regulated by the EU Common Fisheries Policy (CFP). The International Council for the Exploration of the Sea (ICES) is the main body for collecting statistics of Baltic fish stocks with regard to the assessments of the state of fish resources (e.g., stock sizes and proposed exploitation levels) (Borges 2018). ICES receives officially reported fish catches by national statistical offices and data collection agencies and carries out assessments for requested stocks. The Baltic Sea Advisory Council (BS-AC), which is made up of regional fisheries associations and other stakeholders, including HELCOM, also gives its opinion on the exploitation levels. ICES advises on maximum catch levels for assessed stocks.
Based on the scientific advice, the European Commission (EC) prepares proposals for measures and instruments for resource conservation including fishing quotas (e.g., total allowable catches) and fishing effort limitations after a consultative process (as explained in Council regulation (EU) 2021/1888). TAC (Total Allowable Catch) is a catch limit set for a particular fish stock, for a year or a fishing season, and they are annually defined for commercially important fish stocks of the Baltic (cod, herring, sprat, salmon and plaice). Every year, Baltic TACs are published in Baltic specific Council regulations and the European Commission’s original proposals and ICES advice documentation are published on the Commission’s webpage: TACs and quotas. The Council of the EU (consisting of agriculture and fisheries ministers) adopts regulations in consultation with the European Parliament.
In 2016, a Baltic Sea Multi-Annual Plan (MAP) (EC 2016) was formed after a long period of discussion, establishing a multiannual plan for the stocks of cod, herring and sprat in the Baltic Sea and the fisheries exploiting those stocks. Multi-Annual Plans (MAPs) are used for regionalisation of CAP instruments such as conservation measures for compliance with EU environmental laws, establishment of fish stock recovery areas, and technical measures. The Baltic Sea MAP seeks to add long-term assistance to the quota-setting process and provide a moderate forum for some of the potential political issues.
Drivers
Various drivers determine the negotiations and agreements over TACs in the Baltic Sea region. Political will is the main driver to manage and protect important fish stocks with concrete actions in the Baltic Sea (Borges 2018). In addition, the socio-economic setting of fisheries is another important driver regarding the consequences of limitations on the sector (CEC, 2009). Further, international relations influence the decisions on fishing quotas since there are countries using different regulatory frameworks.
A brief summary of relevant drivers of relevance to this topic are provided below and a more detailed overview of these can be found in the HOLAS 3 Thematic Assessment of Economic and Social Analyses.
Political will – Regulation
Fish stocks in the Baltic Sea are under multiple pressures including fishing, agricultural runoff, ocean warming, and acidification (Bastardie et al. 2020). Among these pressures, fishing can be controlled directly by political will and regulations (Carpenter and Heisse 2019). The EU’s main fishery policy, the Common Fisheries Policy (CFP), addresses the environmental, economic, and social dimensions of fisheries. The CFP is a set of rules for sustainably managing European fishing fleets and conserving fish stocks. According to the CFP, the exploitation of living marine biological resources must restore and maintain populations of harvested species above levels which can produce the maximum sustainable yield (MSY). One of the primary instruments in this respect is the Commission proposal for the fishing opportunities in the Baltic Sea, which aims to adjust the fishing levels toward long-term sustainability targets (i.e., MSY). Ultimately, EU countries determine how much fish can be caught in the sea basin based on this proposal. Therefore, the agreed TACs are the result of a negotiation between Member States representing their national interests in the Council and the European Commission (Raakjær 2009, Borges 2018).
When defining allowable catch quotas, consideration of scientific advice is vital in order to end unsustainable fishing and restore fish populations to healthy levels (Marchal et al. 2016). Although regulatory processes and scientific contributions are in place, fishing pressure continues as the scientific advice has not been followed completely. In European waters, two-thirds of TACs have been set above scientific advice since 2001. It is important to note that giving priority to short-term interests can risk the health of important fish populations (Carpenter and Heisse 2019).
Socio-economic setting
Fishing has been an important economic and social activity in the Baltic Sea region since at least the 1500s and is very important to the cultural heritage of Baltic Sea societies (Holm and Bager 2002, MacKenzie 2002). The fisheries sector contributes substantially to the region’s coastal economies. Therefore, the socio-economic setting of fisheries is a significant driver for policy decisions such as TACs in the Baltic Sea region.
Restoring the productivity of fish stocks is very important for the long-term viability of fishery activity (Borges 2018). Although ecological sustainability is the basic principle for the future of fisheries, ecological, economic and social objectives can clash when fishing activity has to be limited (CEC 2009). There are clear economic and social consequences of TACs such as reduced short-term income for fishermen. Fisheries play an important role in the social fabric and the cultural identity of Baltic Sea coastal regions (MacKenzie 2002). Strict quotas may create risks to social and employment structure of the coastal communities who are closely tied to the income of the fishing industry. Considering the size of existing fishing fleet, limited resources and volatile oil prices, it is very challenging to adapt to change and restore the economic viability of the sector (CEC 2009).
Therefore, the process of reducing fishing pressure should be an evidence-based and equitable transition. A range of policy options were proposed to be applied to determine how the impact of this transition is felt by fishery sector such as: using quota allocation amongst vessels to change the distribution of impacts, using labour policy to change how fishers are paid, and using fisheries subsidies to fund the transition (Carpenter and Heisse 2019, Kane et al. in press). Further, early limitations would avoid larger scale fish stock problems. Research has revealed that ending unregulated fishing has larger economic benefits when it is achieved in short time (Guillen et al. 2016). Limited fishing activity can cause fish populations grow in size, reproduce more, and larger populations can support larger catches in the future.
International relations
National exclusive economic zones (EEZs) provide countries with increased control over coastal marine resources. However, a variety of jurisdictional conflicts still arise as sea borders lack actual physical obstacles (Hannesson 2011). In fisheries, an increasing number of countries participating in the activity creates additional competition for biologically limited resources. In addition, climate change is causing species to shift their natural distributions, and this worsens the transboundary issues even further and increases the need for effective international management (Teh and Sumaila 2015).
Therefore, healthy and effective international relations is an important driver that influences sustainable fishery management. Optimal management strategies, the noncooperative effects on stock levels, mechanisms to attain cooperation for specific fisheries, and the interaction between coastal states can be considered under the influence of international relations (McWhinnie 2009). In Europe, CFP plays a key role in terms of international fisheries cooperation and management. As part of CFP’s main objectives and good governance principles, the EU countries participate in various multilateral agreements and regional fisheries management organisations, as well as bilateral fisheries agreements.
In the Baltic Sea context, international relations and cooperation are vital since there are both EU and non-EU countries using different regulatory frameworks. More cooperation is needed to overcome the challenges arise due to different regulations in Baltic Sea coastal states (e.g., regulations on fishing quotas). The Helsinki Convention is an important example of this cooperation in the Baltic Sea, which addresses the increasing environmental challenges and the impacts on the marine environment.
Driver Indicators
Total Allowable Catch is a stand-alone driver indicator set which consists of historical excess TACs information as a proxy indicative of drivers related to fisheries. It has high clarity of impact and can be linked to a variety of relevant drivers. This indicator can be used as a quantified proxy for the drivers of political will and socio-economic setting. An overview of relevant data trends and information is provided below.
TACs above ICES Advice
HELCOM holistic assessments (HOLAS) provide a comprehensive overview of the ecosystem health of the Baltic Sea. Three holistic assessment periods (HOLAS 1, 2 and 3) were used to compare TACs set above ICES advice (excess TACs) in the Baltic Sea. Data show that (Figure 2) annual TACs by tonnes were 11%, 8% and 5% above scientific advice (on average) during the HOLAS 1 (2003-2007), HOLAS 2 (2011-2016) and HOLAS 3 (2016-2021) assessment periods, respectively. Total excess TACs by tonnes in the Baltic Sea countries declined significantly from 51% to 1% (F1,20 = 12.220, p = 0.002) in the last 20 years (Figure 2). Although a decreasing trend was observed in excess TACs by tonnes, on average, TACs were set 12% above scientific advice between 2001 and 2021. Observed excess TACs by tonnes were largely due to Western Baltic herring and Eastern Baltic cod fish stocks.
In terms of the number of assessed stocks, the proportion of TACs set above ICES advice has also been decreasing significantly (F1,20 = 46.084, p < 0.001). However, among ten stocks with quota assessments, 3 to 6 TACs were set above advice each year in HOLAS 3 assessment period (2016 – 2021) (Figure 4). In terms of countries, excess TACs vary through the years, however, almost all Baltic Sea countries show excess TACs each year.
Note that some fish stocks (cod subdivision 25-32, herring subdivisions 22-24) have been advised a zero catch by ICES and these stocks were bycaught in mixed fisheries. However, in this exercise any TAC above ICES advice were considered excess TAC. According to EU landing obligations, all catches of species regulated through catch limits should be landed and counted against the fishers’ quotas. In this context, EU landing obligations supports accountability and helps to eliminate discards by encouraging fishers to fish more selectively and to avoid unwanted catches.
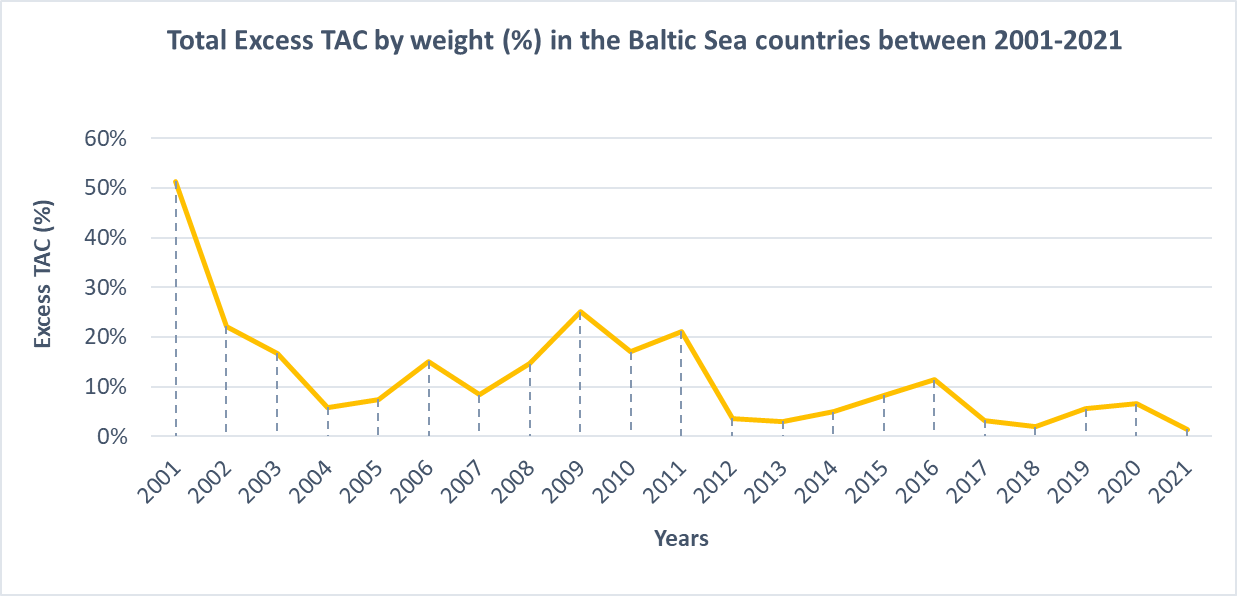
Figure 2: Total Excess TAC (Total allowable catch above ICES advice) by tonnes as percentage in the Baltic Sea countries between 2001-2020. Chart does not include data from Russia or any non-HELCOM countries. Note that the catch value below the TAC value was not considered in the calculation and the chart presents TAC values that are above ICES advice. TAC values for Atlantic Salmon in subdivisions 22–31 was not considered in this calculation due to the given unit value.
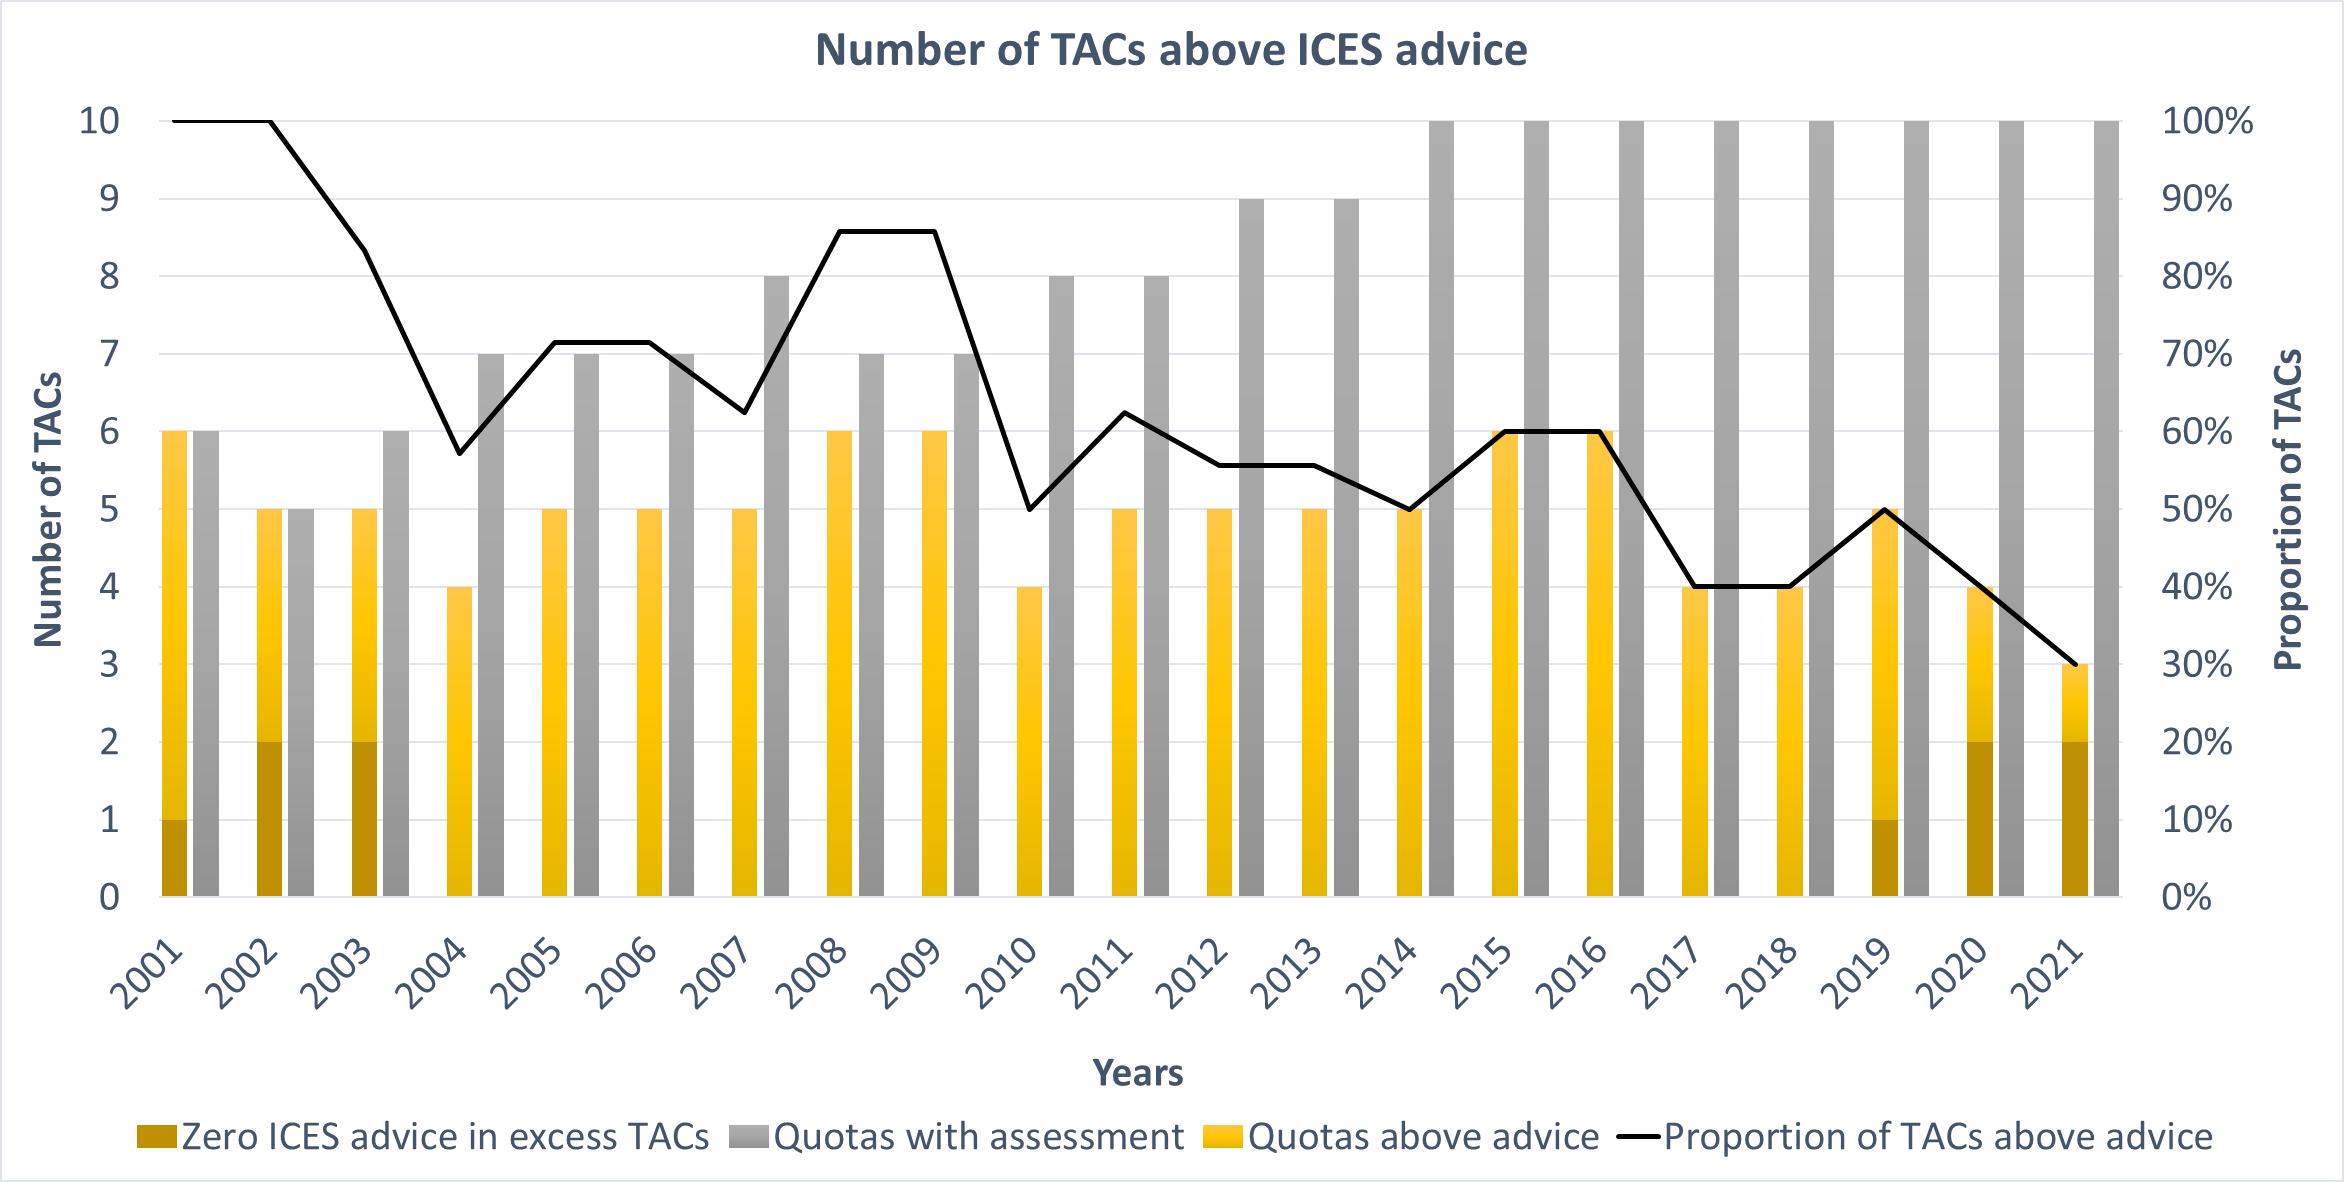
Figure 3: Number of TACs (Total allowable catch) set above ICES advice in Baltic Sea countries between 2001-2021. Chart does not include data from Russia or any non-HELCOM countries. In total, 10 stocks were analysed in this chart including atlantic salmon (subdivisions 22-31, subdivision 32), cod (subdivisions 22-24, subdivisions 25-32), herring (subdivision 28.1, subdivisions 25-27, 28.2, 29, 32, subdivision 30-31, subdivisions 22-24), plaice (subdivisions 22-32), and sprat (subdivisions 22-32). Zero ICES advice (zero quota) stocks (cod subdivision 24-32 and herring subdivision 22-24) were highlighted in dark yellow colour.
While complete data for 2022 was not available when this indicator was drafted, the EC’s proposal for the Total Allowable Catches (TACs) and quotas for the Baltic Sea have been well received by environmental groups. According to several NGOs, “the Commission applied a precautionary position when setting the recommendations for Total Allowable Catches (TACs) for 2022, and this proposal shows the will of the Commission to take steps to protect the Baltic ecosystem”. According to EC proposal (2021):
- TAC for herring in the Western part of the Baltic Sea was limited to bycatches and was reduced by 50%; in the Central Baltic it was cut by 45%.
- Given the lack of improvement in cod stocks, the Council continued the practice of setting only a specific TAC for bycatches. This was also the case for salmon in the Main Basin, although the TAC for salmon stocks in the Gulf of Finland saw a moderate increase.
- The TACs for plaice and sprat were increased by 25% and 13% respectively.
In addition to the abovementioned TACs and national quotas, the Council agreed on specific measures for cod stocks, including restrictions and temporary fishing bans. After these reductions, TACs for 2022 by tonnes were closer to the ICES advice compared to previous years, however, the number of stocks above advice are likely to remain similar to past averages.
Confidence
Historical data of agreed TACs for Baltic Sea countries and ICES advice were found for each Baltic Sea countries except Russia, between 2001-2021. Data is publicly available, Thus, overall, the indicator evaluation has high confidence.
Conclusions
The Baltic Sea is affected by fishing activity and TAC is an important measure to control fishing activity and restore fish populations to healthy levels. Various drivers influence the negotiations and agreements over TACs in the Baltic Sea region. Although political will is the main driver to manage and protect important fish stocks with concrete actions, the socio-economic setting of fisheries is significant to consider regarding the consequences of limitations on the sector. Further, international relations influence the decisions on fishing quotas since there are countries using different regulatory frameworks.
Consideration of scientific advice is vital in TAC decisions; however, the scientific advice has not been entirely followed by the policymakers over the last 20 years. Data shows that annual TACs by tonnes were 11%, 8% and 5% above scientific advice on average during the HOLAS 1, HOLAS 2 and HOLAS 3 assessment periods, respectively. Observed excess TACs by tonnes were largely due to Western Baltic herring and Eastern Baltic cod fish stocks. The EC’s 2022 TAC proposal suggested reductions and TACs for 2022 by tonnes are closer to the range of ICES advice compared to the previous years. This would align with the trend of shrinking excess TAC size.
Historical trends show that Baltic Sea countries are committed to reduce the size of the excess TACs. Although countries appear to recognize the economic and environmental danger of excess TACs, there seems to be certain reasons to maintain some fish quotas above scientific advice. This likely highlights the short-term conflicts between the environmental and socio-economic concerns.
Links to society and environment (DAPSIM)
Activities
Pressures
The following pressure assessments are carried out through indicator evaluations:
- Species removal by fishing and hunting (HOLAS 2)
Status
The following status assessments are carried out through indicator evaluations:
Each of these indicators can be considered to have a direct possible relationship with the driver(s) described in this report, in particular on the potential to achieve a state representative of good environmental status (GES). In addition, there are ecological impacts of nutrient concentration increases that are reflected by the distance to achievement (i.e. the distance to threshold value in the state evaluations), as well as indirect eutrophication impacts such as increased algal blooms or reduced water clarity. Aspects such as contaminant impacts, or load can also influence the status as well as commercial opportunities. Furthermore, such impacts may also be transferred through Baltic Sea food webs and have consequences for biodiversity components. Other relevant indicators are available on the HELCOM indicator web page.
Impacts
Impacts on society as a consequence of the distance from GES can also be evaluated, where losses of potential benefits or disruption of human activities can be considered. In addition, the direct consequences of overexploitation on ecosystem function can also be addressed. Either or both of these impacts may catalyse the need for measures.
Measures
The CFP is a set of rules for sustainably managing European fishing fleets and conserving fish stocks. Originally part of the common agricultural policy (CAP), the common fisheries policy (CFP) started with the same objectives: to increase productivity, to stabilise the markets, to provide a source of healthy food and to ensure reasonable prices for consumers.
Council agreement on 2023 catch limits in the Baltic Sea
The Council of the European Union adopted the Commission proposal for fishing opportunities for 2023 for the Baltic Sea (Proposal for a Council Regulation fixing for 2023 the fishing opportunities for certain fish stocks and groups of fish stocks applicable in the Baltic Sea). Based on this agreement, EU countries will determine how much fish can be caught in the sea basin, for what concerns the most important commercial species.
Related Baltic Sea Action Plan (BSAP) actions
- S40: Identify by 2024 fish species for which there is a need for better data for identified purposes, such as setting threshold levels. Utilise dedicated programmes and projects to facilitate recording and reporting of data for these species by 2025 to support the identification and implementation of measures to achieve good environmental status
- S50: Competent authorities to jointly further develop protective measures for Baltic Sea salmon to support the development of a new regional salmon management plan, and nationally establish salmon management plans by 2023, where appropriate. These management plans should be implemented by 2025 to achieve the set targets, including but not limited to smolt production, genetic diversity and distribution throughout the river habitat. In addition, nationally ensure that granting permits for activities in and near rivers does not compromise the ability to reach set river-specific fish population targets.
- S51: Competent authorities to improve data related to sea trout stocks and to improve populations of sea trout stocks by implementing national measures at the latest by 2025 with a view to achieving good ecological condition in sea trout streams.
- S52: Define necessary complementary measures by 2024 in relevant policy (fisheries, environment etc.) areas to improve the size/age structure for fish stocks, including cod.
- S53: Implement measures to restore coastal fish communities, including establishment of no-take areas, seasonal closures and catch regulations, as appropriate by 2026 for the specific coastal area.
- S54: Share information among Contracting Parties, the Baltic Sea Fisheries Forum (BALTFISH) and Baltic Sea Advisory Council (BSAC) on non-lethal mitigation measures or other ways to manage seals-fisheries interactions and implement those measures by 2025, as appropriate.
Related HELCOM Recommendations
HELCOM Recommendation 32-33-1Conservation of Baltic Salmon (Salmo salar) and Sea Trout (Salmo trutta) populations by the restoration of their river habitats and management of river fisheries
Future development
Future development of this indicator may be relevant to bring in more data or more suitable information to build stronger conceptual links within the DAPSIM conceptual management framework. Such developments, as well as the development of other relevant driver indicators associated with the topic, if relevant, may support a better overall understanding processes and thus increase the potential for clear management action.
It is recommended to review the confidence or limitation sections of the ICES advice documents in the future application of this work. Further, it is recommended to analyse the relationship between the driver indicator and the size – structure of the coastal fish species. It is also important to analyse the impacts of TAC decisions on the migratory species. Experts suggested to review ICES advice on Eel fisheries in the future applications.
Beyond HOLAS 3, it is recommended to discuss the relationship between measures and driving forces. Future work should focus on what extent the existing measures address driving forces and how driver indicators can be used to identify required measures.
Methodology
The indicator and report focus on utilizing available data and information to provide an overview of trends in drivers (or proxies indicative of such drivers) that can be informative in a causal framework (i.e., DAPSIM, as applied in HELCOM).
The work carried out represents an initial step towards addressing drivers in HELCOM work and at this stage focusses on selected aspects where 1) experts identified valid potential, and 2) where suitable data were available. The following text describes how such data were handled and utilized.
This assessment was carried based on the ICES Advice documents on fishing opportunities, catch, and effort for Baltic Sea ecoregion. In each document, MSY based ICES advice and agreed TAC values were provided. Quantification of TAC values come from the ICES estimates.
An overview of the methodology applied can be found in the HOLAS 3 Thematic Assessment of Economic and Social Analyses.
Proposed driver indicators:
While the concept of Drivers in any DAPSI(W)R(M)-based framework is well established, the statistics used to generate indicators of a driver do not necessarily neatly correspond to one of the DAPSI(W)R(M) elements. A driver indicator may very closely represent a driver (for example total population is a direct representation of the demographics driver), closely represent another DAPSI(W)R(M) element (for example the number of fishing days at sea is a direct representation of the Activity of commercial fishing), or not clearly fall into a single DAPSI(W)R(M) element at all (for example agricultural nutrient balance). Additionally, simple proximity to the targeted driver does not make a driver indicator informative. Operating subsidies in commercial fishing are a direct measure of the Subsidy and Regulation Driver but without extensive knowledge about what the operating subsidies are used for, who they target, the tax regime the operator exists in, etc., it is unclear what effect an increase or decrease in the level of operating subsidies would have. On the other hand, despite not being particularly close to any Driver, agricultural nutrient balance is excellent at capturing the cumulative impact of numerous drivers and can be used as tool for illustrating the impact of observed changes in drivers. This multi-dimensional ambiguity was difficult to understand without a way of tracking these topics.
To explore these relationships for proposed potential driver indicators (both for implemented driver indicators and driver indicators rejected for various reasons), quadrant charts were developed. These figures were utilized to explain the proximity to drivers (y-axis) and the clarity of impact (x-axis) for each investigated driver indicator. It is important to highlight that these figures are development tools and can only reflect the information the researchers had at the time of the analysis. Further, the points were qualitatively placed by the Secretariat based on subjective criteria. Differences of opinion are certain to exist. Small changes in the position of points on the chart should be disregarded.
Clarity of impact (x-axis): This axis demonstrates the explanatory power of the driver indicator in capturing the relationship between the Driver and the chosen Activity-Pressure pair (Agriculture-Input of nutrients, Fishing-Fish extraction, Urban uses-Input of nutrients). Changes in the level of data (for example regional vs global population) will affect the clarity of the driver indicator. Indicators with very low clarity of impact were placed on the left side of the chart, while indicators with high clarity of impact were placed on the right side of the chart.
Proximity to driver (y-axis): This axis demonstrates the proximity of indicator to the explained driver. Indicators which were very closely related to driver itself were placed higher on the chart, while indicators which are closer to Activities or Pressures were placed lower on the chart. Points placed closer to the middle were not direct measurements of any particular DAPSI(W)R(M) element and instead capture aspects from multiple elements.
Based on these characteristics, driver indicators were shown in four general categories:
- Optimal driver indicators: Closely related to drivers with high clarity of impact.
- Opaque driver indicators: Closely related to drivers with low clarity of impact.
- Alternate driver indicators: Not closely related to drivers but with high clarity of impact.
- Not useful as driver indicator: Not closely related to drivers and with low clarity of impact.
All driver indicators that were not placed in the “Not useful as a driver indicator” were considered for full development. However, not all these driver indicators were eventually developed due to insufficient time or resources, insufficient data, or the presence of multiple more informative driver indicators.
The charts present a quick overview of the perceived status of investigated driver indicators and suggest potential directions for further development.
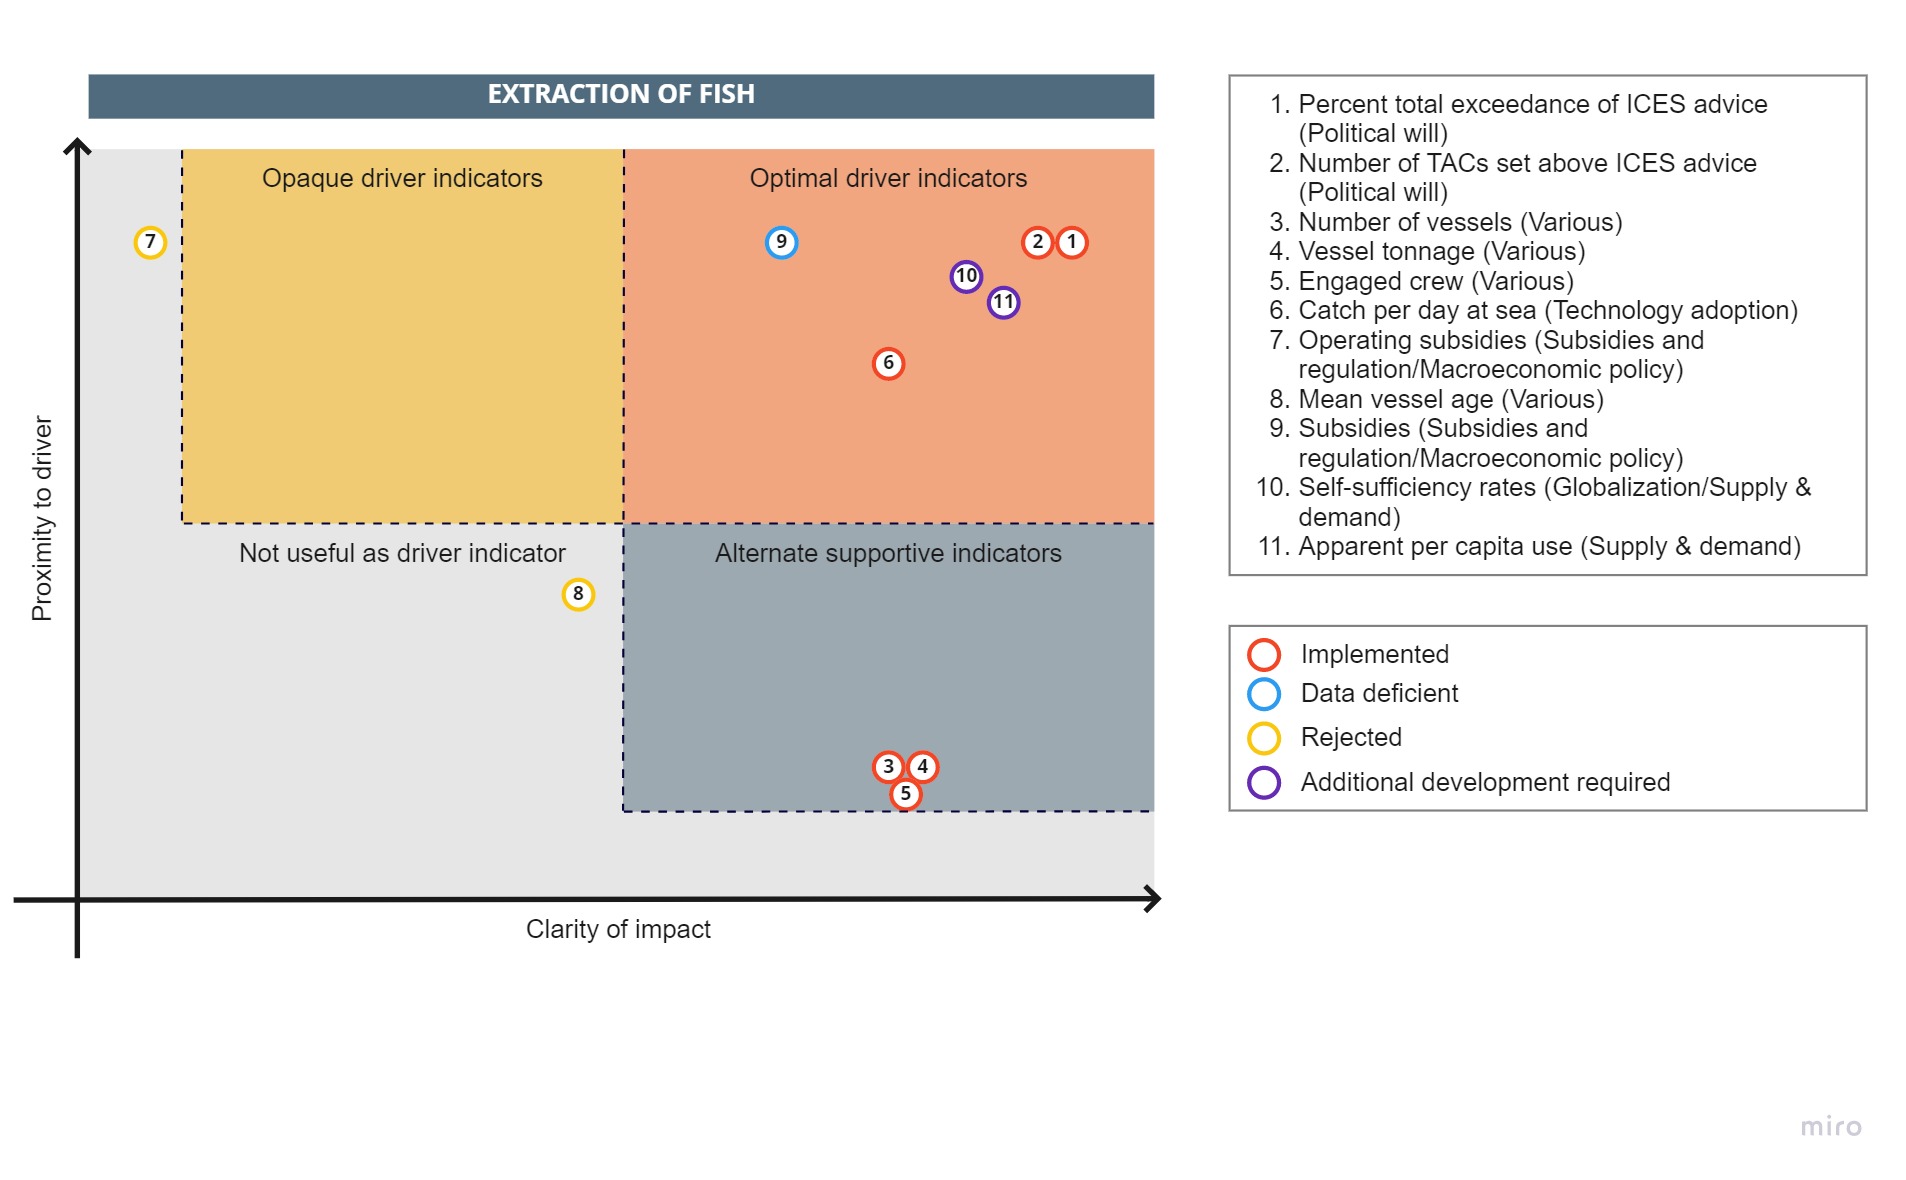
Figure 4: Driver indicators relevant for extraction of fish pressure – activity pair, their proximity to drivers and clarity of impact. Driver indicators were subjectively categorized under opaque driver indicators, optimal driver indicators, not useful as driver indicator and alternate supportive driver indicators categories.
Data processing
Data was used as it was provided in European Commission and ICES websites. Further, the data was gathered by Carpenter, G. & Heisse, C. (2019).
Data
- ICES advice by TAC and year
- Council agreed TAC by Member State and year
- The difference between TACs and ICES advice by Member State and year
Archive
This current version of the indicator is the first iteration. Future updates or evolution of the indicator document will be provided online, and older versions will be archived via a link in this section of the document.
References
Bastardie, F., Danto, J., Rufener, M. C., van Denderen, D., Eigaard, O. R., Dinesen, G. E., & Nielsen, J. R. (2020). Reducing fisheries impacts on the seafloor: a bio-economic evaluation of policy strategies for improving sustainability in the Baltic Sea. Fisheries Research, 230, 105681.
Bryhn, A. C., Bergek, S., Bergström, U., Casini, M., Dahlgren, E., Ek, C., … & Wennhage, H. (2022). Which factors can affect the productivity and dynamics of cod stocks in the Baltic Sea, Kattegat and Skagerrak?. Ocean & Coastal Management, 223, 106154.
Borges, L (2018). Setting of total allowable catches in the 2013 EU common fisheries policy reform: possible impacts. Marine Policy, 91(), 97–103. doi:10.1016/j.marpol.2018.01.026
Carpenter, G. & Heisse, C. (2019). Landing the Blame: Overfishing in the Baltic Sea 2020. London: New Economics Foundation. Retrieved from: https://neweconomics.org/2019/12/landing-the-blame-overfishing-in-the-baltic-sea-2020
CEC. Green Paper on the Reform of the Common Fisheries Policy. Commission of the European Communities, COM (2009) 163 final, 2009. pp. 27.
Erkkilä-Välimäki, A., Pohja-Mykrä, M., Katila, J., & Pöntynen, R. (2022). Coastal fishery stakeholders’ perceptions, motivation, and trust regarding maritime spatial planning and regional development: The case in the Bothnian Sea of the northern Baltic Sea. Marine Policy, 144, 105205.
European Commission, 2021, Directorate-General for Agriculture and Rural Development, Beck, M., Van Bunnen, P., Wathelet, J., et al., Evaluation support study on the CAP’s impact on knowledge exchange and advisory activities: final report, Publications Office of the European Union, https://data.europa.eu/doi/10.2762/045268
European Commission (2013) The Common Fisheries Policy. Retrieved from https://ec.europa.eu/fisheries/cfp_en
European Commission (2016) Regulation 2016/1139 of the European Parliament and of the Council of 6 July 2016 establishing a multiannual plan for the stocks of cod, herring and sprat in the Baltic Sea and the fisheries exploiting those stocks, amending Council Regulation (EC) No 2187/2005 and repealing Council Regulation (EC) No 1098/2007
European Environment Agency, EEA (2022) EEA Glossary. https://www.eea.europa.eu/help/glossary/eea-glossary. Date accessed: 12/08/2021.
Guillen, Jordi; Calvo Santos, Angel; Carpenter, Griffin; Carvalho, Natacha; Casey, John; Lleonart, Jordi; Maynou, Francesc; Merino, Gorka; Paulrud, Anton (2016). Sustainability now or later? Estimating the benefits of pathways to maximum sustainable yield for EU Northeast Atlantic fisheries. Marine Policy, 72(), 40–47. doi:10.1016/j.marpol.2016.06.015
Hannesson, R. (2011). Game theory and fisheries. Annu. Rev. Resour. Econ. 3, 181–202. doi: 10.1146/annurev-resource-083110-120107
Holm, P. and Bager, M. 2002. The Danish fisheries c.1450-1800. Medieval and early modern sources and their potential for marine environmental history. In Exploited Seas: Directions for Marine Environmental History. Edited by P.Holm and T.Smith. St. John’s, Newfoundland
Kane E.A., Ball A.C., Brehmer Patrice Dilemma of total allowable catch (TACs) allocated as shareable quotas: Applying a bio-economic game-theoretical approach to euro-mauritanian fisheries agreements. Aquaculture and Fisheries IN PRESS. Publisher’s official version : https://doi.org/10.1016/j.aaf.2022.02.008 , Open Access version : https://archimer.ifremer.fr/doc/00773/88453/
Marchal P., Andersen J.L., Aranda M., Fitzpatrick M., Goti L., Guyader O., Haraldsson G., et al., A comparative review of fisheries management experiences in the European Union and in other countries worldwide: iceland, Australia, and New Zealand, Fish. Fish. 17 (2016) 803–824, http://dx.doi.org/10.1111/faf.12147.
MacKenzie, B.R., Awebro, K., Bager, M., Holm, P., Must, A.T., Poulsen, B.K., Ojaveer, H., & Uzars, D. (2002). Baltic Sea Fisheries in Previous Centuries: Development of Catch Data Series and Preliminary Interpretations of Causes of Fluctuations.
McWhinnie, S. (2009), The tragedy of the commons in international fisheries: An empirical examination, Journal of Environmental Economics and Management, 57, issue 3, p. 321-333, https://EconPapers.repec.org/RePEc:eee:jeeman:v:57:y:2009:i:3:p:321-333.
Raakjær J., A fisheries management system in Crisis – the EU Common Fisheries Policy. A summary of the senior doctoral thesis, Aalborg University. ICES CM 2009/ R:01, 2009, pp. 8
Teh, L. S., and Sumaila, U. R. (2015). Trends in global shared fisheries. Mar. Ecol. Prog. Ser. 530, 243–254. doi: 10.3354/meps11049
UNEP, 2005. Lääne, A., Kraav, E. and G. Titova. Baltic Sea, GIWA Regional assessment 17. University of Kalmar, Kalmar, Sweden.