 Trout abundance
2. Relevance of the indicator
The densities of parr measured in rearing areas in rivers reflect the abundance of the adult sea trout spawners and success of recruitment. Sea trout is a top predatory fish species, and the adult sea trouts migrate to the Baltic Sea to feed.
Sea trout abundance is affected by both environmental conditions (i.e. both water and habitat quality and also possible migration barriers to reproduction areas), and commercial and recreational fishing at sea and in rivers. Thus, the indicator reflects the state of the ecosystem as it is sensitive to river connectivity (e.g. effect of dams) and the quality of spawning and rearing habitats.
Electrofishing in rivers for measuring parr densities is effective method and surveys carried out in about 270 brooks and data covers almost all Baltic Sea area. Spawner counter data is available from 20 rivers in four countries (ICES 2021).
2.1. Ecological relevance
Sea trout plays an important role in maintaining the balance in riverine food webs, both by harvesting invertebrate populations and also serving as an important food source for other predatory species (ICES 2015).
There are around 1,000 sea trout rivers and streams in the Baltic Sea (HELCOM 2011), with an estimated 395 populations of wild sea trout (and 77 with mixed wild and reared populations) in the Baltic Proper, 28 wild populations (and 28 mixed populations) in the Gulf of Bothnia and 85 wild populations (and 16 mixed population) in the Gulf of Finland. Altogether this adds up to 508 wild and 121 mixed sea trout populations in brooks/rivers in the Baltic Sea area (ICES 2015). The migration patterns of different trout populations vary, with the adult trout of some populations spending their entire life cycle in the same river, whereas the adults of other populations migrate to the coastal areas of the sea where they feed on various invertebrates and small fish. The exact migration patterns are not known, however, sea trout is generally considered to feed in the vicinity of the coastline and to migrate up and down the coast. Thus, the abundance of sea trout can be considered as a good indicator of food availability in the coastal area. As a predatory fish species, sea trout generally has a structuring role in the ecosystem, mainly via top-down control on lower trophic levels.
2.2. Policy relevance
The core indicator abundance of sea trout spawners and parr addresses the goal (Baltic Sea ecosystem is healthy and resilient) and the ecological objectives: ‘Viable populations of all native species’, ‘Natural distribution, occurrence and quality of habitats and associated communities’, ‘Functional, healthy and resilient food webs’ under the Biodiversity segment of the Baltic Sea Action Plan. (BSAP 2021)
The core indicator has relevance to the following specific BSAP actions:
- B15: ‘Develop and coordinate monitoring and assessment methods, where ecologically relevant, for specified representative coastal fish species, populations and communities, by 2023. Based on these assessment methods, to regularly assess the state of the coastal fish community through selected coastal fish species and groups, including threatened species, by at latest 2023. Based on the results of the assessment, develop and implement management measures with the ambition to maintain or improve the status of coastal fish species, including migratory species by 2027. Develop and implement habitat restoration plans of spawning sites for anadromous species in relevant rivers by 2025.’.
- B16: ‘To strengthen native strains and to reinstate migratory fish species: — By 2023 identify rivers where management measures for migratory fish species, including eel, would have the greatest positive impact. — Starting from 2023, in line with relevant international commitments, iteratively review and prioritize effective mitigation measures in the identified rivers and/or dams, including removal of dams and migration barriers where relevant and possible, especially in small waterways’.
The core indicator also addresses the following qualitative descriptors of the MSFD for determining good environmental status (Commission Decision (EU) 2017/848): Descriptor 1 Species groups of birds, mammals, reptiles, fish and cephalopods; Descriptor 4 Ecosystems, including food webs – Trophic guilds of an ecosystem; and to an extent Descriptor 3 Populations of all commercially-exploited fish and shellfish are within safe biological limits, exhibiting a population age and size distribution that is indicative of a healthy stock.
Sea trout rivers and brooks are also within the focus of EU Water Framework Directive (WFD) and all actions improving the habitat quality of these watersheds will also benefit the sea trout stocks.
An overview of policy relevance is summarised in Table 1.
Table 1. Overview of policy relevance for this indicator.
| Baltic Sea Action Plan (BSAP) | Marine Strategy Framework Directive (MSFD) | |
| Fundamental link | Segment: Biodiversity
Goal: “Baltic Sea ecosystem is healthy and resilient”
|
Descriptor 1 Species groups of birds, mammals, reptiles, fish and cephalopods.
|
| Complementary link |
|
Descriptor 4 Ecosystems, including food webs – Trophic guilds of an ecosystem.
Descriptor 3 Populations of all commercially-exploited fish and shellfish are within safe biological limits, exhibiting a population age and size distribution that is indicative of a healthy stock. |
| Other relevant legislation: |
|
|
2.3. Relevance for other assessments
The status of biodiversity is assessed using several core indicators. Each indicator focuses on one important aspect of the complex issue. In addition to providing an indicator-based evaluation of the abundance of sea trout spawners and parr, this indicator contributes to the overall biodiversity assessment, along with the other biodiversity core indicators. The indicator is utilised in the integrated assessment of biodiversity (BEAT tool) under the state of the Baltic Sea report (HOLAS, including the thematic assessment of biodiversity).
3. Threshold values
The evaluation of environmental status is based on the comparison of the observed parr densities in rearing habitats with the reference potential parr densities in the specified habitats, which is based on observed trout densities at different habitat qualities (ICES 2015).
Parr is a young sea trout living in the river before the smoltification (process of behavioural, developmental and physiological changes to adapt to the changing environmental conditions, i.e. seawater) and start of feeding migration to the sea. The parr stage is sometimes subdivided according to age, where parr 0+ are young fish less than one year old. Depending on the river, sea trout parr spend 1-3 years in the river before the sea run.
The site-specific reference parr densities exhibit a rather large natural variation between years. In rivers where the abundance of spawners has been estimated to continuously meet the conservation limits, and are thus considered to reflect good status, the parr densities have varied between 60-100% of the estimated reference potential densities. In this evaluation, threshold for good status is considered to be achieved when the moving parr density average (average of last three years) remains above 50% of the reference parr density (Figure 2). It should be noted that only rivers accessible to spawners and containing suitable spawning habitats are evaluated.
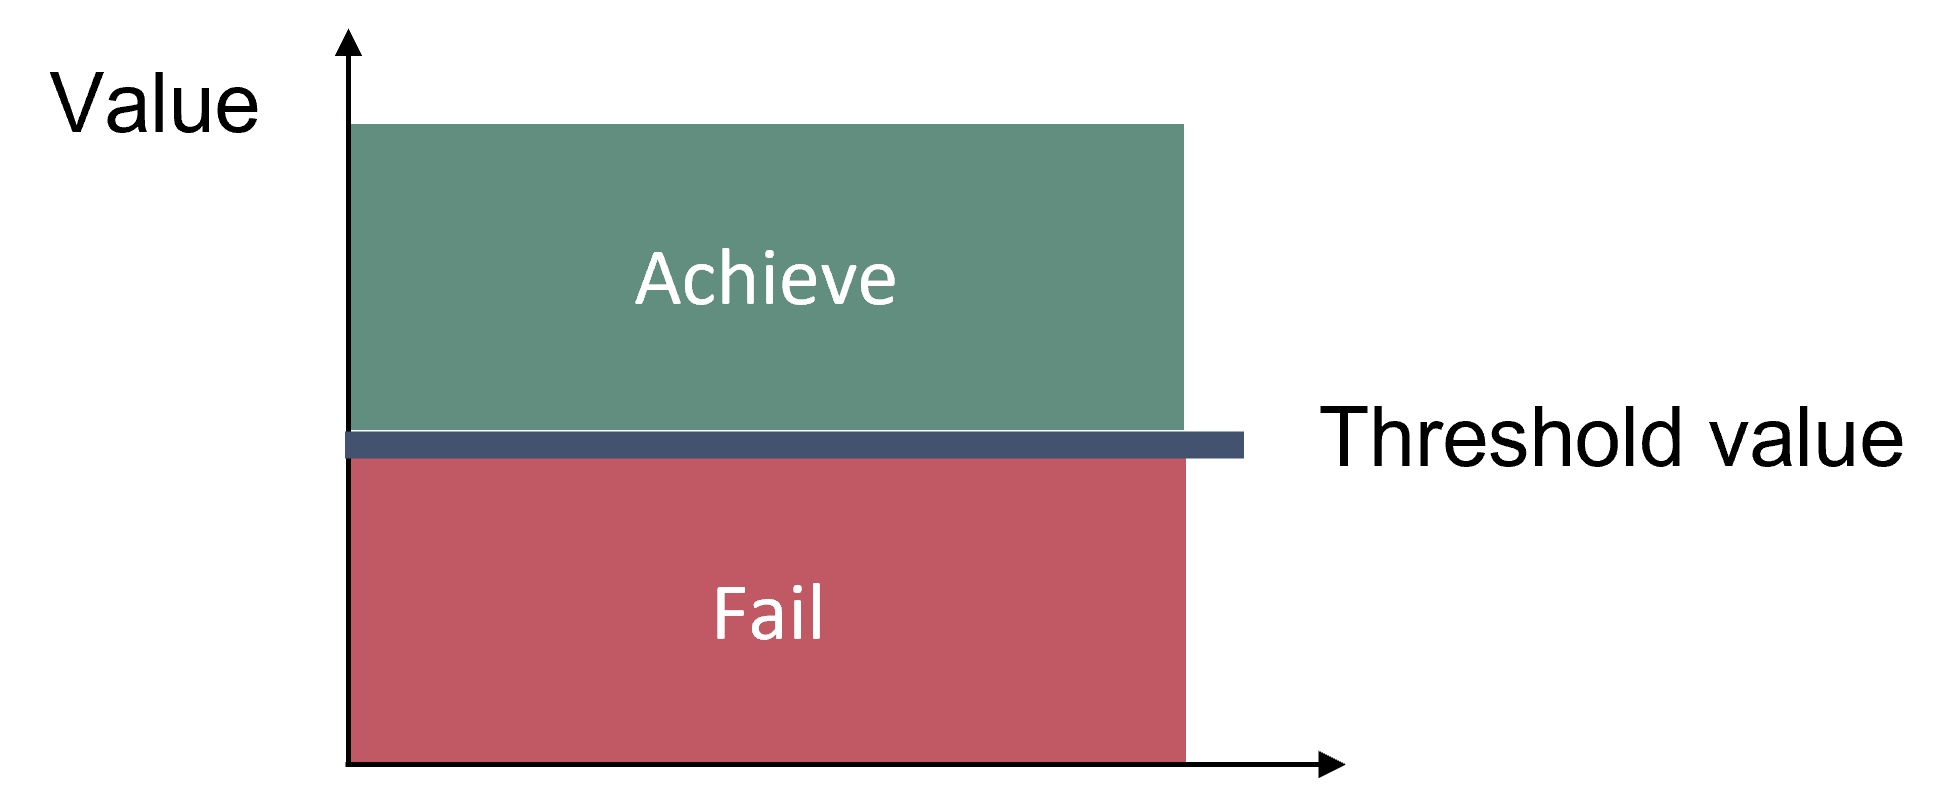
Figure 2. Reference parr densities are determined either through model estimations based on actual reference data or expert judgment. Good status is achieved if the site-specific moving parr density average remains above 50% of the site-specific reference potential parr density.
Table 2. Threshold value used in the indicator evaluation.
| HELCOM Assessment unit name | Threshold value (% of potential parr density) |
| All assessment units | 50% |
3.1. Setting the threshold value(s)
The reference potential parr densities are estimated for each river by a rigid Baltic evaluation model that takes into account the physical characteristics of the river habitat (see e.g. ICES 2015). For the northern rivers, the Baltic assessment model indicates that the status of populations are poor, which is in accordance with other data, however, there is still some uncertainty as to the precision of the model in this area. The uncertainty is due to the quality of the background data that do not include full production level conditions and since natural conditions differ significantly from other parts of the Baltic Sea, implying that the production levels from the southern areas cannot be used as reference values in the northern areas. Rivers in the northern areas are presumed to have a naturally lower overall productivity due to lower temperatures and other environmental factors. In these areas, the maximum potential parr densities have been provided by expert evaluations. Currently, a list of river specific reference values is not available. The threshold values have mainly been defined based on expert judgement and long-term data on reference conditions. The confidence of the threshold values is moderate to high.
4. Results and discussion
The results of the indicator evaluation that underlies the key message map and information are provided below.
4.1. Status evaluation
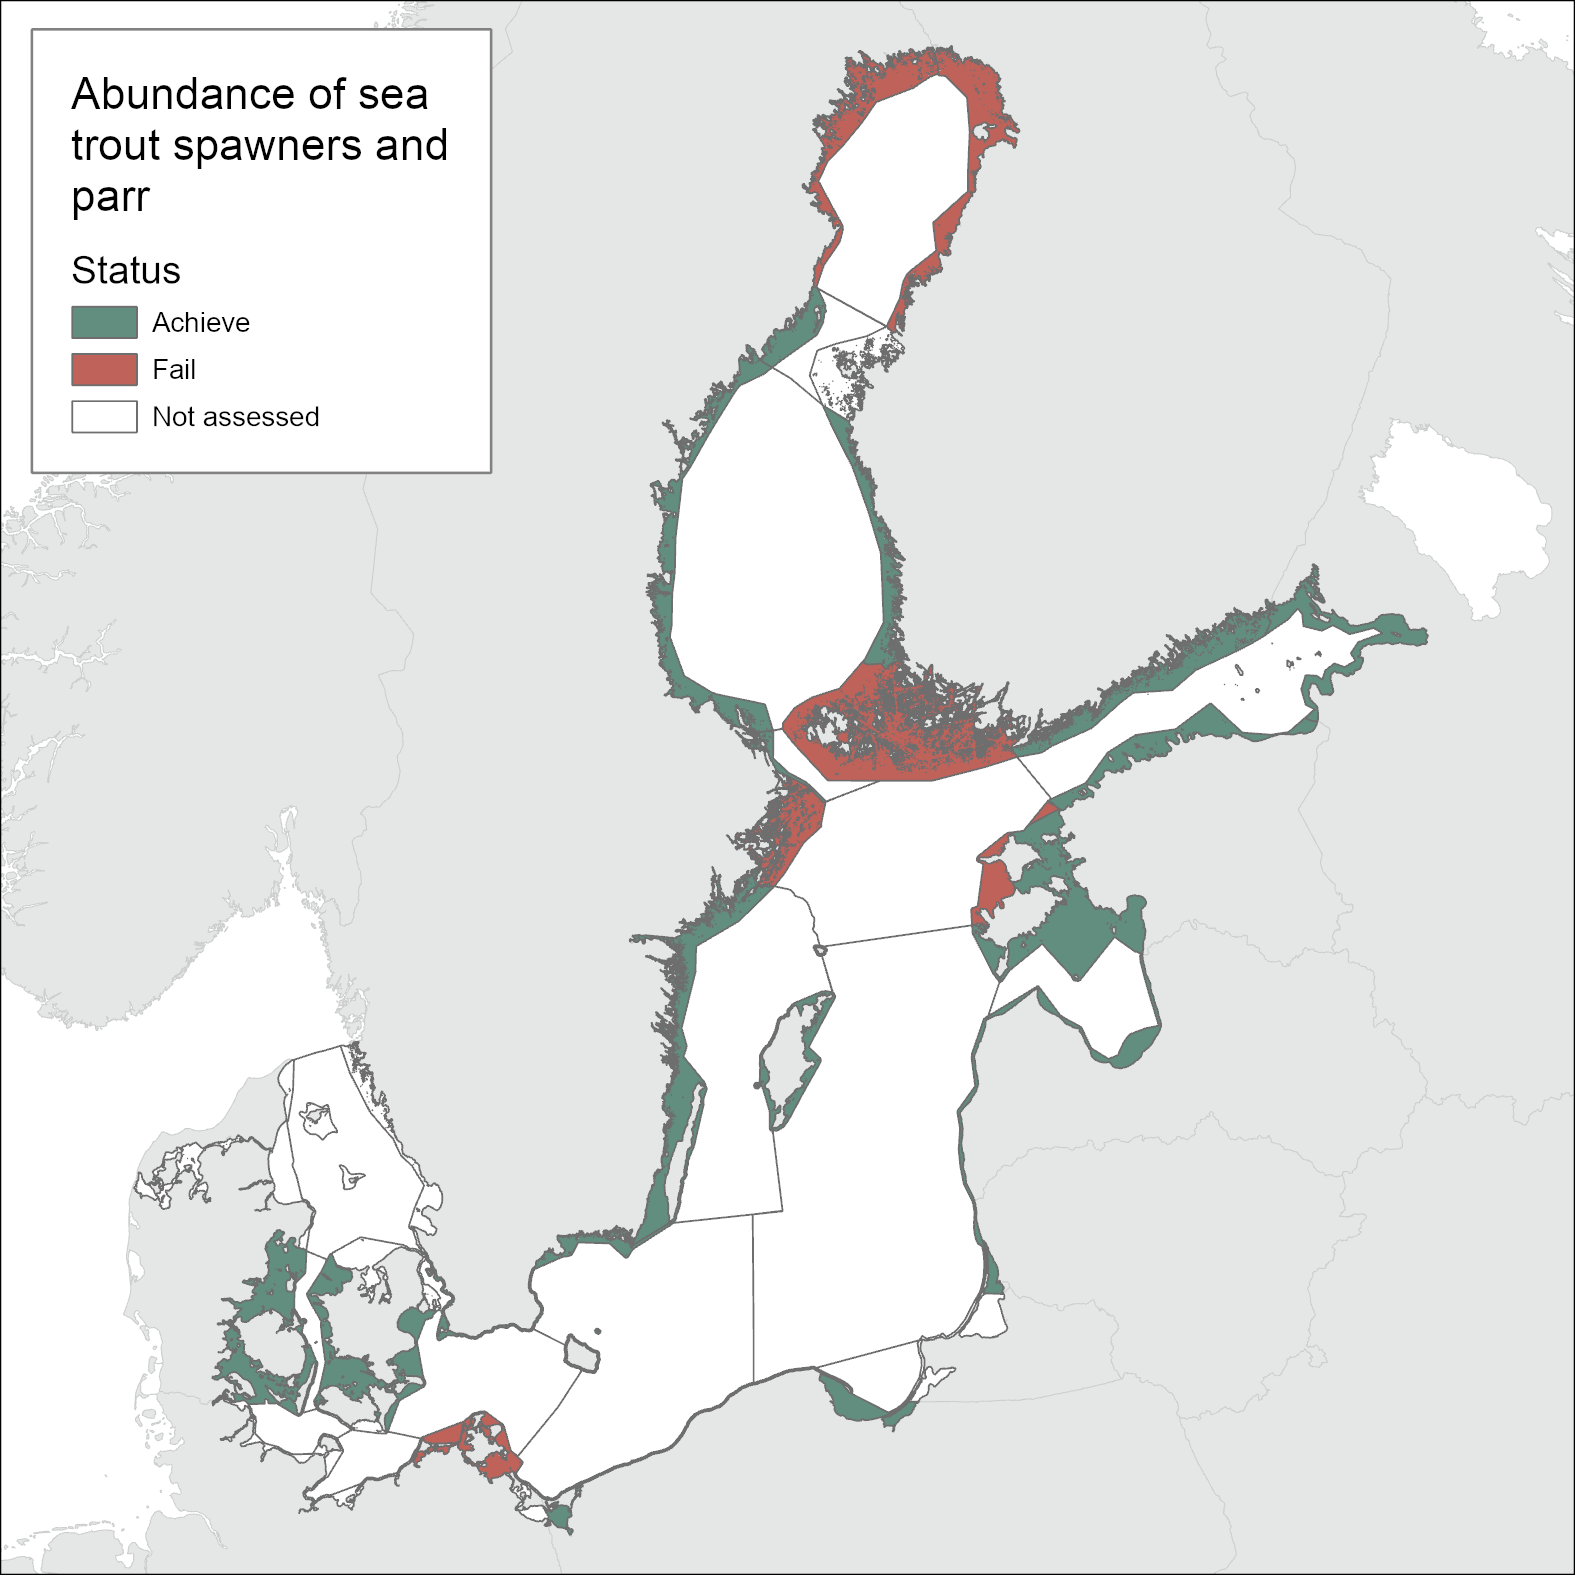
According to the current evaluation, coastal areas failing to achieve GES in this evaluation are in the Bothnian Bay, Archipelago Sea, Gulf of Riga, Northern Baltic Proper and Arkona Basin. In all other areasgood status is achieved, or the areas are not assessed. (Figure 1).
Current status and trends of the Baltic sea trout
Of the 691 sea trout river populations, 157 were evaluated as having good ecological status (GES), meanwhile 178 were evaluated as sub-GES. In 356 rivers population status was uncertain or not evaluated at all. The present status of sea trout populations is alarming in some assessment areas, where only few wild and mixed sea trout river populations had estimated smolt production above the 50% threshold (partial update in ICES 2021).
A positive development in parr densities since 2016 has been observed in some rivers in Finland (Gulf of Finland and Bothnian Sea), Estonia (Gulf of Finland) and Sweden (Bothnian Sea), reflecting management improvements in these countries.
The ICES Baltic Salmon and Trout Assessment Working Group (ICES WGBAST) has evaluated the status of sea trout populations for 2020 (ICES 2021). The status of populations in the Main Basin (all sub-basins south of the Gulf of Bothnia and Gulf of Finland) is known for 219 rivers with wild populations and unknown for 257 rivers. The status of 133 populations (wild and mixed populations, including tributaries in large systems) is not good (below 50% of the potential smolt production). In some areas in the Baltic Proper a decline of parr densities has been observed, although the densities are still above GES threshold.
In Sweden, densities of parr in rivers entering The Sound, Arkona Basin and Bornholm Basin (ICES SD 23–25) have remained above GES threshold and in the Western Gotland Basin (SD28) they decreased during the 2016-2020 assessment period. In the Gulf of Bothnia (ICES SD 30, 31) the densities have increased during the same period, but in the Bothnian Bay (SD 31) the densities are still very low.
In Estonia, parr densities in rivers entering the Gulf of Finland, Northern Baltic Proper and Gulf of Riga have increased since 2001 and are above GES threshold in all rivers that have good or very good habitat quality. However, the Northern Baltic Proper stocks on the islands of Saaremaa and Hiiumaa are atsub-GES.
In Finland, parr densities in the Bothnian Bay have been far below the reference production level in all rivers for several decades. In the Gulf of Finland, parr densities have increased, but the annual variance is high. There have been improvements in the state of the stock in several rivers in recent years, probably as a result of implementation of new management measures. In Finland, however, the monitoring of sea trout stock status is focused on the rivers where habitat restoration actions (removal of migration obstacles, spawning and rearing habitat improvements, etc,) have taken place. In other words, the areal coverage of the monitoring data is partly skewed.
In the Russian part of the Gulf of Finland, parr densities are estimated to be at or just above the GES threshold.
In Latvia, the rivers Salaca, Gauja and Venta are the three most important sea trout rivers for wild smolt production. The average parr density of all Latvian rivers has been below optimal in 2016-2019, but abundance improvedin 2020.
In Lithuania, spawning rivers reflect good status even though the average density of parr has fluctuated in the last years. The main reasons for the fluctuation are high fishing pressure in the sea and coastal fishery as well as illegal fishing in rivers during spawning migration and during the spawning period. Most sea trouts are caught in coastal areas as by-catch by gillnets targeting other species.
In Poland, only one stream with a wild sea trout stocks exists (16 mixed and 8 reared stocks). The stock status in this stream is considered to be at GES.The average densities of 0+ parr in other SD 26 rivers have been generally high but variable, with densities of up to more than 90 individuals per 100m2 in some years. After four years (2013–2016) with high (70–90) and stable densities, the average 0+ density has recently dropped to the level of 30–50. The main causes for low parr densities in some sea trout stocks are the lack of suitable spawning habitats due to dams, water discharge times, and gravel extractions. However, poaching, by-catch of smolts in the coastal herring fishery, and diseases also negatively affect the stocks.
In Germany, nine rivers with natural reproduction exist (eight of them initiated with stocking). The densities of parr have increased during the last 15 years. Missing habitat score data prevented the estimation of stock status in these rivers, but based on the available data, the status of the stocks is probably mostly sub-GES.
In Denmark, , the wild sea trout smolt production in the Baltic area has increased considerably during the last two decades and the status of stocks is estimated to be in GES.
For more information about the state of sea trout stocks, see ICES 2021, HELCOM 2011 and Pedersen et al. 2012.
4.2. Trends
Number of sea trout spawners
The number of ascending sea trout spawners is followed only in a few large rivers. Five Swedish rivers in the Bothnian Sea and Bothnian Bay have automatic or manual counting. According to Pedersen et al. (2012) the number of spawners in these rivers were too low to populate all available habitats. In River Piteälven the number has increased continuously, and for some years there was also an increase in Kalixälven, Vindelälven and Byskeälven (see Figure 3). The increase in the River Piteälven is likely due to the closing of salmon traps in the river estuary. In general, the number of spawners has been increasing in the last 10-15 years.
Figure 3. Abundance of sea trout spawners in five Swedish rivers. Source: ICES 2021.
Even though the number of spawners increased in River Piteälven during the period 2001–2012, the number of spawners observed entering rivers in northern Sweden is still low, especially taking into account the size of the rivers. This is likely due to both low recruitment and elevated mortalities at sea. In addition, anglers’ catch, which to some extent indicates the number of spawners, does not suggest any increase in the number of spawners in this area either.
4.3. Discussion text
In general, the stock status has improved to GES in 10 coastal water areas from the Bornholm Basin up to the Quark. This is a result of stricter management measures (fishing bans, protected areas and technical measures), removal of migration obstacles and restoration of river habitats. At the same time seven coastal water areas have failed to reach a good status. It’s worth noting that only in one area deterioration in status from the previous evaluation has been observed.
In 10 coastal water areas the evaluation result was uncertain mainly because of shortcomings in temporal and spatial coverage of data. Data was missing from four coastal water areas in this evaluation (no electrofishing sites in the area or data has not been provided).
Table 3. Overview of status and comparison between current and previous assessment period.
| HELCOM Assessment unit name | Threshold value achieved/failed – HOLAS II | Threshold value achieved/failed – HOLAS 3 | Distinct trend between current and previous evaluation. | Description of outcomes, if pertinent. |
| Bothnian Bay Finnish Coastal waters | Failed | Failed | Stable. No change in status is recorded and GES is failed in both assessment periods due to low densities, these remain well below the threshold value. | GES is not achieved as densities remain very low. |
| Bothnian Bay Swedish Coastal waters | Failed | Failed | Stable. No change in status is recorded and GES is failed in both assessment periods due to low densities, though increased densities are detected. | GES is not achieved as densities remain very low. |
| The Quark Finnish Coastal waters | Failed | NA | NA | No electrofishing data available to carry out evaluation. |
| The Quark Swedish Coastal waters | Failed | Achieved | Improvement. Increased densities have been recorded in the current assessment period resulting in an improved status evaluation. | GES is achieved as the moving parr density average remains above 50% of the reference parr density. |
| Bothnian Sea Finnish Coastal waters | Failed | Achieved | Improvement, with GES achieved in the current assessment period, likely due to new management measures. | GES is achieved as the moving parr density average is evaluated to be above 50% of the reference parr density, though uncertainty remains as data quality prevents full evaluation against a reference. |
| Bothnian Sea Swedish Coastal waters | Failed | Achieved | Improvement, with GES achieved in the current assessment period due to increased densities. | GES is achieved as the moving parr density average remains above 50% of the reference parr density. |
| Åland Sea Swedish Coastal waters | Achieved | Achieved | Improvement, with GES achieved in the current assessment period due to increased densities. | GES is achieved as the moving parr density average remains above 50% of the reference parr density. |
| Åland Sea – Archipelago Sea Finnish Coastal waters | Failed | Failed | Stable, GES not achieved in either assessment period. | GES is not achieved as the moving parr density average remains below 50% of the reference parr density. |
| Northern Baltic Proper Swedish Coastal waters | Achieved | Failed | Deterioration. GES was not achieved in the current assessment period. | GES is not achieved as the moving parr density average fell below 50% of the reference parr density in this evaluation. |
| Northern Baltic Proper Estonian Coastal waters | Failed | Failed | Stable. No change in status detected between assessment periods (GES not achieved) but increasing densities have been detected in the current period (though some stocks remain very low). | GES is not achieved as the moving parr density average remains below 50% of the reference parr density. |
| Gulf of Finland Finnish Coastal waters | Failed | Achieved | Improvement, with GES achieved in the current assessment period. Increased densities have been detected, though variation remain high between years, likely due to new management measures. | GES is achieved as the moving parr density average remains above 50% of the reference parr density. |
| Gulf of Finland Estonian Coastal waters | Achieved | Achieved | Stable. No change in status detected between assessment periods (GES achieved) and increasing densities have been detected in the current period. | GES is achieved as the moving parr density average remains above 50% of the reference parr density. |
| Gulf of Finland Russian Coastal waters | Failed | Achieved | Improvement, with GES achieved in the current assessment period. Densities are estimated to be at or just above the threshold value. | GES is achieved as the moving parr density average is evaluated to be above 50% of the reference parr density, though uncertainty remains as data quality prevents full evaluation against a reference. |
| Gulf of Riga Estonian Coastal waters | Achieved | Achieved | Stable. No change in status detected between assessment periods (GES achieved) and increasing densities have been detected in the current period. | GES is achieved as the moving parr density average remains above 50% of the reference parr density. |
| Gulf of Riga Latvian Coastal waters | Achieved | Achieved | Stable, with GES achieved in both assessment periods. Densities indicate an increase during 2020, though data uncertainties remain. | GES is achieved as the moving parr density average is evaluated to be above 50% of the reference parr density, though uncertainty remains as data quality prevents full evaluation against a reference. |
| Western Gotland Basin Swedish Coastal waters | Achieved | Achieved | Stable. No change in status is recorded with GES achieved in both assessment periods, though decreasing densities were detected in the current period. | GES is achieved as the moving parr density average remains above 50% of the reference parr density. |
| Eastern Gotland Basin Estonian Coastal waters | Failed | Achieved | Improvement, with GES achieved in the current assessment period. | GES is achieved as the moving parr density average is evaluated to be above 50% of the reference parr density, though uncertainty remains as data quality prevents full evaluation against a reference. |
| Eastern Gotland Basin Latvian Coastal waters | Achieved | Achieved | Stable, Good status achieved in both assessment periods. | GES is achieved as the moving parr density average remains above 50% of the reference parr density. |
| Eastern Gotland Basin Lithuanian Coastal waters | Failed | Achieved | Improvement, with GES achieved in this assessment period. Fluctuations within the evaluation are high, likely due to fishing pressure and other factors, and data uncertainties exist. | GES is achieved as the moving parr density average is evaluated to be above 50% of the reference parr density, though uncertainty remains as data quality prevents full evaluation against a reference. |
| Eastern Gotland Basin Swedish Coastal waters | Achieved | Achieved | Stable. GES achieved in both assessment periods. | GES is achieved as the moving parr density average remains above 50% of the reference parr density. |
| Eastern Gotland Basin Polish Coastal waters | Failed | Achieved | Improvement, with GES achieved in this assessment period. Data uncertainties remain and variation is high in the data set. Some rivers still encounter pressures such as suitable spawning habitats due to dams, water discharge times and gravel extractions. | GES is achieved as the moving parr density average is evaluated to be above 50% of the reference parr density, though uncertainty remains as data quality prevents full evaluation against a reference. |
| Gdansk Basin Polish Coastal waters | Failed | Achieved | improvement, with GES achieved in this assessment period. Data uncertainties remain and variation is high in the data set. Some rivers still encounter pressures such as suitable spawning habitats due to dams, water discharge times and gravel extractions. | GES is achieved as the moving parr density average is evaluated to be above 50% of the reference parr density, though uncertainty remains as data quality prevents full evaluation against a reference. |
| Bornholm Basin Swedish Coastal waters | Achieved | Achieved | Stable. GES achieved in both assessment periods. | GES is achieved as the moving parr density average is evaluated to be above 50% of the reference parr density, though uncertainty remains as data quality prevents full evaluation against a reference. |
| Bornholm Basin Polish Coastal waters | Achieved | Achieved | Stable, Good status achieved in both assessment periods. | GES is achieved as the moving parr density average remains above 50% of the reference parr density. |
| Bornholm Basin Danish Coastal waters | Achieved | Achieved | Stable, GES is achieved in both assessment periods. Increased densities recorded in recent years, though certain barriers and detrimental conditions do remain in some streams. | GES is achieved as the moving parr density average remains above 50% of the reference parr density. |
| Arkona Basin Swedish Coastal waters | Achieved | Achieved | Stable, Good status achieved in both assessment periods. | GES is achieved as the moving parr density average remains above 50% of the reference parr density. |
| Arkona Basin Danish Coastal waters | Achieved | Achieved | Stable, GES is achieved in both assessment periods. Increased densities recorded in recent years, though certain barriers and detrimental conditions do remain in some streams. | GES is achieved as the moving parr density average remains above 50% of the reference parr density. |
| Belts Danish Coastal waters | Achieved | Achieved | Stable, GES is achieved in both assessment periods. Increased densities recorded in recent years, though certain barriers and detrimental conditions do remain in some streams. | GES is achieved as the moving parr density average remains above 50% of the reference parr density. |
| The Sound Swedish Coastal waters | Achieved | NA | NA | NA |
| The Sound Danish Coastal waters | Achieved | NA | NA | NA |
| Arkona Basin German Coastal waters | NA | Failed | Stable. Increasing densities are considered relevant, though GES is not achieved, but the lack of needed habitat information prevent a full evaluation. | GES is achieved as the moving parr density average is evaluated to be above 50% of the reference parr density, though uncertainty remains as data quality prevents full evaluation against a reference. |
| Bay of Mecklerburg German Coastal waters | NA | Failed | Stable. Increasing densities are considered relevant, though GES is not achieved, but the lack of needed habitat information prevent a full evaluation. | GES is achieved as the moving parr density average is evaluated to be above 50% of the reference parr density, though uncertainty remains as data quality prevents full evaluation against a reference. |
5 Confidence
The estimation of the reference parr density is made using the assessment model in the southern Baltic Sea and based on expert evaluation in the northern Baltic Sea. Both methods are considered to give an accurate enough estimation on the potential maximum parr density to allow for the evaluation of the stock status. Hence, there is no significant regional difference in the confidence of indicator status when it comes to the reference densities.
A counterpart for the reference densities in status criteria is planned to be based on the 4−5 year moving average of parr densities. In some areas (e.g. in Denmark) there are too many rivers to be surveyed annually with available resources. However, most of the rivers are still surveyed at regular intervals and in these a different calculation for the average parr densities can be used. This does not decrease the level of confidence in the evaluation of the state of the stock.
The level of confidence of the evaluation is moderate to high.
6 Drivers, Activities, and Pressures
Drivers are often large and diffuse factors that are hard to quantify, for example aspects related to political will, consumer trends or globalisation. However, these relate to changes in activities and thus pressures that have relevance to the status of the marine environment.
Sea trout abundance is affected by commercial and recreational fishing at sea and in rivers. The abundance of spawners returning from feeding migrations in the coastal areas to the rivers is related to the densities of parr in the rivers. The density of sea trout parr also reflects the success of recruitment and depends on other factors such as climate, the size of the river, habitat characteristics and quality and is affected by migration barriers to reproduction areas. This indicator reflects the state of the ecosystem as it is sensitive to river connectivity (effect of dams) and the quality of spawning and rearing habitats.
The main reason for the not good status of sea trout populations in the northern areas of the Baltic Sea is high fishing pressure, particularly by-catch of post smolts in the gillnet fishery. In the Bothnian Bay, Bothnian Sea and the Gulf of Finland young age classes of sea trout are also by-caught in sea fisheries targeting other species, often whitefish. In the Gulf of Finland, the by-catch occurs mainly in gillnets targeting pikeperch. Sea trout is also reported as being by-catch along the Swedish coast in the Bothnian Sea and Bothnian Bay in the commercial coastal salmon trapnet fishery.
The total reported commercial sea trout catch in the Baltic Sea marine area in 2020 was 148 tonnes, which was the smallest catch during 2001-2020 (ICES 2021). Before 2019, however, the ICES catch data included also during some years substantial amounts of suspected misreported salmon catches. The total estimated recreational catch in marine and river areas was about 656 tonnes in 2020 (partial estimate). Most of the catch was caught by the coastal fishery, from the Gulf of Bothnia and the Main Basin (Baltic Proper). The larger part of recreational catch is only known with much uncertainty and in most countries, data are not collected annually. The Swedish and Finnish offshore fishery targeting salmon and sea trout in the Baltic Proper was phased out in 2013. Some trends in catches are provided for core areas in Figure 4.
The estimated sea trout river catch in 2020 was about three tonnes. The largest amount of this catch was reported from Swedish rivers flowing to the Gulf of Bothnia (24 tonnes, mainly as anglers’ catch).
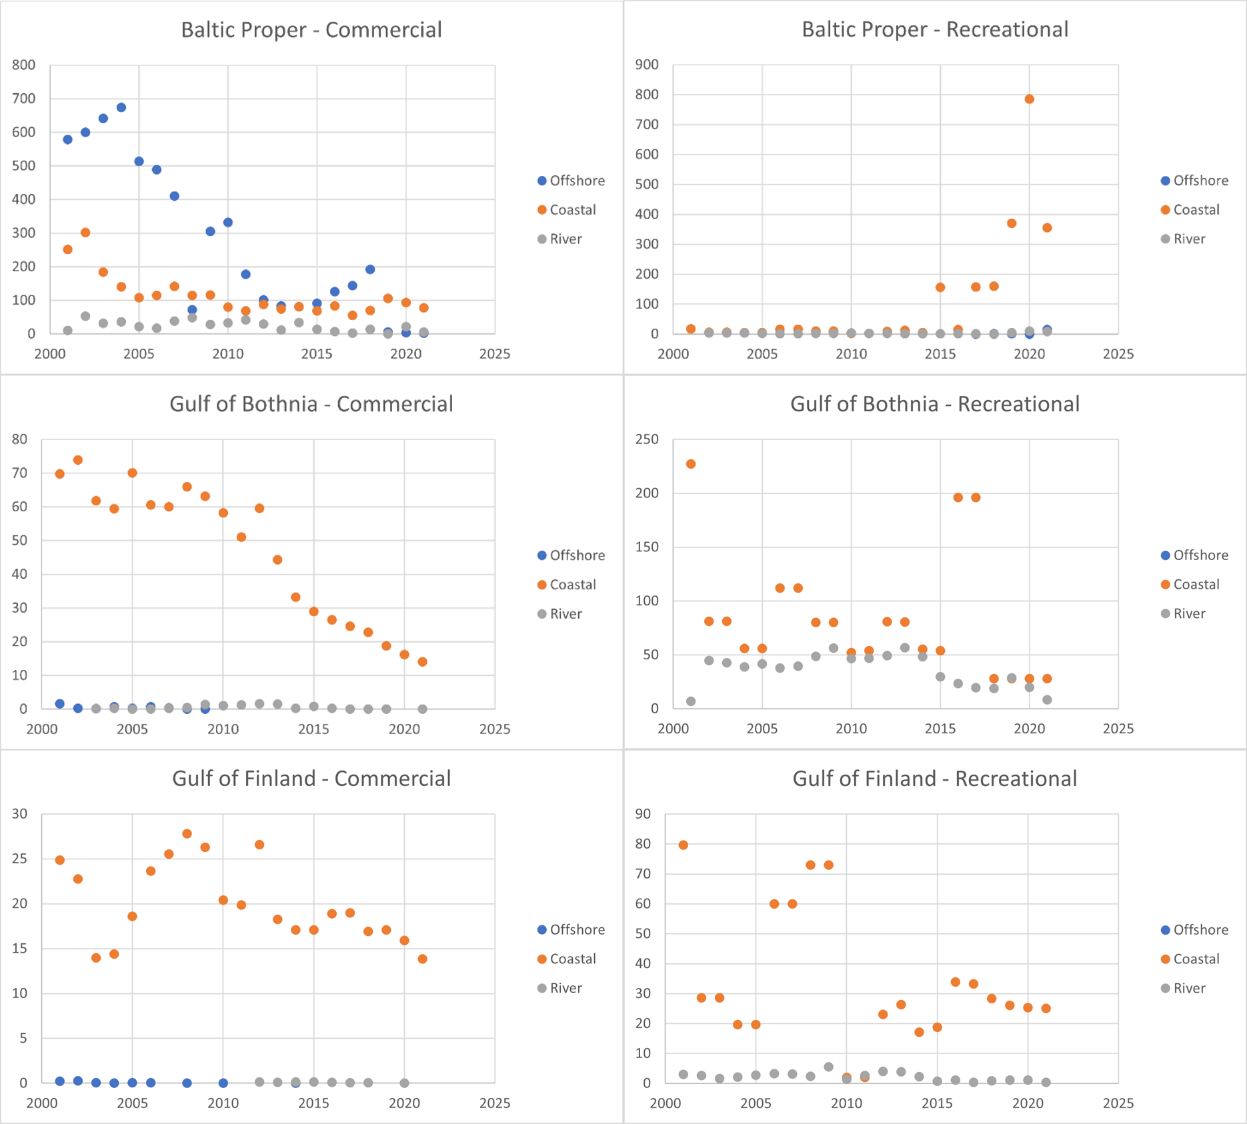
Figure 4. Fishery catches (tonnes) of sea trout in Main Basin (Baltic Proper), Gulf of Bothnia and Gulf of Finland. Data are provided for commercial (left) and recreational (right) catches separately. Note that commercial sea catches in the Baltic Proper also include varying amounts of misreported salmon catches. In addition, recreational catches have been reported only by some of the countries and years. In general, the estimates of recreational catches are very uncertain because of survey methodological reasons (ICES 2021). Note the large difference is scales between areas and between commercial and recreational catches.
In addition to the effects of fisheries on sea trout, the deterioration of habitat quality and damming of rivers affect the populations. Channelizing of rivers has altered the spawning habitats which decreases the number of spawners (ICES 2009). Also dredging, pollution, acidification and siltation of rivers have negative effects on sea trout populations. The magnitude of the different factors influencing sea trout varies locally within a sub-basin.
Predation by cormorants influences the abundance of sea trout both locally and in larger areas (Dieperink et al. 2001; 2002). The effect of predation can be severe in rivers, at river mouths and in coastal areas (Jepsen et al 2014, 2019). An increase in the population size of cormorants has been observed in many countries and the sea trout stock size may have decreased in areas where large cormorant colonies are present, although this needs further investigation (Bzoma 2004; Leopold et al. 1998).
In Denmark predation by harbour seal (Phoca vitulina) and in Poland by grey seal (Halichoerus grypus) is also an increasing pressure.
Sea trout rivers and brooks are also in the focus of EU WFD and all actions improving the habitat quality of these watersheds will also benefit the sea trout stocks. Quality improvement of the spawning and rearing habitats will also positively affect the potential river production capacities.
Table 4. Brief summary of relevant pressures and activities with relevance to the indicator.
| | General | MSFD Annex III, Table 2a |
| Strong link | Fishing of sea trout as well as habitat quality degradation are the main pressures on sea trout. | Biological disturbance
selective extraction of species. |
| Weak link |
7. Climate change and other factors
Several direct climate change effects, such as water temperature, sea ice changes, salinity and salt water inflows, and river run off are anticipated to have impacts on migratory fish populations and status (HELCOM and Baltic Earth, 2021). These direct parameters will also impact other factors that may result in indirect effects on migratory fish, for example via alterations in benthic habitats, changes in marine mammal populations or behaviour, success of Marine Protected Areas (MPAs), and changes in ecosystem function. In addition, resulting changes in human activities related to aquaculture, offshore wind farm development (or other energy requirements e.g. hydropower), as well as fisheries effort and practices may all alter pressures on migratory fish populations.
Migratory anadromous species, like sea trout, return earlier to rivers after warm winter/spring. However, high water temperature in autumn and winter seems to lower the survival of salmon migrating back to the sea. Studies also indicate that reproduction of autumn-spawning migratory fish is expected to decrease with increasing temperatures, and spawning areas reduced if ice cover decreases further. The effects of some expected climate induced changes, e.g., shrinking ice cover and browner waters, on coastal and migratory fish stocks are poorly studied(HELCOM and Baltic Earth, 2021), but it is possible that for such pressures for example terrestrial run off and increased discharges may have similar effects as those expected for coastal fish
8. Conclusions
8.1. Future work or improvements needed
It is not possible to monitor all sea trout rivers and brooks around the Baltic Sea. It is recommended that monitoring of sea trout is carried on the main stocks and expanded to stocks which are poorly known.
Some of the sea trout parr monitoring is carried out in connection with monitoring on salmon populations, which results in less precise estimates of sea trout recruitment because of differences in habitats used by the two species. More electrofishing sites should be established in smaller rivers and streams, e.g. tributaries of salmon rivers, to ensure sufficient coverage of monitoring of sea trout nursery areas.
Sea trout rivers and brooks are also within the focus of EU Water Framework Directive (WFD). Regular monitoring of selected rivers, and additionally more rigorous inventories at 5−10 year intervals, would fit as a part of national WFD programmes.
9. Methodology
The Baltic assessment model provides an estimate of the sea trout recruitment level (The Recruitment Status), which is defined as the observed recruitment (i.e. observed densities) compared to the potential reference recruitment (i.e. maximal densities that could be expected under the given habitat conditions). The model uses electrofishing data of the individual sea trout populations, together with habitat information collected at the same sites, to calculate the trend in population development over time. The examination of the data is site-specific (several sites can be placed in one river) but the evaluation of the state of the stock can be concluded on the river and also sub-area level . Average values of the Recruitment Status are calculated for assessment areas, sub-divisions, and, where more countries have streams in one sub-division, for each individual country (ICES 2011; ICES 2017).
At the annual meetings of the ICES WGBAST, all available data from the Baltic countries on measured densities of sea trout parr (per 100 m2) from individual sites are compiled. In 2020, data was available from a total of about 800 sites in about 270 streams, which reflects the general situation of data availability. For the evaluation, parr abundance are divided into young of the year (0+) and older trout (>0+). Only densities of 0+ trout are used in the evaluation.
Differences in habitat qualities (e.g. suitability for trout) influence trout abundance. To be able to compare trout abundances between sites with different habitat quality, a sub-model is used: the Trout Habitat Score (THS). The THS is calculated by first assigning values (scores) for each habitat parameter for 0+ trout: average/dominating depth, water velocity, dominating substrate, stream wetted width, slope (where available) and shade. Values (scores) are assigned between 0 (for sites with poor conditions) and 2 (for best conditions) by using suitability curves and partly by expert judgement (ICES 2011). All scores are then summed, resulting in a THS between 0 (zero) for sites with very poor conditions and 12 (10 if slope is omitted) for sites with very good conditions for sea trout parr. The THS scores obtained are then combined into Habitat Classes (HC) that range between 0 (poorest) and 3 (best).
Due to the significant climatic (e.g. temperature and precipitation) and geological differences across the Baltic Sea region, the densities of sea trout parr vary between areas. The predicted reference potential densities for sites across the Baltic at full recruitment are determined through a multiple linear regression analysis using the following parameters: stream wetted width, climate (average air temperature), latitude (proxy for productivity due to climate), longitude (proxy for the gradient from oceanic to continental climate) and the habitat score (0-1-2-3; see ICES 2011) with log (0+ trout density + 1) as dependent variable. For this analysis, only sites with the best quality and highest observed densities are used.
Sites judged to have good to intermediate water quality (a prerequisite for trout to fulfil their life cycle) are selected for evaluation, irrespective of the habitat quality class (HC) of the site.
Recruitment trend over time is calculated for each site through linear regression of parr density versus years (for the last evaluation the time period was 2016−2020).
In addition to parr density data, evaluations of status can be supported by direct counts of ascending spawners in some rivers. This is possible by the means of video counting which distinguishes between sea trout and salmon. Smolt counting is also carried out in a couple of rivers. Both spawner and smolt counting data provide complementary input to the estimation of stock status based on the parr densities. However, electrofishing survey monitoring, which measures the parr densities, provides the primary data used for evaluating sea trout stock status in the Baltic Sea area.
The methodology and basis of the indicator evaluation is provided below.
9.1. Scale of assessment
Since all the Baltic sub-basins have naturally reproducing stocks of sea trout, this indicator is relevant in the entire Baltic Sea. Sea trout migrate between freshwater river systems and the marine area, mainly feeding within <100 km from their home river. The assessment units most applicable for evaluating sea trout status are therefore the coastal assessment units.
While it appears that most sea trout populations only migrate relatively short distances for feeding (a few hundred kilometres), it is known that in all sea areas populations with long migration patterns where the sea trout spread into neighbouring coastal areas exist. For example, fish tagged in the Finnish part of the Gulf of Finland are found in Estonia and Russia (and vice versa), and similarly, fish tagged in the Finnish side of Gulf of Bothnia are found in Sweden (and vice versa). According to previous work by SGBALANST (ICES 2008, 2009), the sea trout populations in the Bothnian Sea, Bothnian Bay and Gulf of Finland (ICES sub-divisions 30, 31 and 32) have been pointed out as highly separated units with respect to state of the stock and migration patterns.
For the purposes of this HELCOM core indicator on sea trout spawners and parr, the environmental status is assessed for coastal areas using HELCOM assessment unit scale 3. Some sub-basins may be combined for evaluations at a later stage, if necessary, when more information on the the migration patterns of the sea trout populations is attained.
The assessment units are defined in the HELCOM Monitoring and Assessment Strategy Annex 4.
9.2. Methodology applied
The indicator utilises data generated via the ICES WGBAST group and the methodologies to generate this data are provided in the regular reports, for example: ICES (2021) Baltic Salmon and Trout Assessment Working Group (WGBAST). ICES Scientific Reports. 3:26. 329 pp. https://doi.org/10.17895/ices.pub.7925.
9.3. Monitoring and reporting requirements
Monitoring methodology
Monitoring practices for sea trout spawners and parr are described on a general level in the HELCOM Monitoring Manual in the Sub-programme: Migratory fish.
Specific guidelines are under development.
Current monitoring
The monitoring activities relevant to the indicator which are currently carried out by HELCOM Contracting Parties are described in the HELCOM Monitoring Manual in the Monitoring Concepts table.
Sub-programme: Migratory fish
The intensity and period during which monitoring has been carried out varies between countries (ICES 2008). Some countries started monitoring only in recent years, whereas very long data series exist for a few streams.
Sea trout is monitored by all Baltic Sea coastal countries by electrofishing for parr in the natal streams, giving a good index measure of recruitment. Parr densities are measured by regular electrofishing surveys in early autumn (August-September). One river can be surveyed annually or at 2−7 year intervals. Electrofishing usually takes place at fixed sites to allow for comparison of the densities between years. There are usually several electrofishing sites in one river.
In a couple of countries sampling of parr densities is used to calculate the smolt production by a relation of parr to smolt survival either developed in the same stream or in different streams (ICES 2008). In most countries (not in Denmark or Poland) this is supplemented with monitoring of smolt escapement by trapping and counting smolt numbers in one or more streams. In total, smolt production estimates exist for nine rivers in the entire Baltic area, but the time series are not complete for all years.
In only one river (Åvaån in Sweden) the number of spawners is monitored by trapping and inspection of the ascending sea trout. In Lithuania, the spawning run is estimated by test fishing in a couple of rivers. In nine rivers (eight in Sweden, one in Poland) the number of spawners is monitored by automatic fish counters. In these counters, the species can be determined, but it is not always possible to determine the exact size, sex, etc.. In three rivers, the total run of salmonids is determined with an echo sounder, however this technique does differentiate between sea trout and salmon.
An indication of spawning intensity by count of redds is, or has been, collected from several streams in Poland, Lithuania and Denmark (ICES 2008). In a couple of streams in Denmark the catch in sports fisheries has also been used to estimate the development in the spawning run. Catch numbers from sports fishery in rivers are available also for some Swedish rivers.
Tagging and marking are used as methods to obtain quantitative and qualitative information on trout populations.
10. Data
The data and resulting data products (e.g. tables, figures and maps) available on the indicator web page can be used freely given that it is used appropriately and the source is cited.
Result: Abundance of sea trout spawners and parr
In total, data was available from about 800 sites in about 270 streams and rivers for the time period 2018−2020. ICES sub-divisions 21 to 32 are represented. At least ten sites are included from each of the ICES sub-divisions 25, 27, 30, 31 and 32.
Due to continuous concerns about the state and information available on sea trout in the Baltic Sea, a Study Group on Data Requirements and Assessment Needs for Baltic Sea Trout (SGBALANST) was established by ICES to work for a period of two years to identify a common classification system of habitats between countries (ICES 2011).
11. Contributors
ICES Working Group for Baltic Salmon and Sea trout (WGBAST), and results of the HELCOM SALAR project.
12. Archive
This version of the HELCOM core indicator report was published in April 2023:
The current version of this indicator (including as a PDF) can be found on the HELCOM indicator web page.
Older versions of the indicator report are available:
Abundance of sea trout spawners and parr HELCOM core indicator 2018 (pdf)
Core indicator report – web-based version October 2015 (pdf)
Extended core indicator report – outcome of CORESET II project (pdf)
13. References
Bzoma, S. (2004) Cormorant in the throphic structure and ecosystem of Gulf of Gdansk (Kormoran Phalacrocorax carbo (L.) w strukturze troficznej ekosystemu Zatoki Gdańskiej). PhD Thesis. Praca doktorska (maszynopis) w Kat. Ekol. i Zool. Kręgowców, Uniwersytet Gdański, Gdynia.
Dieperink, C., Pedersen, S., Pedersen, M.I. (2001) Estuarine predation on radiotagged wild and omesticated sea trout (Salmo trutta L.) smolts. Ecology of Freshwater Fish 10: 177-183.
Dieperink, C., Bak, B.D., Pedersen, L.-F., Pedersen, M.I., Pedersen, S. (2002) Predation on Atlantic salmon and sea trout during their first days as postsmolts. Journal of Fish Biology 61: 848-852.
European Commission (2008) Directive 2008/56/EC of the European Parliament and the Council of 17 June 2008 establishing a framework for community action in the field of marine environmental policy (Marine Strategy Framework Directive). Official Journal of the European Union, L 164/19, 25.06.2008.
European Commission (2010) Commission decision of 1 September 2010 on criteria and methodological standards on good environmental status of marine waters (2010/477/EU). Official Journal of the European Union L 232/14, 2.9.2010.
ICES (2008) Report of the Study Group on data requirements and assessment needs for Baltic Sea trout [SGBALANST], by correspondence, December 2007–February 2008. ICES CM 2008/DFC:01. 74 pp.
ICES (2009) Report of the Study Group on data requirements and assessment needs for Baltic Sea trout (SGBALANST). ICES CM 2009/DFC: 03. 101 pp.
ICES (2011) Study Group on data requirements and assessment needs for Baltic Sea trout (SGBALANST), by correspondence, 23 March 2010 St. Petersburg, Russia. ICES CM 2011/SSGEF: 18. 54 pp.
ICES (2014) Report of the Baltic Salmon and Trout Assessment Working Group (WGBAST), 26 March–2 April 2014, Aarhus, Denmark. ICES CM 2014/ACOM:08. 342 pp.
ICES (2015) Report of the Baltic Salmon and Trout Assessment Working Group (WGBAST), 23-31 March 2015, Rostock, Germany. ICES CM 2015/ACOM:08. 362 pp.
ICES (2017) Report of the Baltic Salmon and Trout Assessment Working Group (WGBAST), 27 March–4 April 2017, Gdańsk, Poland. ICES CM 2017/ACOM:10. 298 pp.
ICES (2021) Baltic Salmon and Trout Assessment Working Group (WGBAST). ICES Scientific Reports. 3:26. 329 pp. https://doi.org/10.17895/ices.pub.7925
Jepsen, N., Skov, C., Pedersen, S., & Bregnballe, T. (2014). Betydningen af prædation på danske ferskvands-fiskebestande – en oversigt med fokus på skarv. DTU Aqua-rapport nr 283-2014.
Jepsen, N., Flávio, H., & Koed, A. (2019) The impact of Cormorant predation on Atlantic salmon and Sea trout smolt survival. Fisheries Management and Ecology, 26, 183-186.
HELCOM (2011) Salmon and Sea Trout Populations and Rivers in the Baltic Sea – HELCOM assessment of salmon (Salmo salar) and sea trout (Salmo trutta) populations and habitats in rivers flowing to the Baltic Sea. Baltic Sea Environment Proceedings No. 126A.
Leopold, M.F., Van Damme, C.J.G., Van der Veer, H.W. (1998) Diet of cormorants and the impact of cormorant predation on juvenile flatfish in the Dutch Wadden Sea. Journal of Sea Research 40: 93–107.
Pedersen, S., Heinimaa, P., Pakarinen, T. (2012) Workshop on Baltic Sea Trout, Helsinki, Finland, 11-13 October 2011. DTU Aqua Report No 248-2012. Available at: http://www.rktl.fi/english/fish/fish_resources/baltic_sea_trout/.
14. Other relevant resources
Allan, I.R.H., Ritter, J.A. (1977) Salmon terminology. Part 2. A terminology list for migrating trout (Salmo trutta L.). Journal du Conseil International pour L’Exploration de la Mer 37(3): 293-299.
Bohlin,T., Hamrin, S., Heggberget, T.G., Rasmussen, G., Saltveit, S.J. (1898) Electrofishing — Theory and practice with special emphasis on salmonids, Hydrobiologia 173(1): pp 9-43. March 15, 1989.
HELCOM (2012) Development of a set of core indicators: Interim report of the HELCOM CORESET project. PART B. Baltic Sea Environment Proceedings No. 129B. pp. 167-169.
ICES (2012) Report of the Baltic Salmon and Trout Assessment Working Group (WGBAST), 15–23 March 2012, Uppsala, Sweden. ICES 2012/ACOM: 08. 347 pp.
ICES (2013) Report of the Baltic Salmon and Trout Assessment Working Group (WGBAST), 3-12 April 2013, Tallinn, Estonia. ICES CM 2013/ACOM:08. 332 pp.
Jepsen, N., Skov, C., Pedersen, S., Bregnballe, T. (2014) Betydningen af prædation på danske ferskvands-fiskebestande – en oversigt med fokus på skarv. (In Danish) DTU Aqua-rapport nr 283-2014.
Rassi, P., Hyvärinen, E., Juslén, A., Mannerkoski, I. (eds.) (2010) The 2010 Red List of Finnish Species. Ympäristöministeriö & Suomen ympäristökeskus, Helsinki. 685 pp. Available at: http://www.ymparisto.fi/default.asp?contentid=371161&lan=en.