 Wastewater Treatment
Key message
Anthropogenic inputs from point sources are the second largest contributor to waterborne nutrient inputs into the Baltic Sea (12% of nitrogen and 20% of phosphorus inputs). Wastewater treatment has been one of the most feasible and cost-effective measures to improve the state of the Baltic Sea. Urban wastewater treatment plants largely reduce (70% – 90%) the discharge of nitrogen and phosphorous into the Baltic Sea. Investments in wastewater treatment plants are significant for both public health and environmental protection. Various drivers determine the extent and efficiency of wastewater treatment in the Baltic Sea region such as political will, investment, regulations, and technology adoption. Political will is the main driver to deliver this very basic public service vital for the protection of public health and the environment, and it defines the extent of the investment in wastewater treatment facilities. Lack of political will and insufficient investment in wastewater treatment facilities and collection systems, lead to the uncontrolled discharge of pollutants from municipalities and industries.
HELCOM Contracting Parties have made major efforts in this field, and many cities in the region have improved their treatment standards in recent years and are meeting the requirements set by the EU Urban Wastewater Treatment Directive. Further, HELCOM has recommended even stricter standards to protect the sensitive marine environment of the Baltic Sea.
Overall, around 52 million people were connected to tertiary wastewater treatment plants in the Baltic Sea catchment area in 2020, representing 72% of the total population. The Baltic Sea catchment area population connected to tertiary wastewater treatment facilities has been increasing over the last decade.
Citation
The data and resulting data products (e.g. tables, figures and maps) available on the indicator web page can be used freely given that it is used appropriately and the source is cited. The indicator should be cited as follows:
HELCOM (2023). Wastewater treatment. HELCOM driver indicator report. Online. [Date Viewed], [Web link].
ISSN 2343-2543
Background
Excessive input of nutrients is one of the biggest threats to the Baltic Sea environment (HELCOM 2018). Anthropogenic inputs from point sources are the second largest contributor of waterborne nutrient inputs (12% of nitrogen and 20% of phosphorus input) to the Baltic Sea (HELCOM 2021). Urban wastewater treatment plants significantly reduce the discharge of nitrogen and phosphorous into the Baltic Sea (70% – 90%) (Bunce et al. 2018). Thus, wastewater treatment is an impactful method to improve the state of the Baltic Sea.
Improving municipal wastewater treatment systems is a highly cost-efficient measure to reduce nutrient loads (HELCOM 2018). HELCOM Contracting Parties have made major efforts in this field, and many cities in the region have improved their treatment standards in recent years and are meeting the requirements set by the EU Urban Wastewater Treatment Directive (UWWTD) (HELCOM 2021). Further, HELCOM has recommended even stricter standards to protect the marine environment of the Baltic Sea. The wastewater treatment levels required by HELCOM Recommendation 28E-5 are 70% to 80% reduction for nitrogen and 90% reduction for phosphorus for cities above 10,000 inhabitants.
There are several technologies and devices used in wastewater treatment combining physical, chemical, and biological methods. Efficiency of treatment is mainly driven by the combination of these technologies (Lundin 2000). Tertiary treatment is the final treatment step which can remove persistent contaminants that primary and secondary level treatments were not able to clean up (Mareddy 2017). This final treatment stage makes wastewater effluent cleaner, and it can further remove nitrogen and phosphorus. There have been significant improvements in adoption of urban wastewater treatment technologies in Europe over the last 30 years (EEA 2020).
Drivers
Various drivers determine the extent and efficiency of wastewater treatment in the Baltic Sea region such as political will, investment, regulations, and technology adoption. Political will is the main driver to deliver this very basic public service vital for the protection of public health and the environment, and it defines the extent of the investment in wastewater treatment facilities. Lack of political will and insufficient investment in wastewater treatment facilities and collection systems, lead to the uncontrolled discharge of pollutants from municipalities and industries (UNEP 2005, Capell et al. 2021, Undemand et al. 2021).
In order to support the deployment of political will, there are several regulations mandating or recommending strict treatment standards to prevent environmental damage made through discharge of urban wastewater (e.g., Council Directive 91/271/EEC, HELCOM Recommendation 28E-5). These regulations also drive the extent of wastewater treatment investments in the Baltic Sea region. Due to their interconnecting and complementary characteristics, political will – investment – and regulation drivers were discussed as a group in this document.
Further, efficiency of treatment is driven by the adoption of the recent treatment technologies such as tertiary and advanced treatment systems (Attri et al. 2022, Mareddy 2017). For instance, tertiary treatments can further remove nitrogen and phosphorus (70% – 90%) (Bunce et al. 2018) and and secondary treatments stabilize oxygen-demanding substances in the wastewater..
Eurostat provides country-based statistics for presence and efficiency of wastewater treatment plants and population distribution. A brief summary of relevant drivers of relevance to this topic are provided below and a more detailed overview of these can be found in the HOLAS 3 Thematic Assessment of Economic and Social Analyses.
Political will – Investment – Regulation
In order to control discharge of pollutants from municipalities and industries, effective laws and regulations, and corresponding investments are vital (UNEP 2005). Many cities in the Baltic Sea catchment area have improved their treatment standards in recent years. This change was mainly driven by sufficient political will and strict regulations which enhanced investments in this very fundamental public service, vital for the protection of public health and the environment. These regulations provide specific treatment standards and implementation deadlines for Baltic Sea countries.
The primary wastewater regulation in Europe, the Urban Wastewater Treatment Directive (Council Directive 91/271/EEC concerning urban waste-water treatment, UWWTD) entered into force in 1991 to protect human and environmental health by collecting and treating municipal wastewater. In October 2022, the European Commission published the proposal for the new Urban Wastewater Treatment Directive (UWWTD). The proposal focuses on the quality of rivers, lakes, groundwaters and seas through cost-effective wastewater treatment. The main objective of the UWWTD is to protect the environment, specifically surface waters, from the adverse effects of wastewater discharges. Since the introduction of the UWWTD, the proportion of the wastewater collected, and the level of wastewater treatment has increased in the EU. Overall, 69 % of the Europe population were connected to tertiary level treatment and 13 % to secondary level treatment (EEA 2020). In order to reduce nutrient loads from municipalities, HELCOM recommendations further tighten the UWWTD requirements in the Baltic Sea (Table 1). The wastewater treatment levels recommended by HELCOM Recommendation 28E-5 Municipal wastewater treatment are 70% to 80% reduction for nitrogen and 90% reduction for phosphorus for cities above 10,000 inhabitants. For cities between 2,000 and 10,000 inhabitants, the reduction targets are 80% for phosphorus and 30% for nitrogen.
Table 1: Urban Wastewater Treatment Directive and HELCOM Recommendation 28E-5 Requirements for discharges from urban wastewater treatment plants. Minimum reduction and maximum concentration values are given below for nitrogen and phosphorus.
| UWWTD | HELCOM Recommendation 28E-5 | |||
| Nitrogen | Min. Removal Rate | Max. Concentration | Min. Removal Rate | Max. Concentration |
| Population 10.000-100.000 | 70% – 80% | 15 ml | 70% – 80% | 15 mg/l |
| Population above 100.000 | 70% – 80% | 10 ml | 70% – 80% | 10 mg/l |
| UWWTD | HELCOM Recommendation 28E-5 | |||
| Phosphorus | Min. Removal Rate | Max. Concentration | Min. Removal Rate | Max. Concentration |
| Population 10.000-100.000 | 70% – 80% | 2 mg/l | 90% | 0.5 mg/l |
| Population above 100.000 | 70% – 80% | 1 mg/l | 90% | 0.5 mg/l |
Another key EU directive, the EU Water Framework Directive (WFD), is one of the main measures to meet nutrient discharge targets in the Baltic Sea. The WFD has presented a different perspective on the control of point sources of pollution and recommended to integrate pollution prevention and control at river basin level, setting quality objectives for the receiving waters (Benedetti 2006, Kavanagh and Bree 2009, Spiller et al. 2012).
In addition to these regulations, the European Union supports Member States by deploying several funding instruments to support development. The primary EU source of investment in water infrastructure is the Cohesion Fund. It helps Member States to meet their basic water requirements and supports the compliance with the EU environmental policies in the field of water. Another source, European Regional Development Fund, also invests in infrastructure providing basic water services. The fund supports investments through national or regional programmes.
Technology adoption
Wastewater treatment is a complex process using a variety of methods and practices. In order to improve its performance and effectiveness, continuous adoption of novel technologies and practices is essential. There are several technologies and devices used in wastewater treatment combining physical, chemical, and biological methods. Efficiency of treatment is mainly driven by the combination of these technologies (Lundin 2000).
In general, primary treatment removes suspended solids by passing wastewater through settlement or flotation tanks, and secondary treatment (i.e., biological treatment) has tanks where bacteria eat pollutants and transform them into sludge. The level of treatment also depends on the sensitivity of the receiving water (Pihlainen 2020). While primary and secondary treatment remove most of the suspended solids, they can be insufficient to remove nutrients (Mareddy 2017).
On the other hand, tertiary treatments remove pollutants not adequately removed by secondary treatment, particularly nitrogen and phosphorus; accomplished by means of sand filters, microstraining, or other methods (EEA Glossary). These technologies can be added to the conventional secondary biological treatments (Pihlainen 2020). Tertiary treatment of wastewater may involve a wide-range of additional steps after secondary treatment to further reduce nitrogen (e.g., biochemical methods), phosphorus (e.g., physicochemical methods), organics, turbidity, metals, and pathogens (Gerba 2019). Most processes involve some type of physicochemical treatment such as coagulation, filtration, activated carbon adsorption of organics, reverse osmosis, and additional disinfection and further reduction of organic matter. Advanced tertiary treatment is generally designed to remove micropollutants. Although these technologies are expected to be implemented in the near future, the longevity of existing treatment plants is a strong barrier in Europe (Soares 2020). In this context, political will, regulations and funding instruments may be important to maintain investments into these technologies (Poškus et al. 2021).
In addition to tertiary, secondary, and primary treatment plants, independent treatment methods are also applied in Baltic Sea region where proper treatment facilities do not exist or are not suitable. These facilities are used for preliminary treatment, infiltration or discharge of domestic wastewater from dwellings, and they are not connected to an urban wastewater collecting system (Eurostat 2018). Examples of such systems are individual sewage systems or septic tanks.
Demographics
Changes in the number, density, and location of people living in the Baltic Sea region affect the demand for wastewater treatment systems. However, it cannot be assumed that change in any particular direction for any of these demographic characteristics is inherently better for the environment. Any change in various demographic characteristics will present a variety of challenges and benefits to managing our relationship to the Baltic Sea (de Sherbinin et al. 2007). For instance, the growing human population within the catchment area, the proportion of the population using the sewerage system, the amount of wastewater influent entering the treatment plant, and the efficiency level of the wastewater treatment system are all related to demographic changes in the area (Taylor 2003, Camorani et al. 2005). Although the rapid human population growth may boost the development of water and sanitation infrastructure in some examples, the lack of effective water resource management strategies could have a negative impact on the design capacity of wastewater treatment facilities (Teklehaimanot et al. 2015). In terms of other drivers, all changes in demographics are likely to have an impact on the investment patterns and political will required to achieve the highest treatment standards.
Driver Indicators
Wastewater treatment is an indicator set which consists of presence and efficiency of wastewater treatment and population distribution indicators. Population distribution indicators are supporting indicators for the presence and efficiency of wastewater treatment indicators. The individual indicators express similar information from different perspectives and are best considered as a group. These indicators can be used as a partial quantified proxy for the drivers of political will, investment, regulation, and technology adoption. An overview of relevant data trends and information is provided below in sections.
A variety of wastewater treatment driver indicators were considered; however, some require additional development or currently lack sufficient data. The indicators below largely track wastewater treatment activity and population distribution and characteristics. Generally, they do have high clarity of impact and can be linked to a variety of relevant drivers.
The population connected to urban wastewater treatment relates to the proportion of citizens connected to any kind of sewage treatment carried out in municipal treatment plants by public authorities or private enterprises on behalf of local authorities. Note that these indicators are calculated at a national level which will obscure any underlying spatial heterogeneity which may be present.
Presence and efficiency of wastewater treatment
In total, around 52 million people were connected to tertiary wastewater treatment plants in the Baltic Sea catchment area in 2020, representing 72% of the total population. Connections to tertiary treatment plants vary by country with Denmark and Germany above 90% and Latvia, Lithuania, and Poland below 70% (Figure 2).
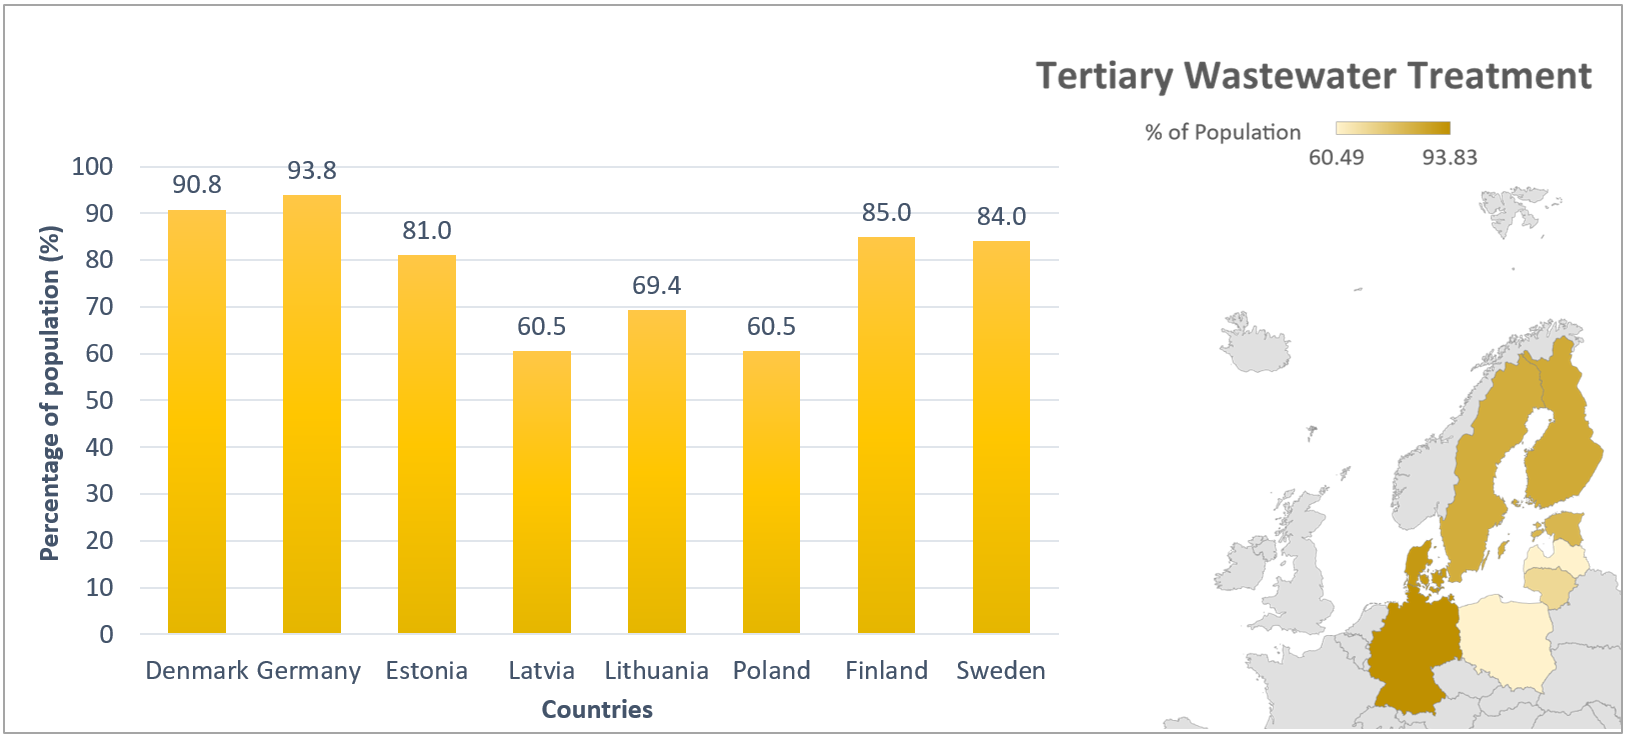
Figure 2: Percentage of total population connected to tertiary wastewater treatment plants in Baltic Sea countries in 2020. Chart does not include data from Russia or any non-HELCOM countries due to lack of data.
The Baltic Sea catchment area total population connected to tertiary wastewater treatment facilities has been increasing over the last decade (F1,10 = 90.189, p < 0.001) (Figure 3). Eurostat data presents the resident population connected to wastewater collecting systems and to wastewater treatment plants regardless of their size.
While application of tertiary wastewater treatment was increasing in the region, Baltic Sea catchment area total population connected to secondary wastewater treatment facilities has been decreasing over the last decade (F1,10 = 10.266, p = 0.012), however, country specific trends showed diversity. Populations of Denmark (F1,10 = 51.469, p < 0.001), Germany (F1,10 = 28.996, p < 0.001), Estonia (F1,10 = 18.699, p = 0.002) and Latvia (F1,10 = 12.015, p = 0.008) connected to secondary wastewater treatment facilities have shown a significant decreasing trend due to the implementation of tertiary treatment systems. On the other hand, Poland, Sweden and Lithuania populations connected to secondary wastewater treatment facilities have increased between 2011 and 2020 (7%, 10%, and 117%, respectively).
Total population connected to independent wastewater treatment methods has shown a significant decreasing trend (F1,10 = 93.329, p < 0.001). Population connected to primary treatment plants constitute a very small proportion of the total Baltic Sea catchment area population (0.0006).
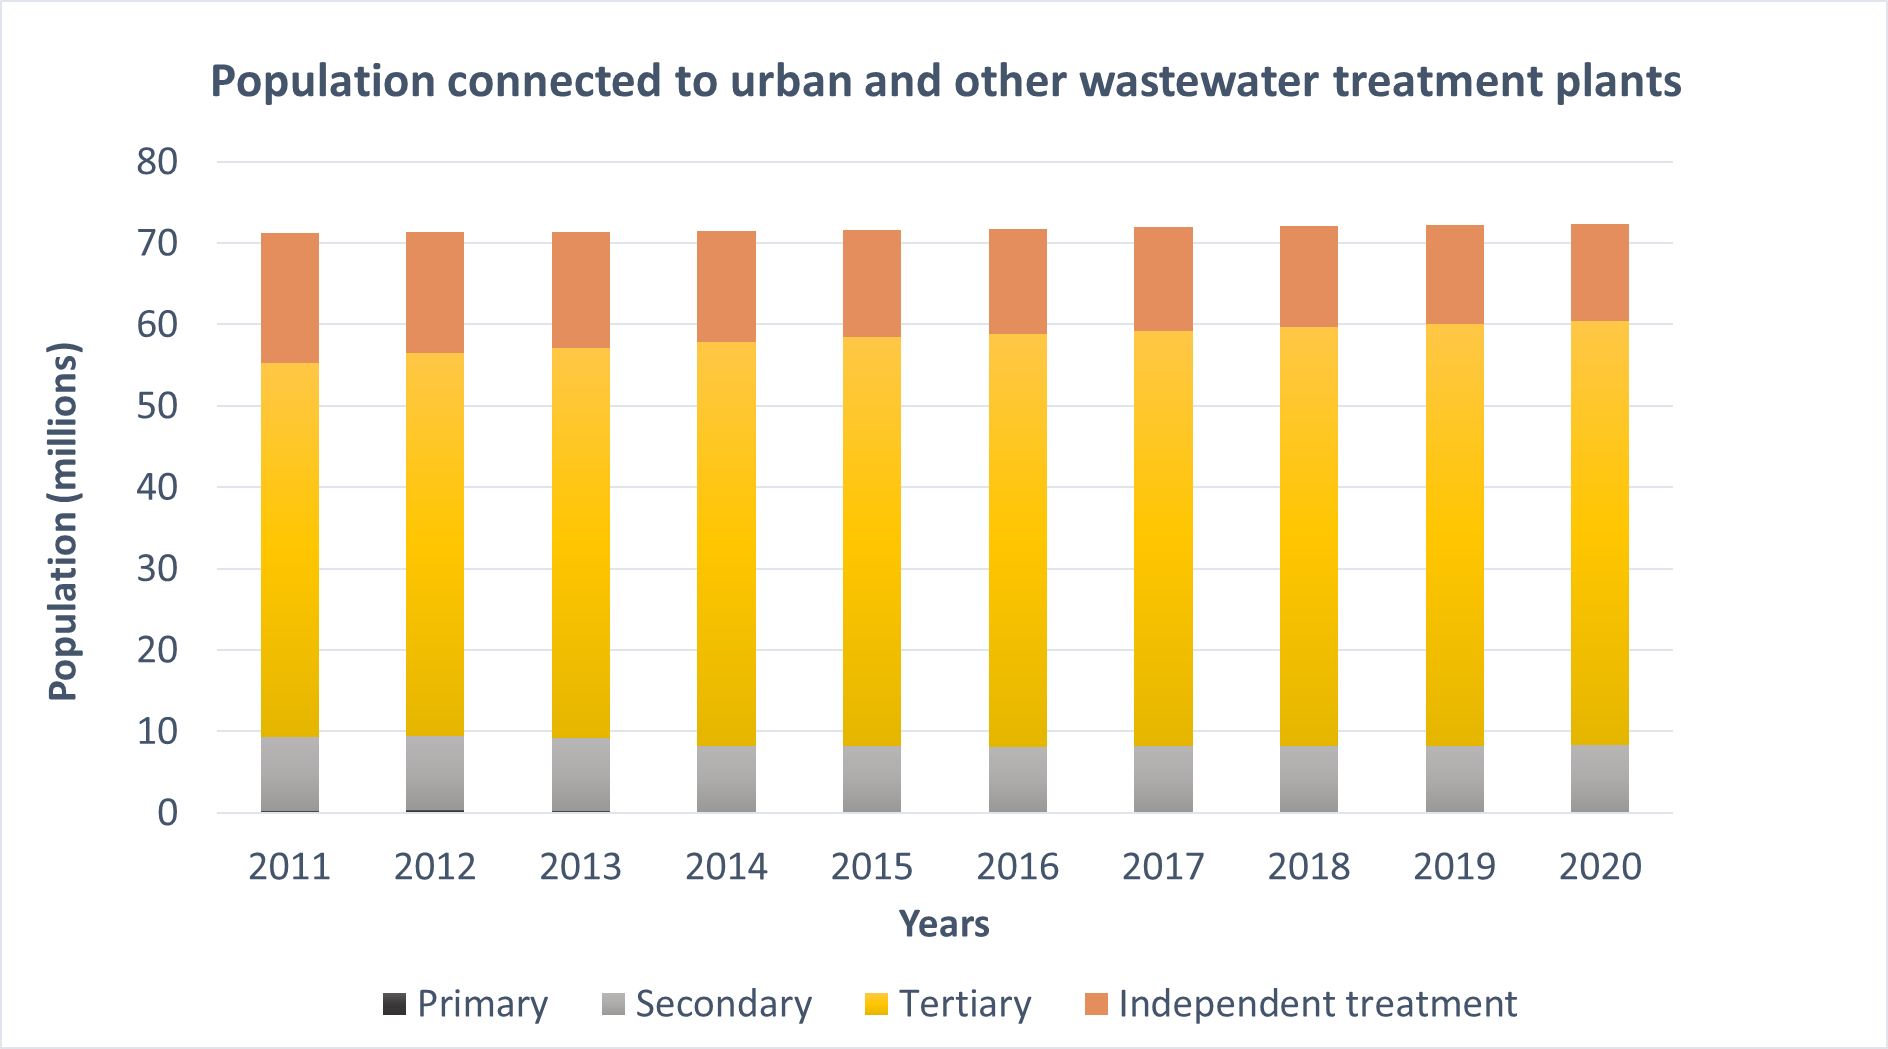
Figure 3: Population connected to urban and other wastewater treatment plants in Baltic Sea countries. Chart colours represents independent, primary, secondary, and tertiary treatment facilities. Part of the population connected to the primary treatment plants is very small and thus, not visible. Chart does not include data from Russia or any non-HELCOM countries due to lack of data.
Population Distribution
Population distribution driver indicator shows information on total population in the Baltic Sea catchment area. Population may impact the investment patterns and political will required to achieve the highest treatment standards. According to Eurostat, the total population of Baltic Sea countries was around 72 million in the Baltic Sea catchment area in 2021. The total population has been relatively stable over the past 20 years (Figure 4).
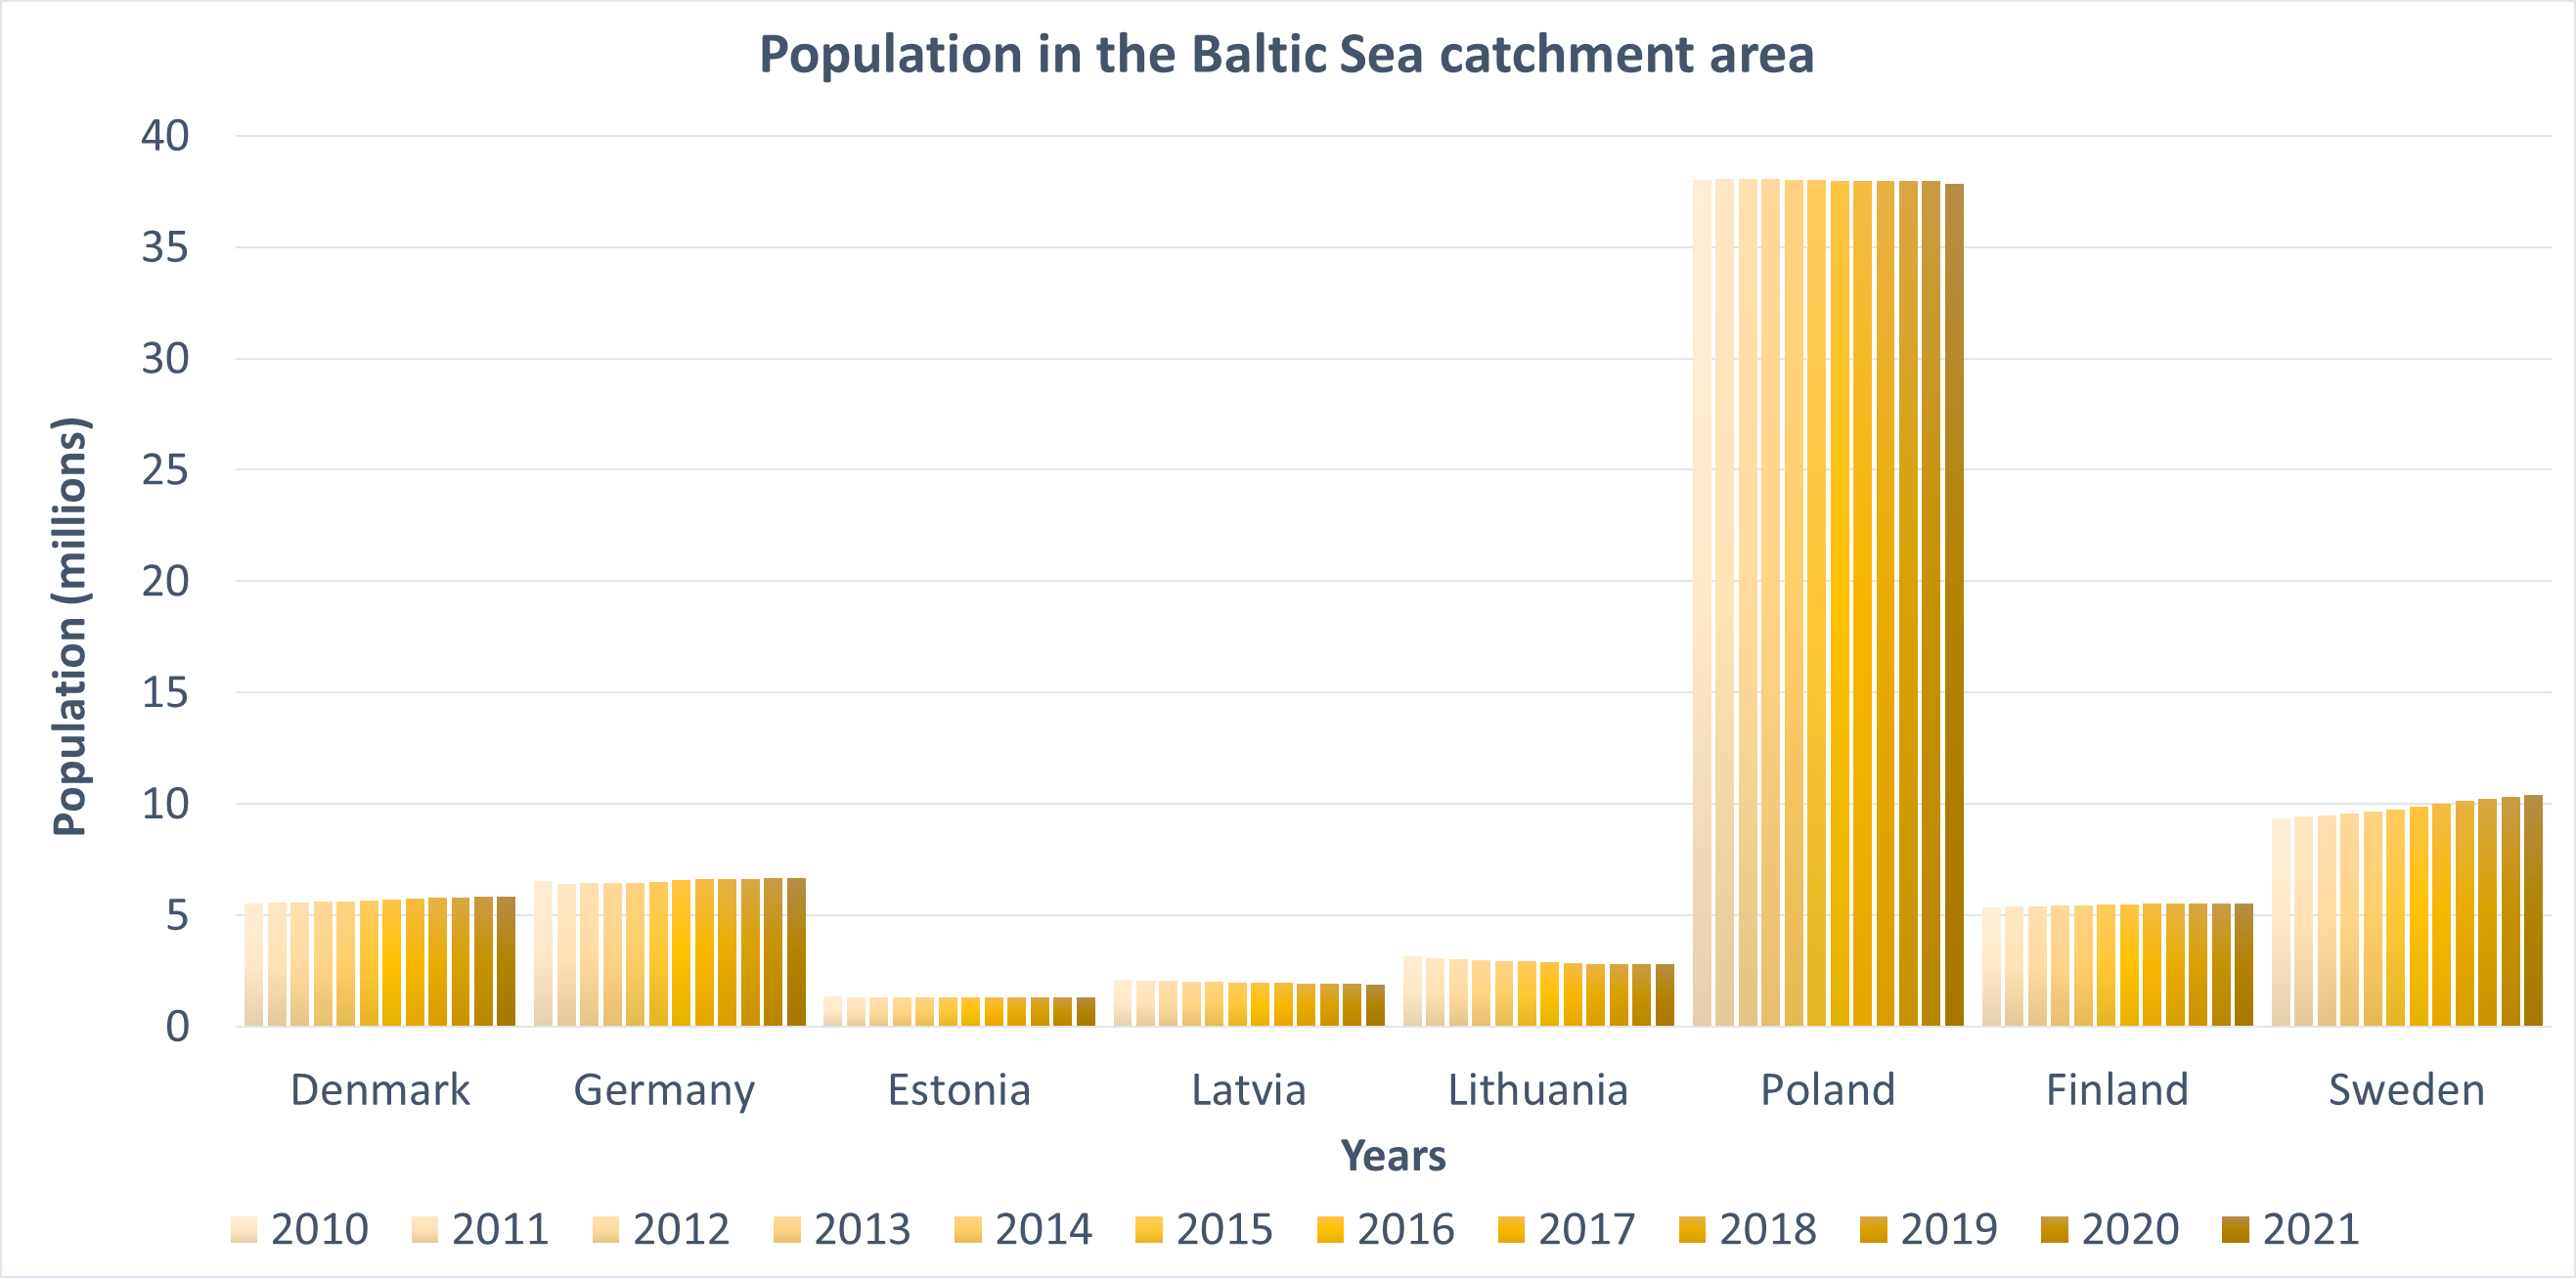
Figure 4: Country specific population numbers in the Baltic Sea catchment area between 2010 and 2021. Chart does not include data from Russia or any non-HELCOM countries due to lack of data. German data was multiplied by the ratio of national territory in the Baltic Sea catchment area (0.08).
Confidence
The wastewater treatment facilities data was found for each Baltic Sea countries except Russia, between 2011-2020. Eurostat provides complete datasets for the presence and efficiency of wastewater treatment facilities.
For most HELCOM countries the difference in total national territory and territory in the Baltic Sea catchment is minor. However, as only 8% of Germany drains in the Baltic Sea catchment area, a multiplier of 0.08 was applied to the German data and this was indicated in figure captions.
Conclusions
Overall, 72% of the Baltic Sea catchment area population is connected to tertiary wastewater treatment plants. Over the last decade, population connected to tertiary wastewater treatment facilities has been steadily increasing. There is a decreasing trend in secondary wastewater treatment facilities due to implementation of tertiary treatment plants and there is a very low number of facilities providing only primary treatment in the Baltic Sea countries. Baltic Sea countries’ population trend has been relatively stable over the past 20 years.
Implemented driver indicators have high clarity of impact in terms of explanation of the input of nutrient pressure, and their proximity to the related drivers is relatively high. Identified trends in the presence and efficiency of wastewater treatment facilities may reflect the nitrogen and phosphorus input to the Baltic Sea. Further, these indicators can be closely linked to specific relevant drivers such as political will, investment, regulations and technology adoption. Future work should focus on the data quality on population distribution and characteristics
Links to society and environment (DAPSIM)
Activities
Pressures
The following pressure assessments are carried out through indicator evaluations:
Status
The following status assessments are carried out through indicator evaluations:
- Total nitrogen (TN) concentrations,
- Total Phosphorus (TP) concentrations,
- Dissolved inorganic nitrogen (DIN) concentrations,
- Dissolved inorganic Phosphorus (DIP) concentrations.
Each of these indicators can be considered to have a direct possible relationship with the driver(s) described in this report, in particular on the potential to achieve a state representative of good environmental status (GES). In addition, there are ecological impacts of nutrient concentration increases that are reflected by the distance to achievement (i.e. the distance to threshold value in the state evaluations), as well as indirect eutrophication impacts such as increased algal blooms or reduced water clarity. Furthermore, such impacts may also be transferred through Baltic Sea food webs and have consequences for biodiversity components. Other relevant indicators are available on the HELCOM indicator web page.
Impacts
Impacts on society as a consequence of the distance from GES can also be evaluated, where losses of potential benefits or disruption of human activities can be considered. Either or both of these impacts may catalyse the need for measures.
Measures
Several measures were found related to wastewater treatment and these measures were explained briefly under regulation driver section. The primary wastewater regulation in Europe to protect human and environmental health by collecting and treating municipal wastewater is the Urban Wastewater Treatment Directive. Requirements by the directive and HELCOM Recommendation 28E-5 Municipal wastewater treatment defines the minimum technological requirements and technology adoption in wastewater treatment plants. Related measures were listed below:
The Helsinki Convention, Annex III Part 2: Prevention of pollution from industry and municipalities
In accordance with the relevant parts of this Convention, the Contracting Parties shall apply the measures described and take into account Best Environment Practice (BEP) and Best Available Technology (BAT) to reduce the pollution from industry and municipalities.
Council Directive 91/271/EEC concerning urban waste-water treatment was adopted on 21 May 1991 to protect the water environment from the adverse effects of discharges of urban waste water and from certain industrial discharges.
The EU Water Framework Directive
The purpose of the EU Water Framework Directive is to establish a framework for the protection of European waters in order for Member States to reach “good status” objectives for water bodies throughout the EU.
Related Baltic Sea Action Plan (BSAP) actions
E23: Strengthen the HELCOM Recommendation 28E/5 on municipal wastewater treatment by 2027.
E24: Facilitate exchange of information on best available treatment techniques for wastewater treatment plants through cooperation with existing regional digital platform(s) acting as a hub for the best knowledge in the wastewater management sector.
E25: Encourage educational cooperation with involvement of relevant non-governmental organizations utilizing such regional digital platform(s) to solve problems of municipal sewage in smaller municipalities and scattered settlements.
E26: Cooperate with relevant Policy Areas of the EU Strategy for the Baltic Sea Region (EUSBSR) regarding e.g., wastewater treatment plants (under “save the sea” objective of the EUSBSR) as well as other regional policies to engage a wider network of stakeholders into cooperation to achieve the BSAP targets.
E27: Target the elimination of phosphorus in laundry detergents for consumer use as soon as possible, but not later than by 2024.
E28: Build a knowledge base to target the reduction of phosphorus in detergents for industrial & institutional use. By 2025, develop and publish a HELCOM progress report about best available techniques, alternative builders, especially on their use, environmental effects and effectiveness.
E29: Undertake efforts to reduce and where possible eliminate phosphorus in detergents for industrial & institutional use, in particular for institutional use of laundry and dishwater detergents no later than by 2030 based on the knowledge on best available techniques compiled during the first step.
Related HELCOM Recommendations
Future development
Future development of this indicator may be relevant to bring in more data or more suitable information to build stronger conceptual links within the DAPSIM conceptual management framework. Such developments, as well as the development of other relevant driver indicators associated with the topic, if relevant, may support a better overall understanding of processes and thus increase the potential for clear management action.
In general, future work should focus on the data quality on population distribution and characteristics. Although Eurostat data was used in this exercise, it is recommended to explore the compilations of pollution load data (PLC) for the future assessments of driver indicator. In addition, future data review should be performed on the percentage of population connected to treatment plants that meets HELCOM recommendation 28E/5. Further, trends in population living in urban-rural areas can highlight the significance of urbanization and population distribution for input of nutrients into the Baltic Sea. In the future work, it was suggested to apply Baltic Sea catchment area proportion multiplier to all CPs data as applied to German data.
Beyond HOLAS 3, it is recommended to discuss the relationship between measures and driving forces. Future work should focus on what extent the existing measures address driving forces and how driver indicators can be used to identify required measures.
Methodology
The indicator and report focus on utilizing available data and information to provide an overview of trends in drivers (or proxies indicative of such drivers) that can be informative in a causal framework (i.e., DAPSIM, as applied in HELCOM).
The work carried out represents an initial step towards addressing drivers in HELCOM work and at this stage focusses on selected aspects where 1) experts identified valid potential, and 2) where suitable data were available. The following text describes how such data were handled and utilized.
An overview of the methodology applied can be found in the HOLAS 3 Thematic Assessment of Economic and Social Analyses.
Proposed driver indicators:
While the concept of Drivers in any DAPSI(W)R(M)-based framework is well established, the statistics used to generate indicators of a driver do not necessarily neatly correspond to one of the DAPSI(W)R(M) elements. A driver indicator may very closely represent a driver (for example total population is a direct representation of the demographics driver), closely represent another DAPSI(W)R(M) element (for example the number of fishing days at sea is a direct representation of the Activity of commercial fishing), or not clearly fall into a single DAPSI(W)R(M) element at all (for example agricultural nutrient balance). Additionally, simple proximity to the targeted driver does not make a driver indicator informative. Operating subsidies in commercial fishing are a direct measure of the Subsidy and Regulation Driver but without extensive knowledge about what the operating subsidies are used for, who they target, the tax regime the operator exists in, etc., it is unclear what effect an increase or decrease in the level of operating subsidies would have. On the other hand, despite not being particularly close to any Driver, agricultural nutrient balance is excellent at capturing the cumulative impact of numerous drivers and can be used as tool for illustrating the impact of observed changes in drivers. This multi-dimensional ambiguity was difficult to understand without a way of tracking these topics.
To explore these relationships for proposed potential driver indicators (both for implemented driver indicators and driver indicators rejected for various reasons), quadrant charts were developed. These figures were utilized to explain the proximity to drivers (y-axis) and the clarity of impact (x-axis) for each investigated driver indicator. It is important to highlight that these figures are development tools and can only reflect the information the researchers had at the time of the analysis. Further, the points were qualitatively placed by the Secretariat based on subjective criteria. Differences of opinion are certain to exist. Small changes in the position of points on the chart should be disregarded.
Clarity of impact (x-axis): This axis demonstrates the explanatory power of the driver indicator in capturing the relationship between the Driver and the chosen Activity-Pressure pair (Agriculture-Input of nutrients, Fishing-Fish extraction, Urban uses-Input of nutrients). Changes in the level of data (for example regional vs global population) will affect the clarity of the driver indicator. Indicators with very low clarity of impact were placed on the left side of the chart, while indicators with high clarity of impact were placed on the right side of the chart.
Proximity to driver (y-axis): This axis demonstrates the proximity of indicator to the explained driver. Indicators which were very closely related to driver itself were placed higher on the chart, while indicators which are closer to Activities or Pressures were placed lower on the chart. Points placed closer to the middle were not direct measurements of any particular DAPSI(W)R(M) element and instead capture aspects from multiple elements.
Based on these characteristics, driver indicators were shown in four general categories:
- Optimal driver indicators: Closely related to drivers with high clarity of impact.
- Opaque driver indicators: Closely related to drivers with low clarity of impact.
- Alternate driver indicators: Not closely related to drivers but with high clarity of impact.
- Not useful as driver indicator: Not closely related to drivers and with low clarity of impact.
All driver indicators that were not placed in the “Not useful as a driver indicator” were considered for full development. However, not all these driver indicators were eventually developed due to insufficient time or resources, insufficient data, or the presence of multiple more informative driver indicators.
The charts present a quick overview of the perceived status of investigated driver indicators and suggest potential directions for further development.
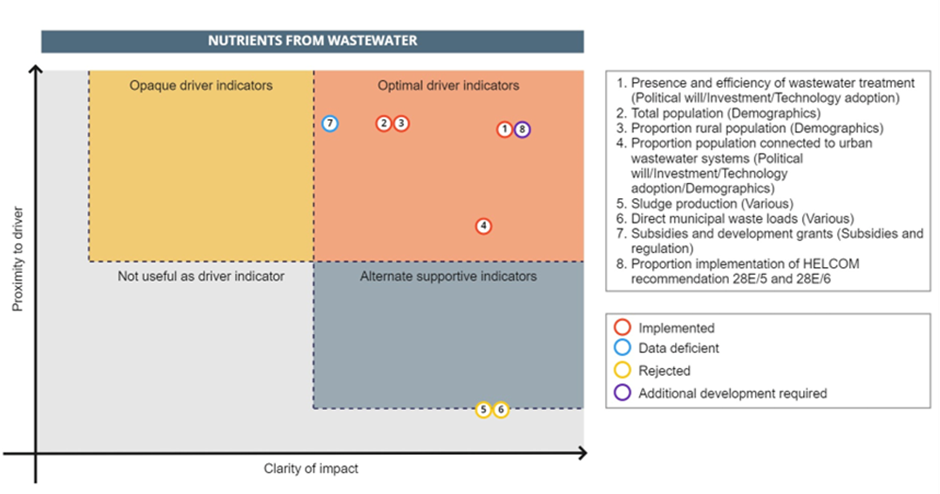
Figure 5: Driver indicators relevant for nutrients from wastewater pressure – activity pair, their proximity to drivers and clarity of impact. Driver indicators were subjectively categorized under opaque driver indicators, optimal driver indicators, not useful as driver indicator and alternate supportive driver indicators categories.
Data processing
Data was used as it was provided in Eurostat database. However, as only 8% of Germany drains in the Baltic Sea, a multiplier of 0.08 was applied to the German data (except total population calculation, Figure 3).
Data
Eurostat data tables:
Population connected to wastewater treatment plants (Data table: env_ww_con).
Contributors
Kemal Pinarbaşi, Luke Dodd, Owen Rowe, Jannica Haldin.
Acknowledgements: EG ESA, State and Conservation WG, GEAR WG and participants of workshops leading to this development.
Archive
This current version of the indicator is the first iteration. Future updates or evolution of the indicator document will be provided online, and older versions will be archived via a link in this section of the document.
References
Attri, S. D., Singh, S., Dhar, A., & Powar, S. (2022). Multi-attribute sustainability assessment of wastewater treatment technologies using combined fuzzy multi-criteria decision-making techniques. Journal of Cleaner Production, 357, 131849.
Benedetti L. (2006). Probabilistic design and upgrade of wastewater treatment plants in the EU Water Framework Directive context. PhD thesis, Ghent University, Belgium, pp. 304.
Bunce JT, Ndam E, Ofiteru ID, Moore A and Graham DW (2018) A Review of Phosphorus Removal Technologies and Their Applicability to Small-Scale Domestic Wastewater Treatment Systems. Front. Environ. Sci. 6:8. doi: 10.3389/fenvs.2018.00008
Camorani G, Castellarin A, Brath A (2005) Effects of land-use changes on the hydrologic response of reclamation systems. Phys Chem Earth 30:561–574
Capell, R., Bartosova, A., Tonderski, K., Arheimer, B., Pedersen, S. M., Zilans, A. (2021). From local measures to regional impacts: Modelling changes in nutrient loads to the Baltic Sea. Journal of Hydrology. https://doi.org/10.1016/j.ejrh.2021.100867
de Sherbinin, A., Carr, D., Cassels, S., & Jiang, L. (2007). Population and Environment. Annual review of environment and resources, 32, 345–373. https://doi.org/10.1146/annurev.energy.32.041306.100243
European Commission, 2021, Directorate-General for Agriculture and Rural Development, Beck, M., Van Bunnen, P., Wathelet, J., et al., Evaluation support study on the CAP’s impact on knowledge exchange and advisory activities: final report, Publications Office of the European Union, https://data.europa.eu/doi/10.2762/045268
European Environment Agency, EEA (2022) EEA Glossary. https://www.eea.europa.eu/help/glossary/eea-glossary. Date accessed: 12/08/2021.
Eurostat, 2018, Data Collection Manual for the OECD/Eurostat Joint Questionnaire on Inland Waters and Eurostat regional water questionnaire: Concepts, definitions, current practices, evaluations and recommendations, Version 4
Gerba, C.P. (2019). Environmental and Pollution Science || Municipal Wastewater Treatment. , (), 393–418. doi:10.1016/B978-0-12-814719-1.00022-7
HELCOM. 2011, Fifth Baltic Sea Pollution Load Compilation (PLC-5). Baltic Sea Environment Proceedings No. 128
HELCOM. 2018, HELCOM Thematic assessment of eutrophication 2011-2016. Baltic Sea Environment Proceedings No. 156
HELCOM. 2020, Indicator Manual Version 2020-1. Baltic Sea Environment Proceedings n°175. HELCOM
HELCOM. 2021, Background information on the Baltic Sea catchment area for the Seventh Baltic Sea Pollution load compilation (PLC-7).
Kavanagh, P., & Bree, T. (2009). WATER FRAMEWORK DIRECTIVE PROGRAMME OF MEASURES: PROTECTION OF HIGH-STATUS SITES, FOREST, WATER AND ON-SITE WASTEWATER-TREATMENT SYSTEMS. Biology and Environment: Proceedings of the Royal Irish Academy 109B(3), 345-364. https://www.muse.jhu.edu/article/809740.
Lundin, M., Bengtsson, M., & Molander, S. (2000). Life cycle assessment of wastewater systems: influence of system boundaries and scale on calculated environmental loads. Environmental Science & Technology, 34(1), 180-186.
Mareddy, Anji Reddy (2017). Environmental Impact Assessment || Technology in EIA, (), 421–490. doi:10.1016/B978-0-12-811139-0.00012-8
Moss B. Water pollution by agriculture. Philos Trans R Soc Lond B Biol Sci. 2008 Feb 12;363(1491):659-66. doi: 10.1098/rstb.2007.2176. PMID: 17666391; PMCID: PMC2610176.
Pihlainen, S., Zandersen, M., Hyytiäinen, K., Andersen, H. E., Bartosova, A., Gustafsson, B., Jabloun, M., McCrackin, M., Meier, H. E. M., Olesen, J. E., Saraiva, S., Swaney, D., & Thodsen, H. (2020). Impacts of changing society and climate on nutrient loading to the Baltic Sea. The Science of the Total Environment, 731, [138935]. https://doi.org/10.1016/j.scitotenv.2020.138935
Poškus MS, Jovarauskaitė L, Balundė A. A Systematic Review of Drivers of Sustainable Wastewater Treatment Technology Adoption. Sustainability. 2021; 13(15):8584. https://doi.org/10.3390/su13158584
Spiller, M., McIntosh, B. S., Seaton, R. A. F., & Jeffrey, P. J. (2012). An organisational innovation perspective on change in water and wastewater systems – the implementation of the Water Framework Directive in England and Wales. Urban Water Journal, 9(2), 113-128. https://doi.org/10.1080/1573062X.2011.652129
Soares, A. (2020). Wastewater treatment in 2050: Challenges ahead and future vision in a European context.
Taylor H (2003) Drinking water microbiology. In: Mara D, Horan N (eds) The handbook of water and wastewater microbiology. Academic Press, London, pp 611–777
Teklehaimanot GZ, Kamika I, Coetzee MA, Momba MN. Population Growth and Its Impact on the Design Capacity and Performance of the Wastewater Treatment Plants in Sedibeng and Soshanguve, South Africa. Environ Manage. 2015 Oct;56(4):984-97. doi: 10.1007/s00267-015-0564-3. Epub 2015 Jun 25. PMID: 26108411.
Undeman, E., Rasmusson, K., Kokorite, I., Leppänen, M.T., Larsen, M.M., Pazdro, K., & Siedlewicz, G. (2022). Micropollutants in urban wastewater: large-scale emission estimates and analysis of measured concentrations in the Baltic Sea catchment. Marine pollution bulletin, 178, 113559 .
UNEP, 2005. Lääne, A., Kraav, E. and G. Titova. Baltic Sea, GIWA Regional assessment 17. University of Kalmar, Kalmar, Sweden.