 Water transparency
2 Relevance of the indicator
Eutrophication is caused by excessive inputs of nutrients (nitrogen and phosphorus) resulting from various human activities. High availability of nutrients and their ratios form the preconditions for increased algal growth, reduced water clarity and increased oxygen consumption. Water clarity is affected by the light attenuation of the media, caused mainly by water itself, planktonic organisms – especially phytoplankton, suspended particulate matter, chromophoric dissolved organic matter (CDOM), and inorganic compounds. In the open oceans, phytoplankton is the dominating optical constituent but in the Baltic Sea water clarity is dominated by CDOM. In the North-eastern parts the main source of CDOM is humic substances in run off from land. In the other parts, phytoplankton growth is the main source for CDOM and hence related to nutrient inputs. Reduced water clarity is often a result of the eutrophication cascade, although especially in the North-eastern parts, increase in coloured dissolved substances may have played an important role.
Eutrophication assessment
The status of eutrophication is assessed using several core indicators. Each indicator focuses on one important aspect of the complex process. In addition to providing an indicator-based evaluation of the water clarity, this indicator also contributes to the overall eutrophication assessment along with the other eutrophication core indicators, being included in criteria group “indirect effects of eutrophication”.
2.1 Ecological relevance
Role of water clarity in the ecosystem
Water clarity is affected mainly by the concentration of particles causing scattering of light, therefore enhancing light absorption. Light absorption is mainly due to water itself, CDOM, detritus and to phytoplankton. The concentration of detritus particles and CDOM is the result of organic matter accumulated over time due to high nutrient loadings and in particular in the eastern Baltic Sea to a high natural contribution of humic materials from rivers draining peat land and forested areas. Eutrophication increases light attenuation, through nutrients increasing the amount of living organisms. Turbid waters affect the ecosystem through decreases in light availability below the surface.
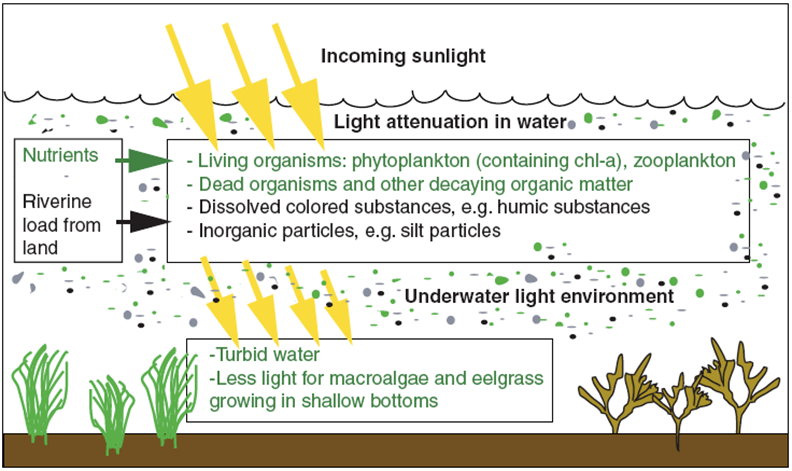
Figure 2. Simplified conceptual model for water clarity in the Baltic Sea. Figure from HELCOM 2009.
2.2 Policy relevance
Eutrophication is one of the four thematic segments of the HELCOM Baltic Sea Action Plan (BSAP) with the strategic goal of having a Baltic Sea unaffected by eutrophication (HELCOM 2021). Eutrophication is defined in the BSAP as a condition in an aquatic ecosystem where excessive inputs of nutrients stimulate the growth of algae which leads to imbalanced functioning of the system. The goal for eutrophication is broken down into five ecological objectives, of which one is “clear water”, possible to assess using Secchi depth as a proxy.
The EU Marine Strategy Framework Directive (2008/56/EC) requires that “human-induced eutrophication is minimized, especially adverse effects thereof, such as losses in biodiversity, ecosystem degradation, harmful algal blooms and oxygen deficiency in bottom waters” (Descriptor 5). ‘Photic limit (transparency) of the water column’ is listed as a criteria element in MSFD GES Decision ((EU) 2017/848) for assessing the secondary criterion D5C4 ‘The photic limit (transparency) of the water column is not reduced, due to increases in suspended algae, to a level that indicates adverse effects of nutrient enrichment’.
The EU Water Framework Directive (2000/60/EC) requires good ecological status in the European coastal waters. Good ecological status is defined in Annex V of the Water Framework Directive, in terms of the quality of the biological community, the hydromorphological characteristics and the chemical characteristics, including water clarity.
Table 1. Overview or relevant policy for this indicator.
| Baltic Sea Action Plan (BSAP) | Marine Strategy Framework Directive (MSFD) | |
| Fundamental link | Segment: Eutrophication
Goal: “Baltic Sea unaffected by eutrophication”
|
Descriptor 5 Human-induced eutrophication is minimised, especially adverse effects thereof, such as losses in biodiversity, ecosystem degradation, harmful algae blooms and oxygen deficiency in bottom waters – Macrofaunal communities of benthic habitats.
(a) in coastal waters, the values set in accordance with Directive 2000/60/EC; (b) beyond coastal waters, values consistent with those for coastal waters under Directive 2000/60/EC. Member States shall establish those values through regional or subregional cooperation.
|
| Complementary link | ||
| Other relevant legislation: |
|
|
2.3 Relevance for other assessments
This indicator is utilized in the integrated assessment of eutrophication (HEAT tool).
3 Threshold values
Status evaluation is measured in relation to scientifically based and commonly agreed sub-basin specific threshold values, which define the values that should not be exceeded (Figure 3).
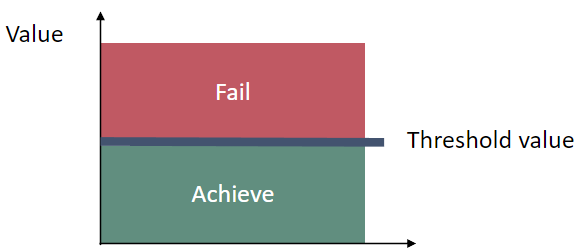
Figure 3. Schematic representation of the threshold value applied in the water clarity core indicator, the threshold values are assessment unit specific (see table 1).
3.1 Setting the threshold value(s)
These indicator threshold values were based on the datamining results obtained in the TARGREV project (HELCOM 2013), taking also advantage of the work carried out during the EUTRO PRO process (HELCOM 2009) and national work for EU WFD. The final threshold values were set through an expert evaluation process done by the intersessional activity on development of core eutrophication indicators (HELCOM CORE EUTRO) and the targets were adopted by the HELCOM Heads of Delegations 39/2012. For the Western and Gulf of Finland Eastern assessment units (SEA-013A and SEA-013B), threshold values were rescaled from the Gulf of Finland assessment unit (SEA-013) value used in HOLAS II (HOD 61-2021 document 5-1-Rev.1 Workspace ATT.13 Rev.1), as adopted by the HELCOM Heads of Delegations 61/ 2021. For the new assessment unit Pomeranian Bay (SEA-007B), there was no appropriate threshold available, and therefore the threshold for Bornholm Basin (SEA-007) was used. This threshold is however most likely too high, resulting in too bad a classification result.
Table 2. Assessment unit specific threshold values for the water clarity core indicator. Due to lack of separate threshold for Pomeranian Bay, the threshold for Bornholm Basin was used also for this assessment unit which has been separated from the Bornholm Basin assessment unit for HOLAS 3.
| HELCOM_ID | Assessment unit (open sea) | Threshold value (Secchi depth, m) |
| SEA-001 | Kattegat | 7.6 |
| SEA-002 | Great Belt | 8.5 |
| SEA-003 | The Sound | 8.2 |
| SEA-004 | Kiel Bay | 7.4 |
| SEA-005 | Bay of Mecklenburg | 7.1 |
| SEA-006 | Arkona Sea | 7.2 |
| SEA-007 | Bornholm Basin | 7.1 |
| SEA-007B | Pomeranian Bay | 7.1 |
| SEA-008 | Gdansk Basin | 6.5 |
| SEA-009 | Eastern Gotland Basin | 7.6 |
| SEA-010 | Western Gotland Basin | 8.4 |
| SEA-011 | Gulf of Riga | 5.0 |
| SEA-012 | Northern Baltic Proper | 7.1 |
| SEA-013A | Gulf of Finland Western | 5.9 |
| SEA-013B | Gulf of Finland Eastern | 5.3 |
| SEA-014 | Åland Sea | 6.9 |
| SEA-015 | Bothnian Sea | 6.8 |
| SEA-016 | The Quark | 6.0 |
| SEA-017 | Bothnian Bay | 5.8 |
4 Results and discussion
The results of the indicator evaluation underlying the key message map and information are provided below.
4.1 Status evaluation
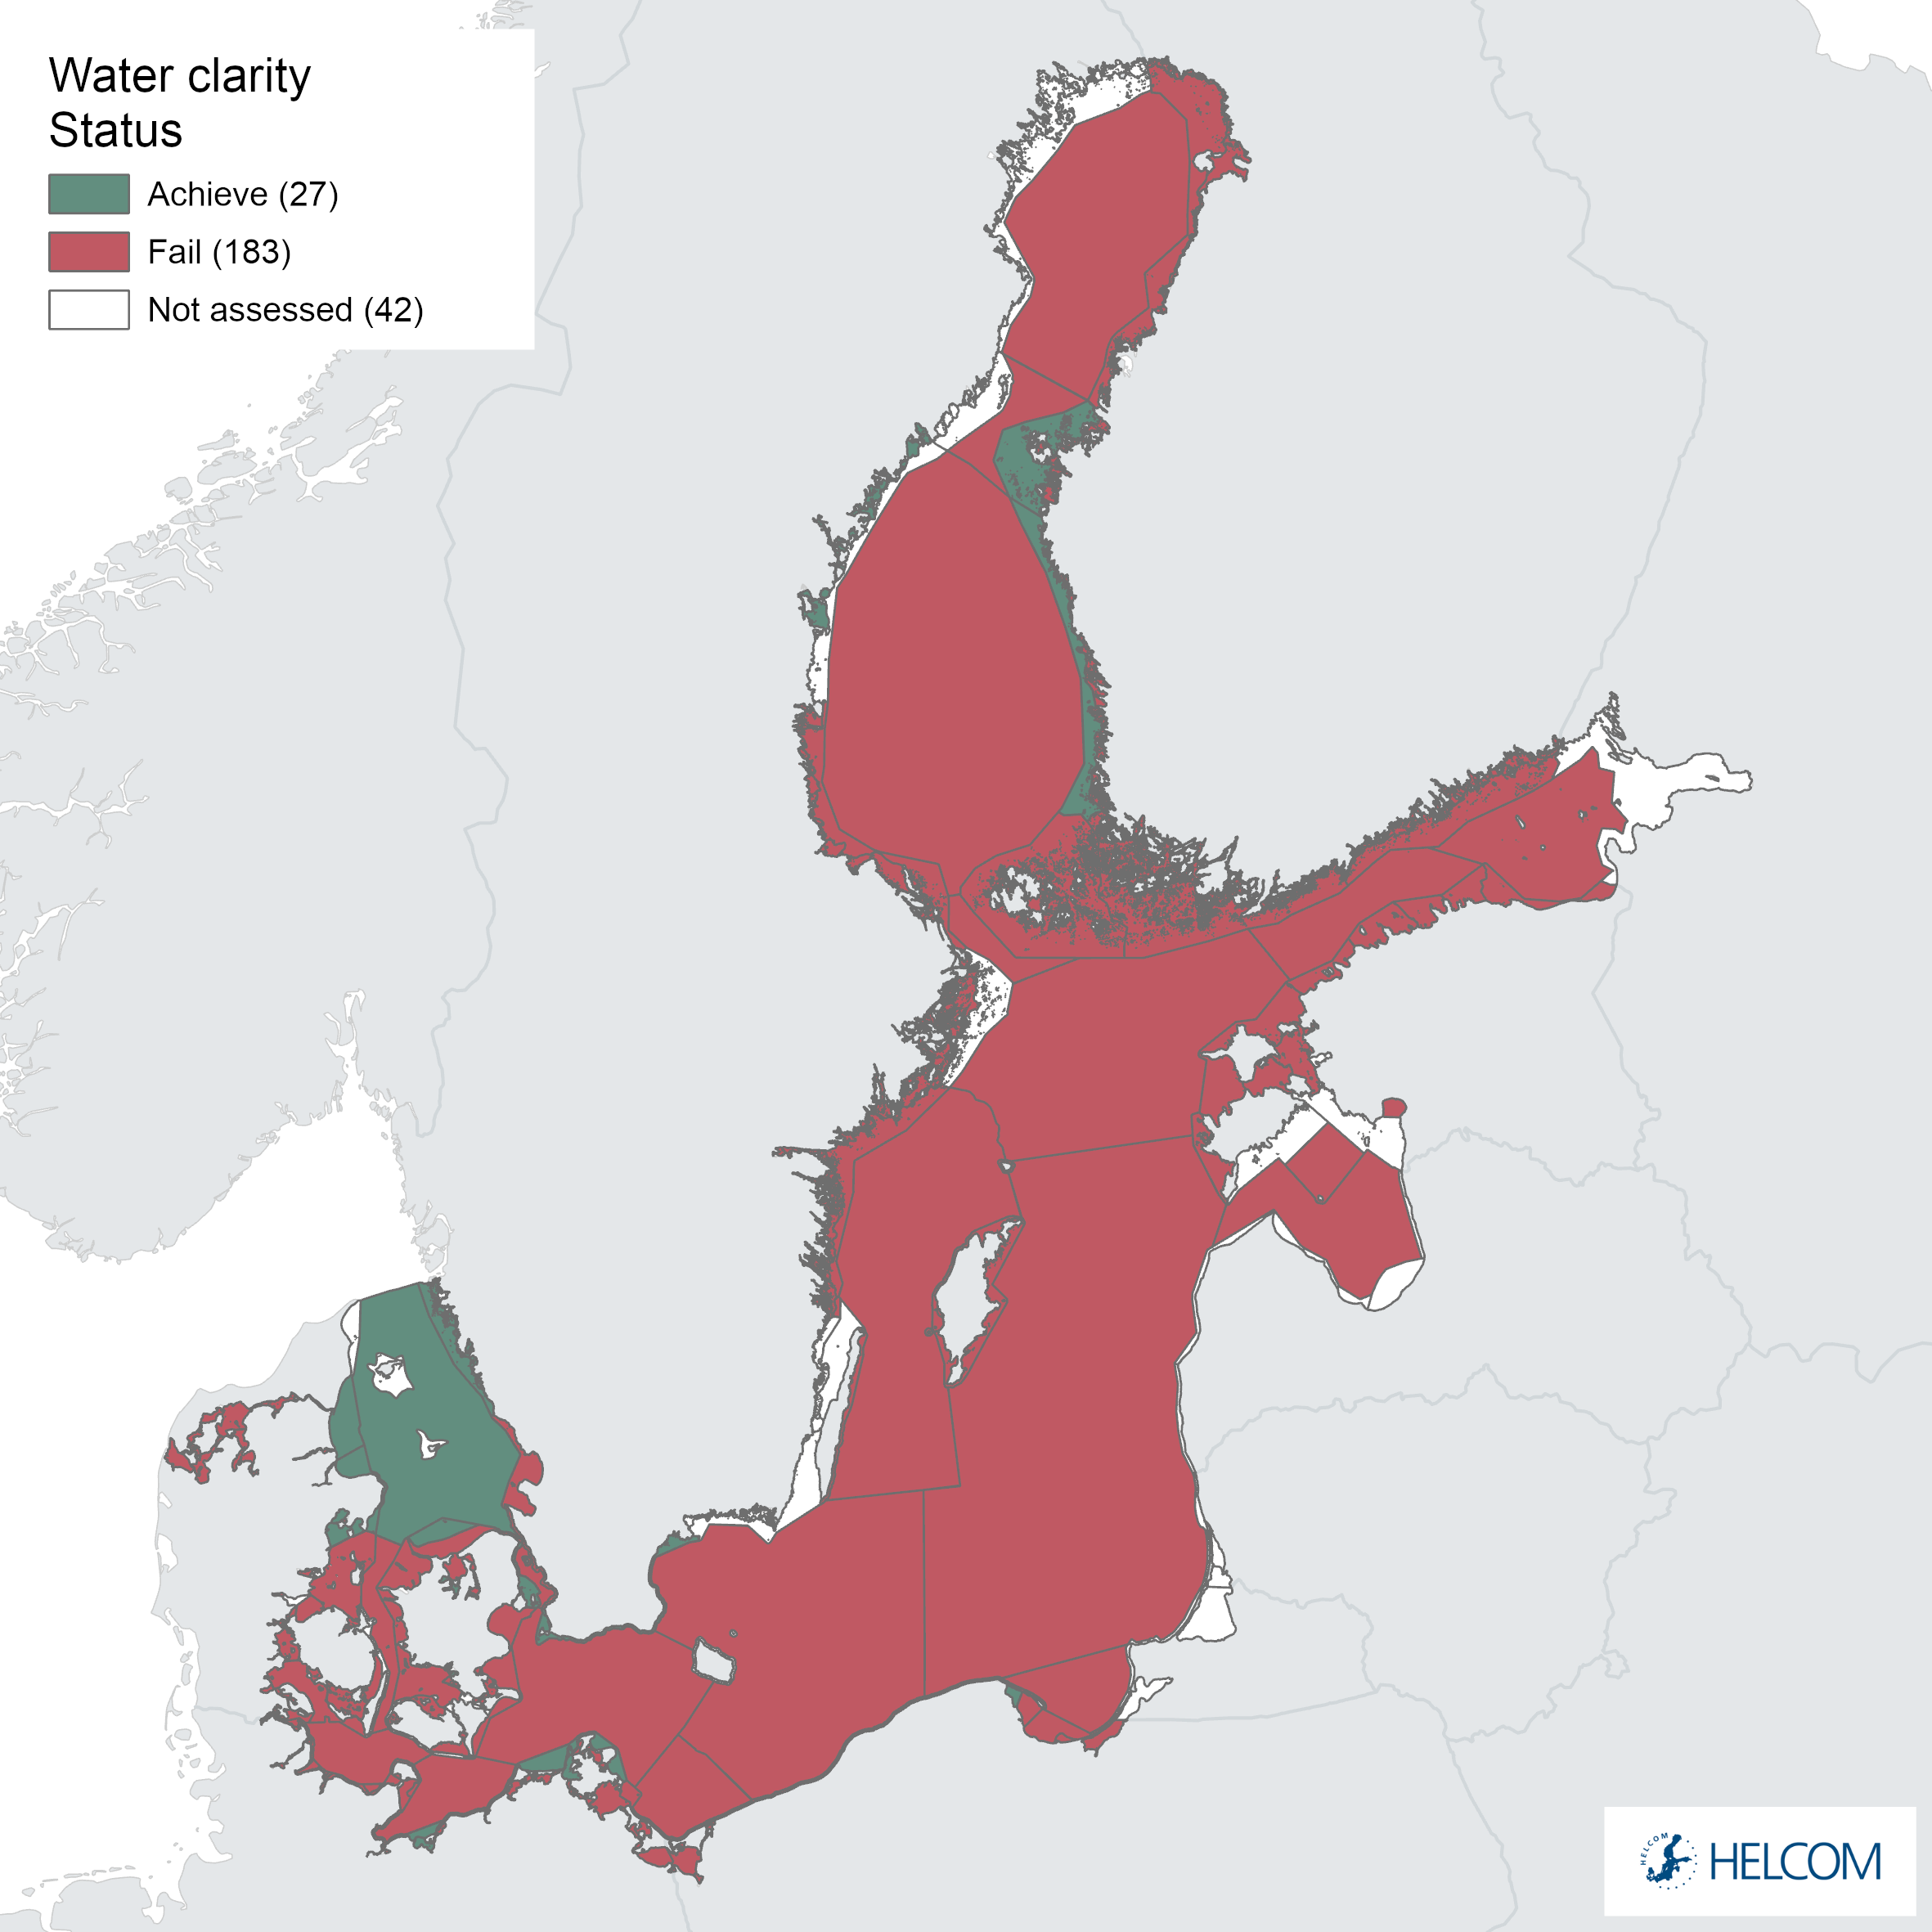
Current status of water clarity in open-sea areas
In open sea areas, good status (Secchi depth above defined threshold value, which reflects good conditions) for water clarity was achieved only in the Kattegat. The eutrophication quality ratio (EQRS) was lowest in the Pomeranian Bay (0.12), Western Gotland Basin (0.17) and Gulf of Riga (0.17). The bad status of Pomeranian Bay reflects at least in part the likely too high threshold, which was developed for Bornholm Basin, where the coastal influence is lower than in the Pomeranian Bay.
The EQRS was between 0.2 and < 0.4 in Bay of Mecklenburg, Arkona Basin, Gdansk Basin, Eastern Gotland Basin, Northern Baltic Proper, Gulf of Finland Western, Gulf of Finland Eastern and the Quark and between 0.4 and < 0.6 in the Great Belt, the Sound, Kiel Bay, Bornholm Basin, Åland Sea, Bothnian Sea and Bothnian Bay (Figure 4 and table 3). Water clarity in Kiel Bay was just below the threshold for good status. In general, the average water clarity has remained relatively constant during the assessment period (Figure 5).
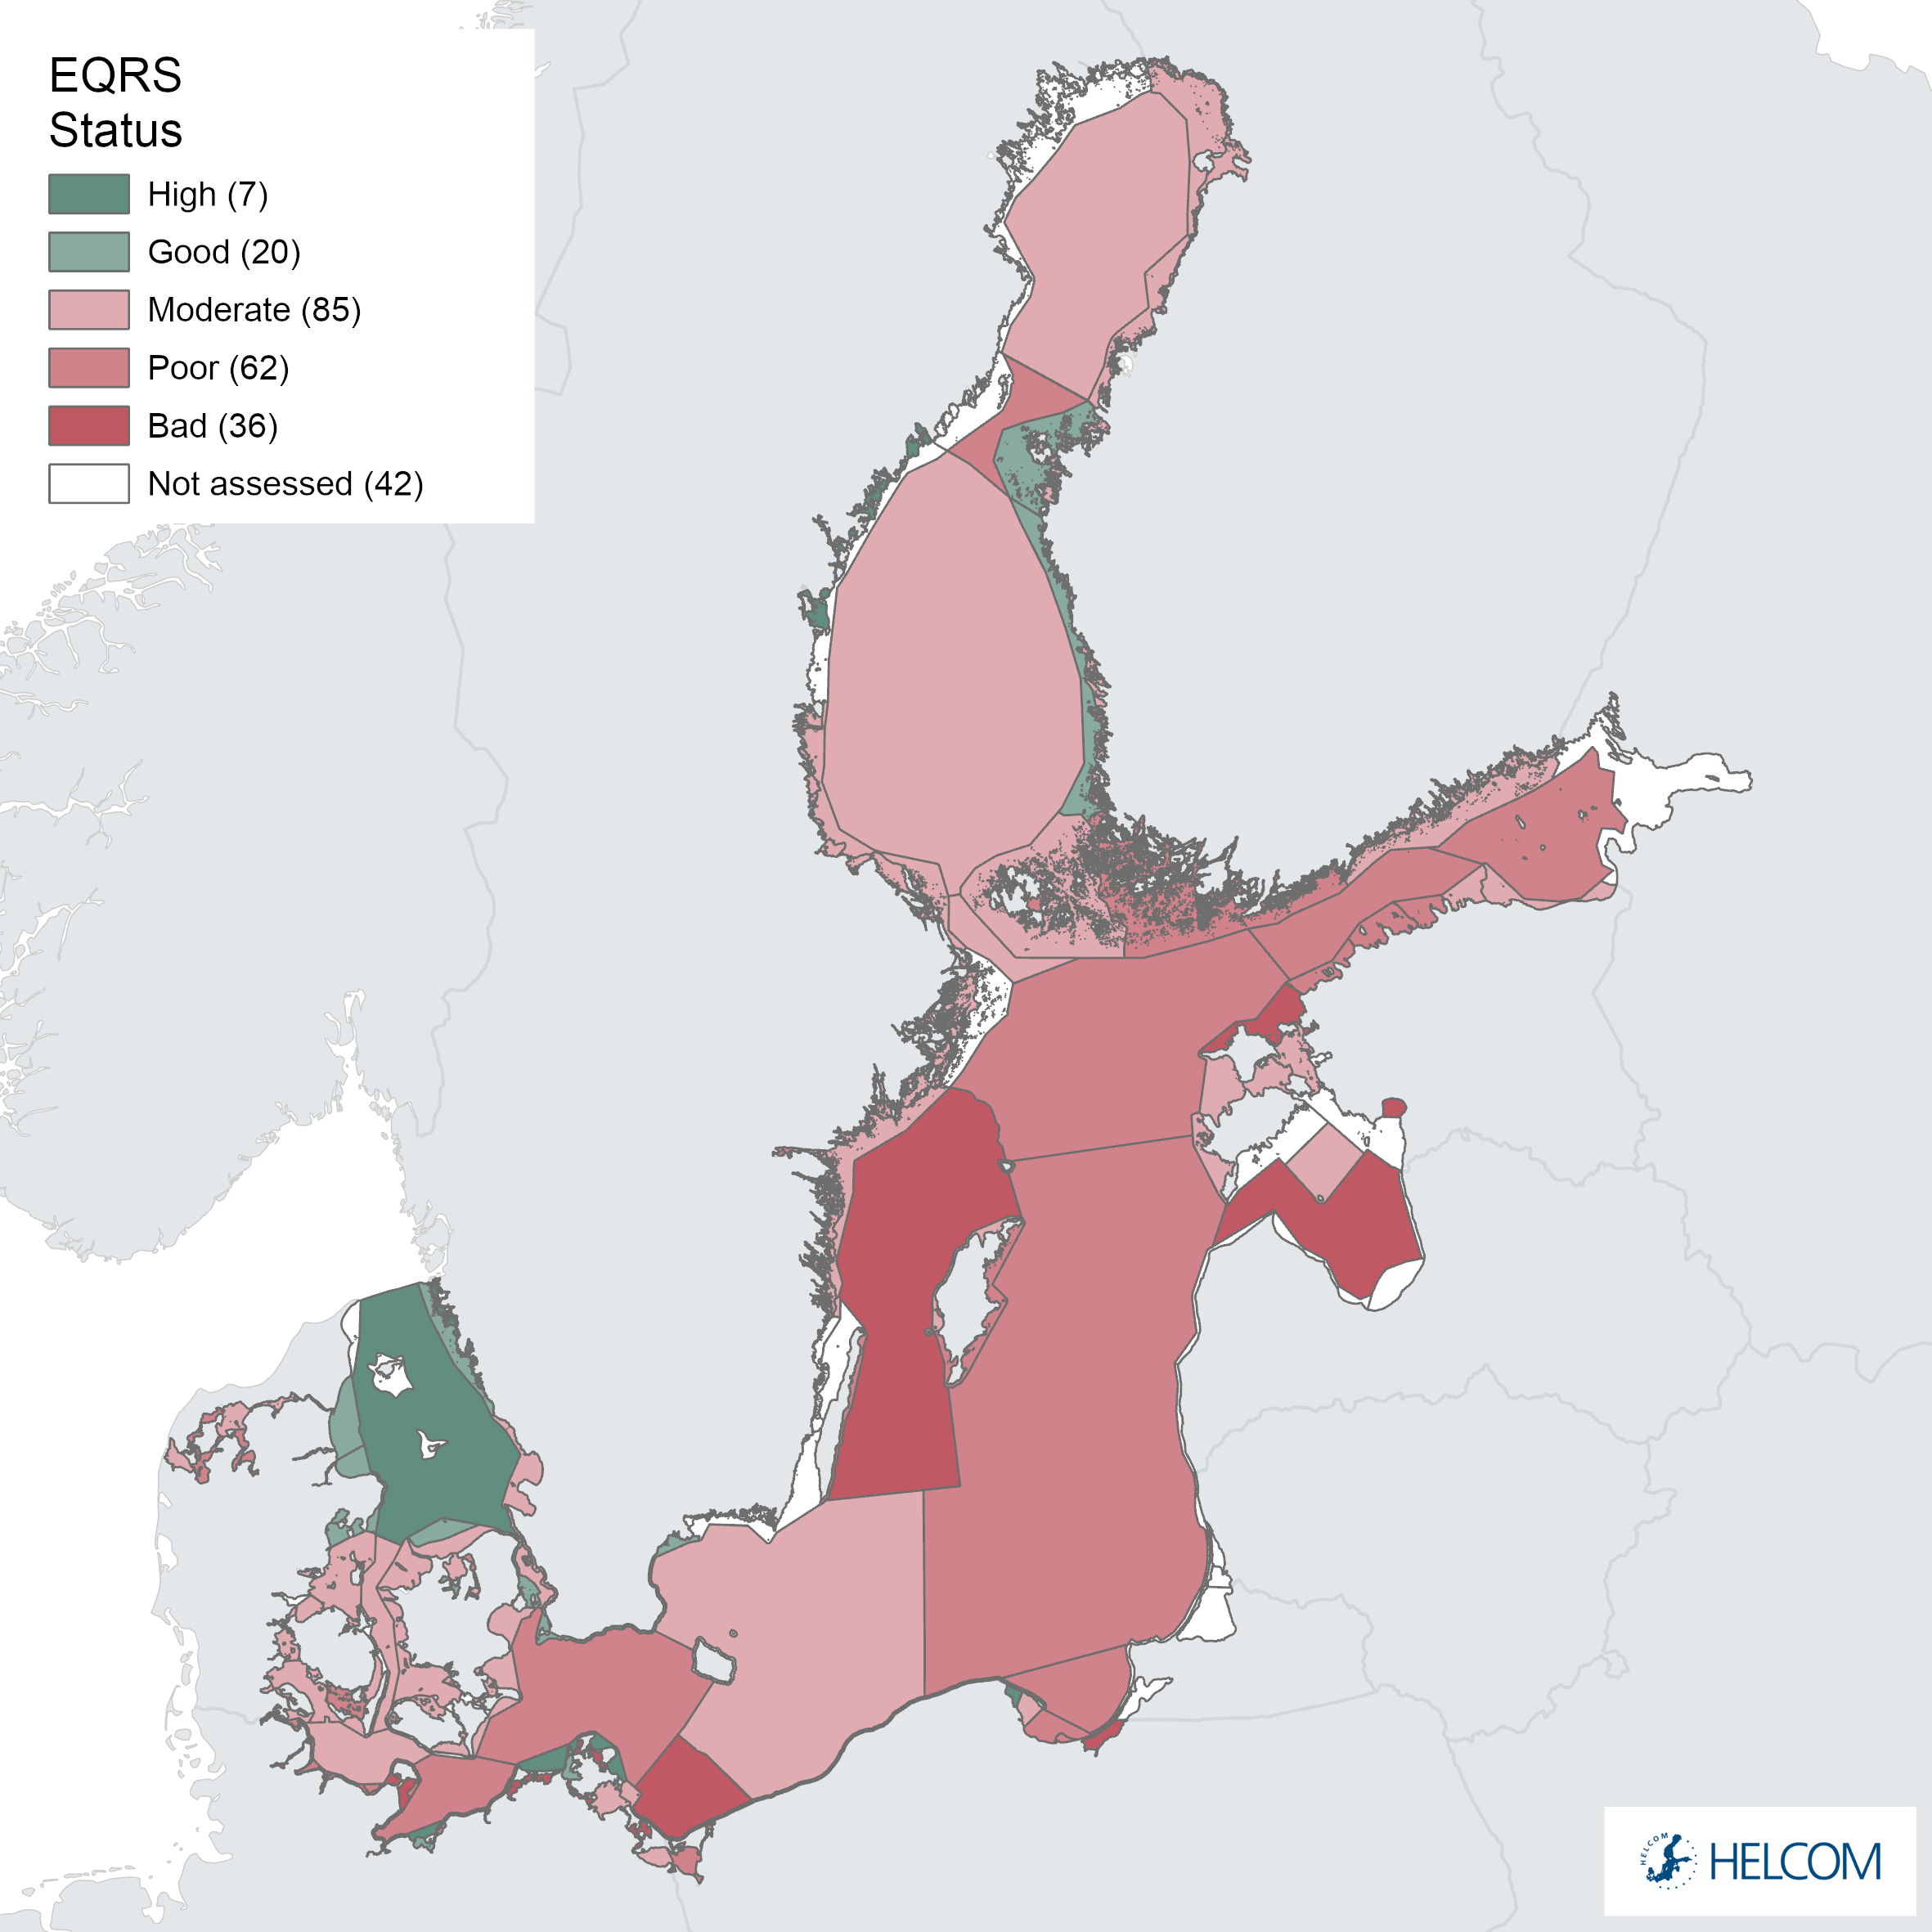
Figure 4. Status of the water clarity in 2016-2021, presented as Ecological Quality Ratio Scaled (EQRS). EQRS shows the present condition in relation to the reference value, decreasing along with increasing eutrophication. The threshold for good status value is EQRS = 0.6, with values above this threshold achieving good status.
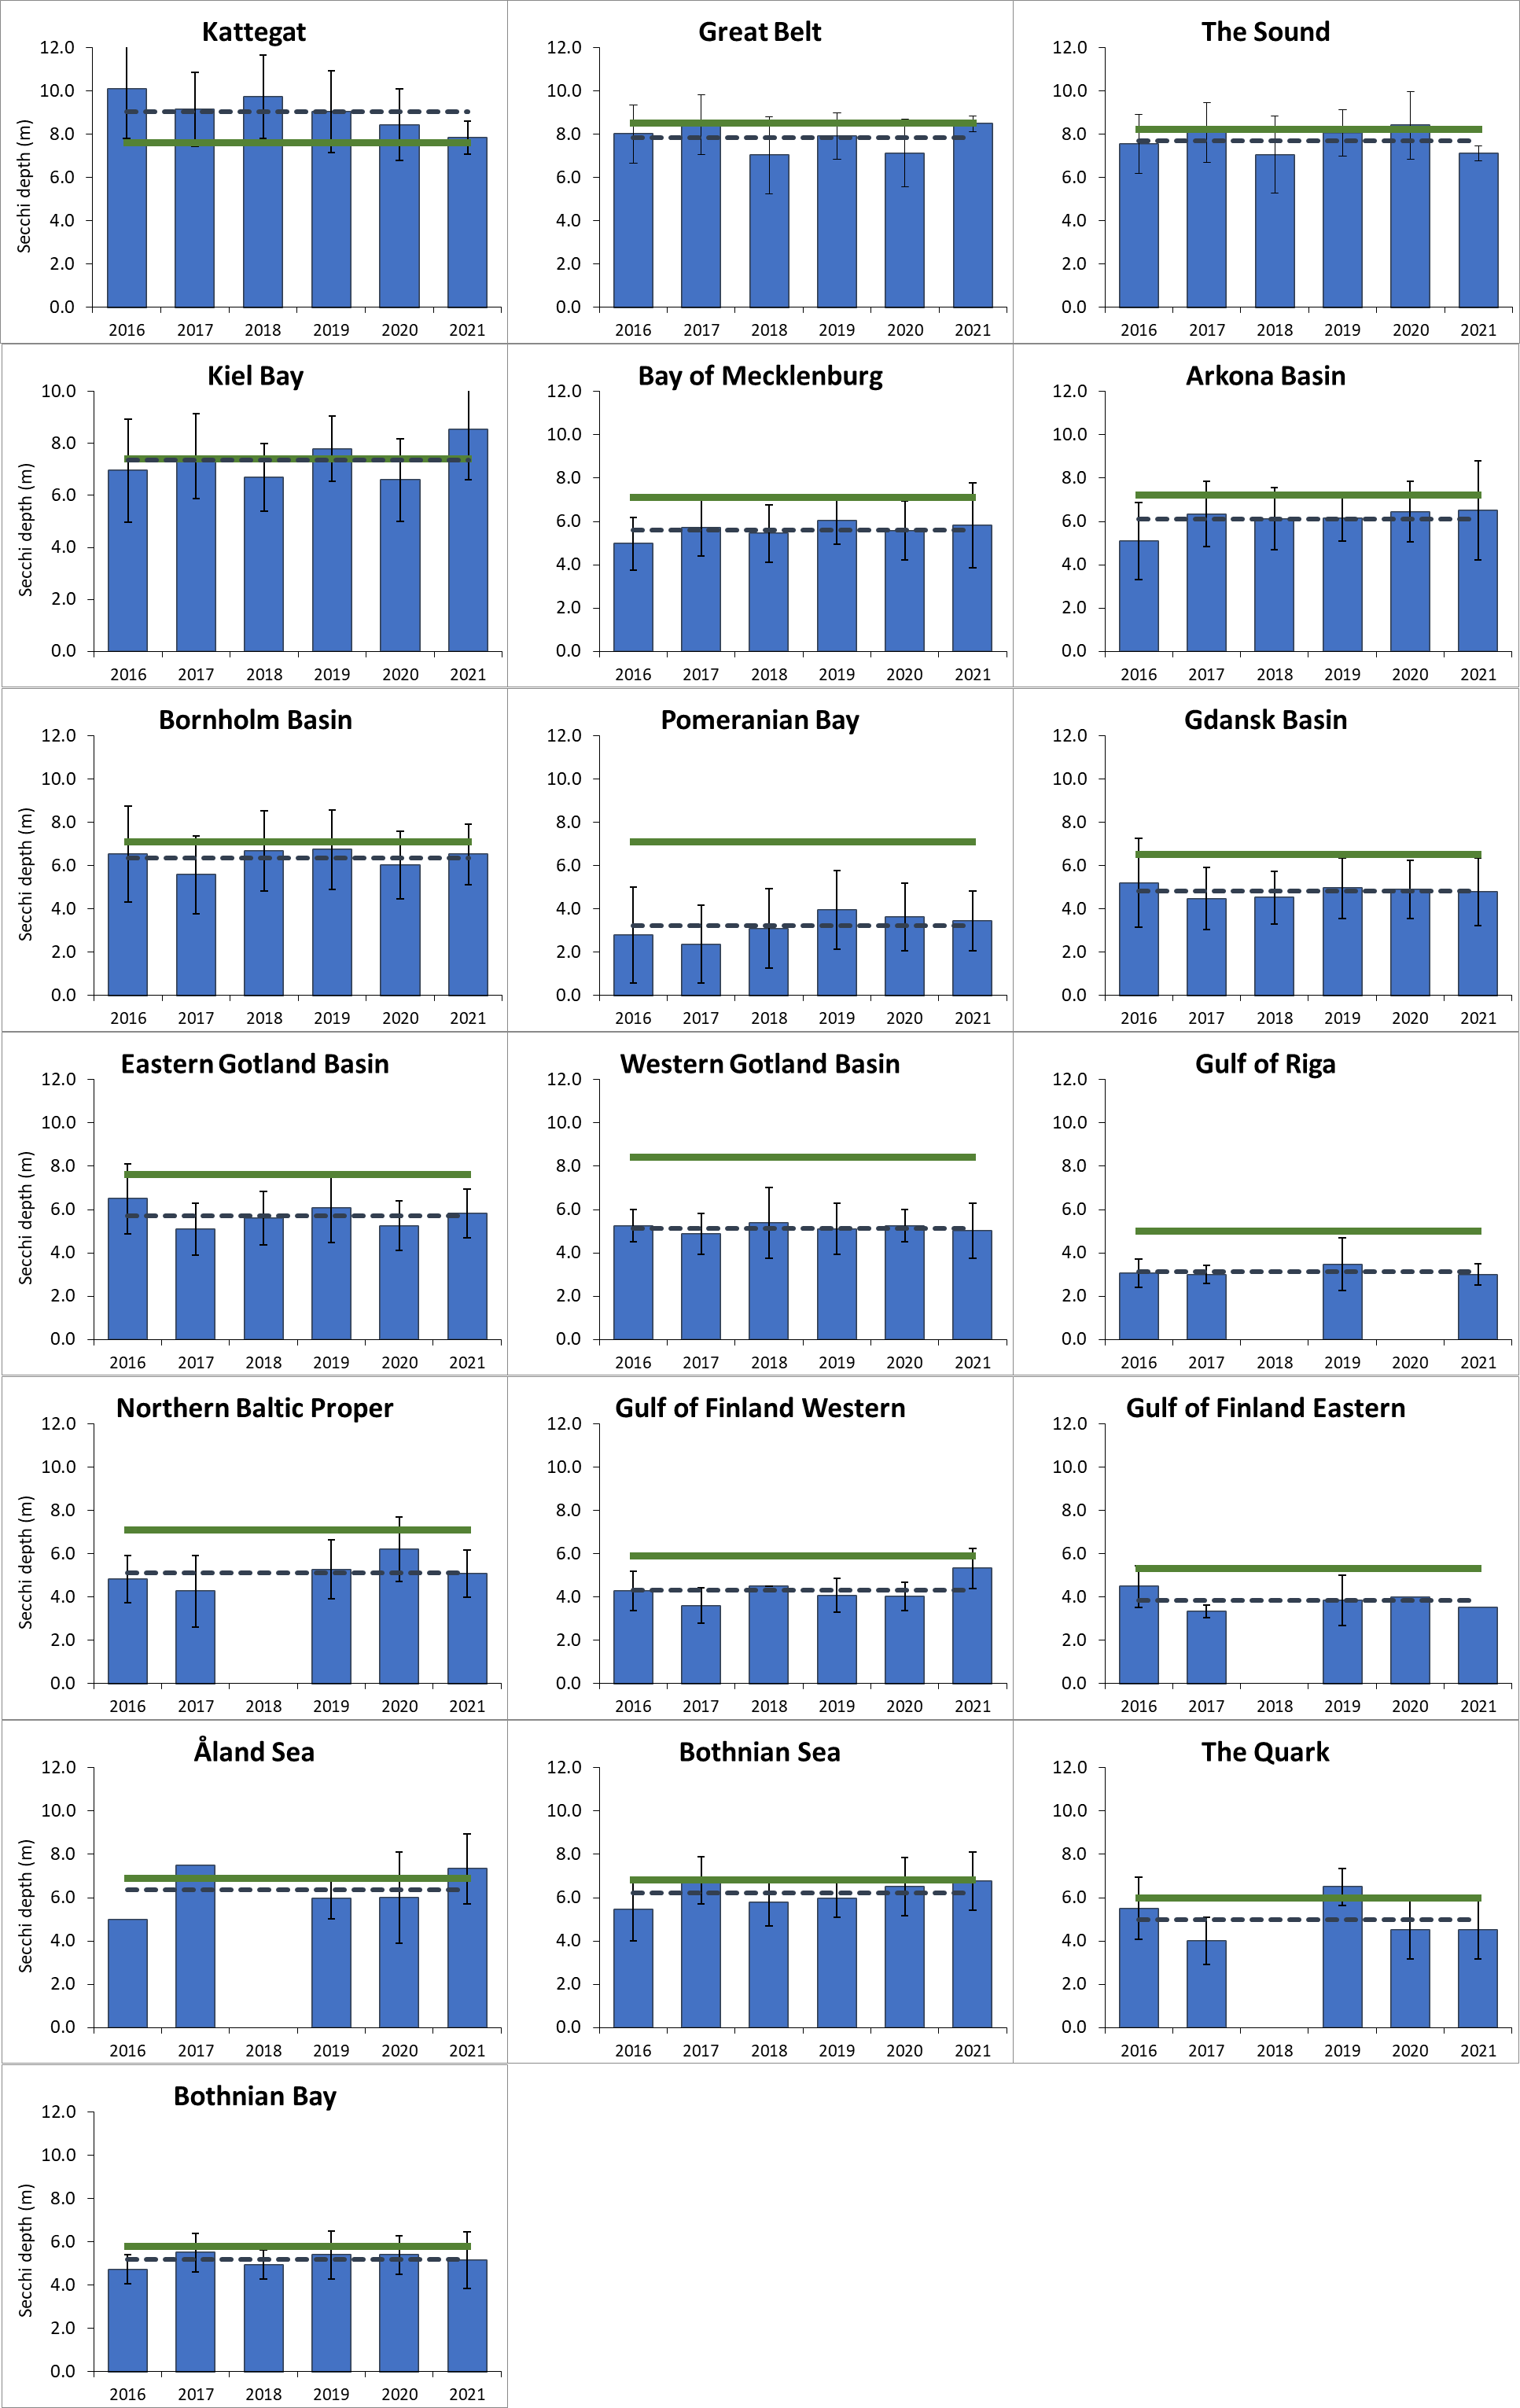
Figure 5. Average of Secchi depth for June to September for each year from 2016 to 2021 with assessment period average shown as dashed dark blue line and threshold value (green continuous line). Standard error is shown on each bar. Where no data was available an empty space is shown where the bar would be.
| Assessment unit (open sea) | Threshold (m) | Average 2016-2021 (m) | Ecological quality ratio (scaled) (EQRS) | Status (fail/achieve threshold value) |
| Kattegat | 7.6 | 9.1 | 0.86 | Achieve |
| Great Belt | 8.5 | 7.8 | 0.48 | Fail |
| The Sound | 8.2 | 7.7 | 0.51 | Fail |
| Kiel Bay | 7.4 | 7.4 | 0.59 | Fail |
| Bay of Mecklenburg | 7.1 | 5.6 | 0.29 | Fail |
| Arkona Basin | 7.2 | 6.1 | 0.38 | Fail |
| Bornholm Basin | 7.1 | 6.3 | 0.44 | Fail |
| Pomeranian Bay | 7.1 | 3.2 | 0.12 | Fail |
| Gdansk Basin | 6.5 | 4.8 | 0.23 | Fail |
| Eastern Gotland Basin | 7.6 | 5.7 | 0.25 | Fail |
| Western Gotland Basin | 8.4 | 5.1 | 0.17 | Fail |
| Gulf of Riga | 5 | 3.1 | 0.17 | Fail |
| Northern Baltic Proper | 7.1 | 5.1 | 0.23 | Fail |
| Gulf of Finland Western | 5.9 | 4.3 | 0.24 | Fail |
| Gulf of Finland Eastern | 5.3 | 3.8 | 0.23 | Fail |
| Åland Sea | 6.9 | 6.4 | 0.48 | Fail |
| Bothnian Sea | 6.8 | 6.2 | 0.47 | Fail |
| The Quark | 6 | 5.0 | 0.37 | Fail |
| Bothnian Bay | 5.8 | 5.2 | 0.50 | Fail |
Table 3. Threshold values, concentration during the assessment period (2016-2021 average), Ecological Quality Ratio Scaled (EQRS) and status of water clarity measured in Secchi Depth in the open-sea basins. EQRS is a quantitative value for the level of eutrophication, calculated from the ratio between the reference value and the present concentration. When EQRS ≥ 0.6 good status is achieved.
Indicator results in coastal waters
The coastal waters of the Baltic Sea are mostly evaluated below the threshold of good status. Yet a large proportion of the coastal waters of Kattegat have reached good status, similarly to the open-sea area. Single coastal assessment units achieving good status are found in The Sound, Mecklenburg Bight, Arkona Sea, Gdansk Basin, Bornholm Basin, Western Gotland Basin, Bothnian Sea and The Quark. The good status in the Finnish coastal areas of Bothnian Sea and Quark possibly reflects the documented positive trends in secchi depth in these areas. This may reflect the simultaneous decrease in dissolved coloured substances (iron (Fe)) (Fleming-Lehtinen et al. 2014).
4.2 Trends
Long-term trends
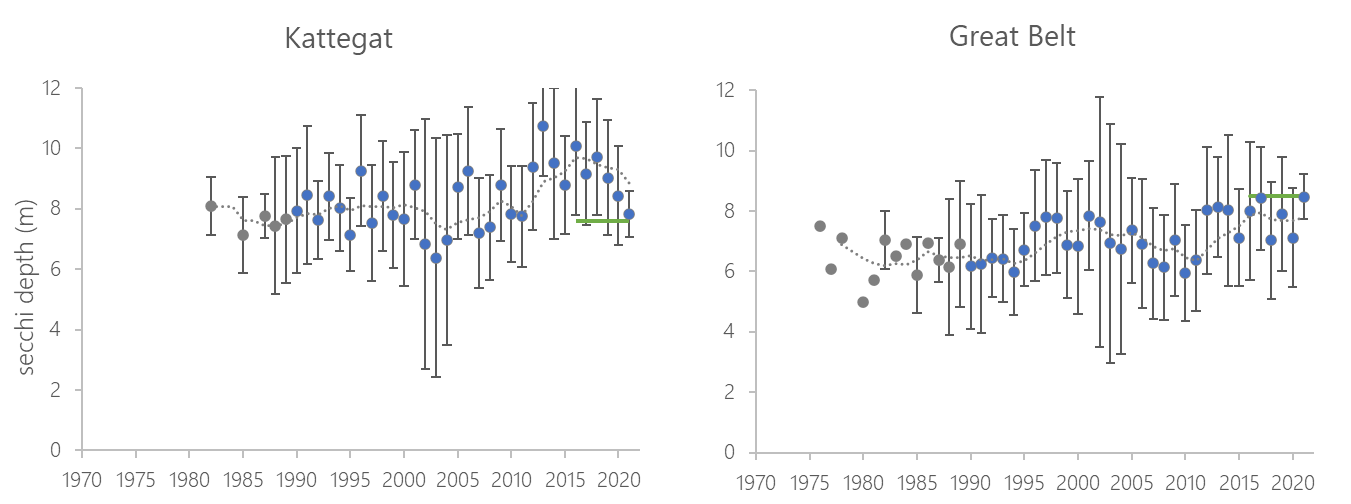
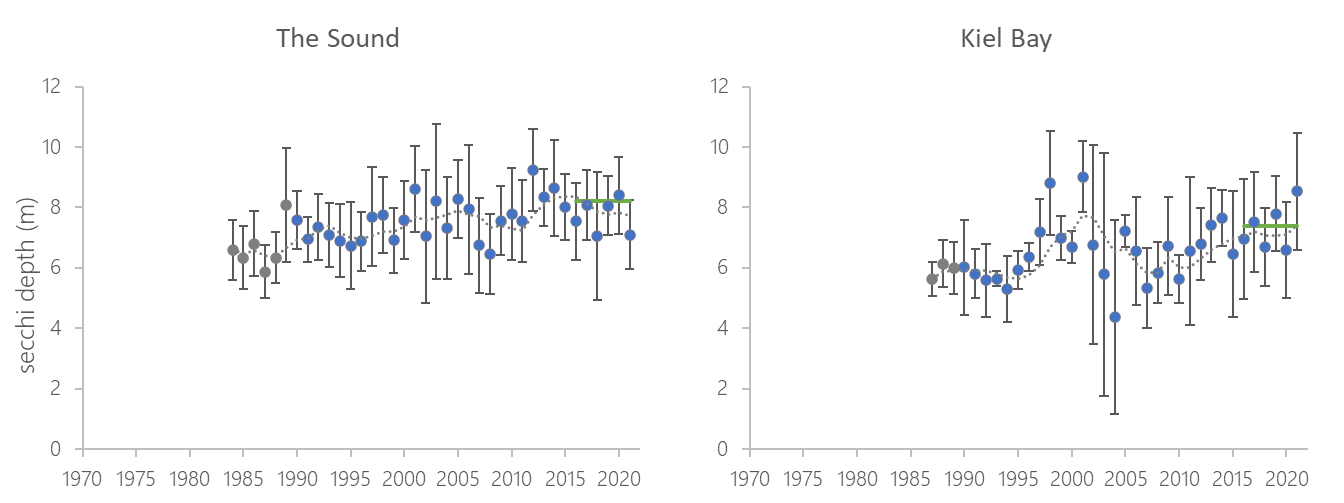
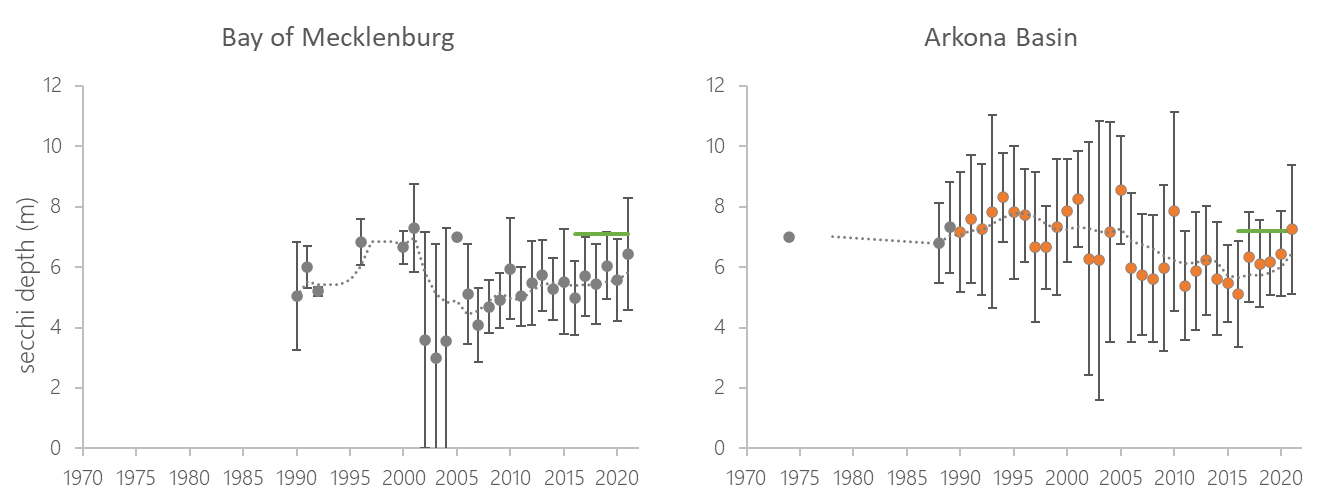
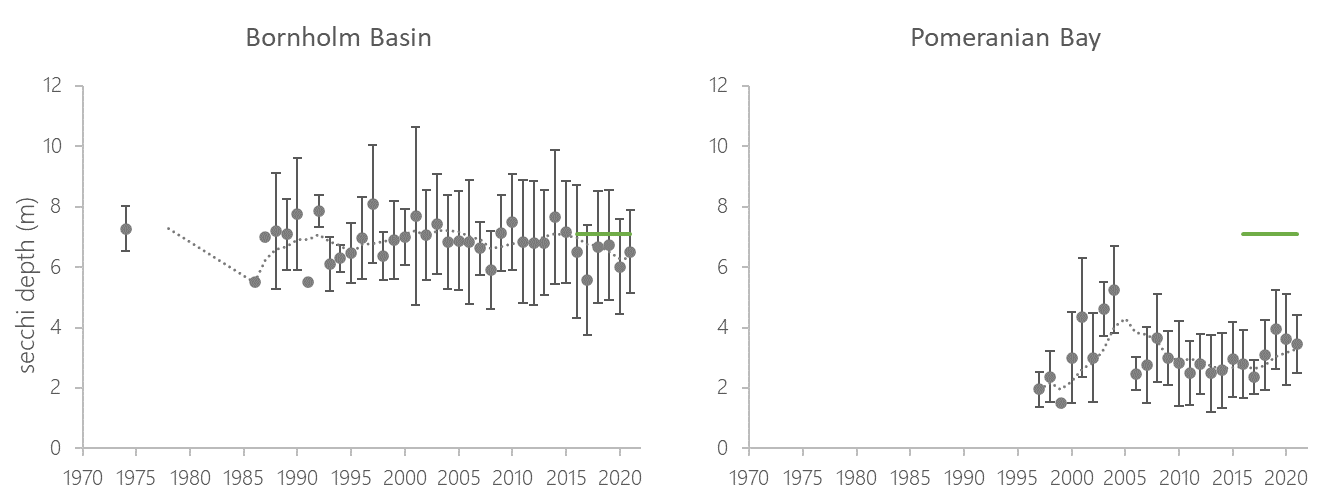
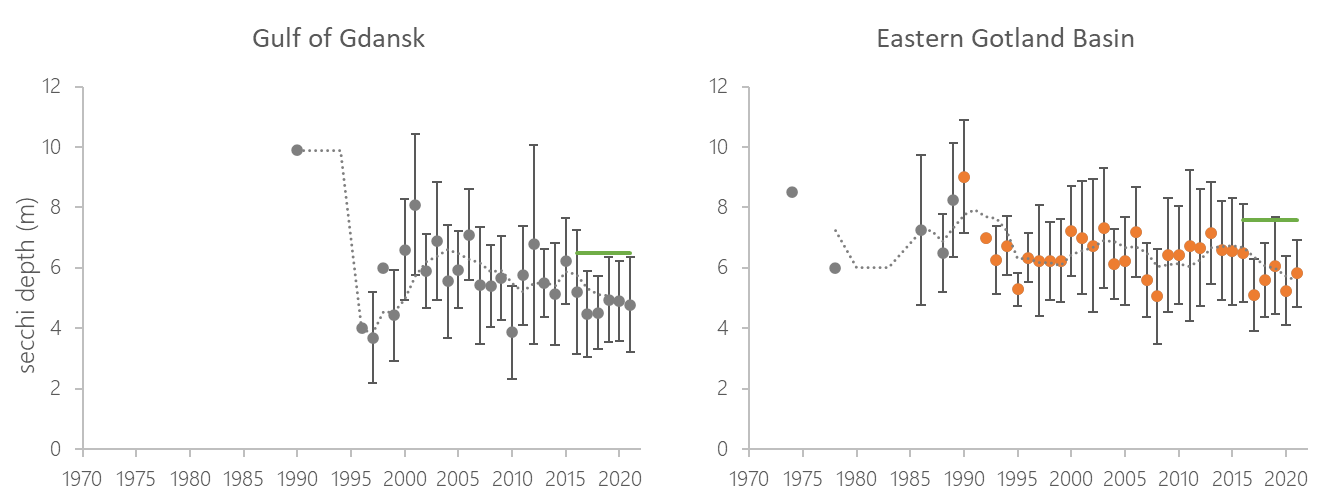
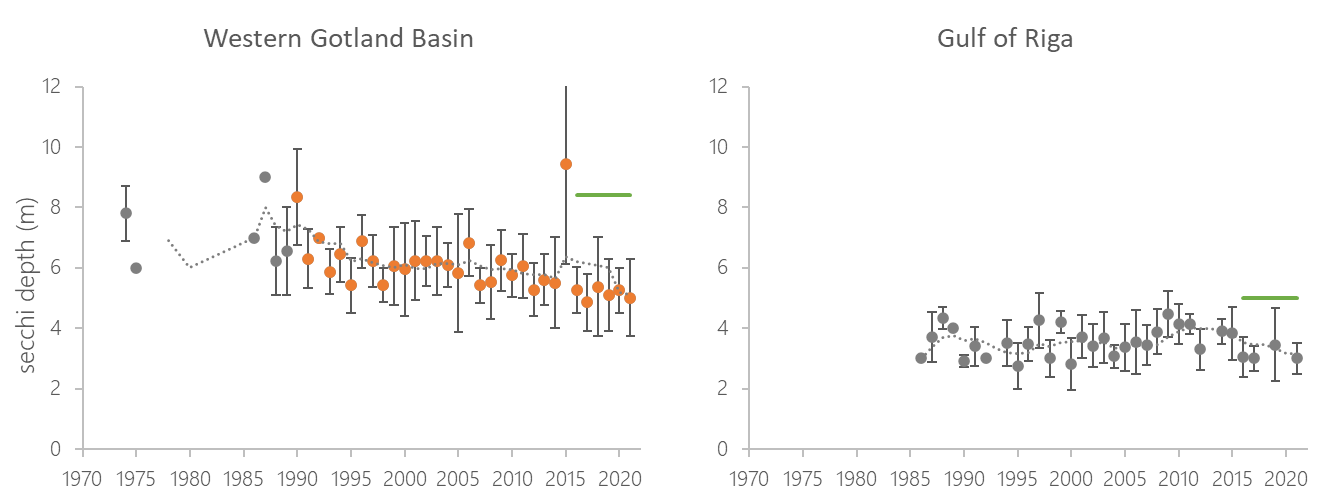
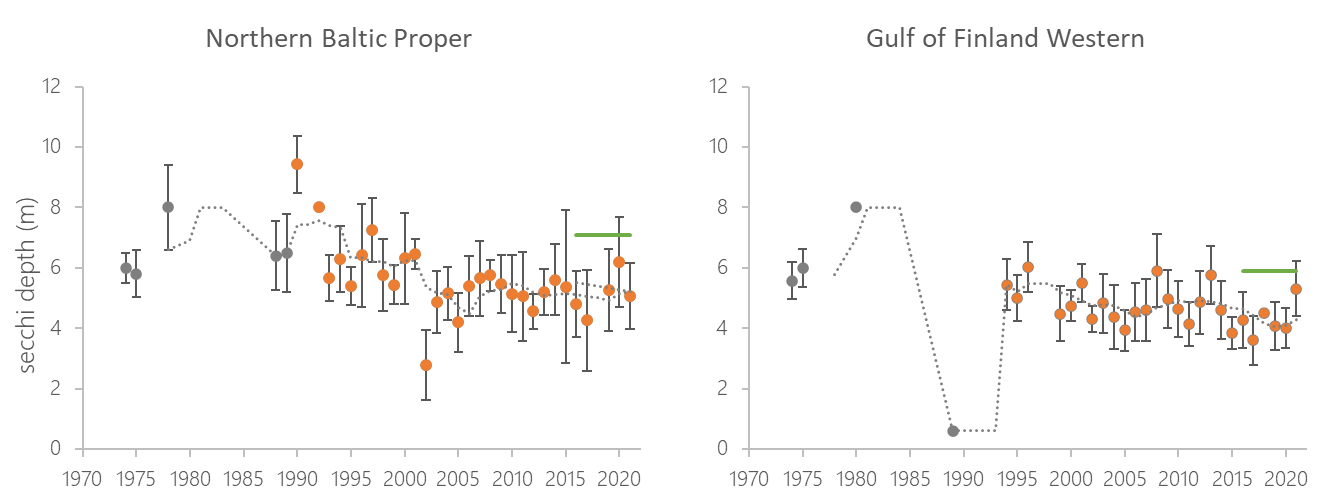
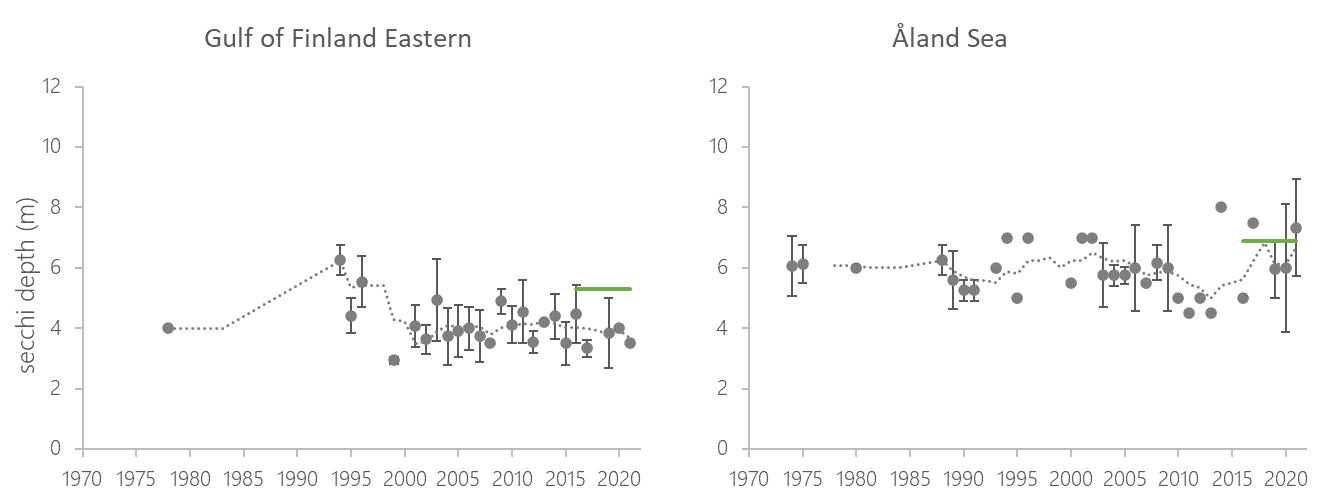
The long-term series for water clarity has shown a steadily deteriorating situation over the last century, most profoundly in the north-eastern sub-basins (Fleming-Lehtinen & Laamanen 2012). Over the past three decades from 1990-2021, water clarity has decreased significantly in five of the 19 sub-basins (Arkona Basin, Western Gotland Basin, Northern Baltic Proper, Eastern Gotland Basin and Gulf of Finland Western) (Figure 6). In the most South-Western sub-basins (Kattegat, Great Belt, The Sound and Kiel Bay) the water clarity has significantly increased, but the trend has levelled off or even reversed since about 2012 for The Kattegat, Great Belt and The Sound (Figure 7), which corresponds with an increase in chlorophyll concentrations and nitrogen inputs. The water clarity has improved significantly since the low values in early 1990s also in the Bothnian Sea. It has remained relatively stable in the rest of the assessment units.
 ’
’ 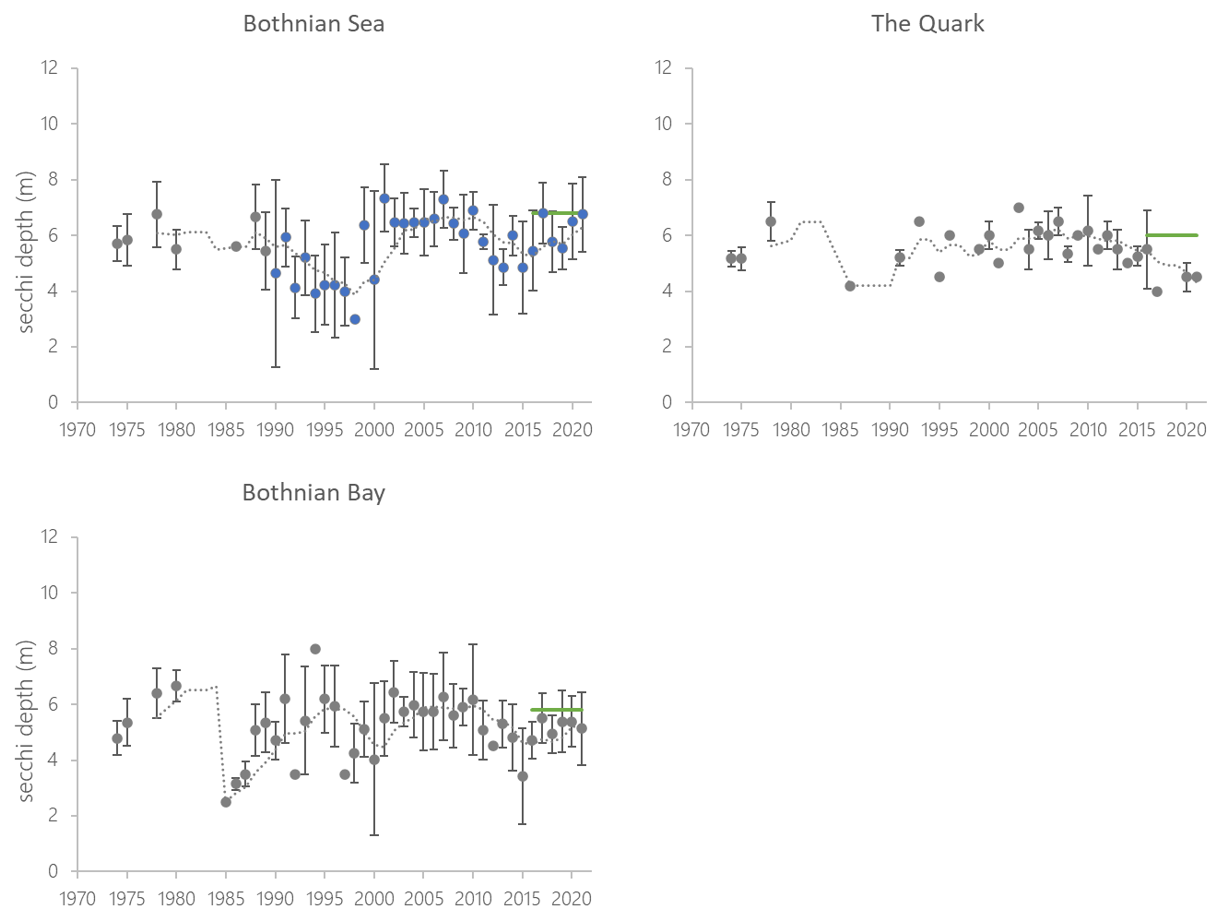
Figure 6. Temporal development of water clarity (measured as Secchi depth in summer) in open sea assessment units from 1970s to 2021. Dashed lines show the five-year moving averages and error bars the standard deviations. Green lines indicate the indicator threshold values. Significance of trends was assessed with a Mann-Kendall non-parametric tests for the period from 1990-2021. Significant (p<0.05) improving trends are indicated with blue and deteriorating trends with orange colour.
4.3 Discussion text
Assessment results for water clarity were compared between the latest two assessments of HOLAS II and HOLAS 3. The Sound was the only assessment unit that changed its status from achieving good status to failing good status, reflecting the reversal of positive development in this assessment unit since about 2012 (Results Table 2, Results Figure 4). Seven assessment units had improving status, three assessment units had stable status and nine assessment units had deteriorating status.
Table 4. Evaluations of the water clarity indicator during the HOLAS II and HOLAS 3 periods, coloured red or green depending on whether the assessment unit fails or achieves the threshold, respectively. The trend from the previous to present assessment period is addressed alongside a description of outcome (a change of 15 % is deemed significant).
5 Confidence
Confidence of the indicator status evaluation
The confidence of the indicator status evaluation is based on the spatial-, and temporal coverage of data as well as the accuracy of the classification result. The Quark, Åland Sea, Gulf of Finland Western, Gulf of Finland Eastern and Gulf of Riga assessments were determined to be of low overall confidence. High overall confidence was found in the Southwestern assessment units (Kattegat, Great Belt, Kiel Bay, Bay of Mecklenburg, Arkona Basin and Bornholm Basin). In the remaining open-sea basins, the overall Confidence was moderate for the indicator.
Accuracy was high in all assessment units, aside from Åland Sea, which was moderate, due to a very low amount of samples (7) and relatively high standard error. Spatial confidence was low in most of the assessment units. It was High in the Kattegat, Bay of Mecklenburg and Arkona Basin, and moderate in Kiel Bay and Gulf of Gdansk. Temporal confidence was high in most of the assessment units, but moderate in the Gulf of Gdansk and low in the Northern Baltic Proper, Gulf of Finland Western and Eastern, Gulf of Riga, Åland Sea and the Quark.
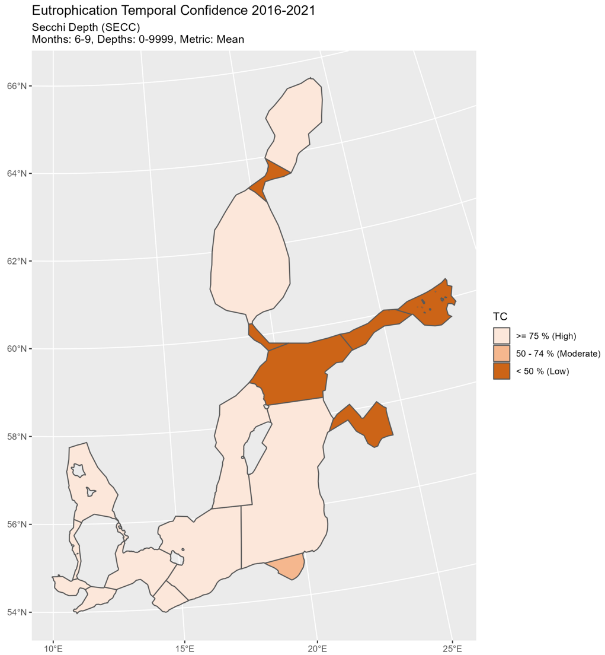
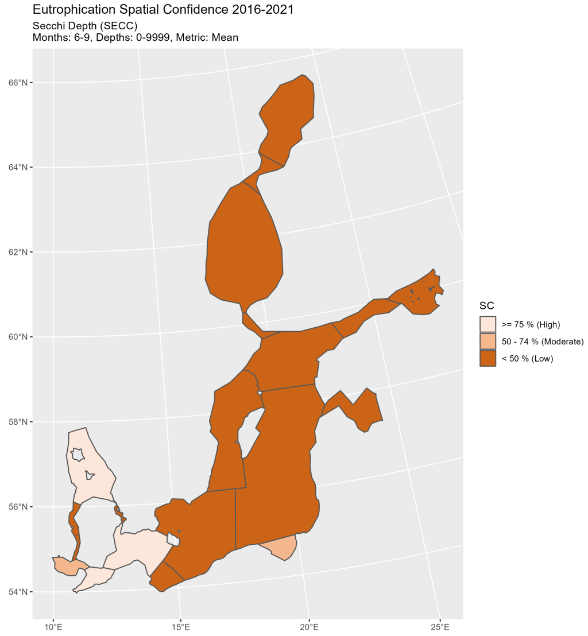
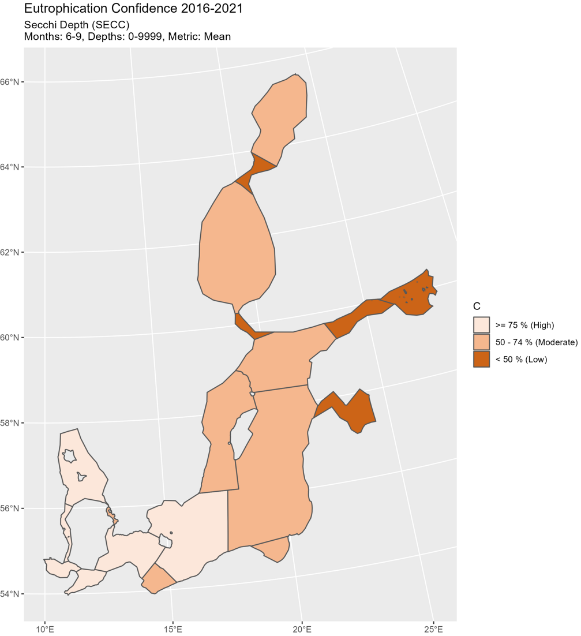
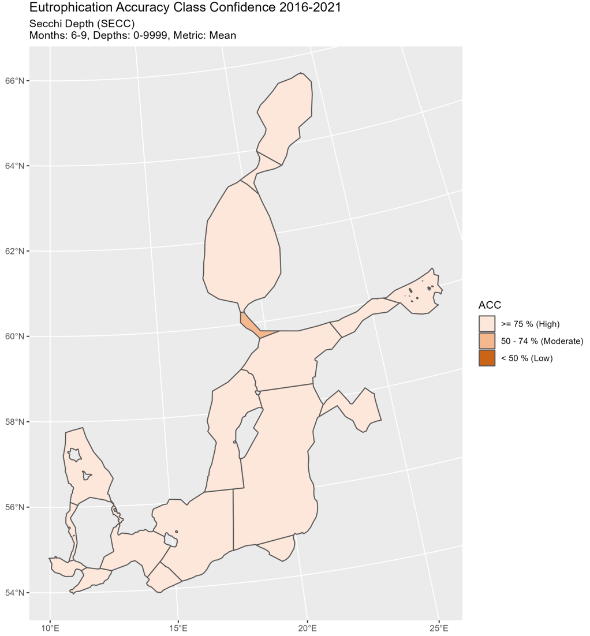
Figure 7. Indicator confidence (C), determined by combining information on spatial and temporal confidence and the confidence on accuracy of the GES evaluation, accuracy confidence (ACC), spatial confidence (SC) and temporal confidence (TC). Low indicator confidence calls for increase in monitoring.
6 Drivers, Activities, and Pressures
Water clarity in the Baltic Sea is affected mainly by the concentration of phytoplankton and chromophoric dissolved organic matter (CDOM). Of these, phytoplankton concentration is directly linked to anthropogenic pressures, i.e.. nutrient increase.
For HOLAS 3 initial work has been carried out to explore Drivers (and driver indicators) to evaluate how such information can be utilised within the DAPSIM management framework. It is recognised that only a small portion of the drivers via proxies such as relevant human activities have been addressed for eutrophication assessment. Wastewater treatment (Drivers and driver indicators for Wastewater Treatment) and agriculture (Drivers and driver indicators for Agricultural Nutrient Balance) have been explored in these pilot studies for HOLAS 3.
Diffuse sources constitute the highest proportion of total nitrogen (nearly 50%) and total phosphorus (about 56%) inputs to the Baltic Sea (HELCOM 2022a). For total nitrogen, atmospheric deposition on the sea has the second highest share (24%) followed by natural background loads (20%) and point sources (9%). Natural background loads have the second highest share of total phosphorus inputs to the Baltic Sea (20%), followed by point sources (17%) and atmospheric deposition (7%). Point sources include activities such as municipal wastewater treatment plants, industrial plants and aquacultural plants and diffuse sources consists of anthropogenic sources as agriculture, managed forestry, scattered dwellings, storm water etc.
A significant reduction of nutrient inputs has been achieved for the whole Baltic Sea. The normalized total input of nitrogen was reduced by 12% and phosphorus by 28 % between the reference period (1997-2003) and 2020 (HELCOM 2023). The maximum allowable input (MAI) of nitrogen in this period was fulfilled in the Bothnian Bay, Bothnian Sea, Danish Straits and Kattegat and the maximum allowable input of phosphorus in the Bothnian Bay, Bothnian Sea, Danish Straits and Kattegat.
Further developing an overview of such components and the relevant data to be able to better quantify the linkages within a causal framework provide the opportunity for more informed management decisions, for example targeting of measures, and can thereby support the achievement of Good Environmental Status.
Table 5. Brief summary of relevant pressures and activities with relevance to the indicator.
| | General | Activity: MSFD Annex III, Table 2b | Pressure: MSFD Annex III, Table 2a |
| Strong link | Cultivation of living resources; Transport; Urban and industrial uses; Physical restructuring of rivers, coastline or seabed (water management) | Input of nutrients; input of organic matter | |
| Weak link |
7 Climate change and other factors
The current knowledge of the effects of climate change to eutrophication is summarized in the HELCOM fact sheet for climate change (HELCOM and Baltic Earth 2021). The effect of climate change to the nutrient pools is not yet separable from the other pressures, and the future nutrient pools will dominantly be affected by the development of nutrient loading. The phytoplankton growth season has already prolonged due to changes in cloud cover and stratification. Climate change is, with medium confidence, considered to increase the stratification, further deteriorate near-bottom oxygen conditions and increase the internal nutrient loading. Increase in riverine dissolved organic carbon (DOC) discharge may also decrease the water clarity.
8 Conclusions
The status evaluation fails to achieve good status in all sub-basins except for Kattegat.
8.1 Future work or improvements needed
This indicator is fully operational and maintaining good monitoring is an important factor but the indicator evaluation itself is functional. The indicator should in the future be developed to include satellite remote sensing data for water clarity. For Pomeranian Bay a suitable threshold value needs to be developed. Furthermore, a better harmonisation of the thresholds for Secchi depth between coastal waters and the open Baltic Sea Basins might be necessary in the future, in particular in areas where coastal waters are already assessed as achieving good status while the open basins still fail to achieve good status.
9 Methodology
9.1 Scale of assessment
The core indicator is applicable in the 19 open sea assessment units (from one nautical mile from the baseline seawards).
The assessment units are defined in the HELCOM Monitoring and Assessment Strategy Annex 4.
9.2 Methodology applied
The open-sea core indicators are updated using data reported by Contracting Parties to the HELCOM COMBINE database hosted by ICES, using the algorithms developed for the eutrophication assessment work flow. The values are achieved using indicator specifications shown in Table 6 (see HELCOM Eutrophication assessment manual).
Table 6. Specifications of the core indicator water clarity.
| Indicator | Water clarity | ||||||||||||||||||||||||||||
| Response to eutrophication | negative | ||||||||||||||||||||||||||||
| Parameters | Secchi depth (m) | ||||||||||||||||||||||||||||
| Data source | Monitoring data provided by the HELCOM Contracting Parties, and kept in the HELCOM COMBINE database, hosted by ICES (www.ices.dk) | ||||||||||||||||||||||||||||
| Assessment period | 2016 – 2021 | ||||||||||||||||||||||||||||
| Assessment season | Summer = June + July + August + September | ||||||||||||||||||||||||||||
| Depth | – | ||||||||||||||||||||||||||||
| Removing outliers | No outliers removed | ||||||||||||||||||||||||||||
| Removing close observations | No close observations removed | ||||||||||||||||||||||||||||
| Indicator level | average of annual values for the average from June to September | ||||||||||||||||||||||||||||
| Eutrophication quality ratio (EQR) | EQR = ES/ BEST,
where BEST= ET / (1 – ACDEV / 100) ET= threshold (table 1) ACDEV= acceptable deviation: 25 % for water clarity
The final EQRS values are scaled to five classes of 0.2 width. |
||||||||||||||||||||||||||||
| Indicator confidence | The confidence assessment for eutrophication indicators is included in HEAT, and includes aspects of temporal, spatial and accuracy confidence. The general methodology of the confidence assessment is described in Document 4.2 of IN-Eutrophication 16-2020 and updates are described in documents 4J-80 of State & Conservation 14-2021 and 4-2 of EG-Eutrophication 20-2021. The R-code is available via https://github.com/ices-tools-prod/HEAT.
The overall indicator confidence is calculated as the average of the aspects of temporal, spatial and accuracy confidence. The evaluation criteria for temporal confidence are given in the table below.
If the specific temporal confidence is high (100) for at least half of the assessed years, it is set as high (100) for the assessment period. The total temporal confidence is the average of the general and specific temporal confidence aspects. The evaluation criteria for spatial confidence are given in the table below.
The accuracy aspect assesses the probability of correct classification (the classification being below or above the threshold for good status). The evaluation criteria for accuracy aspect are given in table below.
|
In the eutrophication assessment, water clarity is included in criteria group “indirect effects” with bottom conditions (oxygen and benthic macrofauna indicators). The indicators were weighted according to their relevance for eutrophication in each sub-basin. As a general principle, the bottom conditions were given double the weight of water clarity due to their strong ecological significance (STATE & CONSERVATION 17-2022, document 5J-23 Rev.1).
For Secchi depth, the weight was further adjusted according to the available information on the light absorption by colored dissolved organic matter (CDOM) and the relationship between CDOM absorption and chlorophyll a concentration in the assessment unit (Table 7). Higher absorption of light by CDOM makes water clarity a less reliable indicator of eutrophication. Therefore, water clarity received a smaller weight in the basins with high CDOM concentration: the Gulf of Finland, Gulf of Riga and Gulf of Bothnia.
Table 7. Water clarity and bottom conditions (oxygen and benthic macrofauna indicators) have been weighted in eutrophication assessment according to available information on CDOM absorption of light and the relationship between CDOM light absorption and chlorophyll a (chl-a) concentration in the sub-basin. As a general principle, bottom conditions were given twice the weight of water clarity.
| Basin | Weight of water clarity | Justification (1) Stedmon et al. 2000, 2) Ylöstalo et al. 2012) |
| Kattegat | 0.34 | No info |
| The Sound | 0.34 | Low CDOM absorption 1 |
| Great Belt | 0.34 | Low CDOM absorption 1 |
| Little Belt | 0.34 | Low CDOM absorption 1 |
| Kiel Bay | 0.34 | Assumed similar as in the Belts and Arkona Sea |
| Mecklenburg Bight | 0.34 | Assumed similar as in the Belts and Arkona Sea |
| Arkona Sea | 0.34 | Low CDOM absorption 2, medium in relation to chl-a |
| Bornholm Basin | 0.34 | Low CDOM absorption 2, medium in relation to chl-a |
| Pomeranian Bay | 0.20 | Threshold values for water clarity is not adapted for the assessment unit |
| Eastern Gotland Basin | 0.34 | Assumed similar as in the Northern Baltic Proper |
| Western Gotland Basin | 0.34 | Low CDOM absorption 2, medium in relation to chl-a |
| Gdansk Basin | 0.34 | No info |
| Gulf of Riga | 0.20 | Extremely high CDOM absorption 2, high in relation to chl-a. |
| Northern Baltic Proper | 0.34 | Medium CDOM absorption 2, medium in relation to chl-a |
| Gulf of Finland Western | 0.20 | High CDOM absorption 2, medium in relation to chl-a |
| Gulf of Finland Eastern | 0.20 | High CDOM absorption 2, medium in relation to chl-a |
| Åland Sea | 0.34 | Assumed similar as in the Northern Baltic Proper |
| Bothnian Sea | 0.20 | Medium CDOM absorption 2, medium-high in relation to chl-a |
| The Quark | 0.20 | Assumed to be similar as in the Bothnian Sea |
| Bothnian Bay | 0.10 | High CDOM absorption 2, extremely high in relation to chl-a. |
9.3 Monitoring and reporting requirements
Monitoring methodology
Monitoring of water clarity in the Contracting Parties of HELCOM is described on a general level in the HELCOM Monitoring Manual in the sub-programme Water column hydrological characteristics.
Monitoring guidelines specifying the sampling strategy are adopted and published.
Current monitoring
The monitoring activities relevant to the indicator that are currently carried out by HELCOM Contracting Parties are described in the HELCOM Monitoring Manual Sub-programme sub-programme Water column hydrological characteristics: Monitoring concepts table.
Description of optimal monitoring
The regional monitoring effort is considered sufficient to support the indicator evaluation.
10 Data
The data and resulting data products (e.g. tables, figures and maps) available on the indicator web page can be used freely given that it is used appropriately and the source is cited.
Data source: The average for 2016-2021 was estimated using monitoring data provided by the HELCOM Contracting Parties, and kept in the HELCOM COMBINE database, hosted by ICES (www.ices.dk). Nominated members of HELCOM STATE & CONSERVATION group were given the opportunity to review the data, and to supply any missing monitoring observations, in order to achieve a complete dataset.
Description of data: The data includes secchi depth measurements explained in the HELCOM monitoring manual.
Geographical coverage: The observations are distributed in the sub-basins according to the HELCOM monitoring programme, added occasionally with data from research cruises.
Temporal coverage: The estimates are based on observations made between June – September during the assessment period 2016-2021.
Data aggregation: The 2016-2021 value for each assessment unit was produced as an inter-annual summer (June – September) average.
12 Archive
This version of the HELCOM core indicator report was published in April 2023:
The current version of this indicator (including as a PDF) can be found on the HELCOM indicator web page.
Eaarlier versions of the core indicator report are available:
Water clarity HELCOM core indicator 2018 (pdf)
Water clarity -HELCOM core indicator report – HOLAS II component 2017 (pdf)
13 References
Directive 2000/60/EC of the European parliament and of the council of 23 October 2000 establishing a framework for community action in the field of water policy. Official Journal of the European Communities L 327/1.
Directive 2008/56/EC of the European Parliament and of the Council. 17 June 2008. Establishing a Framework for Community Action in the Field of Marine Environmental Policy. Marine Strategy Framework Directive. 22p.
Fleming, V. & Laamanen, M. (2012). Long-term changes in Secchi depth and the role of phytoplankton in explaining light attenuation in the Baltic Sea. Estuarine, Coastal and Shelf Science. s 102–103. 1–10. 10.1016/j.ecss.2012.02.015.
Fleming-Lehtinen, V., Räike, A., Kortelainen, P., Kauppila, P., Thomas, D. N. (2014) Organic carbon concentration in the northern coastal Baltic Sea between 1975 and 2011. Estuaries and coasts 38, 466-481.
HELCOM (2009) Eutrophication in the Baltic Sea – An integrated thematic assessment of the effects of nutrient enrichment and eutrophication in the Baltic Sea region. Balt. Sea Environ. Proc. No. 115B
HELCOM (2013) Approaches and methods for eutrophication target setting in the Baltic Sea region. Balt. Sea Environ. Proc. No. 133
HELCOM (2021) “Baltic Sea Action Plan. 2021 Update.” https://helcom.fi/wp-content/uploads/2021/10/Baltic-Sea-Action-Plan-2021-update.pdf.
HELCOM (2022) Assessment of sources of nutrient inputs to the Baltic Sea in 2017.” https://helcom.fi/wp-content/uploads/2022/12/PLC-7-Assessment-of-sources-of-nutrient-inputs-to-the-Baltic-Sea-in-2017.pdf
HELCOM (2023) “Inputs of Nutrients to the Sub-Basins (2023). HELCOM Core Indicator Report. Online.” 2023.
HELCOM and Baltic Earth (2021) Climate Change in the Baltic Sea. 2021 Fact Sheet. Baltic Sea Environment Proceedings N°180. https://doi.org/ISSN: 0357-2994.
Stedmon, C.A., Markager, S., Kaas, H., 2000. Optical properties and signatures of chromophoric dissolved organic matter (CDOM) in Danish coastal waters. Estuarine, Coastal and Shelf Science 51, 267-278.
Ylöstalo, P., Seppälä, J., Kaitala, S., in prep. Spatial and seasonal variations in CDOM absorption and its relation to dissolved organic carbon and nitrogen concentrations in the Baltic Sea.
14 Other relevant resources
Additional information related to coastal evaluations is provided below.
Annex Overview of coastal evaluations reported by some Contracting Parties
Annex table 1. Results for national coastal Secchi depth indicators by coastal WFD assessment areas. The table includes information on the assessment unit (CODE, defined in the HELCOM Monitoring and Assessment Strategy Annex 4), assessment period (start year and end year), average condition during assessment period in m (ES) with standard deviation (SD), threshold values in m (ET), units, Ecological Quality Ratio (EQR) and Ecological Quality Ratio Scaled (EQRS). EQRS shows the present concentration in relation to the threshold value, decreasing along with increasing eutrophication. EQRS_class estimates the ecological status based on the EQRS value.
| IndicatorID | Name | Period | Unit ID | HELCOMID | HELCOM ID description | Assessment Unit | ET | ES | SD | EQR | EQRS | EQRS Class |
| 1007 | Secchi Depth | 20162020 | 1001 | GER-001 | mesohaline inner coastal waters, Wismarbucht, Suedteil | Bay of Mecklenburg | 3.84 | 2.71 | NA | 0.53 | 0.19 | Bad |
| 1007 | Secchi Depth | 20162020 | 1002 | GER-002 | mesohaline inner coastal waters, Wismarbucht, Nordteil | Bay of Mecklenburg | 3.84 | 4.01 | NA | 0.78 | 0.67 | Good |
| 1007 | Secchi Depth | 20162020 | 1003 | GER-003 | mesohaline inner coastal waters, Wismarbucht, Salzhaff | Bay of Mecklenburg | 3.84 | 2.93 | NA | 0.57 | 0.24 | Poor |
| 1007 | Secchi Depth | 20162020 | 1004 | GER-004 | mesohaline open coastal waters, Suedliche Mecklenburger Bucht/ Travemuende bis Warnemünde | Bay of Mecklenburg | 4.07 | 4.69 | NA | 0.87 | 0.82 | High |
| 1007 | Secchi Depth | 20162020 | 1005 | GER-005 | mesohaline inner coastal waters, Unterwarnow | Bay of Mecklenburg | 1.85 | 1.93 | NA | 0.78 | 0.67 | Good |
| 1007 | Secchi Depth | 20162020 | 1006 | GER-006 | mesohaline open coastal waters, Suedliche Mecklenburger Bucht/ Warnemünde bis Darss | Bay of Mecklenburg | 4.07 | 4.42 | NA | 0.81 | 0.73 | Good |
| 1007 | Secchi Depth | 20162020 | 1007 | GER-007 | oligohaline inner coastal waters, Ribnitzer See / Saaler Bodden | Arkona Basin | 1.42 | 0.23 | NA | 0.12 | 0.04 | Bad |
| 1007 | Secchi Depth | 20162020 | 1008 | GER-008 | oligohaline inner coastal waters, Koppelstrom / Bodstedter Bodden | Arkona Basin | 1.42 | 0.31 | NA | 0.16 | 0.06 | Bad |
| 1007 | Secchi Depth | 20162020 | 1009 | GER-009 | mesohaline inner coastal waters, Barther Bodden, Grabow | Arkona Basin | 1.85 | 0.45 | NA | 0.18 | 0.07 | Bad |
| 1007 | Secchi Depth | 20162020 | 1010 | GER-010 | mesohaline open coastal waters, Prerowbucht/ Darsser Ort bis Dornbusch | Arkona Basin | 2.90 | 3.71 | NA | 0.96 | 0.95 | High |
| 1007 | Secchi Depth | 20162020 | 1011 | GER-011 | mesohaline inner coastal waters, Westruegensche Bodden | Arkona Basin | 1.85 | 1.90 | NA | 0.77 | 0.64 | Good |
| 1007 | Secchi Depth | 20162020 | 1012 | GER-012 | mesohaline inner coastal waters, Strelasund | Arkona Basin | 1.85 | 1.29 | NA | 0.52 | 0.19 | Bad |
| 1007 | Secchi Depth | 20162020 | 1013 | GER-013 | mesohaline inner coastal waters, Greifswalder Bodden | Arkona Basin | 1.85 | 1.81 | NA | 0.73 | 0.56 | Moderate |
| 1007 | Secchi Depth | 20162020 | 1014 | GER-014 | mesohaline inner coastal waters, Kleiner Jasmunder Bodden | Arkona Basin | 1.85 | 0.37 | NA | 0.15 | 0.05 | Bad |
| 1007 | Secchi Depth | 20162020 | 1015 | GER-015 | mesohaline open coastal waters, Nord- und Ostruegensche Gewaesser | Arkona Basin | 2.90 | 3.39 | NA | 0.88 | 0.83 | High |
| 1007 | Secchi Depth | 20162020 | 1016 | GER-016 | oligohaline inner coastal waters, Peenestrom | Bornholm Basin | 1.42 | 0.57 | NA | 0.30 | 0.11 | Bad |
| 1007 | Secchi Depth | 20162020 | 1017 | GER-017 | oligohaline inner coastal waters, Achterwasser | Bornholm Basin | 1.42 | 0.44 | NA | 0.23 | 0.09 | Bad |
| 1007 | Secchi Depth | 20162020 | 1018 | GER-018 | mesohaline open coastal waters, Pommersche Bucht, Nordteil | Arkona Basin | 2.90 | 2.90 | NA | 0.75 | 0.60 | Moderate |
| 1007 | Secchi Depth | 20162020 | 1019 | GER-019 | mesohaline open coastal waters, Pommersche Bucht, Südteil | Bornholm Basin | 2.90 | 2.90 | NA | 0.75 | 0.60 | Moderate |
| 1007 | Secchi Depth | 20162020 | 1020 | GER-020 | oligohaline inner coastal waters, Kleines Haff | Bornholm Basin | 1.42 | 1.27 | NA | 0.67 | 0.43 | Moderate |
| 1007 | Secchi Depth | 20132018 | 1021 | GER-021 | mesohaline inner coastal waters, Flensburg Innenfoerde | Kiel Bay | 7.20 | 3.84 | NA | 0.40 | 0.15 | Bad |
| 1007 | Secchi Depth | 20132018 | 1022 | GER-022 | mesohaline open coastal waters, Geltinger Bucht | Kiel Bay | 7.20 | 5.65 | NA | 0.59 | 0.28 | Poor |
| 1007 | Secchi Depth | 20132018 | 1023 | GER-023 | meso- to polyhaline open coastal waters, seasonally stratified, Flensburger Aussenfoerde | Kiel Bay | 7.20 | 5.65 | NA | 0.59 | 0.28 | Poor |
| 1007 | Secchi Depth | 20132018 | 1024 | GER-024 | mesohaline open coastal waters, Aussenschlei | Kiel Bay | 7.20 | 5.46 | NA | 0.57 | 0.24 | Poor |
| 1007 | Secchi Depth | 20132018 | 1025 | GER-025 | mesohaline inner coastal waters, Schleimuende | Kiel Bay | 7.20 | 1.62 | NA | 0.17 | 0.06 | Bad |
| 1007 | Secchi Depth | 20132018 | 1026 | GER-026A | A.mesohaline inner coastal waters, Mittlere Schlei | Kiel Bay | 6.10 | 0.83 | NA | 0.10 | 0.04 | Bad |
| 1007 | Secchi Depth | 20132018 | 1027 | GER-026B | B.mesohaline inner coastal waters, Mittlere Schlei | Kiel Bay | 6.10 | 0.66 | NA | 0.08 | 0.03 | Bad |
| 1007 | Secchi Depth | 20132018 | 1028 | GER-027 | mesohaline inner coastal waters, Innere Schlei | Kiel Bay | 6.10 | 0.66 | NA | 0.08 | 0.03 | Bad |
| 1007 | Secchi Depth | 20132018 | 1029 | GER-028 | mesohaline open coastal waters, Eckerfoerder Bucht, Rand | Kiel Bay | 7.20 | 5.84 | NA | 0.61 | 0.32 | Poor |
| 1007 | Secchi Depth | 20132018 | 1030 | GER-029 | meso- to polyhaline open coastal waters, seasonally stratified, Eckerfoerderbucht, Tiefe | Kiel Bay | 7.20 | 5.39 | NA | 0.56 | 0.22 | Poor |
| 1007 | Secchi Depth | 20132018 | 1031 | GER-030 | mesohaline open coastal waters, Buelk | Kiel Bay | 7.20 | 5.39 | NA | 0.56 | 0.22 | Poor |
| 1007 | Secchi Depth | 20132018 | 1032 | GER-031 | meso- to polyhaline open coastal waters, seasonally stratified, Kieler Aussenfoerde | Kiel Bay | 7.20 | 5.46 | NA | 0.57 | 0.24 | Poor |
| 1007 | Secchi Depth | 20132018 | 1033 | GER-032 | mesohaline inner coastal waters, Kieler Innenfoerde | Kiel Bay | 7.20 | 3.80 | NA | 0.40 | 0.14 | Bad |
| 1007 | Secchi Depth | 20132018 | 1034 | GER-033 | mesohaline open coastal waters, Probstei | Kiel Bay | 7.20 | 5.33 | NA | 0.56 | 0.21 | Poor |
| 1007 | Secchi Depth | 20132018 | 1035 | GER-034 | mesohaline open coastal waters, Putlos | Kiel Bay | 7.20 | 5.33 | NA | 0.56 | 0.21 | Poor |
| 1007 | Secchi Depth | 20132018 | 1036 | GER-035 | meso- to polyhaline open coastal waters, seasonally stratified, Hohwachter Bucht | Kiel Bay | 7.20 | 5.44 | NA | 0.57 | 0.23 | Poor |
| 1007 | Secchi Depth | 20132018 | 1037 | GER-036A | A.mesohaline open coastal waters, Fehmarnsund | Kiel Bay | 7.20 | 3.71 | NA | 0.39 | 0.14 | Bad |
| 1007 | Secchi Depth | 20132018 | 1038 | GER-036B | B.mesohaline open coastal waters, Fehmarnsund | Bay of Mecklenburg | 7.20 | 4.38 | NA | 0.46 | 0.17 | Bad |
| 1007 | Secchi Depth | 20132018 | 1039 | GER-037 | mesohaline inner coastal waters, Orther Bucht | Kiel Bay | 7.20 | 3.51 | NA | 0.37 | 0.13 | Bad |
| 1007 | Secchi Depth | 20132018 | 1040 | GER-038A | A.mesohaline open coastal waters, Fehmarnbelt | Kiel Bay | 7.20 | 5.54 | NA | 0.58 | 0.25 | Poor |
| 1007 | Secchi Depth | 20132018 | 1041 | GER-038B | B.mesohaline open coastal waters, Fehmarnbelt | Bay of Mecklenburg | 7.20 | 5.54 | NA | 0.58 | 0.25 | Poor |
| 1007 | Secchi Depth | 20132018 | 1042 | GER-039 | meso- to polyhaline open coastal waters, seasonally stratified, Fehmarn Sund Ost | Bay of Mecklenburg | 7.20 | 5.74 | NA | 0.60 | 0.30 | Poor |
| 1007 | Secchi Depth | 20132018 | 1043 | GER-040 | mesohaline open coastal waters, Groemitz | Bay of Mecklenburg | 7.20 | 5.67 | NA | 0.59 | 0.28 | Poor |
| 1007 | Secchi Depth | 20132018 | 1044 | GER-041 | mesohaline open coastal waters, Neustaedter Bucht | Bay of Mecklenburg | 7.20 | 5.66 | NA | 0.59 | 0.28 | Poor |
| 1007 | Secchi Depth | 20132018 | 1045 | GER-042 | mesohaline inner coastal waters, Travemuende | Bay of Mecklenburg | 7.20 | 2.18 | NA | 0.23 | 0.08 | Bad |
| 1007 | Secchi Depth | 20132018 | 1046 | GER-043 | mesohaline inner coastal waters, Poetenitzer Wiek | Bay of Mecklenburg | 6.10 | 2.18 | NA | 0.27 | 0.10 | Bad |
| 1007 | Secchi Depth | 20132018 | 1047 | GER-044 | mesohaline inner coastal waters, Untere Trave | Bay of Mecklenburg | 6.10 | 1.75 | NA | 0.21 | 0.08 | Bad |
| 1007 | Secchi Depth | 20162020 | 1048 | GER-111 | mesohaline inner coastal waters, Nordruegensche Bodden | Arkona Basin | 1.85 | 1.27 | NA | 0.51 | 0.19 | Bad |
| 2007 | Secchi Depth | 20142019 | 2001 | DEN-001 | Roskilde Fjord, ydre | Kattegat | NA | NA | NA | 0.42 | 0.34 | Poor |
| 2007 | Secchi Depth | 20142019 | 2002 | DEN-002 | Roskilde Fjord, indre | Kattegat | NA | NA | NA | 0.68 | 0.55 | Moderate |
| 2007 | Secchi Depth | 20142019 | 2006 | DEN-006 | Nordlige Øresund | The Sound | NA | NA | NA | 0.74 | 0.61 | Good |
| 2007 | Secchi Depth | 20142019 | 2016 | DEN-016 | Korsør Nor | Great Belt | NA | NA | NA | 0.56 | 0.45 | Moderate |
| 2007 | Secchi Depth | 20142019 | 2017 | DEN-017 | Basnæs Nor | Great Belt | NA | NA | NA | 0.51 | 0.41 | Moderate |
| 2007 | Secchi Depth | 20142019 | 2018 | DEN-018 | Holsteinborg Nor | Great Belt | NA | NA | NA | 0.75 | 0.61 | Good |
| 2007 | Secchi Depth | 20142019 | 2024 | DEN-024 | Isefjord, ydre | Kattegat | NA | NA | NA | 0.66 | 0.53 | Moderate |
| 2007 | Secchi Depth | 20142019 | 2025 | DEN-025 | Skælskør Fjord og Nor | Great Belt | NA | NA | NA | 0.67 | 0.54 | Moderate |
| 2007 | Secchi Depth | 20142019 | 2028 | DEN-028 | Sejerø Bugt | Great Belt | NA | NA | NA | 0.57 | 0.46 | Moderate |
| 2007 | Secchi Depth | 20142019 | 2029 | DEN-029 | Kalundborg Fjord | Great Belt | NA | NA | NA | 0.62 | 0.50 | Moderate |
| 2007 | Secchi Depth | 20142019 | 2034 | DEN-034 | Smålandsfarvandet, syd | Great Belt | NA | NA | NA | 0.63 | 0.51 | Moderate |
| 2007 | Secchi Depth | 20142019 | 2035 | DEN-035 | Karrebæk Fjord | Great Belt | NA | NA | NA | 0.55 | 0.44 | Moderate |
| 2007 | Secchi Depth | 20142019 | 2036 | DEN-036 | Dybsø Fjord | Great Belt | NA | NA | NA | 0.83 | 0.71 | Good |
| 2007 | Secchi Depth | 20142019 | 2037 | DEN-037 | Avnø Fjord | Great Belt | NA | NA | NA | 0.55 | 0.44 | Moderate |
| 2007 | Secchi Depth | 20142019 | 2044 | DEN-044 | Hjelm Bugt | Arkona Basin | NA | NA | NA | 0.66 | 0.53 | Moderate |
| 2007 | Secchi Depth | 20142019 | 2046 | DEN-046 | Fakse Bugt | Arkona Basin | NA | NA | NA | 0.60 | 0.49 | Moderate |
| 2007 | Secchi Depth | 20142019 | 2047 | DEN-047 | Præstø Fjord | Arkona Basin | NA | NA | NA | 0.59 | 0.48 | Moderate |
| 2007 | Secchi Depth | 20142019 | 2048 | DEN-048 | Stege Bugt | Arkona Basin | NA | NA | NA | 0.51 | 0.40 | Moderate |
| 2007 | Secchi Depth | 20142019 | 2049 | DEN-049 | Stege Nor | Arkona Basin | NA | NA | NA | 0.49 | 0.40 | Poor |
| 2007 | Secchi Depth | 20142019 | 2059 | DEN-059 | Nærå Strand | Great Belt | NA | NA | NA | 0.26 | 0.21 | Poor |
| 2007 | Secchi Depth | 20142019 | 2062 | DEN-062 | Lillestrand | Great Belt | NA | NA | NA | 0.39 | 0.31 | Poor |
| 2007 | Secchi Depth | 20142019 | 2068 | DEN-068 | Lindelse Nor | Great Belt | NA | NA | NA | 0.64 | 0.51 | Moderate |
| 2007 | Secchi Depth | 20142019 | 2072 | DEN-072 | Kløven | Great Belt | NA | NA | NA | 0.62 | 0.50 | Moderate |
| 2007 | Secchi Depth | 20142019 | 2074 | DEN-074 | Bredningen | Great Belt | NA | NA | NA | 0.19 | 0.15 | Bad |
| 2007 | Secchi Depth | 20142019 | 2080 | DEN-080 | Gamborg Fjord | Great Belt | NA | NA | NA | 0.73 | 0.59 | Moderate |
| 2007 | Secchi Depth | 20142019 | 2082 | DEN-082 | Aborg Minde Nor | Great Belt | NA | NA | NA | 0.12 | 0.09 | Bad |
| 2007 | Secchi Depth | 20142019 | 2083 | DEN-083 | Holckenhavn Fjord | Great Belt | NA | NA | NA | 0.32 | 0.26 | Poor |
| 2007 | Secchi Depth | 20142019 | 2084 | DEN-084 | Kerteminde Fjord | Great Belt | NA | NA | NA | 0.79 | 0.67 | Good |
| 2007 | Secchi Depth | 20142019 | 2085 | DEN-085 | Kertinge Nor | Great Belt | NA | NA | NA | 0.56 | 0.45 | Moderate |
| 2007 | Secchi Depth | 20142019 | 2086 | DEN-086 | Nyborg Fjord | Great Belt | NA | NA | NA | 0.62 | 0.50 | Moderate |
| 2007 | Secchi Depth | 20142019 | 2087 | DEN-087 | Helnæs Bugt | Great Belt | NA | NA | NA | 0.66 | 0.53 | Moderate |
| 2007 | Secchi Depth | 20142019 | 2089 | DEN-089 | Lunkebugten | Great Belt | NA | NA | NA | 0.67 | 0.54 | Moderate |
| 2007 | Secchi Depth | 20142019 | 2090 | DEN-090 | Langelandssund | Great Belt | NA | NA | NA | 0.71 | 0.57 | Moderate |
| 2007 | Secchi Depth | 20142019 | 2092 | DEN-092 | Odense Fjord, ydre | Great Belt | NA | NA | NA | 0.65 | 0.52 | Moderate |
| 2007 | Secchi Depth | 20142019 | 2093 | DEN-093 | Odense Fjord, Seden Strand | Great Belt | NA | NA | NA | 0.25 | 0.20 | Bad |
| 2007 | Secchi Depth | 20142019 | 2101 | DEN-101 | Genner Bugt | Great Belt | NA | NA | NA | 0.48 | 0.38 | Poor |
| 2007 | Secchi Depth | 20142019 | 2102 | DEN-102 | Åbenrå Fjord | Great Belt | NA | NA | NA | 0.53 | 0.43 | Moderate |
| 2007 | Secchi Depth | 20142019 | 2103 | DEN-103 | Als Fjord | Great Belt | NA | NA | NA | 0.52 | 0.41 | Moderate |
| 2007 | Secchi Depth | 20142019 | 2104 | DEN-104 | Als Sund | Great Belt | NA | NA | NA | 0.76 | NA | NA |
| 2007 | Secchi Depth | 20142019 | 2105 | DEN-105 | Augustenborg Fjord | Great Belt | NA | NA | NA | 0.44 | 0.35 | Poor |
| 2007 | Secchi Depth | 20142019 | 2108 | DEN-108 | Avnø Vig | Great Belt | NA | NA | NA | 0.33 | 0.26 | Poor |
| 2007 | Secchi Depth | 20142019 | 2109 | DEN-109 | Hejlsminde Nor | Great Belt | NA | NA | NA | 0.43 | 0.34 | Poor |
| 2007 | Secchi Depth | 20142019 | 2110 | DEN-110 | Nybøl Nor | Great Belt | NA | NA | NA | 0.58 | 0.47 | Moderate |
| 2007 | Secchi Depth | 20142019 | 2113 | DEN-113 | Flensborg Fjord, indre | Great Belt | NA | NA | NA | 0.53 | 0.42 | Moderate |
| 2007 | Secchi Depth | 20142019 | 2114 | DEN-114 | Flensborg Fjord, ydre | Great Belt | NA | NA | NA | 0.53 | 0.42 | Moderate |
| 2007 | Secchi Depth | 20142019 | 2123 | DEN-123 | Vejle Fjord, indre | Great Belt | NA | NA | NA | 0.61 | 0.49 | Moderate |
| 2007 | Secchi Depth | 20142019 | 2124 | DEN-124 | Kolding Fjord, indre | Great Belt | NA | NA | NA | 0.41 | 0.32 | Poor |
| 2007 | Secchi Depth | 20142019 | 2125 | DEN-125 | Kolding Fjord, ydre | Great Belt | NA | NA | NA | 0.52 | 0.42 | Moderate |
| 2007 | Secchi Depth | 20142019 | 2128 | DEN-128 | Horsens Fjord, indre | Great Belt | NA | NA | NA | 0.52 | 0.42 | Moderate |
| 2007 | Secchi Depth | 20142019 | 2137 | DEN-137 | Randers Fjord, ydre | Kattegat | NA | NA | NA | 0.37 | 0.29 | Poor |
| 2007 | Secchi Depth | 20142019 | 2138 | DEN-138 | Hevring Bugt | Kattegat | NA | NA | NA | 0.75 | 0.61 | Good |
| 2007 | Secchi Depth | 20142019 | 2140 | DEN-140 | Djursland Øst | Kattegat | NA | NA | NA | 0.80 | 0.68 | Good |
| 2007 | Secchi Depth | 20142019 | 2141 | DEN-141 | Ebeltoft Vig | Great Belt | NA | NA | NA | 0.77 | 0.64 | Good |
| 2007 | Secchi Depth | 20142019 | 2142 | DEN-142 | Stavns Fjord | Great Belt | NA | NA | NA | 0.49 | 0.39 | Poor |
| 2007 | Secchi Depth | 20142019 | 2144 | DEN-144 | Knebel Vig | Great Belt | NA | NA | NA | 0.67 | 0.54 | Moderate |
| 2007 | Secchi Depth | 20142019 | 2145 | DEN-145 | Kalø Vig | Great Belt | NA | NA | NA | 0.77 | 0.64 | Good |
| 2007 | Secchi Depth | 20142019 | 2146 | DEN-146 | Norsminde Fjord | Great Belt | NA | NA | NA | 0.38 | 0.30 | Poor |
| 2007 | Secchi Depth | 20142019 | 2147 | DEN-147 | Århus Bugt og Begtrup Vig | Great Belt | NA | NA | NA | 0.82 | 0.70 | Good |
| 2007 | Secchi Depth | 20142019 | 2157 | DEN-157 | Bjørnholms Bugt, Riisgårde Bredning, Skive Fjord og Lovns Bredning | Kattegat | NA | NA | NA | 0.42 | 0.34 | Poor |
| 2007 | Secchi Depth | 20142019 | 2158 | DEN-158 | Hjarbæk Fjord | Kattegat | NA | NA | NA | 0.25 | 0.20 | Poor |
| 2007 | Secchi Depth | 20142019 | 2159 | DEN-159 | Mariager Fjord, indre | Kattegat | NA | NA | NA | 0.30 | 0.24 | Poor |
| 2007 | Secchi Depth | 20142019 | 2160 | DEN-160 | Mariager Fjord, ydre | Kattegat | NA | NA | NA | 0.57 | 0.46 | Moderate |
| 2007 | Secchi Depth | 20142019 | 2165 | DEN-165 | Isefjord, indre | Kattegat | NA | NA | NA | 0.81 | 0.68 | Good |
| 2007 | Secchi Depth | 20142019 | 2200 | DEN-200 | Kattegat, Nordsjælland | Kattegat | NA | NA | NA | 0.67 | 0.54 | Moderate |
| 2007 | Secchi Depth | 20142019 | 2201 | DEN-201 | Køge Bugt | Arkona Basin | NA | NA | NA | 0.68 | 0.55 | Moderate |
| 2007 | Secchi Depth | 20142019 | 2204 | DEN-204 | Jammerland Bugt og Musholm Bugt | Great Belt | NA | NA | NA | 0.51 | 0.41 | Moderate |
| 2007 | Secchi Depth | 20142019 | 2205 | DEN-205 | Kattegat, Nordsjælland >20 m | Kattegat | NA | NA | NA | 0.76 | 0.62 | Good |
| 2007 | Secchi Depth | 20142019 | 2206 | DEN-206 | Smålandsfarvandet, åbne del | Great Belt | NA | NA | NA | 0.62 | 0.50 | Moderate |
| 2007 | Secchi Depth | 20142019 | 2207 | DEN-207 | Nakskov Fjord | Great Belt | NA | NA | NA | 0.59 | 0.48 | Moderate |
| 2007 | Secchi Depth | 20142019 | 2209 | DEN-209 | Rødsand og Bredningen | Great BeltandBay of Mecklenburg | NA | NA | NA | 0.72 | 0.58 | Moderate |
| 2007 | Secchi Depth | 20142019 | 2212 | DEN-212 | Faaborg Fjord | Great Belt | NA | NA | NA | 0.62 | 0.50 | Moderate |
| 2007 | Secchi Depth | 20142019 | 2214 | DEN-214 | Det Sydfynske Øhav | Great Belt | NA | NA | NA | 0.49 | 0.39 | Poor |
| 2007 | Secchi Depth | 20142019 | 2216 | DEN-216 | Lillebælt, syd | Great Belt | NA | NA | NA | 0.69 | 0.56 | Moderate |
| 2007 | Secchi Depth | 20142019 | 2217 | DEN-217 | Lillebælt, Bredningen | Great Belt | NA | NA | NA | 0.57 | 0.46 | Moderate |
| 2007 | Secchi Depth | 20142019 | 2219 | DEN-219 | Århus Bugt syd, Samsø og Nordlige Bælthav | Great Belt | NA | NA | NA | 0.72 | 0.59 | Moderate |
| 2007 | Secchi Depth | 20142019 | 2222 | DEN-222 | Kattegat, Aalborg Bugt | Kattegat | NA | NA | NA | 0.74 | 0.60 | Good |
| 2007 | Secchi Depth | 20142019 | 2224 | DEN-224 | Nordlige Lillebælt | Great Belt | NA | NA | NA | 0.72 | 0.59 | Moderate |
| 2007 | Secchi Depth | 20142019 | 2231 | DEN-231 | Lillebælt, Snævringen | Great Belt | NA | NA | NA | 0.54 | 0.43 | Moderate |
| 2007 | Secchi Depth | 20142019 | 2232 | DEN-232 | Nissum Bredning | Kattegat | NA | NA | NA | 0.58 | 0.47 | Moderate |
| 2007 | Secchi Depth | 20142019 | 2233 | DEN-233 | Kås Bredning og Venø Bugt | Kattegat | NA | NA | NA | 0.45 | 0.36 | Poor |
| 2007 | Secchi Depth | 20142019 | 2234 | DEN-234 | Løgstør Bredning | Kattegat | NA | NA | NA | 0.52 | 0.42 | Moderate |
| 2007 | Secchi Depth | 20142019 | 2235 | DEN-235 | Nibe Bredning og Langerak | Kattegat | NA | NA | NA | 0.69 | 0.56 | Moderate |
| 2007 | Secchi Depth | 20142019 | 2236 | DEN-236 | Thisted Bredning | Kattegat | NA | NA | NA | 0.37 | 0.30 | Poor |
| 2007 | Secchi Depth | 20142019 | 2238 | DEN-238 | Halkær Bredning | Kattegat | NA | NA | NA | 0.24 | 0.19 | Bad |
| 3003 | Secchi Depth | 20162021 | 3001 | EST-001 | Narva-Kunda Bay CWB | Gulf of Finland | NA | NA | NA | 0.61 | 0.49 | Moderate |
| 3003 | Secchi Depth | 20162020 | 3002 | EST-002 | Eru-Käsmu Bay CWB | Gulf of Finland | NA | NA | NA | 0.55 | 0.44 | Moderate |
| 3003 | Secchi Depth | 20212021 | 3003 | EST-003 | Hara and Kolga Bay CWB | Gulf of Finland | NA | NA | NA | 0.38 | 0.25 | Poor |
| 3003 | Secchi Depth | 20162021 | 3004 | EST-005 | Muuga-Tallinna-Kakumäe Bay CWB | Gulf of Finland | NA | NA | NA | 0.49 | 0.38 | Poor |
| 3003 | Secchi Depth | 20212021 | 3005 | EST-006 | Pakri Bay CWB | Gulf of Finland | NA | NA | NA | 0.45 | 0.37 | Poor |
| 3003 | Secchi Depth | 20212021 | 3006 | EST-007 | Hiiu Shallow CWB | Gulf of Riga | NA | NA | NA | 0.32 | 0.18 | Bad |
| 3003 | Secchi Depth | 20182021 | 3007 | EST-008 | Haapsalu Bay CWB | Gulf of Riga | NA | NA | NA | 0.29 | 0.17 | Bad |
| 3003 | Secchi Depth | 20212021 | 3009 | EST-010 | Soela Strait CWB | Northern Baltic Proper | NA | NA | NA | 0.76 | 0.58 | Moderate |
| 3003 | Secchi Depth | 20212021 | 3010 | EST-011 | Kihelkonna Bay CWB | Eastern Gotland Basin | NA | NA | NA | 0.53 | 0.44 | Moderate |
| 3003 | Secchi Depth | 20162021 | 3011 | EST-013 | Pärnu Bay CWB | Gulf of Riga | NA | NA | NA | 0.28 | 0.15 | Bad |
| 3003 | Secchi Depth | 20162018 | 3012 | EST-014 | Kassari-Õunaku Bay CWB | Gulf of Riga | NA | NA | NA | 0.70 | 0.56 | Moderate |
| 3003 | Secchi Depth | 20212021 | 3013 | EST-016 | Väinameri CWB | Gulf of Riga | NA | NA | NA | 0.65 | 0.52 | Moderate |
| 3003 | Secchi Depth | 20212021 | 3014 | EST-017 | NW part of the Gulf of Riga CWB | Gulf of Riga | NA | NA | NA | NA | NA | NA |
| 3003 | Secchi Depth | 20212021 | 3015 | EST-018 | NE part of the Gulf of Riga CWB | Gulf of Riga | NA | NA | NA | NA | NA | NA |
| 3003 | Secchi Depth | 20212021 | 3016 | EST-019 | Central part of the Gulf of Riga CWB | Gulf of Riga | NA | NA | NA | 0.60 | 0.49 | Moderate |
| 4005 | Secchi Depth | 20162021 | 4001 | FIN-001 | Lounainen sisäsaaristo | Åland Sea | NA | NA | NA | NA | 0.29 | Poor |
| 4005 | Secchi Depth | 20162021 | 4002 | FIN-002 | Lounainen ulkosaaristo | Åland Sea | NA | NA | NA | NA | 0.40 | Poor |
| 4005 | Secchi Depth | 20162021 | 4003 | FIN-003 | Suomenlahden sisäsaaristo | Gulf of Finland | NA | NA | NA | NA | 0.41 | Moderate |
| 4005 | Secchi Depth | 20162021 | 4004 | FIN-004 | Suomenlahden ulkosaaristo | Gulf of Finland | NA | NA | NA | NA | 0.50 | Moderate |
| 4005 | Secchi Depth | 20162021 | 4005 | FIN-005 | Lounainen välisaaristo | Åland Sea | NA | NA | NA | NA | 0.33 | Poor |
| 4005 | Secchi Depth | 20162021 | 4006 | FIN-006 | Merenkurkun sisäsaaristo | The Quark | NA | NA | NA | NA | 0.55 | Moderate |
| 4005 | Secchi Depth | 20162021 | 4007 | FIN-007 | Merenkurkun ulkosaaristo | The Quark | NA | NA | NA | NA | 0.64 | Good |
| 4005 | Secchi Depth | 20162021 | 4008 | FIN-008 | Selkämeren sisemmät rannikkovedet | Bothnian Sea | NA | NA | NA | NA | 0.41 | Moderate |
| 4005 | Secchi Depth | 20162021 | 4009 | FIN-009 | Selkämeren ulommat rannikkovedet | Bothnian Sea | NA | NA | NA | NA | 0.61 | Good |
| 4005 | Secchi Depth | 20162021 | 4010 | FIN-010 | Perämeren sisemmät rannikkovedet | Bothnian Bay | NA | NA | NA | NA | 0.46 | Moderate |
| 4005 | Secchi Depth | 20162021 | 4011 | FIN-011 | Perämeren ulommat rannikkovedet | Bothnian Bay | NA | NA | NA | NA | 0.53 | Moderate |
| 4005 | Secchi Depth | 20162021 | 4012 | FIN-012 | Åland innerskärgård | Åland Sea | NA | NA | NA | 0.37 | 0.37 | Poor |
| 4005 | Secchi Depth | 20162021 | 4013 | FIN-013 | Åland mellanskärgård | Åland Sea | NA | NA | NA | 0.53 | 0.49 | Moderate |
| 4005 | Secchi Depth | 20162021 | 4014 | FIN-014 | Åland ytterskärgård | Åland Sea | NA | NA | NA | 0.60 | 0.53 | Moderate |
| 7011 | Secchi Depth | 20162021 | 7001 | POL-001 | PL TW I WB 9 very sheltered, fully mixed, substratum: silt/sandy silt/silty sand; ice cover >90 days, water residence time 52 days | Bornholm Basin | 1.90 | 1.45 | 0.26 | 0.57 | 0.29 | Poor |
| 7011 | Secchi Depth | 20162021 | 7002 | POL-002 | PL TW I WB 8 very sheltered, fully mixed, substratum: silt/sandy silt/silty sand; ice cover >90 days, water residence time 52 days | Bornholm Basin | 1.90 | 1.33 | 0.18 | 0.52 | 0.22 | Poor |
| 7011 | Secchi Depth | 20162021 | 7003 | POL-003 | PL TW I WB 1 very sheltered, fully mixed, substratum: silt/sandy silt/silty sand; ice cover >90 days, water residence time 52 days | Gdansk Basin | 0.75 | 0.43 | 0.12 | 0.43 | 0.16 | Bad |
| 7011 | Secchi Depth | 20162021 | 7004 | POL-004 | PL TW II WB 2 very sheltered, fully mixed, substratum: lagoonal fine snd medium grained sand/silty sand; residence time 138 day, ice cover >90 days | Gdansk Basin | 1.50 | 2.16 | 0.17 | 1.00 | 1.00 | High |
| 7012 | Secchi Depth | 20162021 | 7005 | POL-005 | PL TW III WB 3 partly protected, partly stratified, substratum: medium grained sand/pebbles/marine silty sand; ice-incidental | Gdansk Basin | 4.50 | 4.22 | 0.63 | 0.70 | 0.51 | Moderate |
| 7012 | Secchi Depth | 20162021 | 7006 | POL-006 | PL TW IV WB 4 partly stratified, moderately exposed, substratum: sand/silt; ice – incidental | Gdansk Basin | 4.50 | 3.67 | 0.66 | 0.61 | 0.35 | Poor |
| 7012 | Secchi Depth | 20162021 | 7007 | POL-007 | PL TW V WB 6 river mouth, partly stratified, partly sheltered, substratum: medium grained sand/silty sand | Bornholm Basin | 4.50 | 2.28 | 0.87 | 0.38 | 0.16 | Bad |
| 7012 | Secchi Depth | 20162021 | 7008 | POL-008 | PL TW V WB 5 river mouth, partly stratified, partly sheltered, substratum: medium grained sand/silty sand | Gdansk Basin | 3.00 | 2.33 | 0.87 | 0.58 | 0.34 | Poor |
| 7012 | Secchi Depth | 20162021 | 7009 | POL-009 | PL TW V WB 7 river mouth, partly stratified, partly sheltered, substratum: medium grained sand/silty sand | Bornholm Basin | 3.75 | 2.16 | 0.48 | 0.43 | 0.18 | Bad |
| 7012 | Secchi Depth | 20162021 | 7010 | POL-010 | PL CWI WB2 coastal waters, moderately exposed, fully mixed, substratum:sand/fine sand | Gdansk Basin | 5.60 | 4.40 | 0.55 | 0.59 | 0.30 | Poor |
| 7012 | Secchi Depth | 20162021 | 7011 | POL-011 | PL CWI WB1 coastal waters, moderately exposed, fully mixed, substratum:sand/fine sand | Gdansk Basin | 3.50 | 3.50 | 0.60 | 0.75 | 0.59 | Moderate |
| 7012 | Secchi Depth | 20162021 | 7012 | POL-012 | PL CWI WB3 coastal waters, moderately exposed, fully mixed, substratum:sand/fine sand | Gdansk Basin | 5.60 | 2.47 | 0.56 | 0.33 | 0.12 | Bad |
| 7012 | Secchi Depth | 20162021 | 7013 | POL-013 | PL CW II WB 8 central Polish coast, coastal waters, exposed, fully mixed, substratum: sand/pebbles/gravel | Bornholm Basin | 5.60 | 3.50 | 0.94 | 0.47 | 0.20 | Poor |
| 7012 | Secchi Depth | 20162021 | 7014 | POL-014 | PL CW II WB 6W central Polish coast, coastal waters, exposed, fully mixed, substratum: sand/pebbles/gravel | Bornholm Basin | 5.60 | 4.06 | 0.46 | 0.54 | 0.24 | Poor |
| 7012 | Secchi Depth | 20162021 | 7015 | POL-015 | PL CW II WB 6E central Polish coast, coastal waters, exposed, fully mixed, substratum: sand/pebbles/gravel | Bornholm Basin | 5.60 | 4.41 | 0.51 | 0.59 | 0.29 | Poor |
| 7012 | Secchi Depth | 20162021 | 7016 | POL-016 | PL CWII WB5 central Polish coast, coastal waters, exposed, fully mixed, substratum: sand/pebbles/gravel | Eastern Gotland Basin | 5.60 | 4.13 | 0.62 | 0.55 | 0.26 | Poor |
| 7012 | Secchi Depth | 20162021 | 7017 | POL-017 | PL CWII WB4 central Polish coast, coastal waters, exposed, fully mixed, substratum: sand/pebbles/gravel | Gdansk Basin | 5.60 | 5.13 | 0.82 | 0.69 | 0.47 | Moderate |
| 7012 | Secchi Depth | 20162021 | 7018 | POL-018 | PL CW III WB 9 central Polish coast, coastal waters, exposed, fully mixed, substratum: sand/pebbles/gravel | Bornholm Basin | 3.80 | 3.24 | 0.68 | 0.64 | 0.38 | Poor |
| 7012 | Secchi Depth | 20162021 | 7019 | POL-019 | PL CW III WB 7 central Polish coast, coastal waters, exposed, fully mixed, substratum: sand/pebbles/gravel | Bornholm Basin | 5.60 | 3.46 | 0.90 | 0.46 | 0.20 | Bad |
| 8007 | Secchi Depth | 20182018 | 8001 | SWE-001 | 1s West Coast inner coastal water | Kattegat | 5.52 | 6.84 | NA | 0.86 | 0.85 | High |
| 8007 | Secchi Depth | 20182018 | 8002 | SWE-003 | 4 West Coast outer coastal water, Kattegat | Kattegat | 7.98 | 8.55 | NA | 0.82 | 0.68 | Good |
| 8007 | Secchi Depth | 20182018 | 8003 | SWE-004 | 5 South Halland and north Öresund coastal water | Kattegat | 7.98 | 6.80 | NA | 0.65 | 0.52 | Moderate |
| 8007 | Secchi Depth | 20182018 | 8004 | SWE-005 | 6 Öresund inner coastal water | The Sound | 7.50 | 5.08 | NA | 0.51 | 0.44 | Moderate |
| 8007 | Secchi Depth | 20172017 | 8005 | SWE-006 | 7 Skåne coastal water | Arkona Basin | 7.00 | 7.18 | NA | 0.72 | 0.63 | Good |
| 8007 | Secchi Depth | 20182018 | 8008 | SWE-009 | 10 Öland and Gotland coastal water | Eastern Gotland Basin | 7.00 | 3.80 | NA | 0.38 | 0.38 | Poor |
| 8007 | Secchi Depth | 20182018 | 8009 | SWE-010 | 11 Gotland north-west coastal water | Western Gotland Basin | 7.00 | 4.03 | NA | 0.40 | 0.40 | Moderate |
| 8007 | Secchi Depth | 20172017 | 8010 | SWE-011 | 12n Östergötland and Stockholm archipelago | Northern Baltic Proper | 6.81 | 4.65 | 1.87 | 0.48 | 0.45 | Moderate |
| 8007 | Secchi Depth | 20172017 | 8011 | SWE-012 | 12s Östergötland and Stockholm archipelago | Western Gotland Basin | 7.08 | 4.51 | NA | 0.45 | 0.43 | Moderate |
| 8007 | Secchi Depth | 20172017 | 8012 | SWE-013 | 13 Östergötland inner coastal water | Western Gotland Basin | 5.70 | 2.32 | NA | 0.29 | 0.29 | Poor |
| 8007 | Secchi Depth | 20172017 | 8013 | SWE-014 | 14 Östergötland outer coastal water | Western Gotland Basin | 7.00 | 5.67 | NA | 0.57 | 0.51 | Moderate |
| 8007 | Secchi Depth | 20172017 | 8015 | SWE-016 | 16 South Bothnian Sea,inner coastal water | Bothnian Sea | 4.90 | 4.34 | NA | 0.62 | 0.55 | Moderate |
| 8007 | Secchi Depth | 20172017 | 8016 | SWE-017 | 17 South Bothnian Sea, outer coastal water | Bothnian Sea | 7.00 | 6.20 | NA | 0.62 | 0.55 | Moderate |
| 8007 | Secchi Depth | 20172017 | 8017 | SWE-018 | 18 North Bothnian Sea, Höga kusten, inner | Bothnian Sea | 3.14 | 5.05 | NA | 0.71 | 0.82 | High |