 Waterbirds breeding season
2 Relevance of the indicator
2.1 Ecological relevance
Waterbirds are an integral part of the Baltic marine ecosystem. They are predators of fish and macroinvertebrates, scavengers of carcasses and fishery discards and herbivores of littoral vegetation. They can be assigned to functional species groups, meaning that different prey types are taken from different compartments of the marine environment. Most species are specialized in certain species and/or size classes of prey. As they cannot survive without a sufficient food supply, changes in the number of waterbirds reflect conditions in the food web of the Baltic Sea. A high number of breeding waterbirds may not automatically indicate a good environmental status, because for instance piscivorous species benefit from a high availability of small fish, which in turn may point to a disorder of the food web owing to overfishing of large fish species.
As they are predators at or close to the top of the food web, waterbirds accumulate contaminants and their numbers, and even more their breeding success, may indicate the degree of contamination. Moreover, several waterbird species are predated by white-tailed sea eagles, transferring the loads of contaminants to a higher level in the food web.
Some waterbird species are not only breeding, but also wintering in the Baltic Sea region. For several reasons, those species are potentially included in the concepts of both the breeding and wintering waterbird abundance indicators. The intention of the indicators is to support the assessment of environmental status of marine areas rather than the state of bird populations per se. This is most obvious in species that have differing distribution patterns between breeding and wintering seasons (e.g., alcids). In general, the explanatory power of the indicator is constrained by factors acting on the waterbirds in the non-breeding season, either in the Baltic Sea or in staging and wintering areas along the flyways to southern Europe and Africa or even Australia and Antarctica, depending on the migration routes of the respective species.
2.2 Policy relevance
The indicator on abundance of waterbirds in the breeding season addresses the Baltic Sea Action Plan (BSAP) biodiversity segment’s ecological objectives ‘Viable populations of all native species’, ‘Natural distribution, occurrence and quality of habitats and associated communities’, ‘Functional, healthy and resilient food webs ‘ as well as the eutrophication segment’s ecological objective ‘Natural distribution and occurrence of plants and animals’. It is of direct relevance for the 2021 BSAP Actions:
- B11: Maintain an updated map of the sensitivity of birds to threats such as wind energy facilities, wave energy installations, shipping and fisheries. Complete, as a first step, the mapping of migration routes, staging, moulting and breeding areas based on existing data by 2022. By 2025 further develop these maps by incorporating new data, post-production investigation information and addressing the subject of cumulative effects from these activities in space and time.
- B12 By 2023 and onwards with new findings use the maps on sensitivity of migratory birds to threats in environmental impact assessment (EIA) procedures with the aim to protect migratory birds against potential threats arising from new offshore wind farms and other installations with barrier effect.
- B13 By the next update cycle of the maritime spatial plans seek to incorporate the maps on sensitivity of migratory birds to threats in the work concerning maritime spatial planning to avoid that maritime activities impair birds and their habitats. Cross-reference to actions in other segments HT13 HT14
- B14 By 2027 assess the effectiveness of conservation efforts to protect waterbirds against threats and pressures
- B33 By 2024 develop a roadmap to fill gaps to enable a holistic assessment for all relevant ecosystem components and pressures and, by 2030 at the latest, develop and fully operationalise a set of indicators fulfilling HELCOM’s needs, including the need to provide a regional platform for the Marine Strategy Framework Directive (MSFD).
The core indicator is relevant to the following action of the 2013 HELCOM Ministerial Declaration:
- 4 (B). WE DECIDE to protect seabirds in the Baltic Sea, taking into consideration migratory species and need for co-operation with other regions through conventions and institutions such as the Agreement on Conservation of African Eurasian Migratory Waterbirds (AEWA) under the Convention on Migratory Species (CMS), and particularly in the North Sea (OSPAR) and Arctic (Arctic Council) areas.
And the following action from the 2018 HELCOM Ministerial Declaration:
- 43. WE COMMIT to increasing the protection and restoration of biodiversity, to intensifying regional, subregional and cross-sectoral cooperation, and to preserving and promoting the ecological balance of the Baltic Sea area with strengthened resilience, also as streamlined response to adaptation needs stemming from human-induced climate change;
- 59. WE AGREE to strengthen the fruitful cooperation with OSPAR on transboundary issues and common challenges to gain efficiency and effectiveness in the implementation of SDGs such as ballast water management and introduction of invasive alien species, the issue of underwater noise, micro-plastic, migratory birds, MPA network and management, and threatened and endangered species
The core indicator also addresses the following qualitative descriptors of the MSFD for determining good environmental status (European Commission 2008):
Descriptor 1: ‘Biological diversity is maintained. The quality and occurrence of habitats and the distribution and abundance of species are in line with prevailing physiographic, geographic and climatic conditions’;
Descriptor 4: ‘All elements of the marine food webs, to the extent that they are known, occur at normal abundance and diversity and levels capable of ensuring the long-term abundance of the species and the retention of their full reproductive capacity’.
and the following criteria of the Commission Decision (European Commission 2017):
- Criterion D1C2 (population abundance)
- Criterion D1C3 (population demographic characteristics)
- Criterion D1C4 (species distribution)
- Criterion D1C5 (habitat for the species)
- Criterion D4C1 (diversity of trophic guild)
- Criterion D4C2 (balance of total abundance between trophic guilds)
- Criterion D4C4 (productivity of trophic guild)
The EU Birds Directive (a) lists in Annex 1 barnacle goose, pied avocet, dunlin (Baltic subspecies Calidris alpina schinzii), Caspian tern, sandwich tern, common tern, Arctic tern and little tern as subject of special conservation measures and (b) generally covers all migratory species and they have to be reported (European Commission 2010). Thus, all species included in the concept of the indicator are also covered by the EU Birds Directive, which requires conservation of habitats in a way that allows birds to breed, moult, stage during migration and spend the winter.
Furthermore, the Baltic Sea is located in the agreement area of the Agreement on the Conservation of African-Eurasian Migratory Waterbirds (AEWA). Contracting Parties (all HELCOM member countries except Poland and Russia) are obliged to undertake measures warranting the conservation of migratory waterbirds and their habitats.
The goals of the BSAP, EU MSFD, AEWA and EU Birds Directive are largely overlapping and the data needed for the indicator are roughly the same as needed for reporting within the framework of the EU Birds Directive.
In order to protect migrating birds in the Baltic Sea region, HELCOM has adopted the Recommendation 34/E-1 ‘Safeguarding important bird habitats and migration routes in the Baltic Sea from negative effects of wind and wave energy production at sea’. Since some species included in the concept of the indicator are vulnerable to habitat loss caused by wind farms and access to feeding areas of breeding birds may be blocked by wind farms, while others are prone to collisions (e.g., Masden et al. 2010, Furness et al. 2013, Bradbury et al. 2014), the indicator is linked to the intentions of the recommendation.
The indicator supports the UN Sustainable Development Goal 14: Conserve and sustainably use the oceans, sea and marine resources for sustainable development.
An overview is provided in Table 1.
Table 1. Policy relevance of the HELCOM core indicator ‘Abundance of waterbirds in the breeding season’.
| Baltic Sea Action Plan (BSAP) | Marine Strategy Framework Directive (MSFD) | |
| Fundamental link | Segment: Biodiversity
Goal: “Baltic Sea ecosystem is healthy and resilient”
|
Descriptor 1 species groups of birds, mammals, reptiles, fish and cephalopods
|
| Complementary link |
Goal: “Baltic Sea unaffected by eutrophication”
|
Descriptor 1 Species groups of birds, mammals, reptiles, fish and cephalopods
Descriptor 4 Ecosystems, including food webs
|
| Other relevant legislation: | In some countries also EU Birds Directive (migrating species Article 4 (2); barnacle goose, pied avocet, dunlin (subspecies schinzii), Mediterranean gull, Caspian tern, sandwich tern, common tern, Arctic tern, little tern listed in Annex I); Birds Directive Article 12 report, parameter “Population trend”; EU Habitats Directive and Agreement on the Conservation of African-Eurasian Migratory Waterbirds (AEWA); UN Sustainable Development Goal 14. | |
2.3 Relevance for other assessments
The results of this indicator are well suited to feed into the thematic assessment for birds and into HOLAS 3 (via the BEAT tool).
According to the guidelines for MSFD biodiversity assessments under MSFD Article 8, abundance is a primary criterion (D1C2), which shall be integrated with demography (D1C3, secondary criterion) and by-catch mortality (D1C1, primary criterion) using conditional rules with all three criteria having the same weight (European Commission 2022).
In principle, trends obtained from the breeding abundance indicator are part of the demographic information used in the breeding success indicator. However, in the first evaluation of breeding success by the example of the common guillemot at Gotland it appeared more appropriate to use the trend of the same colony rather than applying the trend of the entire Baltic Sea population.
3 Threshold values
3.1 Setting the threshold value(s)
The status of a breeding waterbird species is evaluated by comparing geometric mean of index values from the six years of the assessment period, 2016-2021, to the baseline. The baseline is defined by a reference period, i.e. the mean of the ten years 1991-2000, which is scaled to 1. A species does not achieve good status if the abundance deviates more than 30% (20% in species laying only one egg per year) downwards from the abundance in the baseline period. The status of a species group (for definitions see below) is evaluated by examining the proportion of breeding waterbird species evaluated as being in good status. The threshold value is achieved if 75% of the species deviate less than 30%/20% downwards from the baseline. A schematic representation of a threshold value is provided in Figure 2.
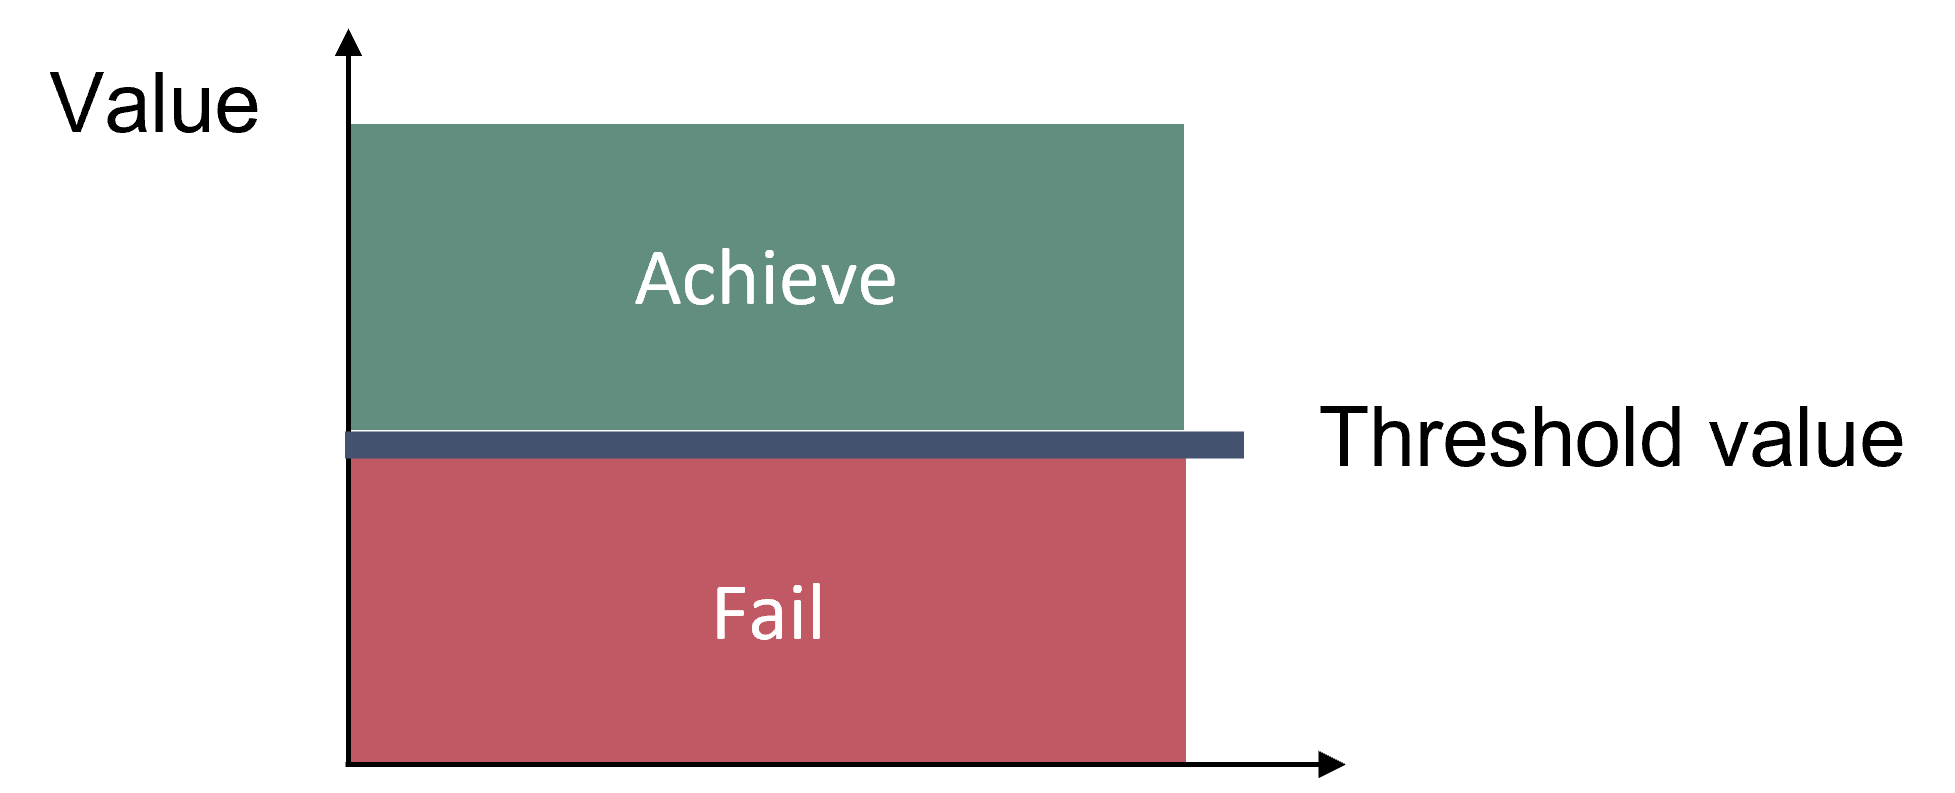
Figure 2. Schematic representation of the threshold value applied in the ‘Abundance of waterbirds in the breeding season’ core indicator.
This threshold concept follows the same concept as the OSPAR Indicator ‘Marine bird abundance’ (ICES 2013, OSPAR 2017). Upward deviations (>30% above abundance at the baseline) are not considered to reflect a failure to achieve the threshold value indicating good status, however they are reported as possible indications of imbalance in the ecosystem. The applicability of this method in the Baltic Sea has been shown in preceding versions of this indicator (Herrmann et al. 2013, HELCOM 2018). Good status is possible to achieve also for species identified as being threatened in the Baltic Sea (HELCOM 2013), when the species maintained its population size on a low level or even increased while still being under pressure from anthropogenic influence.
The multi-species evaluation can be conducted using all species without any weighting, but then the results are biased with regard to the numbers of species in the species groups. More meaningful results are obtained when species groups form the basis of the evaluation. The OSPAR/HELCOM/ICES Joint Working Group on Marine Birds (JWGBIRD) has defined terminology and composition of functional species groups, which are defined mainly by the way of foraging (ICES 2015, see Table 2). The group also identified bird species suitable for supporting the breeding waterbird abundance indicator (ICES 2016). Thus, this indicator provides five evaluations when applied to
- wading feeders (six species: common shelduck, Eurasian oystercatcher, pied avocet, ringed plover, turnstone, dunlin),
- surface feeders (ten species: Arctic skua, common gull, herring gull, great black-backed gull, lesser black-backed gull, little tern, Caspian tern, sandwich tern, common tern, Arctic tern),
- pelagic feeders (seven species: great crested grebe, great cormorant, goosander, red-breasted merganser, razorbill, common guillemot, black guillemot),
- benthic feeders (four species: greater scaup, tufted duck, common eider, velvet scoter) and
- grazing feeders (three species: mute swan, barnacle goose, greylag goose).
It has to be noted that some species apply more than one foraging mode (ICES 2016). Of the species selected for this indicator, this holds true for some gulls (which are also wading feeders) and the great cormorant (which is also a benthic feeder).
Given the composition of the species groups, the five evaluations are based on a different number of species per group. For example, in surface feeders, eight out of ten species would need to be above the threshold, while in grazing feeders all three species would have to be above the threshold level, because two out of three species would mean that only 67% of the species do not deviate from the baseline too much (but 75% is required).
The selection of species evaluated in the indicator was related only to breeding occurrence in Baltic marine habitats and data availability, but independent of threat status.
Table 2: Species groups of waterbirds as defined by JWGBIRD (ICES 2015).
| Species group | Typical feeding behaviour | Typical food types | Additional guidance |
|---|---|---|---|
| Wading feeders | Walk/wade in shallow waters | Invertebrates (molluscs, polychaetes, etc.) | |
| Surface feeders | Feed within the surface layer (within 1–2 m of the surface) | Small fish, zooplankton and other invertebrates | “Surface layer” defined in relation to normal diving depth of plunge-divers (except gannets) |
| Pelagic feeders | Feed at a broad depth range in the water column | Pelagic and demersal fish and invertebrates (e.g. squid, zooplankton) | Include only spp. that usually dive by actively swimming underwater; but including gannets. Includes species feeding on benthic fish (e.g. flatfish). |
| Benthic feeders | Feed on the seafloor | Invertebrates (e.g. molluscs, echinoderms) | |
| Grazing feeders | Grazing in intertidal areas and in shallow waters | Plants (e.g. eelgrass, saltmarsh plants), algae | Geese, swans and dabbling ducks, coot |
4 Results and discussion
4.1 Status valuation
Abundance – whole Baltic Sea scale
The abundance component of the indicator is based on counts of breeding pairs, nests or individuals belonging to a breeding population. The indicator is applied to a broad spectrum of waterbird species.
The analysis, spanning the reference period (1991-2000) and the assessment period (2016-2021), is based on data of 30 waterbird species.
In 24 of the 30 species evaluations for the entire Baltic Sea, the geometric mean of index values in the assessment period (2016-2021) deviated less than 30% (species laying two eggs per year) or 20% (species laying one egg per year) downwards from the modern baseline defined as the average index values in the reference period 1991-2000. These 24 species are estimated to be in a good status. However, six species deviated more than 30% downwards from the baseline, which indicates that they are not in a good status.
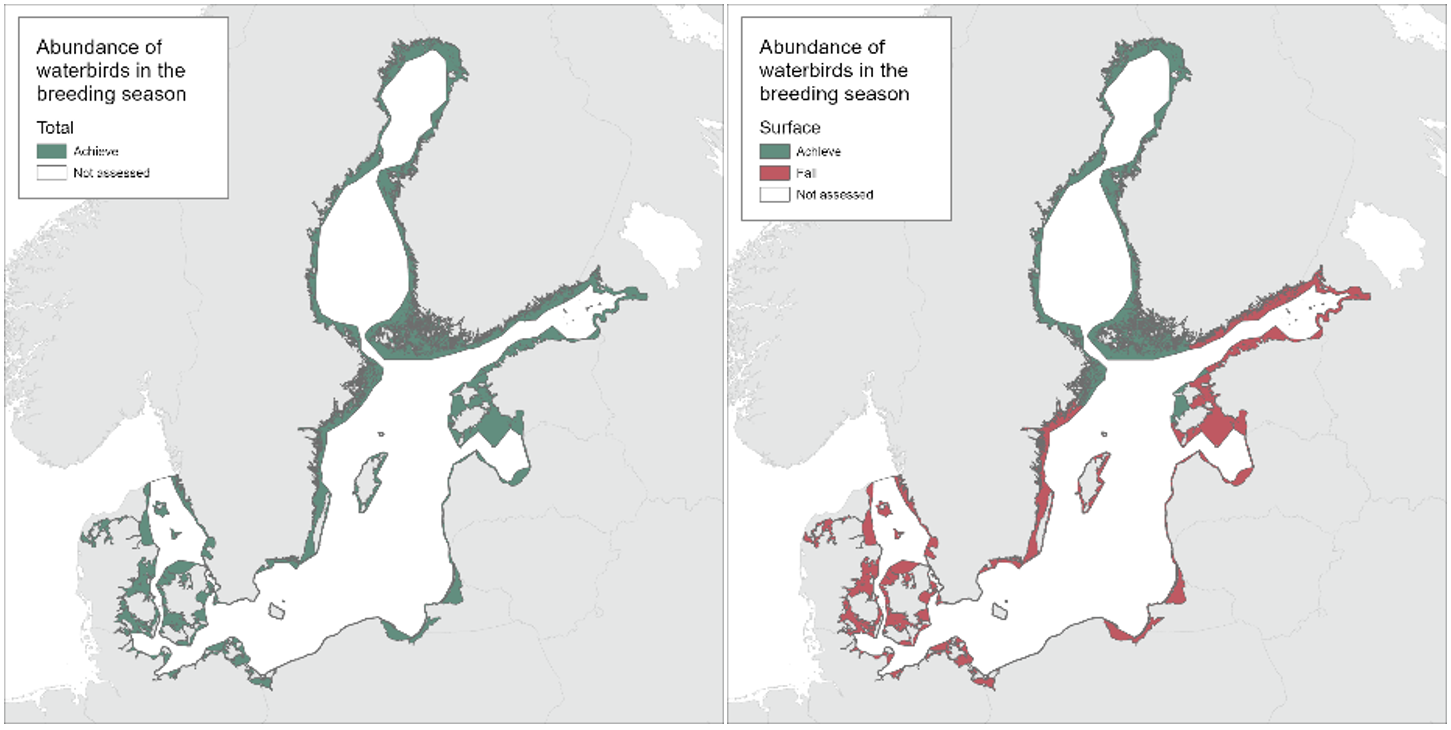
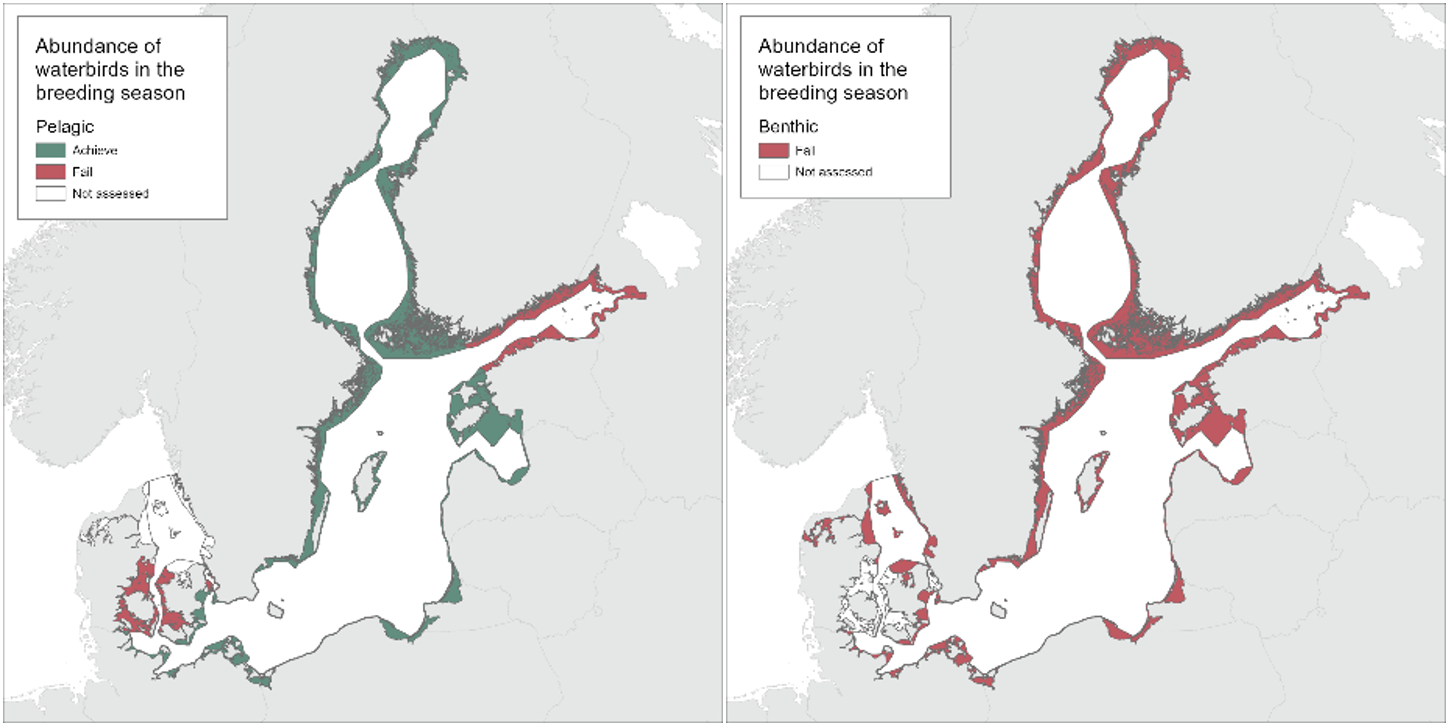
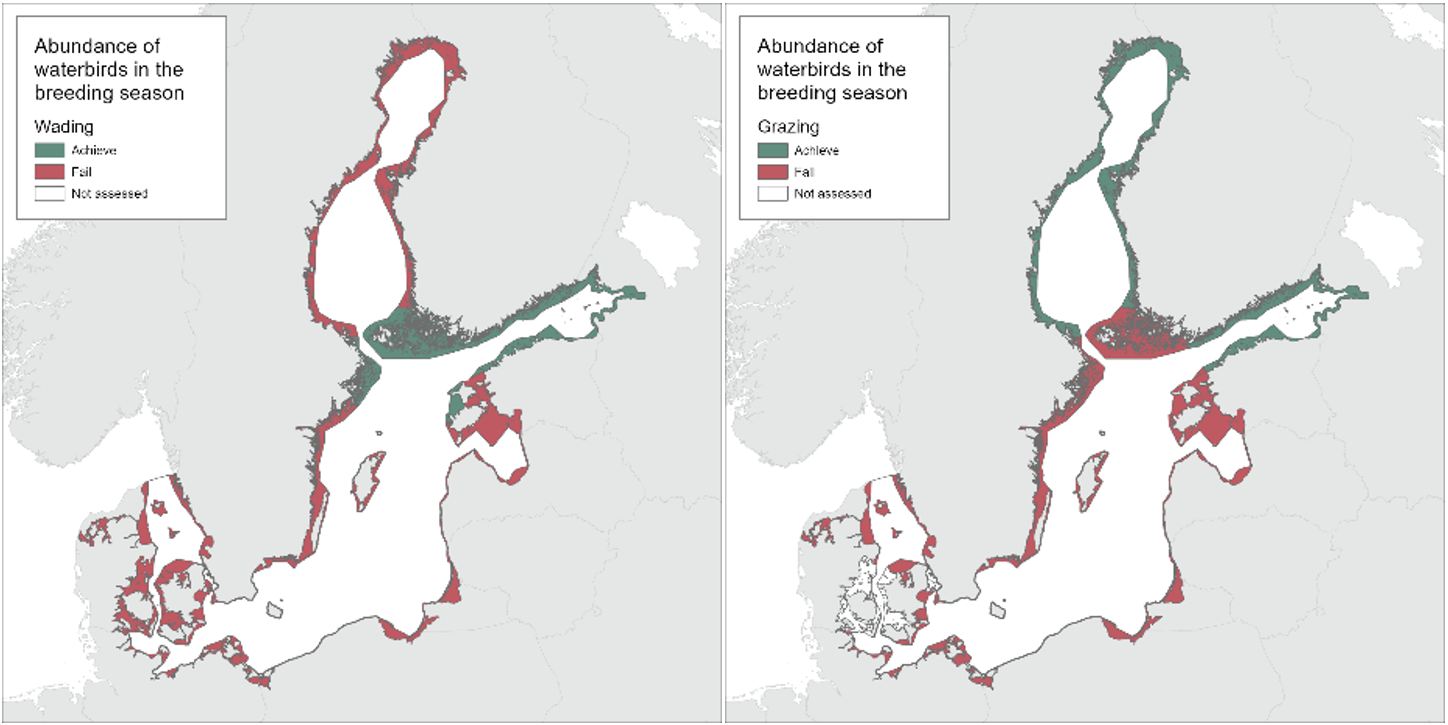
The status evaluation for the species groups give diverging results. Breeding waterbirds of three species groups achieved the threshold value of 75% of species deviating less than 30%:
- surface feeders: 9 out of 10 (90%) species’ index values deviate less than 30%,
- pelagic feeders: 7 out of 7 (100%) species’ index values deviate less than 30% (including razorbill and common guillemot deviating less than 20%),
- grazing feeders: 3 out of 3 (100%) species’ index values deviate less than 30%.
In contrast, two species groups failed to achieve the threshold value of 75% of species deviating less than 30%:
- benthic feeders: 1 out of 4 (25%) species’ index values deviate less than 30% and
- wading feeders: 2 out of 6 (67%) species’ index values deviate less than 30%.
Index values of the species included in the evaluation are listed in Table 3 and can be used for national MSFD reporting for those HELCOM Contracting Parties that are also EU Member States.
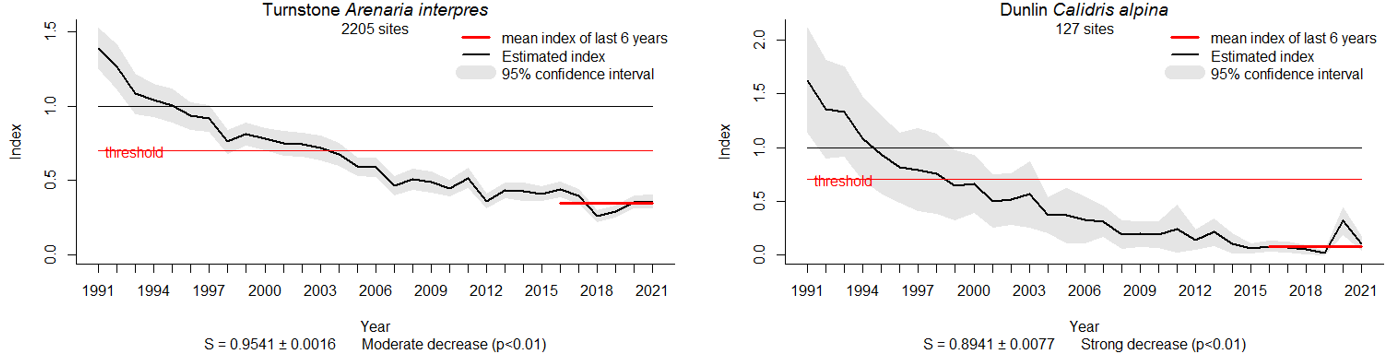
Species failing to achieve the threshold level (deviate more than 30%) in the years 2016-2021 were common gull, greater scaup, common eider, velvet scoter, turnstone and dunlin.
Species that increased so much that their average index value for 2016-2021 exceeds 130% of the baseline level, which according to the indicator concept are reported as a signal for possible imbalance in the environment, were to a large extant fish-eating species (great crested grebe, common guillemot, razorbill, sandwich tern, common tern and Caspian tern), but also all grazing feeders (mute swan, barnacle goose, greylag goose).
Table 3 presents trends calculated for the whole period (1991-2021), with details listed in Table 4 as information to support the interpretation of the status results in a more long-term perspective. Though still indicating good status, five species are significantly declining (great black-backed gull, goosander, red-breasted merganser, tufted duck and pied avocet). All species not achieving good status in the indicator status evaluation also show significantly declining trends, most strongly in dunlin and common eider. Out of the 30 species evaluated, 13 show significant positive trends, ten significant negative trends, while six species appear to be stable, and for one species the result is uncertain.
Among the species included in the breeding waterbird abundance indicator, seven are classified as vulnerable, endangered or critically endangered on the HELCOM Red List (HELCOM 2013). Five of them are in poor status according to the indicator, with common eider and dunlin declining steeply, and velvet scoter and turnstone declining moderately (trend uncertain in the greater scaup; Table 5). Only two of the red-listed species show good status, the Caspian tern with increasing trend and the lesser black-backed gull with a stable population size. In the case of the lesser black-backed gull, the use of the indicator result for the whole Baltic Sea is not useful because only the subspecies fuscus is on the Red List. The subspecies fuscus only breeds in the subdivisions Gotland Group, Åland Group, Gulf of Finland and Bothnian Group, where increases, decreases and stability were found (Results tables 13, 15, 17 and 19).
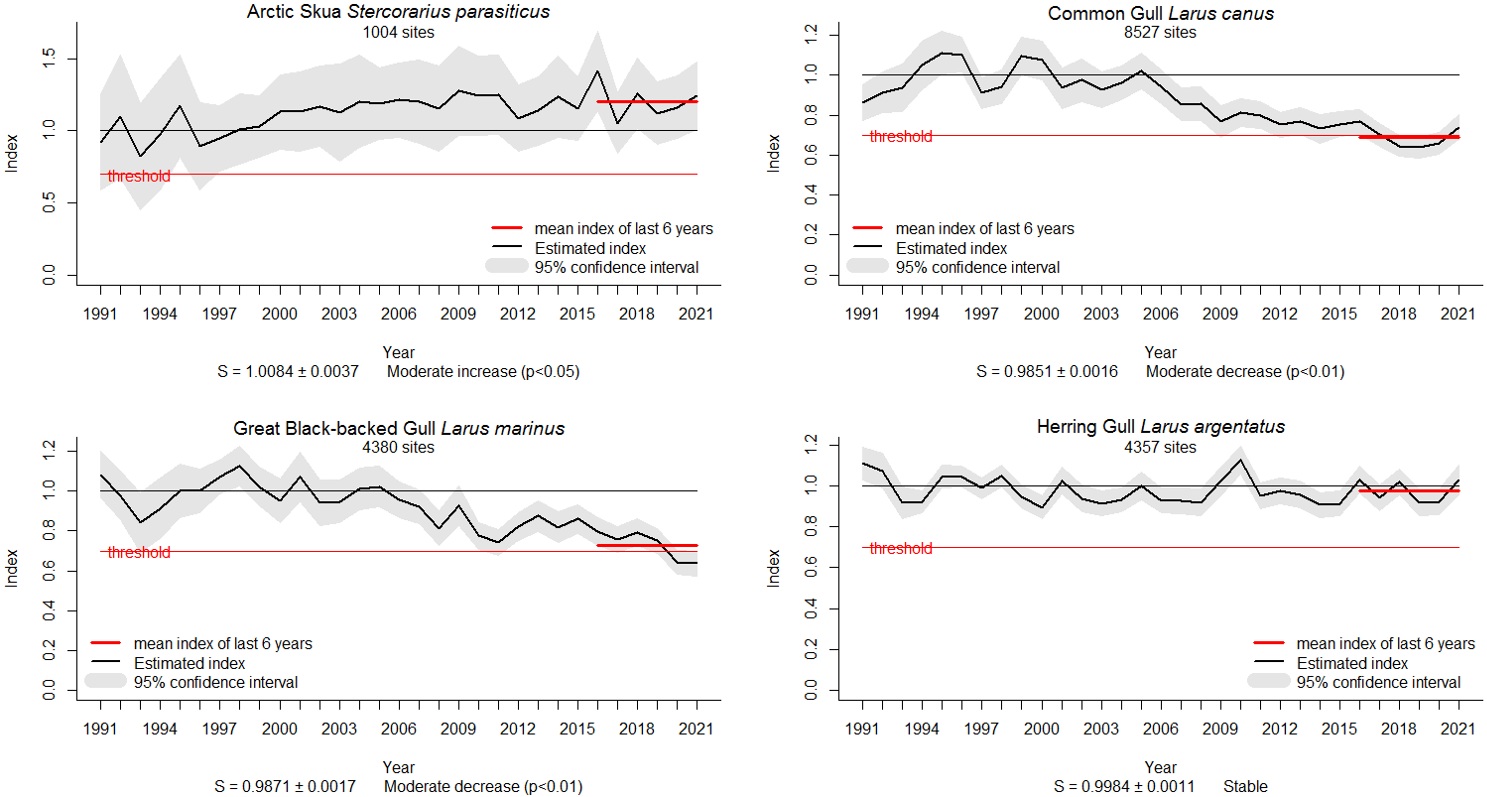
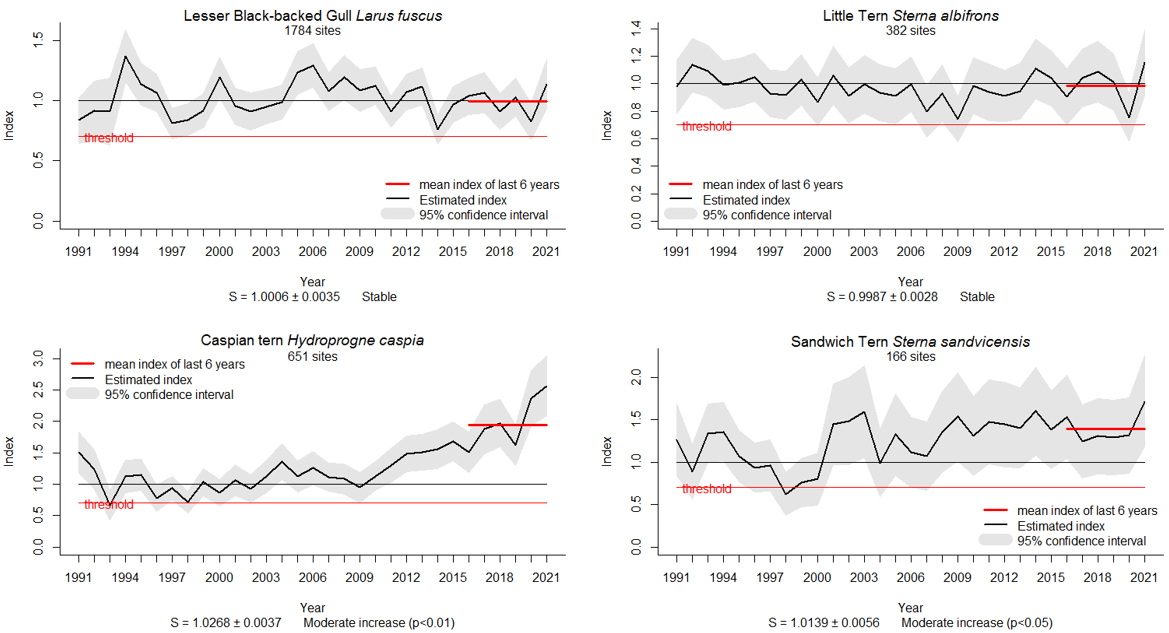
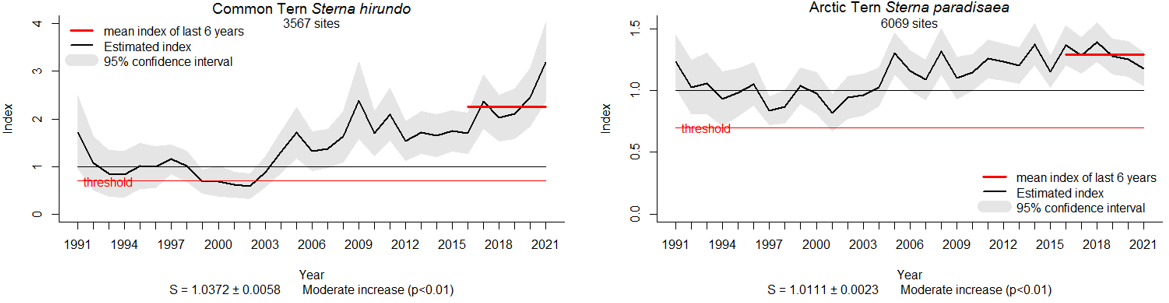
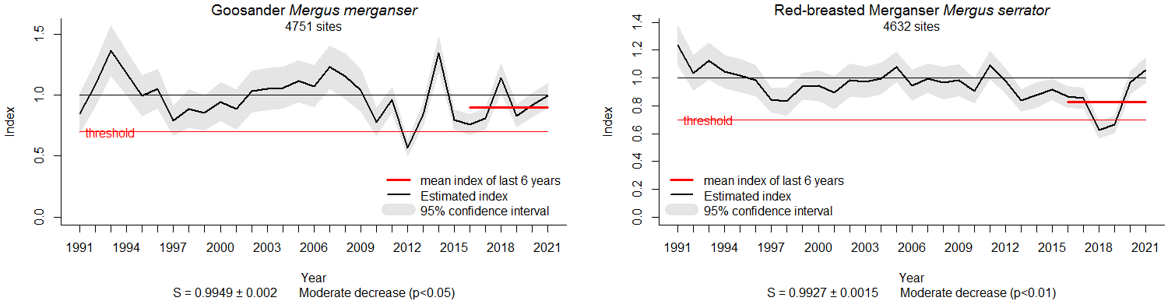
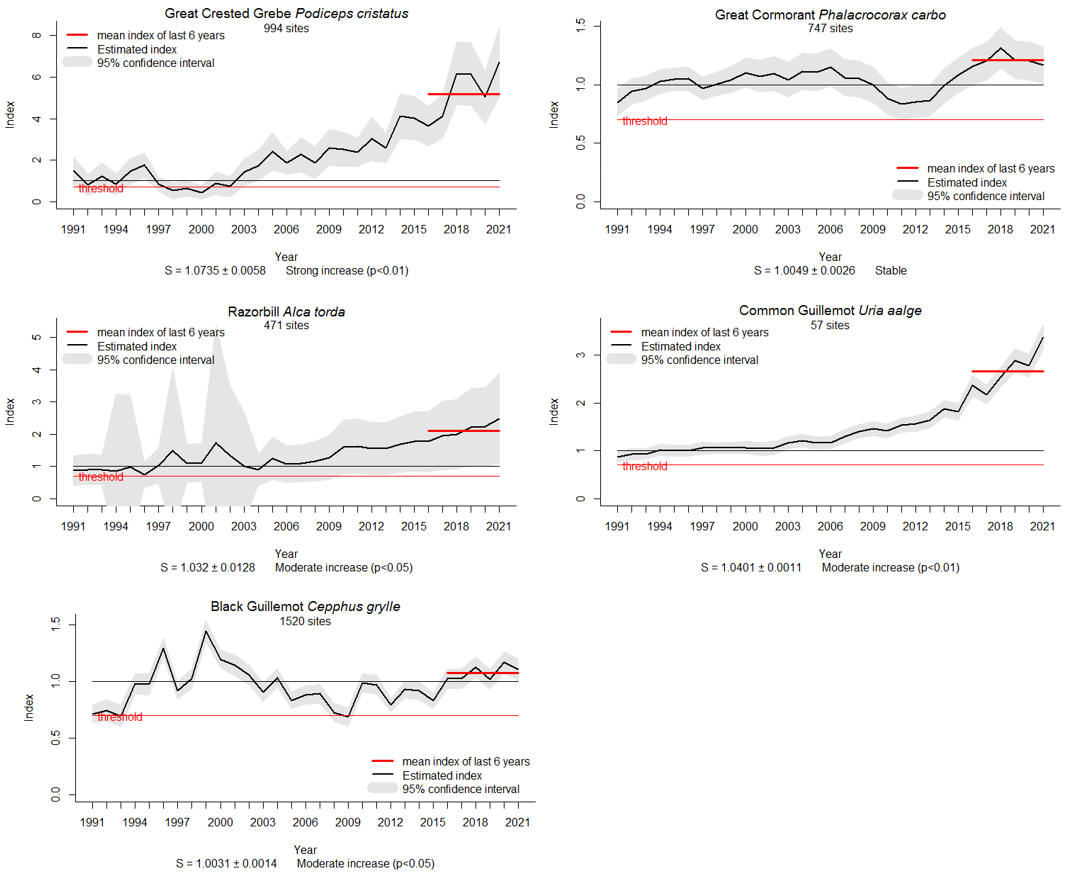
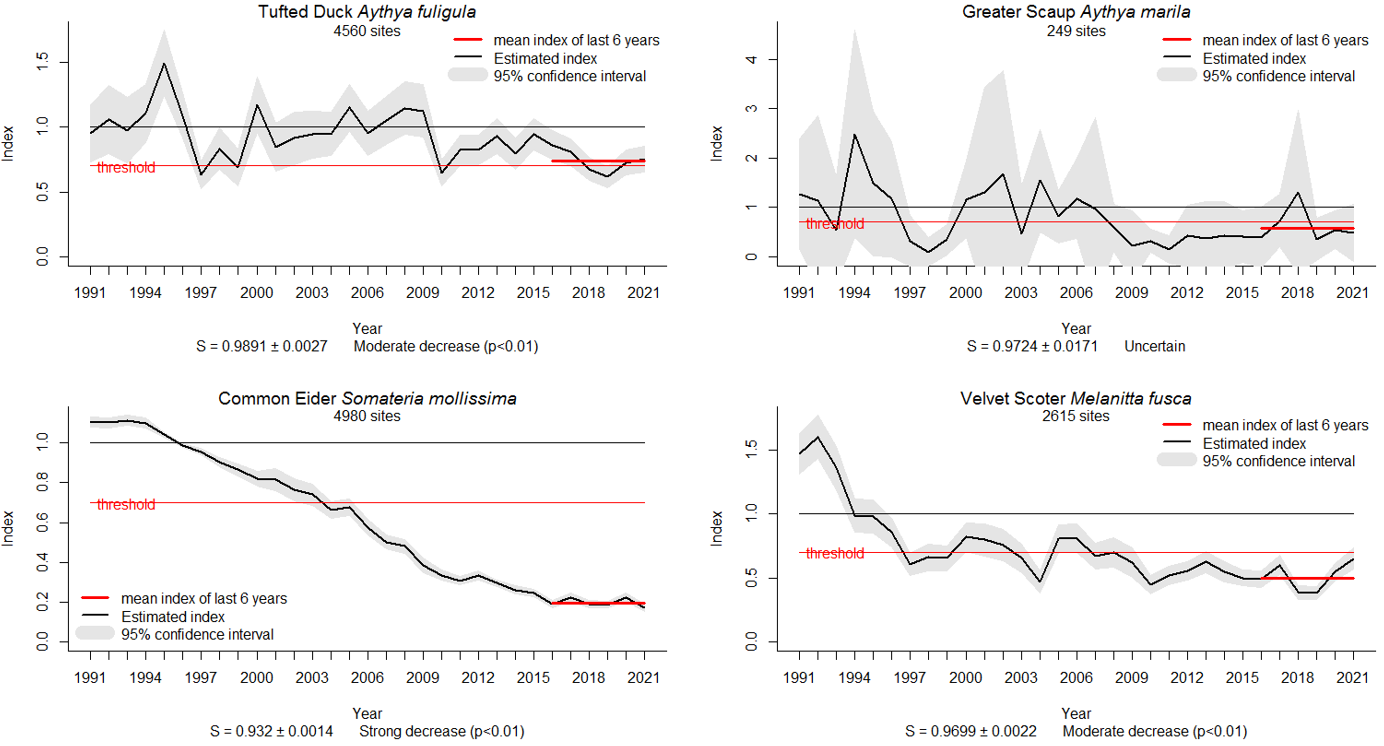
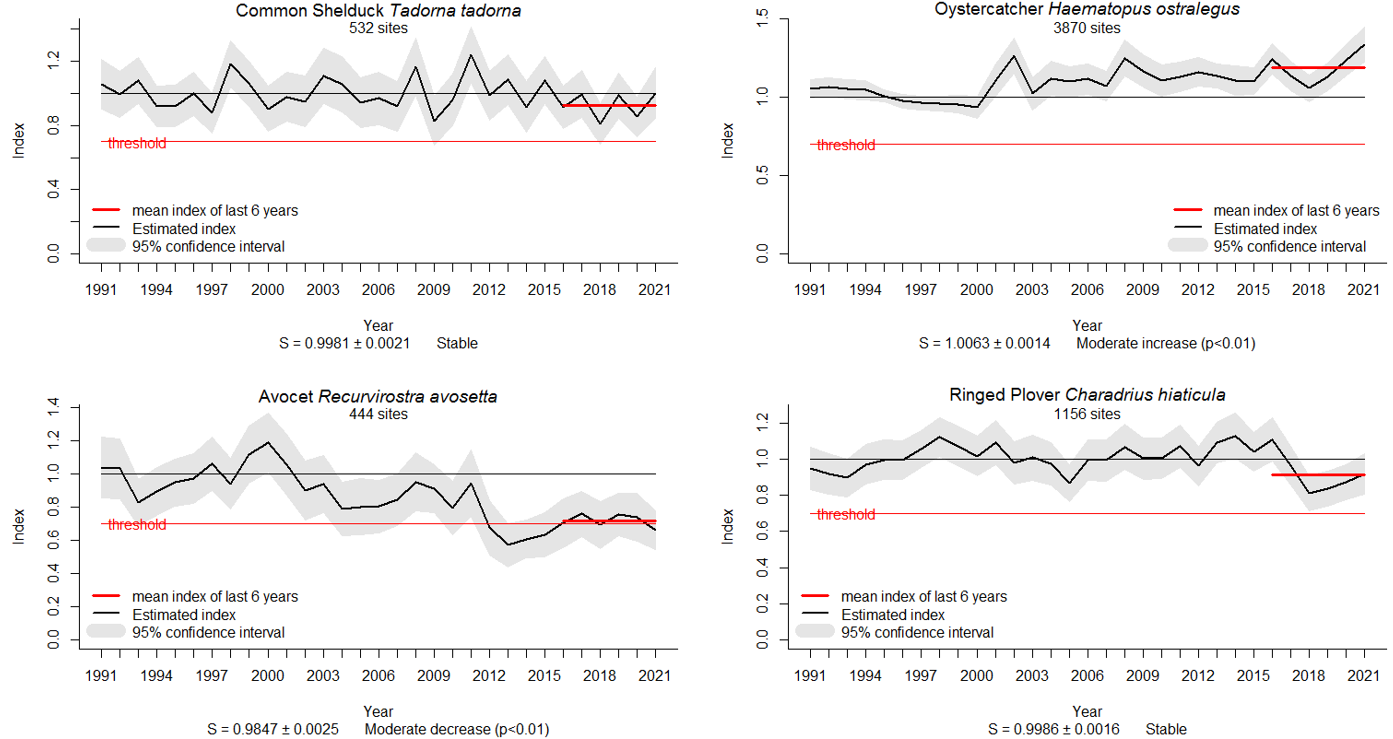
Graphs showing index values are provided in Figure 3.
The abundance parameter evaluates data from regular monitoring activities of the coastal countries, but also includes data from some other sources and surveys. If a wider scope would be aimed for, the indicator could be updated using more data from additional sites and stemming from various mapping activities outside regular monitoring programmes. Such a filling of gaps in the regular monitoring with additional data sources could improve the confidence and coverage of the indicator evaluation in the future.
Table 3. Evaluation of the status of breeding waterbirds in the entire Baltic Sea for the period 2016-21. Index values (single years and mean) are scaled to the average of the reference period (1991-2000, index value set to 1). Good status is shown by green colour, if in individual species the threshold level of 0.7 (0.8 in species laying only one egg per year: razorbill, common guillemot) is met for the geometric mean 2016-2021 and for species groups if at least 75% of the species are in good status. If the index value exceeds 1.3 indicating a large abundance increase the status is still considered good but indicated in orange. Red colour means that the species or the species groups is not in good status. Trends for the period 1991-2021 are shown as ↑↑ (strong increase), ↑ (moderate increase), → (stable), ↓ (moderate decline) and ↓↓ (strong decline), with * when p<0.05 and ** when p<0.01 (?: uncertain; for details see Table 4).
| index values | |||||||||||
| group | species | number of sites | 2016 | 2017 | 2018 | 2019 | 2020 | 2021 | mean 2016-2021 | good status? | trend 1991-2021 |
| surface feeders | Arctic skua | 1004 | 1.413 | 1.054 | 1.258 | 1.122 | 1.163 | 1.242 | 1.203 | yes | ↑* |
| common gull | 8527 | 0.767 | 0.702 | 0.646 | 0.637 | 0.659 | 0.741 | 0.690 | no | ↓** | |
| great black-backed gull | 4380 | 0.798 | 0.759 | 0.795 | 0.751 | 0.643 | 0.635 | 0.727 | yes | ↓* | |
| herring gull | 4357 | 1.031 | 0.943 | 1.021 | 0.918 | 0.922 | 1.030 | 0.976 | yes | → | |
| lesser black-backed gull | 1784 | 1.037 | 1.065 | 0.910 | 1.029 | 0.828 | 1.135 | 0.995 | yes | → | |
| little tern | 382 | 0.907 | 1.043 | 1.088 | 1.014 | 0.755 | 1.154 | 0.984 | yes | → | |
| Caspian tern | 651 | 1.509 | 1.874 | 1.970 | 1.616 | 2.366 | 2.566 | 1.948 | yes | ↑** | |
| sandwich tern | 166 | 1.531 | 1.244 | 1.306 | 1.289 | 1.314 | 1.713 | 1.390 | yes | ↑* | |
| common tern | 3567 | 1.697 | 2.363 | 2.021 | 2.106 | 2.452 | 3.190 | 2.260 | yes | ↑** | |
| Arctic tern | 6069 | 1.365 | 1.284 | 1.389 | 1.275 | 1.255 | 1.173 | 1.288 | yes | ↑** | |
| pelagic feeders | goosander | 4751 | 0.759 | 0.807 | 1.142 | 0.828 | 0.916 | 0.994 | 0.899 | yes | ↓* |
| red-breasted merganser | 4632 | 0.866 | 0.856 | 0.628 | 0.665 | 0.966 | 1.058 | 0.825 | yes | ↓** | |
| great crested grebe | 994 | 3.650 | 4.116 | 6.177 | 6.141 | 5.034 | 6.697 | 5.175 | yes | ↑↑** | |
| great cormorant | 747 | 1.156 | 1.201 | 1.314 | 1.211 | 1.203 | 1.167 | 1.208 | yes | → | |
| razorbill | 471 | 1.768 | 1.956 | 1.997 | 2.224 | 2.231 | 2.485 | 2.098 | yes | ↑* | |
| common guillemot | 57 | 2.363 | 2.178 | 2.546 | 2.891 | 2.785 | 3.367 | 2.661 | yes | ↑* | |
| black guillemot | 1520 | 1.024 | 1.026 | 1.128 | 1.021 | 1.168 | 1.107 | 1.078 | yes | ↑* | |
| benthic feeders | tufted duck | 4560 | 0.861 | 0.807 | 0.678 | 0.615 | 0.728 | 0.755 | 0.736 | yes | ↓** |
| greater scaup | 249 | 0.390 | 0.732 | 1.309 | 0.347 | 0.547 | 0.487 | 0.571 | no | ? | |
| common eider | 4980 | 0.190 | 0.223 | 0.189 | 0.186 | 0.222 | 0.171 | 0.196 | no | ↓↓** | |
| velvet scoter | 2615 | 0.491 | 0.601 | 0.386 | 0.381 | 0.546 | 0.649 | 0.499 | no | ↓** | |
| wading feeders | common shelduck | 532 | 0.913 | 0.997 | 0.811 | 0.987 | 0.854 | 1.003 | 0.924 | yes | → |
| Eurasian oystercatcher | 3870 | 1.244 | 1.136 | 1.058 | 1.130 | 1.235 | 1.333 | 1.186 | yes | ↑** | |
| pied avocet | 444 | 0.703 | 0.758 | 0.691 | 0.754 | 0.738 | 0.658 | 0.716 | yes | ↓** | |
| ringed plover | 1156 | 1.110 | 0.965 | 0.810 | 0.836 | 0.871 | 0.920 | 0.914 | yes | → | |
| turnstone | 2205 | 0.439 | 0.395 | 0.261 | 0.294 | 0.354 | 0.361 | 0.345 | no | ↓** | |
| dunlin | 127 | 0.079 | 0.070 | 0.048 | 0.016 | 0.313 | 0.101 | 0.071 | no | ↓↓** | |
| grazing feeders | mute swan | 4187 | 1.137 | 1.191 | 1.414 | 1.452 | 1.558 | 1.540 | 1.372 | yes | ↑** |
| barnacle goose | 1310 | 9.665 | 8.675 | 13.362 | 9.813 | 9.626 | 6.504 | 9.397 | yes | ↑↑** | |
| greylag goose | 2732 | 1.261 | 1.631 | 1.529 | 1.334 | 1.522 | 1.595 | 1.472 | yes | ↑** | |
Table 4. Trends observed in breeding waterbirds in the entire Baltic Sea 1991-2021. Trend slopes and standard errors result from TRIM analyses.
| group | species | number of sites | trend slope | S.E. | p | trend |
| surface feeders | Arctic skua | 1004 | 1.0084 | 0.0037 | <0.05 | moderate increase |
| common gull | 8527 | 0.9851 | 0.0016 | <0.01 | moderate decrease | |
| great black-backed gull | 4380 | 0.9871 | 0.0017 | <0.01 | moderate decrease | |
| herring gull | 4357 | 0.9984 | 0.0011 | stable | ||
| lesser black-backed gull | 1784 | 1.0006 | 0.0035 | stable | ||
| little tern | 382 | 0.9987 | 0.0028 | stable | ||
| Caspian tern | 651 | 1.0268 | 0.0037 | <0.01 | moderate increase | |
| sandwich tern | 166 | 1.0139 | 0.0056 | <0.05 | moderate increase | |
| common tern | 3567 | 1.0372 | 0.0058 | <0.01 | moderate increase | |
| Arctic tern | 6069 | 1.0111 | 0.0023 | <0.01 | moderate increase | |
| pelagic feeders | goosander | 4751 | 0.9949 | 0.0020 | <0.05 | moderate decrease |
| red-breasted merganser | 4632 | 0.9927 | 0.0015 | <0.01 | moderate decrease | |
| great crested grebe | 994 | 1.0735 | 0.0058 | <0.01 | strong increase | |
| great cormorant | 747 | 1.0049 | 0.0026 | stable | ||
| razorbill | 471 | 1.0320 | 0.0128 | <0.05 | moderate increase | |
| common guillemot | 57 | 1.0401 | 0.0011 | <0.01 | moderate increase | |
| black guillemot | 1520 | 1.0031 | 0.0014 | <0.05 | moderate increase | |
| benthic feeders | tufted duck | 4560 | 0.9891 | 0.0027 | <0.01 | moderate decrease |
| greater scaup | 249 | 0.9724 | 0.0171 | uncertain | ||
| common eider | 4980 | 0.9320 | 0.0014 | <0.01 | strong decrease | |
| velvet scoter | 2615 | 0.9699 | 0.0022 | <0.01 | moderate decrease | |
| wading feeders | common shelduck | 532 | 0.9981 | 0.0021 | stable | |
| Eurasian oystercatcher | 3870 | 1.0063 | 0.0014 | <0.01 | moderate increase | |
| pied avocet | 444 | 0.9847 | 0.0025 | <0.01 | moderate decrease | |
| ringed plover | 1156 | 0.9986 | 0.0016 | stable | ||
| turnstone | 2205 | 0.9541 | 0.0016 | <0.01 | moderate decrease | |
| dunlin | 127 | 0.8941 | 0.0077 | <0.01 | strong decrease | |
| grazing feeders | mute swan | 4187 | 1.0151 | 0.0010 | <0.01 | moderate increase |
| barnacle goose | 1310 | 1.1127 | 0.0079 | <0.01 | strong increase | |
| greylag goose | 2732 | 1.0166 | 0.0020 | <0.01 | moderate increase |
Table 5. Summary results for waterbirds included as vulnerable (VU), endangered (EN) or critically endangered (CR) on the HELCOM Red List for breeding birds (HELCOM 2013). Index values, status, trend slopes and trends as in Tables 2 and 3. GES: Good Environmental Status achieved; sub-GES: Good Environmental Status not achieved.
| Species | Red List status | Index 2016-2021 | Status | Trend slope | Trend |
| lesser black-backed gull | VU | 0.995 | GES | 1.0006 | stable |
| Caspian tern | VU | 1.948 | GES | 1.0268 | moderate increase |
| greater scaup | VU | 0.571 | sub-GES | 0.9724 | uncertain |
| common eider | VU | 0.196 | sub-GES | 0.9320 | strong decrease |
| velvet scoter | VU | 0.499 | sub-GES | 0.9699 | moderate decrease |
| turnstone | VU | 0.345 | sub-GES | 0.9541 | moderate decrease |
| dunlin | EN | 0.071 | sub-GES | 0.8941 | strong decrease |
Surface feeders
Pelagic feeders
Benthic feeders
Wading feeders
Grazing feeders
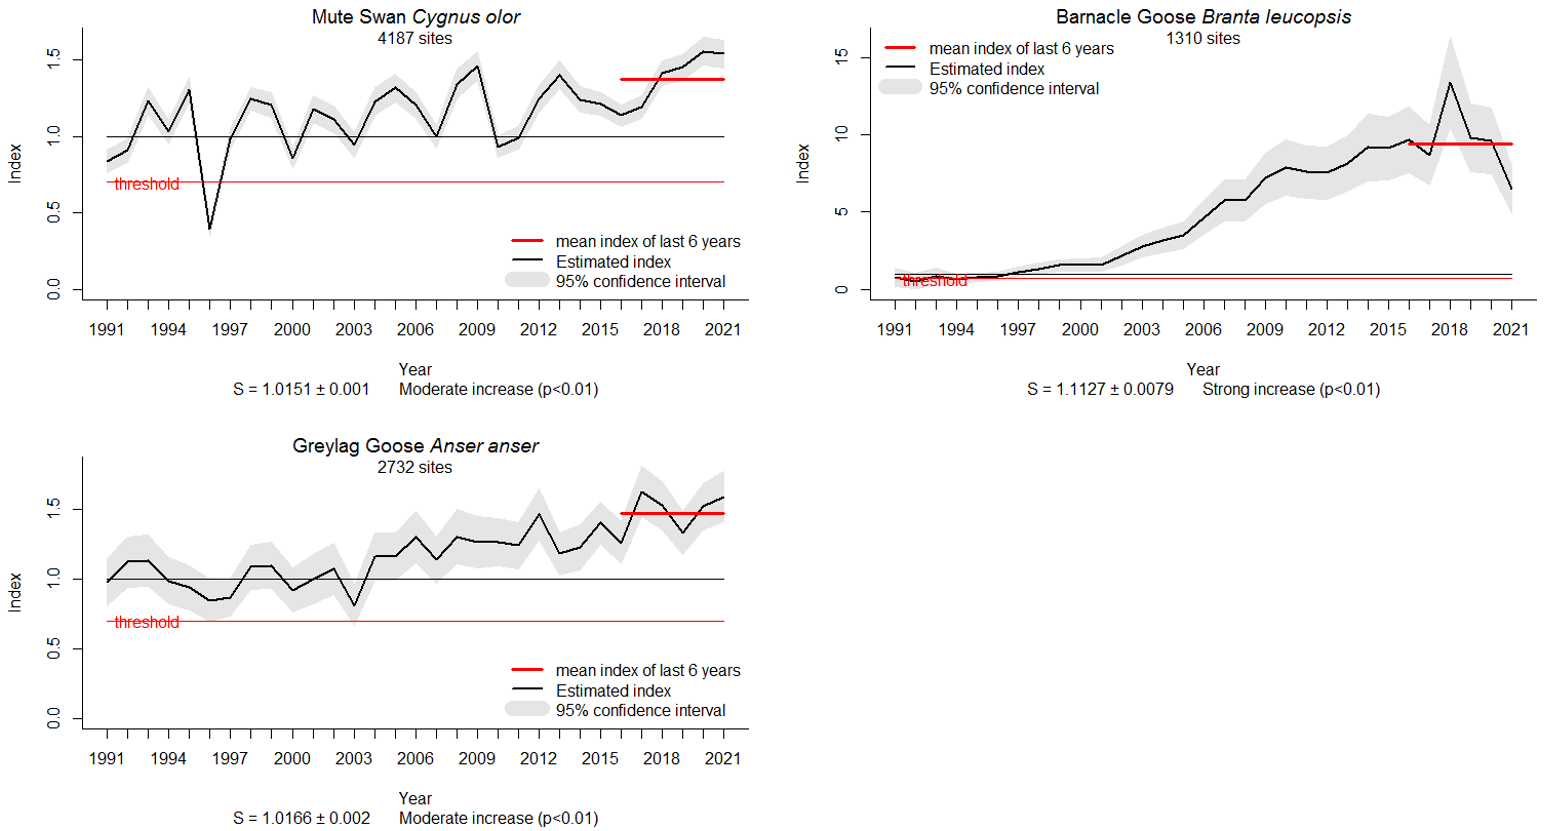
Figure 3. Index graphs showing annual index values for breeding waterbirds in the entire Baltic (black line) and 95% confidence intervals (grey shading) resulting from TRIM analyses after rescaling the annual indices to reference level where average of index values 1991-2000 is 1 (thin black line). Further shown are thresholds for good status (70% of baseline, 80% of baseline in species laying only one egg per year, thin red line) and the average index values 2016-2021 (geometric mean) used for the evaluation (red line). In addition, trend slopes and s.e. as well as the status of the species are given below the graphs.
Abundance – Baltic Sea Sub-divisions
The status of breeding waterbirds was also analysed on a smaller regional spatial scale, i.e. based on aggregations of sub-basins to form seven subdivisions (based on HELCOM assessment unit level 2, see Methodology). As not all species are breeding in each of these subdivisions, the number of species evaluated per subdivision is smaller than for the entire Baltic Sea. The analyses followed the same protocol as for the entire Baltic Sea evaluation.
Kattegat
In the Kattegat, only 42% of the 12 waterbird species evaluated passed the threshold value and therefore the breeding waterbirds did not achieve a good status in the period 2016-2021 (Table 6). The same holds true for surface feeders (good status in 2 out of 4 species, 50%), wading feeders (good status in 1 out of 4 species, 25%), and grazing feeders (good status in 2 out of 3 species, 67%). Further, the only benthic feeder, the common eider, was not in good status. Owing to lacking data the status of pelagic feeders could not be evaluated.
Table 6. Evaluation of the status of breeding waterbirds in the Kattegat for the period 2016-2021. Index values (single years and mean) are scaled to the average of the reference period (1991-2000, index value set to 1). For explanation see Table 3.
| index values | |||||||||||
| group | species | number of sites | 2016 | 2017 | 2018 | 2019 | 2020 | 2021 | mean 2016-2021 | good status? | trend 1991-2021 |
| surface feeders | common gull | 238 | 0.124 | 0.114 | 0.077 | 0.105 | 0.069 | 0.076 | 0.092 | no | ↓↓** |
| great black-backed gull | 147 | 2.408 | 2.591 | 2.522 | 2.275 | 1.387 | 1.401 | 2.028 | yes | ↑** | |
| herring gull | 194 | 2.290 | 2.088 | 2.582 | 1.726 | 1.867 | 2.745 | 2.186 | yes | ↑** | |
| lesser black-backed gull | 83 | 0.860 | 0.653 | 0.601 | 0.787 | 0.589 | 0.394 | 0.628 | no | ↓* | |
| benth. f. | common eider | 13 | 0.226 | 0.382 | 0.279 | 0.269 | 0.283 | 0.334 | 0.291 | no | ↓** |
| wading feeders | common shelduck | 13 | 0.651 | 0.510 | 0.471 | 0.730 | 0.681 | 0.641 | 0.606 | no | ? |
| Eurasian oystercatcher | 63 | 0.852 | 0.936 | 0.752 | 0.797 | 0.704 | 0.671 | 0.780 | yes | ? | |
| pied avocet | 146 | 0.531 | 0.641 | 0.628 | 0.737 | 0.803 | 0.580 | 0.647 | no | ↓* | |
| dunlin | 47 | 0.246 | 0.164 | 0.238 | 0.065 | 0.114 | 0.055 | 0.125 | no | ↓↓* | |
| grazing feeders | mute swan | 13 | 0.581 | 0.531 | 0.753 | 0.444 | 0.530 | 0.531 | 0.554 | no | ? |
| barnacle goose | 13 | 49.168 | 64.867 | 73.542 | 60.235 | 49.413 | 53.589 | 57.832 | yes | ↑↑* | |
| greylag goose | 13 | 4.971 | 6.773 | 8.785 | 6.905 | 6.700 | 11.146 | 7.310 | yes | ↑* | |
Out of the seven species not in good status, five showed significant declines over the period 1991-2021, most strongly observed for the common gull and dunlin (trend for mute swan uncertain, Table 7). Species in good status were increasing, with the steepest increase observed in barnacle goose. The trends of individual species are depicted in Figure 4 (Annex 1).
Table 7. Trends observed for breeding waterbirds in the Kattegat 1991-2021. Trend slopes and standard errors result from TRIM analyses.
| group | species | number of sites | trend slope | S.E. | p | trend |
| surface feeders | common gull | 238 | 0.9052 | 0.0052 | <0.01 | strong decrease |
| great black-backed gull | 147 | 1.0356 | 0.0036 | <0.01 | moderate increase | |
| herring gull | 194 | 1.0365 | 0.0030 | <0.01 | moderate increase | |
| lesser black-backed gull | 83 | 0.9828 | 0.0071 | <0.05 | moderate decrease | |
| benth. f. | common eider | 13 | 0.9426 | 0.0089 | <0.01 | moderate decrease |
| wading feeders | common shelduck | 13 | 0.9811 | 0.0393 | uncertain | |
| Eurasian oystercatcher | 63 | 0.9882 | 0.0222 | uncertain | ||
| pied avocet | 146 | 0.9847 | 0.0053 | <0.05 | moderate decrease | |
| dunlin | 47 | 0.9133 | 0.0122 | <0.05 | strong decrease | |
| grazing feeders | mute swan | 13 | 0.9713 | 0.0727 | uncertain | |
| barnacle goose | 13 | 1.1951 | 0.0545 | <0.05 | strong increase | |
| greylag goose | 13 | 1.0873 | 0.0382 | <0.05 | moderate increase |
Belt Group
In the Belt Group (Great Belt, The Sound), four out of 11 species did not reach the threshold level, thus with a pass rate of 64% the breeding waterbirds showed an overall poor status (Table 8). This also applies to the three species groups evaluated, where pass rates of 71% (surface feeders, 7 species) and 50% (pelagic and wading feeders, 2 species each) were observed. Grazing feeders and benthic feeders could not be evaluated due to a lack of data.
Table 8. Evaluation of the status of breeding waterbirds in the Belt Group for the period 2016-2021. Index values (single years and mean) are scaled to the average of the reference period (1991-2000, index value set to 1). For explanation see Table 3.
| index values | |||||||||||
| group | species | number of sites | 2016 | 2017 | 2018 | 2019 | 2020 | 2021 | mean 2016-2021 | good status? | trend 1991-2021 |
| surface feeders | common gull | 355 | 0.673 | 0.449 | 0.625 | 0.405 | 0.337 | 0.463 | 0.478 | no | ↓** |
| great black-backed gull | 173 | 0.997 | 0.633 | 1.074 | 1.328 | 0.946 | 1.155 | 0.997 | yes | → | |
| lesser black-backed gull | 94 | 1.062 | 1.227 | 1.432 | 1.284 | 1.800 | 0.638 | 1.184 | yes | → | |
| little tern | 109 | 1.147 | 1.091 | 1.150 | 1.581 | 0.906 | 1.149 | 1.154 | yes | → | |
| sandwich tern | 30 | 1.897 | 2.069 | 2.700 | 2.786 | 2.817 | 2.983 | 2.507 | yes | ↑* | |
| common tern | 114 | 3.634 | 2.678 | 3.444 | 3.653 | 3.347 | 3.328 | 3.330 | yes | ↑** | |
| Arctic tern | 237 | 0.515 | 0.681 | 0.352 | 0.487 | 0.332 | 0.377 | 0.443 | no | ↓** | |
| pelagic f. | great cormorant | 82 | 0.596 | 0.598 | 0.613 | 0.571 | 0.679 | 0.674 | 0.621 | no | ↓** |
| black guillemot | 21 | 1.168 | 1.301 | 1.418 | 1.958 | 2.130 | 2.145 | 1.637 | yes | ↑* | |
| wading f. | pied avocet | 193 | 0.808 | 0.752 | 0.587 | 0.637 | 0.847 | 0.626 | 0.703 | yes | ↓* |
| dunlin | 20 | 0.124 | 0.137 | 0.151 | 0.167 | 0.097 | 0.376 | 0.158 | no | ↓↓* | |
Negative trends (1991-2016) were not only observed in the four species in poor status, but also in pied avocet, of which the index values still reflect good status (Table 9). The trends of individual species are depicted in Figure 5 (Annex 1).
Table 9. Trends observed in breeding waterbirds in the Belt Group 1991-2021. Trend slopes and standard errors result from TRIM analyses.
| group | species | number of sites | trend slope | S.E. | p | trend |
| surface feeders | common gull | 355 | 0.9717 | 0.0031 | <0.01 | moderate decrease |
| great black-backed gull | 173 | 1.0042 | 0.0023 | stable | ||
| lesser black-backed gull | 94 | 1.0021 | 0.0056 | stable | ||
| little tern | 109 | 1.0047 | 0.0052 | stable | ||
| sandwich tern | 30 | 1.0437 | 0.0139 | <0.05 | moderate increase | |
| common tern | 114 | 1.0515 | 0.0082 | <0.01 | moderate increase | |
| Arctic tern | 237 | 0.9634 | 0.0038 | <0.01 | moderate decrease | |
| pelagic f. | great cormorant | 82 | 0.9782 | 0.0040 | <0.01 | moderate decrease |
| black guillemot | 21 | 1.0173 | 0.0059 | <0.05 | moderate increase | |
| wading f. | pied avocet | 193 | 0.9847 | 0.0034 | <0.01 | moderate decrease |
| dunlin | 20 | 0.9208 | 0.0138 | <0.05 | strong decrease |
Bornholm Group
In the Bornholm Group (Kiel Bay, Bay of Mecklenburg, Arkona Basin, Bornholm Basin), 15 out of 24 species evaluated (63%) passed the threshold level, and therefore breeding waterbirds did not achieve good status (Table 10). On the level of species groups, only the pelagic feeders attained good status (83%, 6 species). Lower pass rates reveal poor status of surface feeders (55%, 9 species), benthic feeders (50%, 2 species), wading feeders (60%, 5 species) and grazing feeders (50%, 2 species).
Table 10. Evaluation of the status of breeding waterbirds in the Bornholm Group for the period 2016-2021. Index values (single years and mean) are scaled to the average of the reference period (1991-2000, index value set to 1). For explanation see Table 3.
| index values | |||||||||||
| group | species | number of sites | 2016 | 2017 | 2018 | 2019 | 2020 | 2021 | mean 2016-2021 | good status? | trend 1991-2021 |
| surface feeders | common gull | 274 | 0.394 | 0.440 | 0.419 | 0.425 | 0.476 | 0.700 | 0.467 | no | ↓** |
| great black-backed gull | 182 | 2.659 | 2.247 | 2.663 | 2.673 | 2.158 | 2.076 | 2.399 | yes | ↑** | |
| herring gull | 248 | 0.953 | 0.799 | 0.750 | 0.714 | 0.727 | 0.804 | 0.787 | yes | ↓* | |
| lesser black-backed gull | 63 | 6.917 | 10.310 | 10.057 | 8.244 | 13.544 | 10.936 | 9.781 | yes | ↑↑** | |
| little tern | 59 | 0.866 | 1.157 | 1.306 | 0.855 | 0.744 | 1.715 | 1.061 | yes | → | |
| Caspian tern | 21 | 1.850 | 4.255 | 5.779 | 4.021 | 6.918 | 8.515 | 4.699 | yes | ↑* | |
| sandwich tern | 41 | 0.383 | 0.378 | 0.471 | 0.528 | 0.447 | 0.103 | 0.344 | no | ↓* | |
| common tern | 96 | 0.638 | 0.487 | 0.569 | 0.481 | 0.538 | 0.552 | 0.542 | no | ↓** | |
| Arctic tern | 112 | 0.502 | 0.832 | 0.292 | 0.322 | 0.197 | 0.384 | 0.379 | no | ↓** | |
| pelagic feeders | goosander | 62 | 2.045 | 1.392 | 5.727 | 2.554 | 1.332 | 0.656 | 1.820 | yes | ↑* |
| red-breasted merganser | 116 | 0.554 | 0.483 | 0.487 | 0.564 | 0.485 | 0.409 | 0.494 | no | ↓** | |
| great crested grebe | 32 | 1.448 | 1.543 | 1.201 | 1.151 | 0.767 | 0.462 | 1.015 | yes | → | |
| great cormorant | 53 | 1.413 | 1.489 | 1.353 | 1.458 | 1.325 | 1.061 | 1.342 | yes | → | |
| razorbill | 4 | 24.726 | 29.202 | 34.495 | 36.189 | 37.982 | 39.839 | 33.302 | yes | ↑↑** | |
| common guillemot | 2 | 2.096 | 2.351 | 2.637 | 3.317 | 4.173 | 5.249 | 3.132 | yes | ↑* | |
| benthic feeders | tufted duck | 73 | 0.326 | 0.276 | 0.252 | 0.163 | 0.212 | 0.264 | 0.243 | no | ↓** |
| common eider | 90 | 1.613 | 1.485 | 1.665 | 1.514 | 1.638 | 1.493 | 1.566 | yes | ↑* | |
| wading feeders | common shelduck | 150 | 0.965 | 0.915 | 1.008 | 1.184 | 1.014 | 1.351 | 1.063 | yes | → |
| Eurasian oystercatcher | 163 | 0.737 | 0.670 | 0.623 | 0.561 | 0.578 | 0.786 | 0.654 | no | ↓* | |
| pied avocet | 51 | 0.858 | 0.975 | 0.861 | 1.026 | 0.558 | 1.190 | 0.888 | yes | ↓* | |
| ringed plover | 79 | 0.816 | 0.803 | 0.771 | 0.808 | 0.860 | 0.967 | 0.835 | yes | ↓* | |
| dunlin | 16 | 0.062 | 0.019 | 0.068 | 0.019 | 0.058 | 0.020 | 0.035 | no | ↓↓** | |
| graz. f. | mute swan | 157 | 0.627 | 0.532 | 0.773 | 0.561 | 0.604 | 0.631 | 0.617 | no | ↓** |
| greylag goose | 114 | 2.176 | 1.813 | 2.576 | 2.987 | 2.090 | 3.317 | 2.439 | yes | ↑** | |
All 9 species in poor status showed significant declines (most steeply in dunlin, Table 11). Herring gull, pied avocet and ringed plover declined significantly despite their good status based on index values. The steepest increase was observed in lesser black-backed gull and razorbill. The trends of individual species are depicted in Figure 6 (Annex 1).
Table 11. Trends observed in breeding waterbirds in the Bornholm Group 1991-2021. Trend slopes and standard errors result from TRIM analyses.
| group | species | number of sites | trend slope | S.E. | p | trend |
| surface feeders | common gull | 274 | 0.9660 | 0.0028 | <0.01 | moderate decrease |
| great black-backed gull | 182 | 1.0465 | 0.0056 | <0.01 | moderate increase | |
| herring gull | 248 | 0.9906 | 0.0028 | <0.05 | moderate decrease | |
| lesser black-backed gull | 63 | 1.1028 | 0.0129 | <0.01 | strong increase | |
| little tern | 59 | 1.0010 | 0.0056 | stable | ||
| Caspian tern | 21 | 1.0572 | 0.0247 | <0.05 | moderate decrease | |
| sandwich tern | 41 | 0.9572 | 0.0154 | <0.05 | moderate decrease | |
| common tern | 96 | 0.9724 | 0.0052 | <0.01 | moderate decrease | |
| Arctic tern | 112 | 0.9500 | 0.0057 | <0.01 | moderate decrease | |
| pelagic feeders | goosander | 62 | 1.0376 | 0.0174 | <0.05 | moderate increase |
| red-breasted merganser | 116 | 0.9678 | 0.0043 | <0.01 | moderate decrease | |
| great crested grebe | 32 | 1.0135 | 0.0095 | stable | ||
| great cormorant | 53 | 1.0076 | 0.0061 | stable | ||
| razorbill | 4 | 1.1482 | 0.0175 | <0.01 | strong increase | |
| common guillemot | 2 | 1.0472 | 0.0223 | <0.05 | moderate increase | |
| benthic feeders | tufted duck | 73 | 0.9501 | 0.0097 | <0.01 | moderate decrease |
| common eider | 90 | 1.0196 | 0.0057 | <0.05 | moderate increase | |
| wading feeders | common shelduck | 150 | 1.0031 | 0.0037 | stable | |
| Eurasian oystercatcher | 163 | 0.9822 | 0.0029 | <0.01 | moderate decrease | |
| pied avocet | 51 | 0.9871 | 0.0059 | <0.05 | moderate decrease | |
| ringed plover | 79 | 0.9912 | 0.0035 | <0.05 | moderate decrease | |
| dunlin | 16 | 0.8716 | 0.0142 | <0.01 | strong decrease | |
| graz. f. | mute swan | 157 | 0.9843 | 0.0026 | <0.01 | moderate decrease |
| greylag goose | 114 | 1.0431 | 0.0065 | <0.01 | moderate increase |
Gotland Group
In the Gotland Group (Gdansk Basin, Eastern Gotland Basin, Western Gotland Basin, Gulf of Riga), 18 out of 28 species (64%) passed the threshold level, but the limit of 75% of species necessary for an overall good status of breeding waterbirds was not met (Table 12). The only species group in good status are the pelagic feeders with 6 out of 7 species (86%) in good status. This goal was not reached by surface feeders (56.3%, 9 species), benthic feeders (50%, 4 species), wading feeders (60%, 5 species) and grazing feeders (67%, 3 species).
Table 12. Evaluation of the status of breeding waterbirds in the Gotland Group for the period 2016-2021. Index values (single years and mean) are scaled to the average of the reference period (1991-2000, index value set to 1). For explanation see Table 3.
| index values | |||||||||||
| group | species | number of sites | 2016 | 2017 | 2018 | 2019 | 2020 | 2021 | mean 2016-2021 | good status? | trend 1991-2021 |
| surface feeders | Arctic skua | 59 | 0.611 | 0.244 | 0.489 | 0.407 | 0.407 | 0.570 | 0.436 | no | ? |
| common gull | 731 | 1.322 | 1.744 | 1.356 | 1.449 | 1.875 | 1.792 | 1.574 | yes | ↑** | |
| great black-backed gull | 598 | 0.207 | 0.236 | 0.215 | 0.165 | 0.167 | 0.173 | 0.192 | no | ↓↓** | |
| herring gull | 497 | 0.314 | 0.261 | 0.325 | 0.270 | 0.265 | 0.308 | 0.289 | no | ↓** | |
| lesser black-backed gull | 100 | 0.238 | 0.181 | 0.321 | 0.221 | 0.278 | 0.233 | 0.241 | no | ↓** | |
| little tern | 94 | 1.510 | 1.336 | 1.158 | 1.008 | 0.558 | 0.999 | 1.046 | yes | → | |
| Caspian tern | 115 | 1.133 | 1.760 | 1.909 | 1.874 | 2.787 | 2.738 | 1.947 | yes | ↑** | |
| common tern | 372 | 3.153 | 6.975 | 5.374 | 4.850 | 5.653 | 6.794 | 5.294 | yes | ↑↑** | |
| Arctic tern | 658 | 2.899 | 2.902 | 3.312 | 2.592 | 2.642 | 2.738 | 2.838 | yes | ↑** | |
| pelagic feeders | goosander | 410 | 0.755 | 1.004 | 0.868 | 1.035 | 1.382 | 1.308 | 1.035 | yes | → |
| red-breasted merganser | 349 | 1.170 | 1.183 | 0.972 | 0.801 | 1.566 | 1.524 | 1.171 | yes | ↑** | |
| great crested grebe | 223 | 4.578 | 5.130 | 9.166 | 9.083 | 7.350 | 9.826 | 7.216 | yes | ↑↑** | |
| great cormorant | 150 | 2.671 | 2.925 | 3.697 | 3.112 | 2.887 | 3.455 | 3.105 | yes | ↑** | |
| razorbill | 56 | 2.157 | 3.021 | 2.177 | 3.193 | 2.039 | 3.285 | 2.592 | yes | ↑** | |
| common guillemot | 11 | 2.382 | 2.217 | 2.580 | 2.908 | 2.797 | 3.381 | 2.685 | yes | ↑** | |
| black guillemot | 33 | 0.404 | 0.378 | 0.349 | 0.420 | 0.352 | 0.271 | 0.359 | no | ↓* | |
| benthic feeders | tufted duck | 457 | 1.798 | 1.680 | 1.372 | 1.621 | 1.229 | 1.805 | 1.569 | yes | ↑** |
| greater scaup | 12 | 0.376 | 1.543 | 1.048 | 3.630 | 1.211 | 0.605 | 1.084 | yes | ? | |
| common eider | 464 | 0.079 | 0.094 | 0.069 | 0.089 | 0.102 | 0.084 | 0.085 | no | ↓↓** | |
| velvet scoter | 239 | 0.193 | 0.479 | 0.212 | 0.151 | 0.250 | 0.355 | 0.253 | no | ↓** | |
| wading feeders | common shelduck | 220 | 0.652 | 0.975 | 0.442 | 0.495 | 0.436 | 0.529 | 0.564 | no | ↓** |
| Eurasian oystercatcher | 686 | 1.175 | 1.000 | 1.068 | 1.210 | 0.897 | 1.311 | 1.101 | yes | ↑* | |
| pied avocet | 47 | 0.916 | 0.970 | 0.899 | 1.124 | 0.383 | 0.691 | 0.787 | yes | → | |
| ringed plover | 297 | 1.700 | 1.559 | 0.983 | 0.987 | 0.887 | 1.034 | 1.154 | yes | ↑** | |
| turnstone | 178 | 0.500 | 0.351 | 0.166 | 0.177 | 0.227 | 0.326 | 0.269 | no | ↓** | |
| grazing feeders | mute swan | 756 | 1.895 | 2.207 | 2.480 | 2.787 | 2.996 | 2.979 | 2.523 | yes | ↑** |
| barnacle goose | 76 | 0.414 | 0.190 | 0.778 | 0.317 | 0.399 | 0.158 | 0.327 | no | ↓** | |
| greylag goose | 430 | 0.942 | 1.305 | 0.923 | 0.646 | 0.744 | 0.813 | 0.873 | yes | → | |
Most species not in a good status showed significant negative trends, the trend is uncertain in the Arctic skua (Table 13). Two of them (great black-backed gull, common eider) declined steeply. On the other hand, most of the species in good status were stable or increased, with the exception of greater scaup with uncertain trend. The trends of individual species are depicted in Figure 7 (Annex 1).
Table 13. Trends observed in breeding waterbirds in the Gotland Group 1991-2021. Trend slopes and standard errors result from TRIM analyses.
| group | species | number of sites | trend slope | S.E. | p | trend |
| surface feeders | Arctic skua | 59 | 0.9688 | 0.0276 | uncertain | |
| common gull | 731 | 1.0188 | 0.0022 | moderate increase | ||
| great black-backed gull | 598 | 0.9346 | 0.0019 | <0.01 | strong decrease | |
| herring gull | 497 | 0.9491 | 0.0021 | <0.01 | moderate decrease | |
| lesser black-backed gull | 100 | 0.9344 | 0.0096 | <0.01 | moderate decrease | |
| little tern | 94 | 1.0095 | 0.0077 | stable | ||
| Caspian tern | 115 | 1.0296 | 0.0067 | <0.01 | moderate increase | |
| common tern | 372 | 1.0753 | 0.0050 | <0.01 | strong increase | |
| Arctic tern | 658 | 1.0493 | 0.0034 | <0.01 | moderate increase | |
| pelagic feeders | goosander | 410 | 1.0034 | 0.0040 | stable | |
| red-breasted merganser | 349 | 1.0121 | 0.0032 | <0.01 | moderate increase | |
| great crested grebe | 223 | 1.0928 | 0.0086 | <0.01 | strong increase | |
| great cormorant | 150 | 1.0505 | 0.0093 | <0.01 | moderate increase | |
| razorbill | 56 | 1.0515 | 0.0040 | <0.01 | moderate increase | |
| common guillemot | 11 | 1.0405 | 0.0020 | <0.01 | moderate increase | |
| black guillemot | 33 | 0.9538 | 0.0160 | <0.05 | moderate decrease | |
| benthic feeders | tufted duck | 457 | 1.0212 | 0.0031 | <0.01 | moderate increase |
| greater scaup | 12 | 0.9969 | 0.0404 | uncertain | ||
| common eider | 464 | 0.9001 | 0.0031 | <0.01 | strong decrease | |
| velvet scoter | 239 | 0.9531 | 0.0054 | <0.01 | moderate decrease | |
| wading feeders | common shelduck | 220 | 0.9813 | 0.0040 | <0.01 | moderate decrease |
| Eurasian oystercatcher | 686 | 1.0041 | 0.0015 | <0.05 | moderate increase | |
| pied avocet | 47 | 0.9863 | 0.0111 | stable | ||
| ringed plover | 297 | 1.0116 | 0.0029 | <0.01 | moderate increase | |
| turnstone | 178 | 0.9430 | 0.0053 | <0.01 | moderate decrease | |
| grazing feeders | mute swan | 756 | 1.0431 | 0.0020 | <0.01 | moderate increase |
| barnacle goose | 76 | 0.9487 | 0.0110 | <0.01 | moderate decrease | |
| greylag goose | 430 | 0.9944 | 0.0031 | <0.01 | stable |
Åland Group
In the Åland Group (Northern Baltic Proper, Åland Sea), 17 out of 23 species (73%) were in a good status in the assessment period (2016-2021), thus breeding waterbirds failed to achieve an overall good status (Table 14). Pelagic feeders (pass rate 80%, 5 species), surface feeders (75%, 8 species) and wading feeders (75%, 4 species) were indicated to be in good status. This was only narrowly missed for benthic feeders (67%, 3 species) and grazing feeders (67%, 3 species).
Table 14. Evaluation of the status of breeding waterbirds in the Åland Group for the period 2016-2021. Index values (single years and mean) are scaled to the average of the reference period (1991-2000, index value set to 1). For explanation see Table 3.
| index values | |||||||||||
| group | species | number of sites | 2016 | 2017 | 2018 | 2019 | 2020 | 2021 | mean 2016-2021 | good status? | trend 1991-2021 |
| surface feeders | Arctic skua | 250 | 1.104 | 0.76 | 0.95 | 0.836 | 0.79 | 0.859 | 0.876 | yes | → |
| common gull | 1379 | 0.943 | 1.081 | 0.904 | 1.061 | 1.045 | 1.023 | 1.007 | yes | → | |
| great black-backed gull | 737 | 0.339 | 0.321 | 0.324 | 0.247 | 0.299 | 0.238 | 0.292 | no | ↓** | |
| herring gull | 435 | 0.281 | 0.280 | 0.283 | 0.304 | 0.250 | 0.218 | 0.268 | no | ↓↓* | |
| lesser black-backed gull | 251 | 1.180 | 1.049 | 1.103 | 1.075 | 1.171 | 1.138 | 1.118 | yes | → | |
| Caspian tern | 60 | 23.738 | 23.041 | 44.712 | 43.524 | 32.974 | 29.914 | 31.880 | yes | ↑↑* | |
| common tern | 415 | 3.339 | 4.073 | 4.798 | 2.960 | 4.561 | 3.542 | 3.823 | yes | ↑↑* | |
| Arctic tern | 900 | 1.949 | 1.459 | 1.910 | 2.162 | 1.774 | 1.677 | 1.808 | yes | ↑** | |
| pelagic feeders | goosander | 860 | 0.603 | 0.649 | 0.621 | 0.662 | 0.809 | 0.660 | 0.664 | no | ↓** |
| red-breasted merganser | 435 | 1.048 | 1.014 | 0.933 | 1.060 | 1.172 | 1.441 | 1.100 | yes | → | |
| razorbill | 130 | 1.587 | 2.097 | 1.753 | 2.429 | 1.255 | 1.726 | 1.770 | yes | → | |
| common guillemot | 14 | 0.896 | 1.354 | 1.366 | 1.441 | 2.409 | 5.614 | 1.784 | yes | ? | |
| black guillemot | 262 | 0.637 | 0.976 | 1.340 | 0.752 | 0.466 | 0.551 | 0.737 | yes | ↓* | |
| benthic feeders | tufted duck | 565 | 1.348 | 1.155 | 1.170 | 0.995 | 1.095 | 1.022 | 1.125 | yes | → |
| common eider | 1382 | 0.134 | 0.169 | 0.171 | 0.148 | 0.124 | 0.093 | 0.137 | no | ↓↓** | |
| velvet scoter | 304 | 0.711 | 0.825 | 0.541 | 0.788 | 0.714 | 1.161 | 0.769 | yes | ↓** | |
| wading feeders | common shelduck | 71 | 1.258 | 2.684 | 0.878 | 2.061 | 0.871 | 0.924 | 1.304 | yes | ? |
| Eurasian oystercatcher | 936 | 1.136 | 0.987 | 0.995 | 0.972 | 1.110 | 1.116 | 1.050 | yes | ↑* | |
| ringed plover | 93 | 1.426 | 1.044 | 1.149 | 1.240 | 1.377 | 1.245 | 1.240 | yes | ↑* | |
| turnstone | 211 | 0.659 | 0.502 | 0.448 | 0.504 | 0.501 | 0.460 | 0.508 | no | ↓** | |
| grazing feeders | mute swan | 1048 | 1.564 | 1.515 | 1.647 | 1.892 | 1.822 | 1.908 | 1.717 | yes | ↑** |
| barnacle goose | 161 | 3.102 | 3.156 | 3.131 | 2.847 | 2.557 | 2.158 | 2.800 | yes | ↑** | |
| greylag goose | 389 | 0.592 | 0.553 | 0.603 | 0.487 | 0.458 | 0.509 | 0.531 | no | ↓** | |
The six species in poor status all showed a significant decline from 1991 to 2021 (steep declines in common eider and herring gull, Table 15). Out of the species in good status, Caspian tern and common tern increased strongly and others were increasing moderately or remained stable, but significant declines occurred in black guillemot and velvet scoter. The trends of individual species are depicted in Figure 8 (Annex 1).
Table 15. Trends observed in breeding waterbirds in the Åland Group 1991-2021. Trend slopes and standard errors result from TRIM analyses.
| group | species | number of sites | trend slope | S.E. | p | trend |
| surface feeders | Arctic skua | 250 | 1.0056 | 0.0088 | stable | |
| common gull | 1379 | 1.0020 | 0.0021 | stable | ||
| great black-backed gull | 737 | 0.9529 | 0.0026 | <0.01 | moderate decrease | |
| herring gull | 435 | 0.9458 | 0.0026 | <0.05 | strong decrease | |
| lesser black-backed gull | 251 | 1.0052 | 0.0042 | stable | ||
| Caspian tern | 60 | 1.1902 | 0.0452 | <0.05 | strong increase | |
| common tern | 415 | 1.0643 | 0.0061 | <0.05 | strong increase | |
| Arctic tern | 900 | 1.0272 | 0.0043 | <0.01 | moderate increase | |
| pelagic feeders | goosander | 860 | 0.9840 | 0.0033 | <0.01 | moderate decrease |
| red-breasted merganser | 435 | 1.0037 | 0.0054 | stable | ||
| razorbill | 130 | 1.0141 | 0.0082 | stable | ||
| common guillemot | 14 | 1.0275 | 0.0184 | uncertain | ||
| black guillemot | 262 | 0.9878 | 0.0057 | <0.05 | moderate decrease | |
| benthic feeders | tufted duck | 565 | 1.0066 | 0.0044 | stable | |
| common eider | 1382 | 0.9190 | 0.0018 | <0.01 | strong decrease | |
| velvet scoter | 304 | 0.9790 | 0.0055 | <0.01 | moderate decrease | |
| wading feeders | common shelduck | 71 | 1.0352 | 0.0204 | uncertain | |
| Eurasian oystercatcher | 936 | 1.0036 | 0.0017 | <0.05 | moderate increase | |
| ringed plover | 93 | 1.0155 | 0.0065 | <0.05 | moderate increase | |
| turnstone | 211 | 0.9733 | 0.0040 | <0.01 | moderate decrease | |
| grazing feeders | mute swan | 1048 | 1.0292 | 0.0027 | <0.01 | moderate increase |
| barnacle goose | 161 | 1.0589 | 0.0091 | <0.01 | moderate increase | |
| greylag goose | 389 | 0.9757 | 0.0042 | <0.01 | moderate decrease |
Gulf of Finland
The threshold for good status was achieved by 15 out of 24 species (63%), therefore breeding waterbirds did not achieve an overall good status in the Gulf of Finland in the years 2016-2021 (Table 14). Two species groups were in good status, the grazing feeders (all 3 species passing threshold) and the wading feeders (75% passing, 4 species). The other groups did not reach the threshold of 75% of species in good status: surface feeders (43%, 7 species), pelagic feeders (71%, 7 species) and benthic feeders (33%, 3 species).
Table 16. Evaluation of the status of breeding waterbirds in the Gulf of Finland for the period 2016-2021. Index values (single years and mean) are scaled to the average of the reference period (1991-2000, index value set to 1). For explanation see Table 3.
| index values | |||||||||||
| group | species | number of sites | 2016 | 2017 | 2018 | 2019 | 2020 | 2021 | mean 2016-2021 | good status? | trend 1991-2021 |
| surface feeders | common gull | 866 | 1.259 | 0.971 | 1.283 | 1.120 | 0.924 | 1.180 | 1.115 | yes | ↑* |
| great black-backed gull | 671 | 0.708 | 0.670 | 0.518 | 0.428 | 0.451 | 0.315 | 0.496 | no | ↓** | |
| herring gull | 702 | 0.648 | 0.570 | 0.581 | 0.672 | 0.652 | 0.730 | 0.640 | no | ↓** | |
| lesser black-backed gull | 312 | 0.643 | 0.506 | 0.303 | 0.264 | 0.499 | 0.212 | 0.374 | no | ↓** | |
| Caspian tern | 151 | 2.270 | 2.536 | 3.138 | 1.132 | 1.219 | 4.028 | 2.156 | yes | ↑* | |
| common tern | 311 | 0.804 | 0.578 | 0.810 | 0.927 | 0.466 | 0.310 | 0.608 | no | ↓* | |
| Arctic tern | 457 | 0.676 | 0.720 | 1.528 | 1.334 | 1.122 | 1.347 | 1.070 | yes | → | |
| pelagic feeders | goosander | 285 | 0.946 | 0.541 | 0.679 | 0.562 | 0.397 | 0.525 | 0.586 | no | ↓** |
| red-breasted merganser | 303 | 1.210 | 1.020 | 1.049 | 0.923 | 2.261 | 0.958 | 1.172 | yes | ↑* | |
| great crested grebe | 68 | 4.651 | 2.822 | 2.395 | 5.103 | 1.318 | 3.183 | 2.960 | yes | ? | |
| great cormorant | 46 | 39.797 | 37.824 | 42.504 | 33.258 | 40.032 | 38.523 | 38.549 | yes | ↑↑* | |
| razorbill | 67 | 0.212 | 0.991 | 0.419 | 1.696 | 6.930 | 0.972 | 1.001 | yes | → | |
| common guillemot | 5 | 1.121 | 1.402 | 1.851 | 2.888 | 3.730 | 5.099 | 2.329 | yes | ↑* | |
| black guillemot | 201 | 0.778 | 0.793 | 0.583 | 0.629 | 0.481 | 0.303 | 0.566 | no | ↓** | |
| benthic feeders | tufted duck | 517 | 0.466 | 0.400 | 0.401 | 0.538 | 0.427 | 0.609 | 0.467 | no | ↓** |
| common eider | 930 | 0.873 | 0.887 | 0.823 | 0.818 | 0.633 | 0.465 | 0.732 | yes | ↓** | |
| velvet scoter | 156 | 0.904 | 0.213 | 0.949 | 0.527 | 0.641 | 0.432 | 0.546 | no | ↓* | |
| wading feeders | common shelduck | 12 | 1.525 | 0.708 | 2.101 | 1.109 | 7.583 | 3.202 | 1.984 | yes | ? |
| Eurasian oystercatcher | 586 | 1.262 | 1.178 | 1.000 | 0.969 | 1.222 | 0.873 | 1.074 | yes | → | |
| ringed plover | 166 | 1.159 | 1.160 | 0.716 | 0.728 | 1.167 | 0.677 | 0.906 | yes | → | |
| turnstone | 304 | 0.312 | 0.250 | 0.170 | 0.171 | 0.445 | 0.105 | 0.218 | no | ↓↓** | |
| grazing feeders | mute swan | 634 | 1.753 | 1.645 | 1.975 | 2.640 | 2.425 | 2.411 | 2.109 | yes | ↑** |
| barnacle goose | 520 | 25.379 | 27.478 | 27.160 | 28.050 | 27.601 | 21.060 | 25.999 | yes | ↑↑** | |
| greylag goose | 168 | 0.969 | 0.380 | 1.015 | 0.879 | 1.602 | 1.627 | 0.974 | yes | → | |
All species in bad status declined significantly (steeply in the case of turnstone, Table 17). The species in good status increased, remained stable or the trend was uncertain, with the exception of common eider which declined. The steepest increases were noticed for barnacle goose and great cormorant. The trends of individual species are depicted in Figure 9 (Annex 1).
Table 17. Trends observed in breeding waterbirds in the Gulf of Finland 1991-2021. Trend slopes and standard errors result from TRIM analyses.
| group | species | number of sites | trend slope | S.E. | p | trend |
| surface feeders | common gull | 866 | 1.0073 | 0.0021 | <0.05 | moderate increase |
| great black-backed gull | 671 | 0.9719 | 0.0035 | <0.01 | moderate decrease | |
| herring gull | 702 | 0.9827 | 0.0017 | <0.01 | moderate decrease | |
| lesser black-backed gull | 312 | 0.9575 | 0.0036 | <0.01 | moderate decrease | |
| Caspian tern | 151 | 1.0554 | 0.0218 | <0.05 | moderate increase | |
| common tern | 311 | 0.9760 | 0.0077 | <0.05 | moderate decrease | |
| Arctic tern | 457 | 0.9979 | 0.0042 | stable | ||
| pelagic feeders | goosander | 285 | 0.9789 | 0.0053 | <0.01 | moderate decrease |
| red-breasted merganser | 303 | 1.0144 | 0.0044 | <0.05 | moderate increase | |
| great crested grebe | 68 | 1.0594 | 0.0310 | uncertain | ||
| great cormorant | 46 | 1.2087 | 0.0586 | <0.05 | strong increase | |
| razorbill | 67 | 1.0138 | 0.0125 | stable | ||
| common guillemot | 5 | 1.0282 | 0.0115 | <0.05 | moderate increase | |
| black guillemot | 201 | 0.9796 | 0.0032 | <0.05 | moderate decrease | |
| benthic feeders | tufted duck | 517 | 0.9738 | 0.0036 | <0.05 | moderate decrease |
| common eider | 930 | 0.9859 | 0.0014 | <0.01 | moderate decrease | |
| velvet scoter | 156 | 0.9774 | 0.0066 | <0.05 | moderate decrease | |
| wading feeders | common shelduck | 12 | 1.0353 | 0.0313 | uncertain | |
| Eurasian oystercatcher | 586 | 1.0042 | 0.0028 | stable | ||
| ringed plover | 166 | 1.0022 | 0.0054 | stable | ||
| turnstone | 304 | 0.9303 | 0.0046 | <0.01 | strong decrease | |
| grazing feeders | mute swan | 634 | 1.0361 | 0.0044 | <0.01 | moderate increase |
| barnacle goose | 520 | 1.1974 | 0.0169 | <0.01 | strong increase | |
| greylag goose | 168 | 1.0072 | 0.0079 | stable |
Bothnian Group
In the Bothnian Group (Bothnian Sea, The Quark, Bothnian Bay), only 3 out of 18 species evaluated failed to pass the threshold level. With 84% of the breeding waterbird species in good status, an overall good status was determined (Table 18). While all species (100%) and therefore the respective species groups were in good status in surface feeders (7 species), pelagic feeders (3 species) and grazing feeders (2 species), this was not the case in benthic feeders (33%, 3 species) and wading feeders (67%, 3 species).
Table 18. Evaluation of the status of breeding waterbirds in the Bothnian Group for the period 2016-2021. Index values (single years and mean) are scaled to the average of the reference period (1991-2000, index value set to 1). For explanation see Table 3.
| index values | |||||||||||
| group | species | number of sites | 2016 | 2017 | 2018 | 2019 | 2020 | 2021 | mean 2016-2021 | good status? | trend 1991-2021 |
| surface feeders | Arctic skua | 687 | 1.646 | 1.282 | 1.487 | 1.361 | 1.425 | 1.627 | 1.465 | yes | ↑* |
| common gull | 4684 | 0.984 | 0.860 | 0.755 | 0.742 | 0.794 | 0.885 | 0.833 | yes | ↓* | |
| great black-backed gull | 1872 | 0.828 | 0.775 | 0.787 | 0.751 | 0.827 | 0.777 | 0.790 | yes | ↓* | |
| herring gull | 2022 | 1.410 | 1.347 | 1.178 | 1.391 | 1.507 | 1.199 | 1.334 | yes | ↑** | |
| lesser black-backed gull | 881 | 1.182 | 1.270 | 0.968 | 1.200 | 0.683 | 1.541 | 1.106 | yes | ↑* | |
| common tern | 2102 | 1.935 | 2.629 | 2.077 | 2.469 | 3.033 | 4.359 | 2.648 | yes | ↑** | |
| Arctic tern | 3560 | 1.411 | 1.306 | 1.354 | 1.231 | 1.300 | 1.142 | 1.288 | yes | ↑** | |
| pelagic feeders | goosander | 3126 | 0.854 | 0.871 | 1.398 | 0.877 | 0.910 | 1.129 | 0.989 | yes | → |
| red-breasted merganser | 3416 | 1.088 | 1.068 | 0.709 | 0.769 | 1.178 | 1.315 | 0.997 | yes | → | |
| black guillemot | 977 | 0.652 | 0.629 | 0.639 | 0.574 | 0.764 | 0.748 | 0.664 | yes | ↓* | |
| benthic feeders | tufted duck | 2948 | 0.787 | 0.751 | 0.614 | 0.525 | 0.691 | 0.676 | 0.668 | no | ↓* |
| common eider | 2101 | 0.223 | 0.298 | 0.190 | 0.165 | 0.530 | 0.376 | 0.273 | no | ↓** | |
| velvet scoter | 1903 | 0.969 | 0.975 | 0.705 | 0.650 | 1.060 | 1.053 | 0.886 | yes | → | |
| wading feeders | Eurasian oystercatcher | 1436 | 1.585 | 1.525 | 1.280 | 1.458 | 1.909 | 1.925 | 1.597 | yes | ↑** |
| ringed plover | 354 | 0.968 | 0.622 | 0.654 | 0.578 | 0.755 | 0.804 | 0.719 | yes | → | |
| turnstone | 1316 | 0.425 | 0.434 | 0.291 | 0.333 | 0.390 | 0.435 | 0.381 | no | ↓** | |
| grazing feeders | mute swan | 1579 | 1.773 | 2.142 | 2.460 | 1.960 | 2.578 | 2.250 | 2.176 | yes | ↑** |
| greylag goose | 1618 | 1.280 | 2.694 | 2.166 | 1.835 | 3.323 | 2.519 | 2.204 | yes | ↑** | |
Turnstone, tufted duck and common eider, the only species in poor status, declined significantly across the period 1991-2016. Another four species declined despite being in good status (Table 19). The trends of individual species are depicted in Figure 10 (Annex 1).
Table 19. Trends observed in breeding waterbirds in the Bothnian Group 1991-2021. Trend slopes and standard errors result from TRIM analyses.
| group | species | number of sites | trend slope | S.E. | p | trend |
| surface feeders | Arctic skua | 687 | 1.0160 | 0.0061 | <0.05 | moderate increase |
| common gull | 4684 | 0.9954 | 0.0020 | <0.05 | moderate decrease | |
| great black-backed gull | 1872 | 0.9887 | 0.0038 | <0.05 | moderate decrease | |
| herring gull | 2022 | 1.0122 | 0.0024 | <0.05 | moderate increase | |
| lesser black-backed gull | 881 | 1.0147 | 0.0052 | <0.05 | moderate increase | |
| common tern | 2102 | 1.0512 | 0.0075 | <0.05 | moderate increase | |
| Arctic tern | 3560 | 1.0120 | 0.0030 | <0.01 | moderate increase | |
| pelagic feeders | goosander | 3126 | 1.0011 | 0.0083 | stable | |
| red-breasted merganser | 3416 | 1.0026 | 0.0035 | stable | ||
| black guillemot | 977 | 0.9849 | 0.0042 | <0.05 | moderate decrease | |
| benthic feeders | tufted duck | 2948 | 0.9858 | 0.0039 | <0.01 | moderate decrease |
| common eider | 2101 | 0.9523 | 0.0034 | <0.01 | moderate decrease | |
| velvet scoter | 1903 | 0.9983 | 0.0056 | stable | ||
| wading feeders | Eurasian oystercatcher | 1436 | 1.0181 | 0.0033 | <0.01 | moderate increase |
| ringed plover | 354 | 0.9941 | 0.0073 | stable | ||
| turnstone | 1316 | 0.9577 | 0.0027 | <0.01 | moderate decrease | |
| grazing feeders | mute swan | 1579 | 1.0306 | 0.0068 | <0.01 | moderate increase |
| greylag goose | 1618 | 1.0430 | 0.0094 | <0.01 | moderate increase |
4.2 Trends
The abundance of breeding waterbirds was evaluated using the same methods and assessment units in HOLAS II and HOLAS 3, and the composition of the species groups remained largely the same. Therefore, it is very appropriate to compare the status evaluations from the periods 2011-2016 (HOLAS II) and 2016-2021 (HOLAS 3). Overall, the proportion of species in good status changed only very little from 83% in 2011-2016 (29 species) to 80% (30 species) in 2016-2021. Out of the 29 species evaluated for both periods, only five changed in status: common gull, greater scaup and common eider deteriorated from good to poor status, while great black-backed gull and pied avocet improved from poor to good status.
At the level of the entire Baltic Sea, all five species groups remained in the same status, which was good for surface feeders, pelagic feeders and grazing feeders, but poor for grazing feeders (Table 20). At the level of subdivisions, 24 out of the subdivision/species group combinations with evaluations in both periods retained the same status (17 remained poor, 7 remained good). In three cases, the status deteriorated from good to poor: surface feeders in the Belt Group, wading feeders in the Belt Group and grazing feeders in the Bornholm Group. Improvement from poor to good status was also observed three times: surface feeders in the Åland Group, pelagic feeders in the Bornholm Group and wading feeders in the Gulf of Finland.
Table 20. Status evaluations for breeding abundance of waterbirds in the Baltic Sea and its seven subdivisions in 2011-2016 (HOLAS II) and 2016-2021 (HOLAS 3): proportion of species in good status (number of species in brackets). Good status is shown by green colour, if at least 75% of the species are in good status. Red colour means that the species groups is not in good status.
| Surface feeders | Pelagic feeders | Benthic feeders | Wading feeders | Grazing feeders | ||||||
| Assessment unit | 2011-16 | 2016-21 | 2011-16 | 2016-21 | 2011-16 | 2016-21 | 2011-16 | 2016-21 | 2011-16 | 2016-21 |
| Baltic Sea | 90% (10) | 90% (10) | 100% (7) | 100% (7) | 75% (4) | 25% (4) | 50% (6) | 67% (6) | 100% (2) | 100% (3) |
| subdivisions | ||||||||||
| Kattegat | 43% (7) | 50% (4) | 100% (4) | 0% (1) | 0% (3) | 25% (4) | 67% (3) | |||
| Belt Group | 88% (8) | 71% (7) | 50% (2) | 50% (2) | 100% (1) | 50% (2) | 100% (1) | |||
| Bornholm Group | 44% (9) | 55% (9) | 50% (6) | 83% (6) | 50% (2) | 50% (2) | 40% (5) | 60% (5) | 100% (2) | 50% (2) |
| Gotland Group | 63% (8) | 56% (9) | 86% (7) | 86% (7) | 33% (3) | 50% (4) | 33% (6) | 60% (5) | 67% (3) | 67% (3) |
| Åland Group | 71% (7) | 75% (8) | 80% (5) | 80% (5) | 33% (3) | 67% (3) | 80% (5) | 75% (4) | 67% (3) | 67% (3) |
| Gulf of Finland | 17% (6) | 43% (7 | 67% (6) | 71% (7) | 33% (3) | 33% (3) | 67% (3) | 75% (4) | 100% (3) | 100% (3) |
| Bothnian Group | 100% (7) | 100% (7) | 100% (2) | 100% (3) | 67% (3) | 33% (3) | 50% (4) | 67% (3) | 100% (3) | 100% (2) |
On the level of species, in 123 cases a combination of species and subdivision could be evaluated in both assessment periods. In 105 cases the status remained unchanged (70 remained good, 35 remained poor), while a change was observed 18 times (11 improvements, 7 deteriorations). Details are shown in Table 21 (Annex 2).
4.3 Discussion text
Overall, the status of breeding waterbirds in the Baltic Sea region is good, even if this does not apply to all species groups or species. Compared to the last evaluation (HOLAS II), not many changes have occurred.
Using the quite similar results from HOLAS II, JWGBIRD carried out a trait analysis to investigate possible reasons for differences in status (ICES 2018). Two-way ANOVAs using the trend slopes (1991 to 2016) as response variable gave the combination of species group and wintering area, highlighting the poor status of benthic feeders wintering in NW Europe and waders wintering in Africa. Two-way ANOVAs with the geometric mean of the index values 2011-2016 showed best explanation by the combination of wintering area and breeding strategy, showing that among colonial breeders, those wintering in Africa (terns) were doing best and those wintering in NW Europe were doing worst.
Apart from these general results it is obvious from the results of both the whole Baltic Sea and in the seven subdivisions that the welfare of waterbird species varies considerably between and within species groups. Therefore, it is difficult to derive simple conclusions from the indicator results. It is known from a number of case studies that the development of population size is subject to a large variety of impacting factors. JWGBIRD has explored impacts on breeding waterbirds at the Baltic Sea coast and found that direct influence from human activities is relatively scarce, with tourism and leisure being the pressure affecting the largest number of species (ICES 2018). More importance was assigned to what can be considered more natural drivers, as many breeding species are influenced by predation, habitat change and prey availability. However, even the natural drivers are not independent from anthropogenic pressures. For example, fishing has considerable impact on the composition of the Baltic fish fauna, and the removal of competitive large fish has promoted piscivorous waterbirds, as expressed by positive trends in this indicator. Declining waterbird populations often suffer from predation of eggs and chicks, which is partly caused by introduced predators such as American mink and raccoon dog (HELCOM 2013). On the other hand, the strong increase of an indigenous predator, the white-tailed sea eagle, has negative impacts on the breeding population of common eiders (and probably other waterbirds) through the removal of individuals and the failure of broods (Ekroos et al. 2012). Since many species are influenced by several natural and anthropogenic drivers, indicator results have to be examined carefully in order to draw appropriate conclusions and implement suitable management measures.
5 Confidence
The overall confidence of the breeding waterbirds abundance evaluation is estimated to be high, because an established methodology with an established threshold was used (earlier and current evaluations in HELCOM and OSPAR Regions) and the coverage includes the whole HOLAS 3 assessment period (2016-2021), nearly the entire Baltic Sea coast (except for the relatively short sections of Russia and Lithuania) and a large number of species.
The accuracy of the evaluation is high, because the results clearly show whether the threshold values for good status are met for species, species groups or all birds. Evaluations of individual species in the entire Baltic Sea and in the seven subdivisions vary regarding their confidence. Standard errors are given for the geometric mean of index values in the assessment period as well as for trend slopes.
The abundance of breeding waterbirds in the Baltic Sea is strongly influenced by a variety of human activities, both directly and indirectly. The effects are cumulative, because pressures exist in the breeding season, during migration and in winter. An overview of pressures on breeding waterbirds can be found in HELCOM (2013).
In general, waterbirds strongly respond to food availability. Therefore, human activities influencing the food supply of waterbirds are reflected in bird numbers. For fish-eating birds, direct human pressure is posed by the extraction of fish, while physical damage of the seafloor directly affects benthic feeders. On the other hand, overfishing of large predatory fish species increases the abundance of smaller species and thereby improves the food supply for some birds. Indirect effects can also occur via human induced eutrophication: in the oligotrophic end of the eutrophication status, the bird populations are limited by the availability of food sources, whereas towards eutrophic conditions plant and zoobenthos biomass increases, which first benefits waterbird populations, but in the extreme end will cause a decrease in food availability.
As their reproduction takes place on land, even waterbirds that live at sea during all other times are prone to predation by non-indigenous mammals such as American mink and raccoon dog, which have been introduced by humans and therefore have to be treated as a human pressure. While many breeding colonies are well protected nowadays, some breeding sites are still under pressure from direct human disturbance, for example from tourism and recreational boating, but also from habitat loss due to changes in land use and agriculture.
Bird losses from drowning in fishing gear, hunting and plumage oiling as well as habitat loss from offshore wind farming, aggregate extraction and shipping are pressures mostly acting in the non-breeding season. At least in those species that both breed and spend the winter in the Baltic Sea, also these human pressures affect the numbers of breeding birds – not only by the elimination of birds from the population, but also in terms of carry-over effects by reducing body condition with effects on survival and reproductive success. Negative impacts on body condition are also obtained year-round from the accumulation of contaminants ingested via the food web.
Table 22. Pressures with relevance to this indicator.
| | General | MSFD Annex III, Table 2a |
| Strong link |
The most important human threats to breeding waterbirds are predation by indigenous and non-indigenous mammals, contamination by hazardous substances, prey depletion and habitat loss. | Biological pressures:
Physical pressures:
Pressures by substances, litter and energy
|
| Weak link | Numbers of breeding waterbirds are additionally influenced by pressures acting primarily in the non-breeding season. | in addition to those mentioned above:
Pressures by substances, litter and energy:
|
7 Climate change and other factors
Global warming has many effects also in the Baltic region (HELCOM & Baltic Earth 2021, Meier et al. 2022). In the Baltic Sea, effects on waterbirds are mainly seen in wintering birds, of which many are also part of the breeding populations along the coasts of the Baltic. Part of the population of some species (mainly diving ducks) that formerly wintered further to the southwest now remain in the Baltic (Skov et al. 2011, Nilsson & Haas 2016, Pavón-Jordán et al. 2019). Consequently, the distance of migration is shorter and therefore less energy demanding (Lehikoinen et al., 2006, Gunnarsson et al. 2012). Climate change scenarios predict a strong temperature increase in the Arctic and sub-Arctic regions, which will likely increase the northward extension of species ranges, including colonization by new breeding and wintering species, as well as local species decline following redistribution of the population into northern ice-free waters (Pavón-Jordán et al., 2019; Fox et al., 2019).
Mainly owing to milder spring temperatures and related effects on vegetation and prey, many waterbirds migrate earlier in spring (Rainio et al., 2006), and hence arrive earlier in the breeding area (Vähätalo et al., 2004), and some also start breeding earlier (van der Jeugd et al., 2009).
Earlier loss of sea ice was found to improve pre-breeding body condition of female common eiders, leading to increasing fledging success in offspring (Lehikoinen et al., 2006). On the other hand, algal blooms promoted by higher seawater temperature has in some cases caused low quality in bivalve prey for common eiders, leading more birds to skip breeding (Larsson et al., 2014). Warmer seawater in winter also increases the energy expenditure of mussels, thus directly reducing their quality as prey for eiders (Waldeck & Larsson 2013).
Most Baltic breeding waterbird species are migratory and affected by climate change also outside the Baltic region when wintering in southern Europe and western Africa (Fox et al. 2015). This is important, given that climate warming is above average also in southern Europe and northern Africa (Allen et al., 2018).
Future scenarios for the Baltic Sea (summarised by Meier et al. 2022) include decreasing salinity. Invertebrate species serving as prey for waterbirds (e.g. blue mussels for common eiders) would change distribution, body size and quality, with consequences for the distribution, reproduction and survival of the respective predatory waterbirds (Fox et al., 2015).
The consequences for piscivorous seabirds are complex, because effects of climate change are not uniform among Baltic Sea fish species. For example, expected increase of recruitment and abundance in an important prey species (sprat; (MacKenzie et al., 2012; Lindegren et al., 2012) as well as declining numbers of large predatory fish (cod) may provide support for fish-eating birds, although management efforts to improve cod stocks may counteract the expected increase in sprat and lead to population declines of their main bird predator, the common guillemot (Kadin et al., 2019). On the other hand, from the bird’s perspective another important prey species (herring) is negatively affected by decreasing salinity (declining energy content; Rajasilta et al., 2018).
A rising sea level would reduce the area of saltmarshes available for waders and other waterbirds for breeding and for geese for foraging (Clausen et al., 2013). Other coastal habitats would be affected likewise (Clausen and Clausen, 2014). Coastal breeding habitats may also experience physical loss due to erosion. In combination with storms, sea level rise would also affect the breeding success of coastal waterbirds due to flooding of their breeding sites.
Climate change induced changes in the pattern of occurrence of diseases and parasites can be expected to affect waterbirds in the Baltic (Fox et al., 2015).
8 Conclusions
Compared to the assessment period of HOLAS 2 (2011-2016), relatively few changes in status were observed in the HOLAS 3 evaluation (2026-2021) for both a total of 30 species and the five species groups. Thus, the status of breeding waterbirds remained largely the same. This is underlined by the finding that on the level of species groups no change in status occurred in the evaluation for the entire Baltic Sea: Surface feeders, pelagic feeders and grazing feeders remained in good status, whereas GES was not achieved by benthic feeders and wading feeders in HOLAS 2 and HOLAS 3.
8.1 Future work or improvements needed.
The indicator is in a state allowing evaluation of the status of breeding waterbirds in the entire Baltic based on population sizes. The evaluation of population sizes would benefit from the establishment of species-specific reference periods, which would allow to compare recent population sizes to pristine conditions.
9 Methodology
9.1 Scale of assessment
The assessment units are defined in the HELCOM Monitoring and Assessment Strategy Annex 4.
The evaluation was conducted at two spatial scales, the entire Baltic Sea (HELCOM assessment unit scale 1) and seven subdivisions of the Baltic Sea, which were defined as aggregations of up to four of the 17 sub-basins (HELCOM assessment unit scale 2) following recommendation by JWGBIRD (ICES 2017, 2018) (Figure 11). Several waterbird species (terns in particular) are known to switch between breeding colonies from year to year, possibly even at distances involving switches between sub-basins, leading to the estimate that HELCOM assessment unit scale 2 is not an appropriate scale. Further, the use of the seven subdivisions will make it easier to localize problems and to implement necessary regional or local measures to improve the status. These smaller scale evaluations are better suited to reflect the conditions of a given part of the Baltic Sea rather than downscaling the results from the entire Baltic Sea to everywhere. In addition, subdivision evaluations better serve the national reporting according to Article 8 of MSFD, because there is much less influence from other parts of the Baltic on the national evaluations. The seven subdivisions are defined as follows:
- A: Kattegat (Kattegat),
- B: Belt Group (Great Belt, The Sound),
- C: Bornholm Group (Kiel Bay, Bay of Mecklenburg, Arkona Basin, Bornholm Basin),
- D: Gotland Group (Gdansk Basin, Eastern Gotland Basin, Western Gotland Basin, Gulf of Riga),
- E: Åland Group (Northern Baltic Proper, Åland Sea),
- F: Gulf of Finland (Gulf of Finland),
- G: Bothnian Group (Bothnian Sea, The Quark, Bothnian Bay).
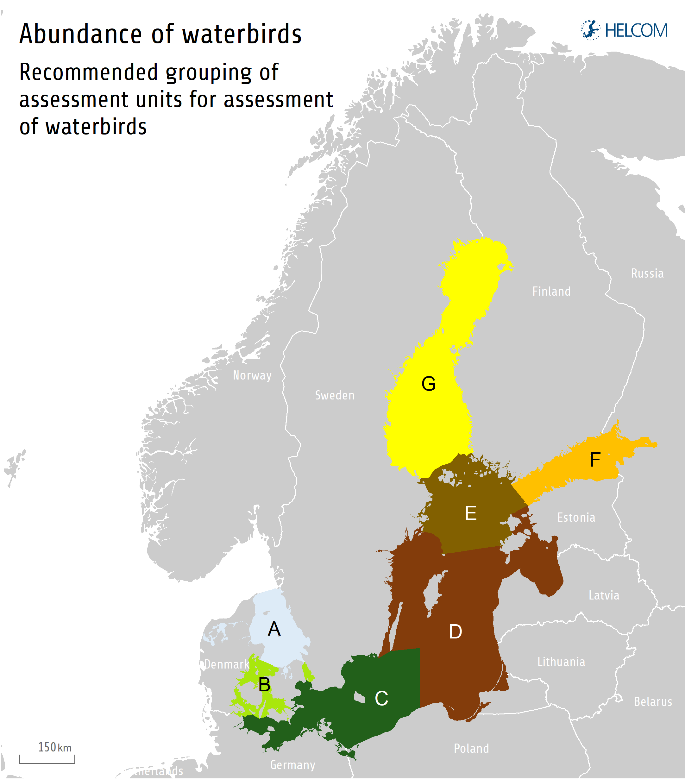
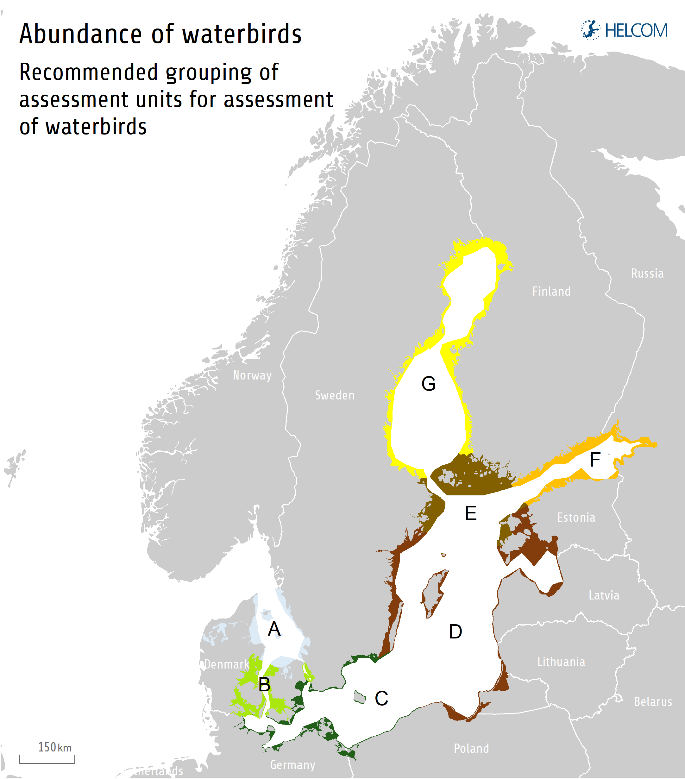
Figure 11. Grouping of 17 sub-basins (HELCOM assessment unit scale 2) to seven subdivisions as spatial units for breeding waterbird abundance evaluations as recommended by JWGBIRD (ICES 2018). The left figure shows the entire subdivision coloured, and the right figure shows the coastal areas, as used in the current evaluation, coloured by the seven subdivisions.
9.2 Methodology applied
The evaluation is based on the numbers of breeding pairs of waterbird species identified by JWGBIRD experts as suitable for this indicator (ICES 2016). They are counted in breeding colonies or in monitoring plots. Site level raw data are used for each species to calculate the annual indices and trends. The national monitoring programmes provide the breeding bird monitoring data. Each site level data for each species consists of site code, coordinates of the site, year of survey, recorded abundance and the units in which the abundance is expressed (mostly pairs). There is a separate entry for each year the site was visited. Each site is assigned a code indicating to which country and assessment unit it belongs.
To calculate the yearly indices and trends, the TRIM framework and “rtrim” package for the R statistical software is used. Models explaining the observed abundance by site effects and year effects while accounting for serial correlation and overdispersion in the data are built for each species. The method is based on loglinear Poisson regression and is able to impute the missing observations (ter Braak et al. 1994, van Strien et al. 2001, 2004). For more details of the procedure, see also http://www.ebcc.info/trim.html and https://www.cbs.nl/en-gb/society/nature-and-environment/indices-and-trends–trim–/. The method produces yearly indices and linear trend estimates (the slope of the regression line through the logarithm of the indices). The year 1991 or the start year of the time series (if later) is used as the point of reference (when the index is 1), but the results are then scaled to a reference period (i.e. the average index values from 1991-2000 are scaled to 1).
The multiplicative overall slope estimate in TRIM is converted into one of the following categories. The category depends on the overall slope as well as its 95% confidence interval (= slope +/- 1.96 times the standard error of the slope) (Pannekoek & van Strien 2001):
- Strong increase – increase significantly more than 5% per year (5% meaning a doubling in abundance within 15 years). Criterion: lower limit of confidence interval >1.05.
- Moderate increase – significant increase, but not significantly more than 5% per year. Criterion: 1.00< lower limit of confidence interval <1.05.
- Stable – no significant increase or decline, and it is certain that trends are less than 5% per year. Criterion: confidence interval encloses 1.00 but lower limit >0.95 and upper limit <1.05.
- Moderate decline – significant decline, but not significantly more than 5% per year. Criterion: 0.95< upper limit of confidence interval <1.00.
- Steep decline – decline significantly more than 5% per year (5% meaning a halving in abundance within 15 years). Criterion: upper limit of confidence interval <0.95.
All analyses are conducted on the level of species. Though in some species diverging trends are observed in different parts of the Baltic Sea, those differences are owing to two subspecies only in lesser black-backed gull and black guillemot. Lesser black-backed gull is represented by Larus fuscus intermedius in Kattegat, Belt Group and Bornholm Group, but by L. f. fuscus in Gotland Group, Åland Group, Gulf of Finland and Bothnian Group. Black guillemots breeding in Kattegat and Belt Group belong to the subspecies Cepphus grylle arcticus, those from further east in the Baltic Sea to C. g. grylle.
9.3 Monitoring and reporting requirements
Monitoring methodology
The indicator on breeding waterbirds is primarily based on counts of breeding pairs or nests along the shorelines of the Baltic Sea, i.e. is restricted to coastal landscape (including islands). Many species only breed in nature reserves or other protected sites, which have been monitored using constant methods for decades. In many sites, breeding birds are counted annually, and gaps can be filled by a TRIM analysis.
Specific monitoring guidelines for breeding waterbirds are planned to be included into the Monitoring Guidelines.
Current monitoring
Monitoring of breeding waterbirds in the Contracting Parties of HELCOM is described on a general level in the HELCOM Monitoring Manual in the sub-programme Marine breeding birds abundance and distribution.
There are some differing characteristics in the countries’ monitoring programmes, e.g. the species covered and the temporal scaling. Surveys are in most cases conducted annually, but every three or six years (as an adaptation to Natura 2000 reporting cycles, see European Commission 1992, 2010) or even every ten years (e.g. common eider in Denmark) in some cases.
Description of optimal monitoring
For abundance of breeding birds, the currently operational national monitoring schemes are only partly sufficient to supply the necessary data for the indicator. There are still gaps regarding spatial coverage (lack of monitoring schemes in Russia and Latvia) and coverage of species (not all monitoring schemes include all the species dealt with in the indicator), and an optimal monitoring would have to close these gaps. The monitoring methods applied could benefit from international standardization, however, need to take into consideration the varying environmental conditions and species composition of the different regions of the Baltic Sea. As not all species can be monitored in every country, depending on the assessment unit level chosen, it would be wise to coordinate national monitoring schemes in a way that allows for coverage of as many species as possible. For rare species, and those showing higher degrees of inter-annual relocation, coordinated Baltic-wide surveys should be aspired for in order to minimize the effects of data gaps and low site fidelity.
10 Data
The data and resulting data products (tables, figures and maps) available on the indicator web page can be used freely given that the source is cited.
11 Contributors
The indicator “Abundance of waterbirds in the breeding season” is led by Germany (responsible expert: Volker Dierschke) and co-led by Finland (responsible expert: Andreas Lindén).
HELCOM Secretariat: Jannica Haldin, Owen Rowe.
Data were supplied by the national monitoring schemes from Denmark, Germany, Poland, Latvia, Estonia, Finland and Sweden.
The analyses were undertaken by Ainārs Auniņš, funded by the German Federal Agency for Nature Conservation (BfN).
The indicator was developed by the OSPAR/HELCOM/ICES Joint Working Group on Marine Birds (JWGBIRD)
12 Archive
This version of the HELCOM core indicator report was published in April 2023:
The current version of this indicator (including as a PDF) can be found on the HELCOM indicator web page.
Earlier versions of this indicator are available below:
Abundance of waterbirds in the breeding season HELCOM core indicator 2018 (pdf)
HOLAS II component – Core indicator report – web-based version July 2017 (pdf)
13 References
Allen, M. R., Dube, O. P., Solecki, W., Aragón-Durand, F., Cramer, W., Humphreys, S., Kainuma, M., Kala, J., Mahowald, N., Mulugetta, Y., Perez, R., Wairiu, M., & Zickfeld, K., 2018. Framing and Context. In: Masson-Delmotte, V., Zhai, P., Pörtner, H.-O., Roberts, D., Skea, J., Shukla, P. R., Pirani, A., Moufouma-Okia, W., Péan, C., Pidcock, R., Connors, S., Matthews, J. B. R., Chen, Y., Zhou, X., Gomis, M. I., Lonnoy, E., Maycock, T., Tignor, M., & Waterfield, T. (eds.), Global Warming of 1.5°C. An IPCC Special Report on the impacts of global warming of 1.5°C above pre-industrial levels and related global greenhouse gas emission pathways, in the context of strengthening the global response to the threat of climate change, sustainable development, and efforts to eradicate poverty. https://www.ipcc.ch/sr15/chapter/chapter-1/
Bradbury, G., Trinder, M., Furness, B., Banks, A.N., Caldow, R.W.G., & Hume, D. 2014. Mapping seabird sensitivity to offshore wind farms. PLOS ONE 9 (9): e106366.
Clausen, K. K., Stjernholm, M., & Clausen, P. 2013. Grazing management can counteract the impacts of climate change-induced sea level rise on salt marsh-dependent waterbirds. Journal of Applied Ecology 50 : 528-537. https://doi.org/10.1111/1365-2664.12043
Clausen, K. K., & Clausen, P. 2014. Forecasting future drowning of coastal waterbird habitats reveals a major conservation concern, Biol. Conserv., 171, 177-185, https://doi.org/10.1016/j.biocon.2014.01.033
Ekroos, J., Fox, A.D., Christensen, T.K., Petersen, I.K., Kilpi, M., Jónsson, J.E., Green, M., Laursen, K., Cervencl, A., de Boer, P., Nilsson, L., Meissner, W., Garthe, S., & Öst, M. 2012. Declines amongst breeding Eider Somateria mollissima numbers in the Baltic/Wadden Sea flyway. Ornis Fennica 89: 81-90.
European Commission 1992. Council Directive 92/43/EEC of 21 May 1992 on the conservation of natural habitats and of wild fauna and flora. Off. J. Eur. Communities L 206: 7-50.
European Commission 2008. Directive 2008/56/EC of the European Parliament and the Council establishing a framework for community action in the field of marine environmental policy (Marine Strategy Framework Directive). Off. J. Eur. Union L 164: 19-40.
European Commission 2010. Directive 2009/147/EC of the European Parliament and of the Council of 30 November 2009 on the conservation of wild birds. Off. J. Eur. Union L20: 7-25.
European Commission 2017. Commission Decision of (EU) 2017/848 of 17 May 2017 laying down criteria and methodological standards on good environmental status of marine waters and specifications and standardized methods for monitoring and assessment, and repealing Decision 2010/477/EU. May 2017.
European Commission 2022. MSFD CIS Guidance Document No. 19, Article 8 MSFD, May 2022. https://circabc.europa.eu/d/d/workspace/SpacesStore/d2292fb4-ec39-4123-9a02-2e39a9be37e7/GD19%20-%20MSFDguidance_2022_Art.8Assessment(1).pdf
Fox, A.D., Jónsson, J. E., Aarvak, T., Bregnballe, T., Christensen, T. K., Clausen, K.K., Clausen, P., Dalby, L., Holm, T.E., Pavón-Jordan, D., Laursen, K., Lehikoinen, A., Lorentsen, S.-H., Møller, A.P., Nordström, M., Öst, M., Söderquist, P., & Roland Therkildsen, O. 2015. Current and potential threats to Nordic duck populations – a horizon scanning exercise. Annales Zoologici Fennici 52: 193-220. https://bioone.org/journals/annales-zoologici-fennici/volume-52/issue-4/086.052.0404/Current-and-Potential-Threats-to-Nordic-Duck-Populations–A/10.5735/086.052.0404.short
Fox, A. D., Nielsen, R. D., & Petersen, I. K. 2019. Climate-change not only threatens bird populations but also challenges our ability to monitor them. Ibis 161: 467-474. https://doi.org/10.1111/ibi.12675
Furness, R.W., Wade, H.M., & Masden, E.A. 2013. Assessing vulnerability of marine bird populations to offshore wind farms. J. Environ. Manage. 119: 56-66.
Gunnarsson, G., Waldenström, J., & Fransson, T. 2012. Direct and indirect effects of winter harshness on the survival of Mallards Anas platyrhynchos in northwest Europe. Ibis 154: 307-317. https://doi.org/10.1111/j.1474-919X.2011.01206.x
HELCOM 2013. Red List of Baltic Sea species in danger of becoming extinct. Baltic Sea Environ, Proc. No. 140.
HELCOM 2018. Abundance of waterbirds in the breeding season. HELCOM core indicator report. https://helcom.fi/wp-content/uploads/2019/08/Abundance-of-waterbirds-in-the-breeding-season-HELCOM-core-indicator-2018.pdf
HELCOM & Baltic Earth 2021. Climate Change in the Baltic Sea. 2021 Fact Sheet. Baltic Sea Environment Proceedings 180. https://helcom.fi/baltic-sea-climate-change-fact-sheet-new-publication-shows-latest-scientific-knowledge-on-climate-change-in-the-baltic-sea/
Herrmann, C., Rintala, J., Lehikoinen, A., Petersen, I.K., Hario, M., Kadin, N., Korpinen, S. 2013. Abundance of waterbirds in the breeding season. HELCOM Core Indicator Report.
ICES 2013. Report on the Joint ICES/OSPAR Expert Group on Seabirds (WGBIRD), 22-25 Oct 2013, Copenhagen, Denmark. Available at: http://www.ices.dk/sites/pub/Publication%20Reports/Expert%20Group%20Report/acom/2013/WGBIRD/wgbird_2013.pdf
ICES 2015. Report on the Joint ICES/OSPAR Working Group on Seabirds (JWGBIRD), 17-21 November 2014, Copenhagen, Denmark. Available at: http://ices.dk/sites/pub/Publication%20Reports/Expert%20Group%20Report/acom/2014/JWGBIRD/JWGBIRD_2014.pdf
ICES 2016. Report of the Joint OSPAR/HELCOM/ICES Working Group on Seabirds (JWGBIRD), 9-13 November 2015, Copenhagen, Denmark. Available at: http://www.ices.dk/sites/pub/Publication%20Reports/Expert%20Group%20Report/acom/2015/JWGBIRD/JWGBIRD_2015.pdf
ICES 2017. Report of the OSPAR/HELCOM/ICES Working Group on Marine Birds (JWGBIRD), 10-14 October 2016, Thetford, U.K. Available at: http://ices.dk/sites/pub/Publication%20Reports/Expert%20Group%20Report/acom/2016/JWGBIRD/ExSumm_JWGBIRD_2016.pdf
ICES 2018. Report of the Joint OSPAR/HELCOM/ICES Working Group on Seabirds (JWGBIRD), 6–10 November 2017, Riga, Latvia. ICES CM 2017/ACOM:49. 97 pp. Available at: http://ices.dk/sites/pub/Publication%20Reports/Expert%20Group%20Report/acom/2017/JWGBIRD/01%20JWGBIRD%20Report.pdf
Kadin, M., Frederiksen, M., Niiranen, S., & Converse, S. J. 2019. Linking demographic and food-web models to understand management trade-offs, Ecology and Evolution 9: 8587-8600. https://doi.org/10.1002/ece3.5385
Larsson, K., Hajdu, S., Kilpi, M., Larsson, R., Leito, A., & Lyngs, P. 2014. Effects of an extensive Prymnesium polylepis bloom on breeding eiders in the Baltic Sea. Journal of Sea Research 88: 21-28.
Lehikoinen, A., Kilpi, M., & Öst, M. 2006. Winter climate affects subsequent breeding success of common eiders. Global Change Biology 12: 1355-1365. https://doi.org/10.1111/j.1365-2486.2006.01162.x
Lindegren, M., Blenckner, T., & Stenseth, N. C. 2012. Nutrient reduction and climate change cause a potential shift from pelagic to benthic pathways in a eutrophic marine ecosystem, Global Change Biol., 18, 3491-3503, https://doi.org/10.1111/j.1365-2486.2012.02799.x
MacKenzie, B. R., Meier, H. E. M., Lindegren, M., Neuenfeldt, S., Eero, M., Blenckner, T., Tomczak, M. T., & Niiranen, S. 2012. Impact of Climate Change on Fish Population Dynamics in the Baltic Sea: A Dynamical Downscaling Investigation. Ambio 41: 626-636. https://doi.org/10.1007/s13280-012-0325-y
Masden, E.A., Haydon, D.T., Fox, A.D., Furness, R.W. 2010. Barriers to movement: Modelling energetic costs of avoiding marine wind farms among breeding seabirds. Mar. Poll. Bull. 60: 1085-1091.
Meier, H.E.M., Kniebusch, M., Dieterich, C., Gröger, M., Zorita, E., Elmgren, R., Myrberg, K., Ahola, M.P., Bartosova, A., Bonsdorff, E., Börgel, F., Capell, R., Carlén, I., Carlund, T., Carstensen, J., Christensen, O.B., Dierschke, V., Frauen, C., Frederiksen, M., Gaget, E., Galatius, A., Haapala, J.J., Halkka, A., Hugelius, G., Hünicke, B., Jaagus, J., Jüssi, M., Käyhkö, J., Kirchner, N., Kjellström, E., Kulinski, K., Lehmann, A., Lindström, G., May, W., Miller, P.A., Mohrholz, V., Müller-Karulis, B., Pavón-Jordán, D., Quante, M., Reckermann, M., Rutgersson, A., Savchuk, O.P., Stendel, M., Tuomi, L., Viitasalo, M., Weisse R., & Zhang, W. 2022. Climate change in the Baltic Sea region: a summary. Earth System Dynamics 13: 457-593. https://esd.copernicus.org/articles/13/457/2022/
Nilsson, L., & Haas, F. 2016. Distribution and numbers of wintering waterbirds in Sweden in 2015 and changes during the last fifty years. Ornis Svecica 26: 3–54.
OSPAR 2017. Marine bird abundance. In: Intermediate Assessment 2017. Available at: https://oap.ospar.org/en/ospar-assessments/intermediate-assessment-2017/biodiversity-status/marine-birds/bird-abundance/
Pannekoek, J., van Strien, A.J. 2001. TRIM 3 manual (TRends and Indices for Monitoring data). Research paper no. 0102. Statistics Netherlands.
Pavón-Jordán, D., Clausen, P., Dagys, M., Devos, K., Encarnaçao, V., Fox, A. D., Frost, T., Gaudard, C., Hornman, M., Keller, V., Langendoen, T., Ławicki, Ł., Lewis, L. J., Lorentsen, S.-H., Luigujoe, L., Meissner, W., Molina, B., Musil, P., Musilova, Z., Nilsson, L., Paquet, J.-Y., Ridzon, J., Stipniece, A., Teufelbauer, N., Wahl, J., Zenatello, M., & Lehikoinen, A. 2019. Habitat- and species-mediated short- and long-term distributional changes in waterbird abundance linked to variation in European winter weather. Diversity and Distributions 25: 225-239. https://doi.org/10.1111/ddi.12855
Rainio, K., Laaksonen, T., Ahola, M., Vähätalo, A. V., & Lehikoinen, E. 2006. Climatic responses in spring migration of boreal and arctic birds in relation to wintering area and taxonomy. Journal of Avian Biology 37: 507-515. https://doi.org/10.1111/j.0908-8857.2006.03740.x
Rajasilta, M., Hänninen, J., Laaksonen, L., Laine, P., Suomela, J.-P., Vuorinen, I., & Mäkinen, K. 2018. Influence of environmental conditions, population density, and prey type on the lipid content in Baltic herring (Clupea harengus membras) from the northern Baltic Sea, Can. J. Fish. Aquat. Sci. 76: 576-585. https://doi.org/10.1139/cjfas-2017-0504
Skov, H., Heinänen, S., Žydelis, R., Bellebaum, J., Bzoma, S., Dagys, M., Durinck, J., Garthe, S., Grishanov, G., Hario, N., Kieckbusch, J.J., Kube, J., Kuresoo, A., Larsson, K., Luigujoe, L., Meissner, W., Nehls, H.W., Nilsson, L., Petersen, I.K., Mikkola Roos, M., Pihl, S., Sonntag, N., Stock, A., Stipniece, A. 2011. Waterbird populations and pressures in the Baltic Sea. TemaNord 2011:550. Nordic Council of Ministers, Copenhagen.
ter Braak, C., van Strien, A., Meijer, R., & Verstrael, T., 1994. Analysis of Monitoring Data With Many Missing Values: Which Method? In: Hagemeijer EJM, Verstrael TJ (eds) Bird numbers 1992 distribution monitoring and ecological aspects. Proceedings of the 12th International Conference of IBCC and EOAC. pp 663–673
Vähätalo, A. V., Rainio, K., Lehikoinen, A., & Lehikoinen, E., 2004. Spring arrival of birds depends on the North Atlantic Oscillation. Journal of Avian Biology 35: 210-216. https://doi.org/10.1111/j.0908-8857.2004.03199.x
van der Jeugd, H. P., Eichhorn, G., Litvin, K. E., Stahl, J., Larsson, K., van der Graaf, A. J., & Drent, R. H. 2009. Keeping up with early springs: rapid range expansion in an avian herbivore incurs a mismatch between reproductive timing and food supply. Global Change Biology 15: 1057-1071. https://doi.org/10.1111/j.1365-2486.2008.01804.x
van Strien, A.J., Pannekoek, J., Gibbons, D. 2001. Indexing European bird population trends using results of national monitoring schemes: a trial of a new method. Bird Study 48: 200-213.
van Strien, A., Pannekoek, J., Hagemeijer, W., Verstrael, T. 2004. A logline Poisson regression method to analyse bird monitoring data. Bird Census News 13: 33-39.
Waldeck, P., & Larsson, K. 2013. Effects of winter water temperature on mass loss in Baltic blue mussels: Implications for foraging sea ducks. J. Exp. Mar. Biol. Ecol. 444: 24-30. https://doi.org/10.1016/j.jembe.2013.03.007
14 Other relevant resources
Keller, V., Herrando, S., Voříšek,P., Franch, M., Kipson, M., Milanesi, P., Martí, D., Anton, M., Klvaňová, A., Kalyakin, M.V., Bauer, H.-G., & Foppen, R.P.B. 2020. European Breeding Bird Atlas 2: Distribution, Abundance and Change. European Bird Census Council & Lynx Edicions, Barcelona.
Additional information is provided in two annexes.