 White-tailed sea eagle
2 Relevance of the indicator
As predators at the top of the aquatic food chain, white-tailed sea eagles are highly exposed to hazardous substances that accumulate and magnify through the food web and can thus serve as sentinels for the effects of harmful substances. The elevated concentrations of persistent chemicals in white-tailed sea eagles also give possibilities to detect new emerging pollutants that are below detection limits in other biota.
The white-tailed sea eagle was the first species to signal the effects of persistent chemicals in the Baltic Sea environment. By the 1970s its population was reduced to one fifth of the pre-1950 background level due to the effects of contamination from hazardous substances. The detection of PCB in Baltic white-tailed sea eagles occurred in 1966. After measures were implemented to ban the use of DDT and PCB, the reproductive success began improving after a delay of approximately a decade. The productivity reached that of a reference level by the mid-1990s, clearly exemplifying a case where the effects of environmental management actions are reflected in an improved environmental status.
2.1 Ecological relevance
The white-tailed sea eagle is the ultimate top predator of the Baltic ecosystem, feeding on fish, sea birds, and seals, and is thus strongly exposed to persistent chemicals that magnify in the food web. It was the first species that indicated deleterious effects from environmental pollutants in the Baltic Sea.
Within the Helsinki Convention (HELCOM) area, white-tailed sea eagles prey primarily on waterfowl and fish, and to some extent on mammals, largely as carrion (seals) (Table 1). The white-tailed sea eagle is an opportunistic hunter and the food it consumes largely reflects the availability of potential prey. Fish that dwell in shallow waters or close to the surface are particularly vulnerable to predation. Common fish prey species in the Baltic Sea coastal ecosystems include pike (Esox lucius), bream (Abramis brama), Ide (Leuciscus idus), perch (Perca fluviatilis), and in some areas prussian carp (Carassius gibelio). A species that has increased strongly as prey in recent years in the Baltic Proper is garfish (Belone belone), probably as a result of increased availability but possibly also as a substitute for local decreases in the abundance of pike. Most common among bird prey are eider (Somateria mollissima), mergansers (Mergus merganser, M.serrator), mallard (Anas platyrhynchos), cormorants (Phalacrocorax carbosinesis), gulls (Laridae spp.), great-crested grebe (Podiceps cristatus), and coot (Fulica atra). A clear shift from a dominance of fish prey near the mainland shore to a dominance of bird prey in the outer archipelago has been observed (Helander 1983). A shift among bird species has also been observed, reflecting differences in availability from mainland to outer coast areas. A decrease in the abundance (and thus availability) of eider has been compensated for by the increase in abundance of cormorants. The prey distributions seem to be largely similar in different parts of the Baltic Sea, but the proportions of the prey species have not been studied in all sub-basins.
Table 1. Prey of the white-tailed sea eagle in Baltic Sea sub-basins.
| Waterbirds | Fish | Mammals | Other | |
| Gulf of Bothnia | 55% | 34% | 11% (carcasses) | |
| Åland Sea + Archipelago Sea | 58–66% | 28–36% | no data | 6–8% |
| Gulf of Finland | yes | yes | yes | seal carcasses |
| Northern & Central Baltic Proper + Gulf of Riga | 58% | 36% | seal carcasses | 8% |
| Southern Baltic Proper | waterfowl, geese | yes | carcasses of deer and wild boar | |
| Danish Straits and German Bights | waterfowl, geese | yes | carcasses | |
| Kattegat + Limfjorden | waterfowl, geese | yes | carcasses |
In addition to being a top predator, the white-tailed sea eagle has other features that are favourable from a monitoring perspective. Territorial adults on the Baltic Sea coast mainly remain in a given locality (sedentary) and can thus reflect the ‘local’ contaminant situation. Mating pairs generally pair for life and remain at the same breeding site, with sites commonly used over many generations of eagles. This provides a very good opportunities for long-term monitoring and detailed studies. A large portion of breeders in the Baltic Sea region are currently ringed, improving possibilities for study of individual birds over time.
2.2 Policy relevance
The white-tailed sea eagle populations declined significantly were even exterminated in many European countries in the early 1900s due to strong persecution in the 19th and early 20th centuries. The population increased again due to protection measures. A second decline began in the 1950s and continued into the 1960s and 1970s due to organic pollutants, mainly DDE (a metabolite of DDT) which caused structural changes and thinning of egg shells, and PCBs which caused embryo mortality. Hence, wide-spread failure in reproduction was recorded as a result of these pressures. Reproduction in the Baltic Sea eagle population in the 1970s was reduced to one fifth of the pre-1950 background level. Following bans of DDT and PCBs during the 1970s, the Baltic white-tailed sea eagle productivity began to recover from the mid-1980s, and since the mid-1990s is largely back to pre-1950 levels. The population on the Swedish Baltic coast has increased at 7.8% per year between 1990 and 2016.
The improvement in reproduction of the Baltic white-tailed sea eagle populations came no earlier than 10 years after most countries around the Baltic had implemented bans of DDT and PCBs. This is a clear reminder of the potentially long-term effects of persistent pollutants. The subsequent recovery is nevertheless important evidence of successful results due to good management decision making.
The policy relevance of the white-tailed sea eagle productivity HELOCM indicator in relation to the Baltic Sea Action Plan (BSAP 2021), Marine Strategy Framework Directive (MSFD) and other relevant policies is set out briefly in Table 2.
Table 2. Policy relevance of the indicator.
| Baltic Sea Action Plan (BSAP) | Marine Strategy Framework Directive (MSFD) | |
| Fundamental link | Segment: Hazardous substances and litter goal
Goal: “Baltic Sea unaffected by hazardous substances and litter”
|
Descriptor 8 Concentrations of contaminants are at levels not giving rise to pollution effects.
|
| Complementary link | Descriptor 1 Species groups of birds, mammals, reptiles, fish and cephalopods.
Descriptor 4 Ecosystems, including food webs.
|
|
| Other relevant legislation: |
|
|
2.3 Relevance for other assessments
The status of the Baltic Sea marine environment in terms of contamination by hazardous substances is assessed using several core indicators. Each indicator focuses on one important aspect of the complex issue. In addition to providing an indicator-based evaluation of the status of white-tailed sea eagle productivity, this indicator also contributes to the overall hazardous substances assessment, along with the other hazardous substances core indicators.
3 Threshold values
Good environmental status (GES) in terms of white-tailed sea eagle reproduction is evaluated using the parameter ‘productivity’ and the two supporting variables ‘brood size’ and ‘breeding success’. For an assessment unit to be evaluated as having achieved the threshold values (i.e. in GES), all three parameters have to achieve their respective threshold values. The threshold values for each parameter are based on an acceptable deviation from the target level determined during a reference period.
Threshold values
The target used to determine whether good status is achieved or not is set to the lower 95% confidence limit of the observations during the reference period. The data for the three parameters are evaluated as time trends. Observations should be measured as averages for a recent five to 10 year-period (depending on sample sizes). The current evaluation is based on an 8-year assessment period.
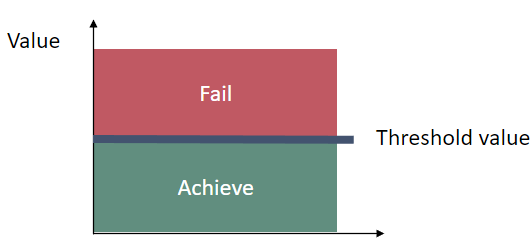
Figure 2. The threshold values are based on an acceptable deviation from the target level determined during a reference period.
The confidence in the threshold values, based on the reference levels, is considered to be high as it has been determined based on carefully selected actual observations from the time period 1854-1953.
Table 3. Threshold value(s).
| HELCOM Assessment unit name | Parameter | Threshold value |
| All assessment units | Productivity | 0.97 (nestlings) |
| All assessment units | Brood size | 1.64 (nestlings) |
| All assessment units | Breeding success | 0.59 (59%) |
3.1 Setting the threshold value(s)
Reference levels
The reference levels are based on actual reference status data collected from the Swedish Baltic Sea coast. Breeding success data cover the period 1915-1953 and nestling brood size includes data from the period 1858-1950. The target level for productivity is based on the combined data for breeding success and nestling brood size. It should be noted that the population in those times was much smaller than today and was most probably under no influence of density-dependent effects.
Due to the lack of reference data from other parts of the Baltic Sea, the same reference level has been tentatively used for the entire Baltic Sea coastal zone. Where possible, the applicability of the reference level and the resulting threshold values should be validated using data from other parts of the Baltic Sea.
Breeding success
The reference level for breeding success has been determined based on data from the period 1915-1953 (n=43 years). The data has been assembled as series of records over time periods of 3-10 years in succession from eight white-tailed sea eagle territories. The mean value of successful nests was 72%, and the 95% confidence interval ranges from 59% to 86% based on binomial distribution (Figure 3).
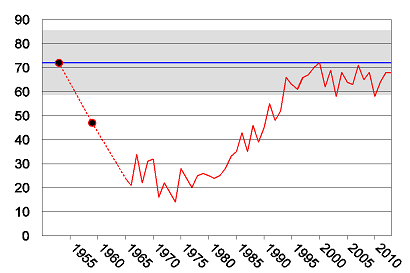
Figure 3. Breeding success (% reproducing pairs) in the white-tailed sea eagle population on the Swedish Baltic Sea coast. The upper dot and the blue line indicate the background reference mean value with 95% confidence interval (grey) for a time period 1915-1953, based on data from eight eagle territories (n=43). The lower dot indicates a mean value for the time period 1954-1963 based on data from 14 territories (n=68).
Brood size
The reference level for brood size has been determined based on data on white-tailed sea eagle nestling brood size retrieved from banding records and from literature, comprising a total of 91 broods from the period 1858-1950. The recorded brood size can only result in a discrete number (1, 2 or 3 nestlings). Up to 1950, the arithmetic mean for nestling brood size was 1.84. The distribution for samples taken from such a population cannot be expected to be normally distributed. In order to investigate the true sample distribution, for estimation of a confidence interval around the mean value for brood size, samples of 25 individual brood sizes were randomly taken from the population using the 1858 – 1950 dataset (Figure 4). This was repeated 1,000 times (bootstrapping). The estimated sample distribution deviates significantly from the normal distribution (p<0.03). An estimated 95% confidence interval for a sample size of 25 was between 1.64 and 2.04.
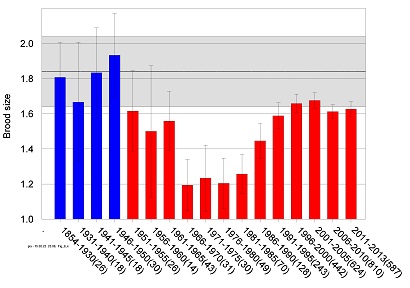
Figure 4. Mean brood size (number of nestlings per successfully breeding pair) of white-tailed sea eagle on the Swedish Baltic Sea coast 1854-2013. Sample size for each time period is given in brackets. A reference level (solid black line) with 95% confidence limits (grey area) is based on data from 1854-1950 (blue bars) according to Helander (2003a).
Productivity
The reference level for productivity has been derived by combining the reference levels for brood size and breeding success. This gives a reference level for mean productivity of 1.84 x 0.72 = 1.32, with confidence limits from 1.64 x 0.59 = 0.97 up to 2.04 x 0.86 = 1.75. This estimate of confidence interval has been used in previous evaluations. A more stringent estimate based on frequency distributions was derived from the dataset for nestling brood size (n = 91, all successful breeding attempts) with the addition of 35 ‘fictive’ unsuccessful breeding attempts, based on the mean value of 72% breeding success in the population. The 95% confidence interval around the mean value of 1.32 was estimated with the same method as for nestling brood size above (bootstrapping) and is from 1.15 to 1.50. This confidence interval is built from a population that was probably under no influence from density dependent mechanisms. Under current conditions, it might be more appropriate to apply the wider interval given above, and setting the lower end at 0.97.
4 Results and discussion
The results of the indicator evaluation that underlie the key message map and information are provided below.
4.1 Statusevaluation
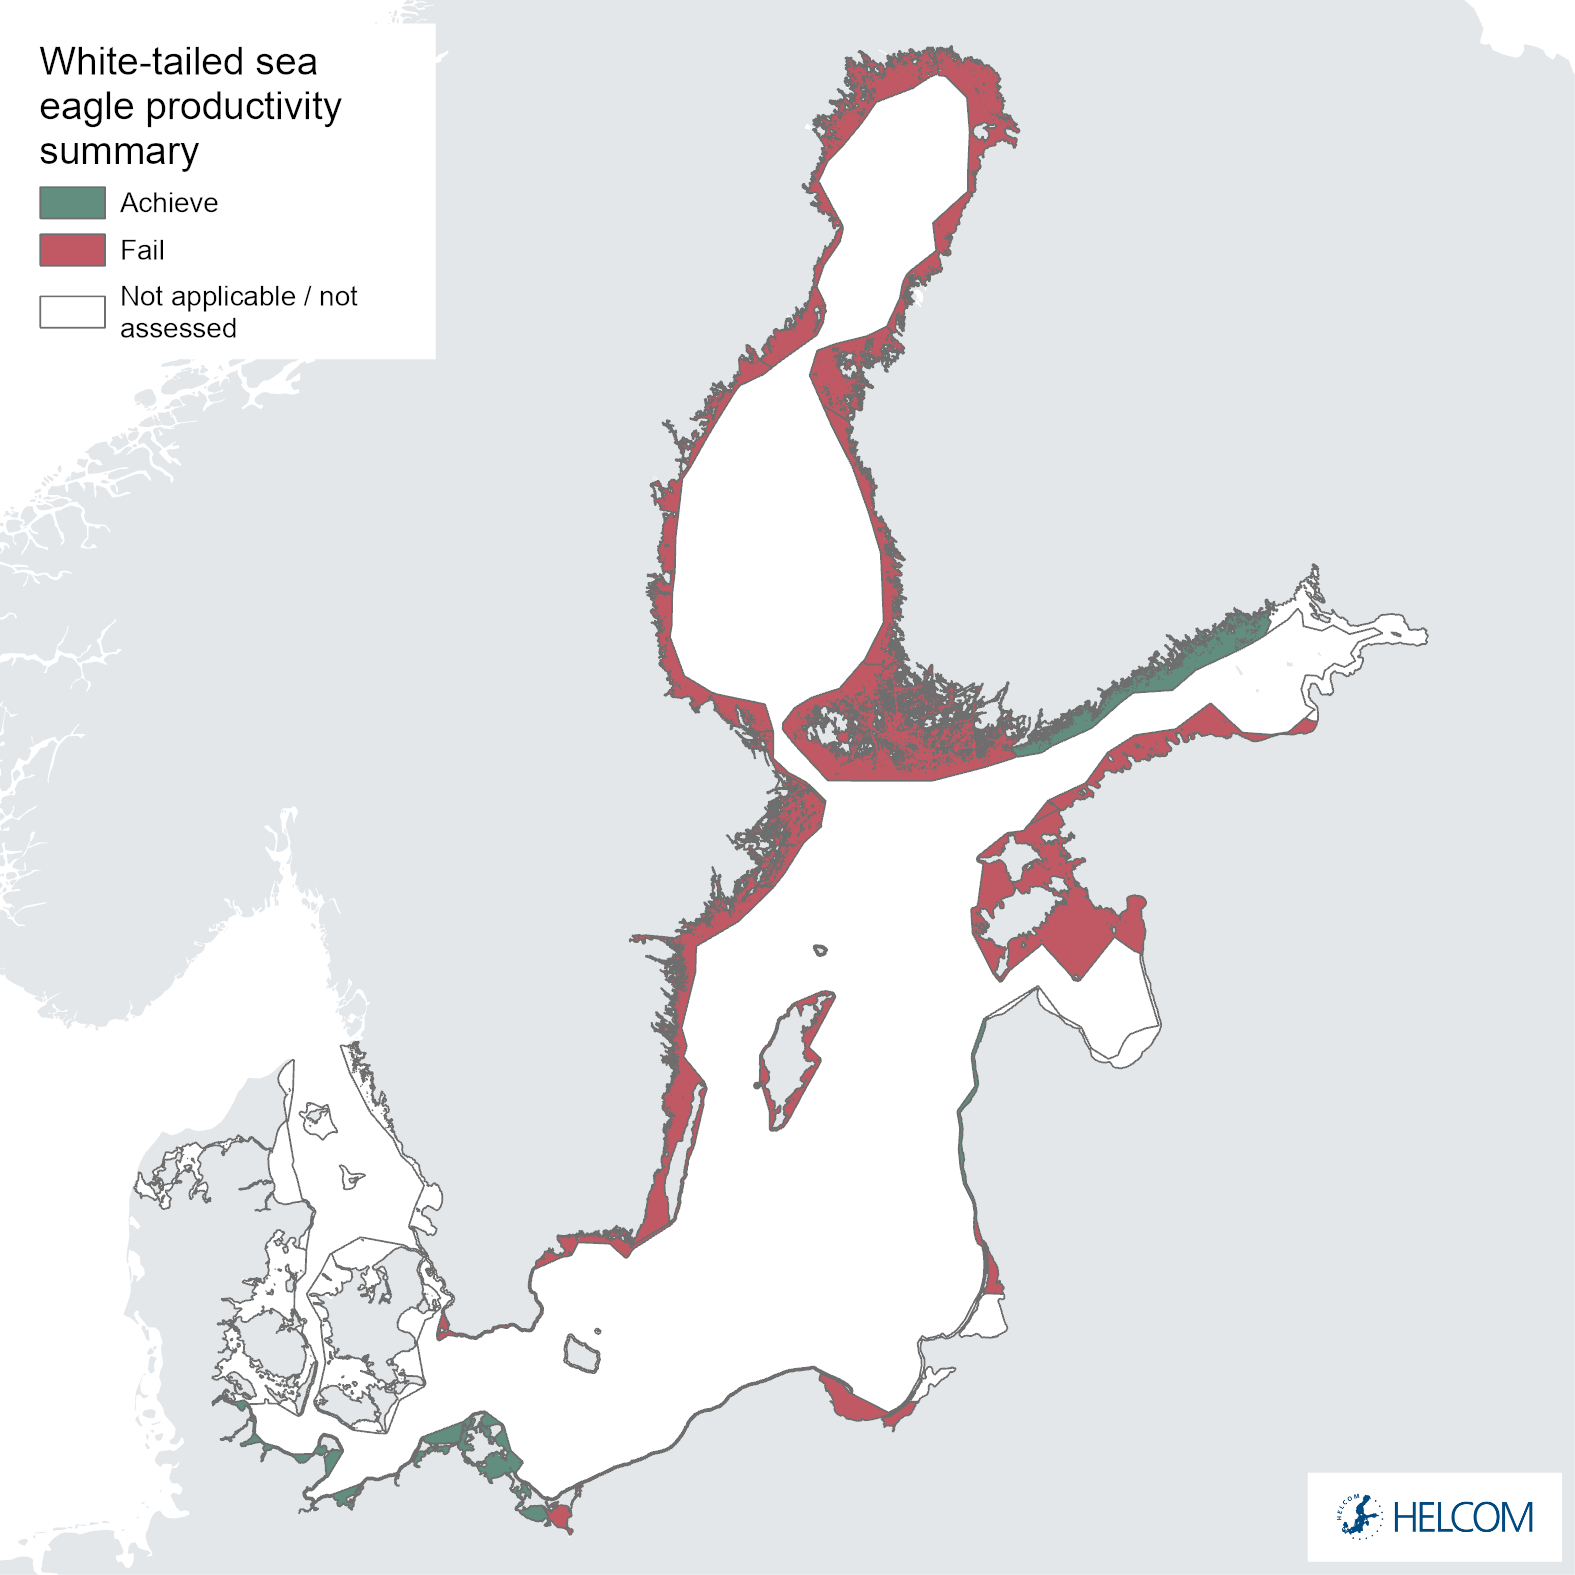
The environmental status evaluation for the coastal areas of the Baltic Sea using the productivity of the white-tailed sea eagle considers three parameters: productivity, nestling brood size and breeding success. For three of the 10 assessment units (30%, Figure 5 and Figure 1), good status was achieved for all three parameters in the evaluated period 2016-2021.
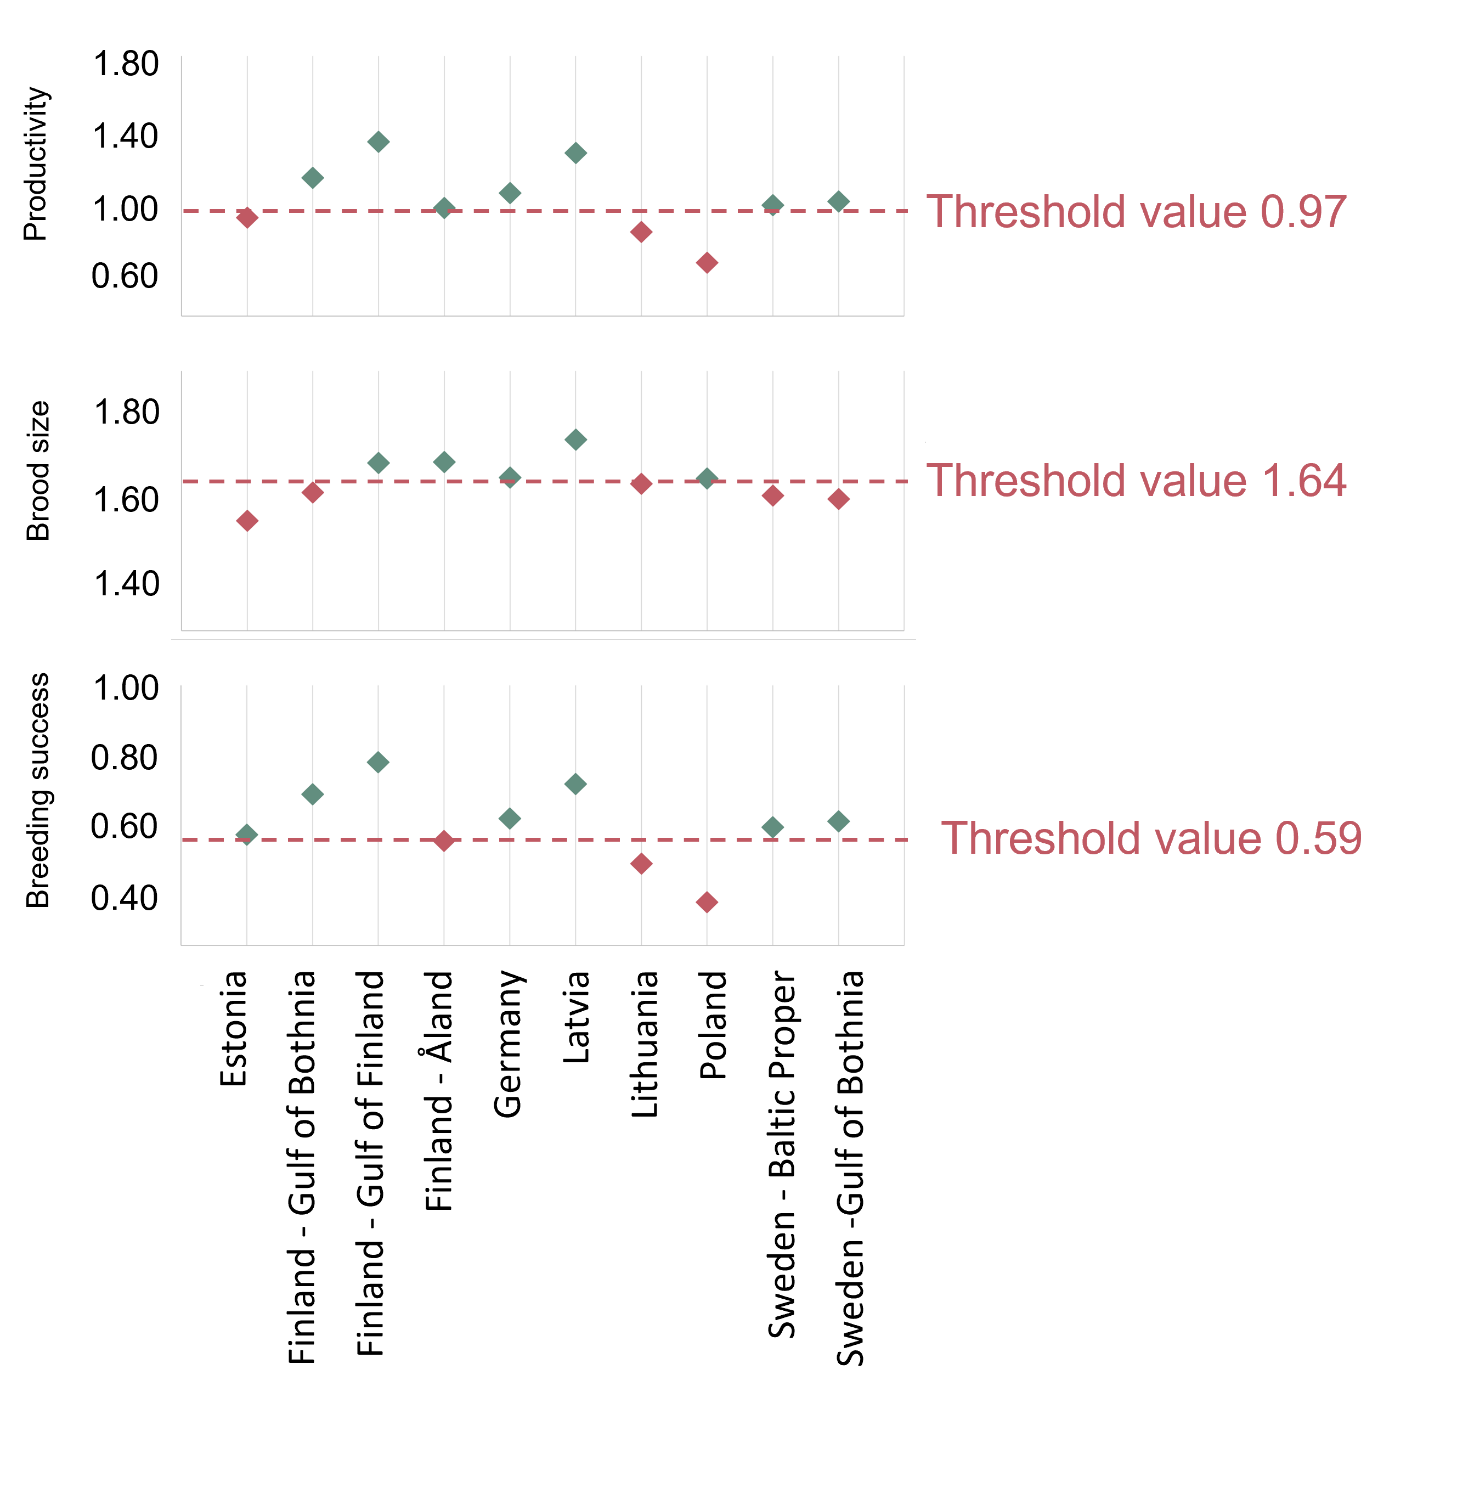
Figure 5. Estimates for white-tailed sea eagle productivity (top), brood size (middle) and breeding success (bottom) for the HOLAS 3 evaluation period 2016-2021. Reference levels based on “historical” data from Sweden are drawn as horizontal lines, where the lower limit of the 95% confidence interval (drawn as red dashed lines) equals the threshold value for the evaluation.
The failure to achieve good environmental status (sub-GES) was broadly caused by nestling brood size (Figure 5 and Figure 6) and/or breeding success (Figure 5 and Figure 7) not reaching the threshold values, though the productivity parameter productivity failed to achieve good environmental in three assessment units (Estonia, Lithuania and Poland, Figure 5 and Figure 8). The breeding success parameter was sub-GES in three regions: Finland – Åland Sea, Lithuania and Poland. The brood size parameter was sub-GES in five regions: Estonia, Finland – Gulf of Bothnia, Lithuania, Sweden – Baltic Proper, and Sweden – Gulf of Bothnia. The overall GES evaluation is commonly due to the failure to achieve threshold values in a single parameter, though in the regions Estonia and Poland two parameters are sub-GES. In the region Lithuania all three parameters fail their threshold values, though the parameter for brood size resides directly on the threshold value. It is also a somewhat general trend for those assessment units failing to achieve the threshold values exhibiting values that are close to the threshold value (Table 4).
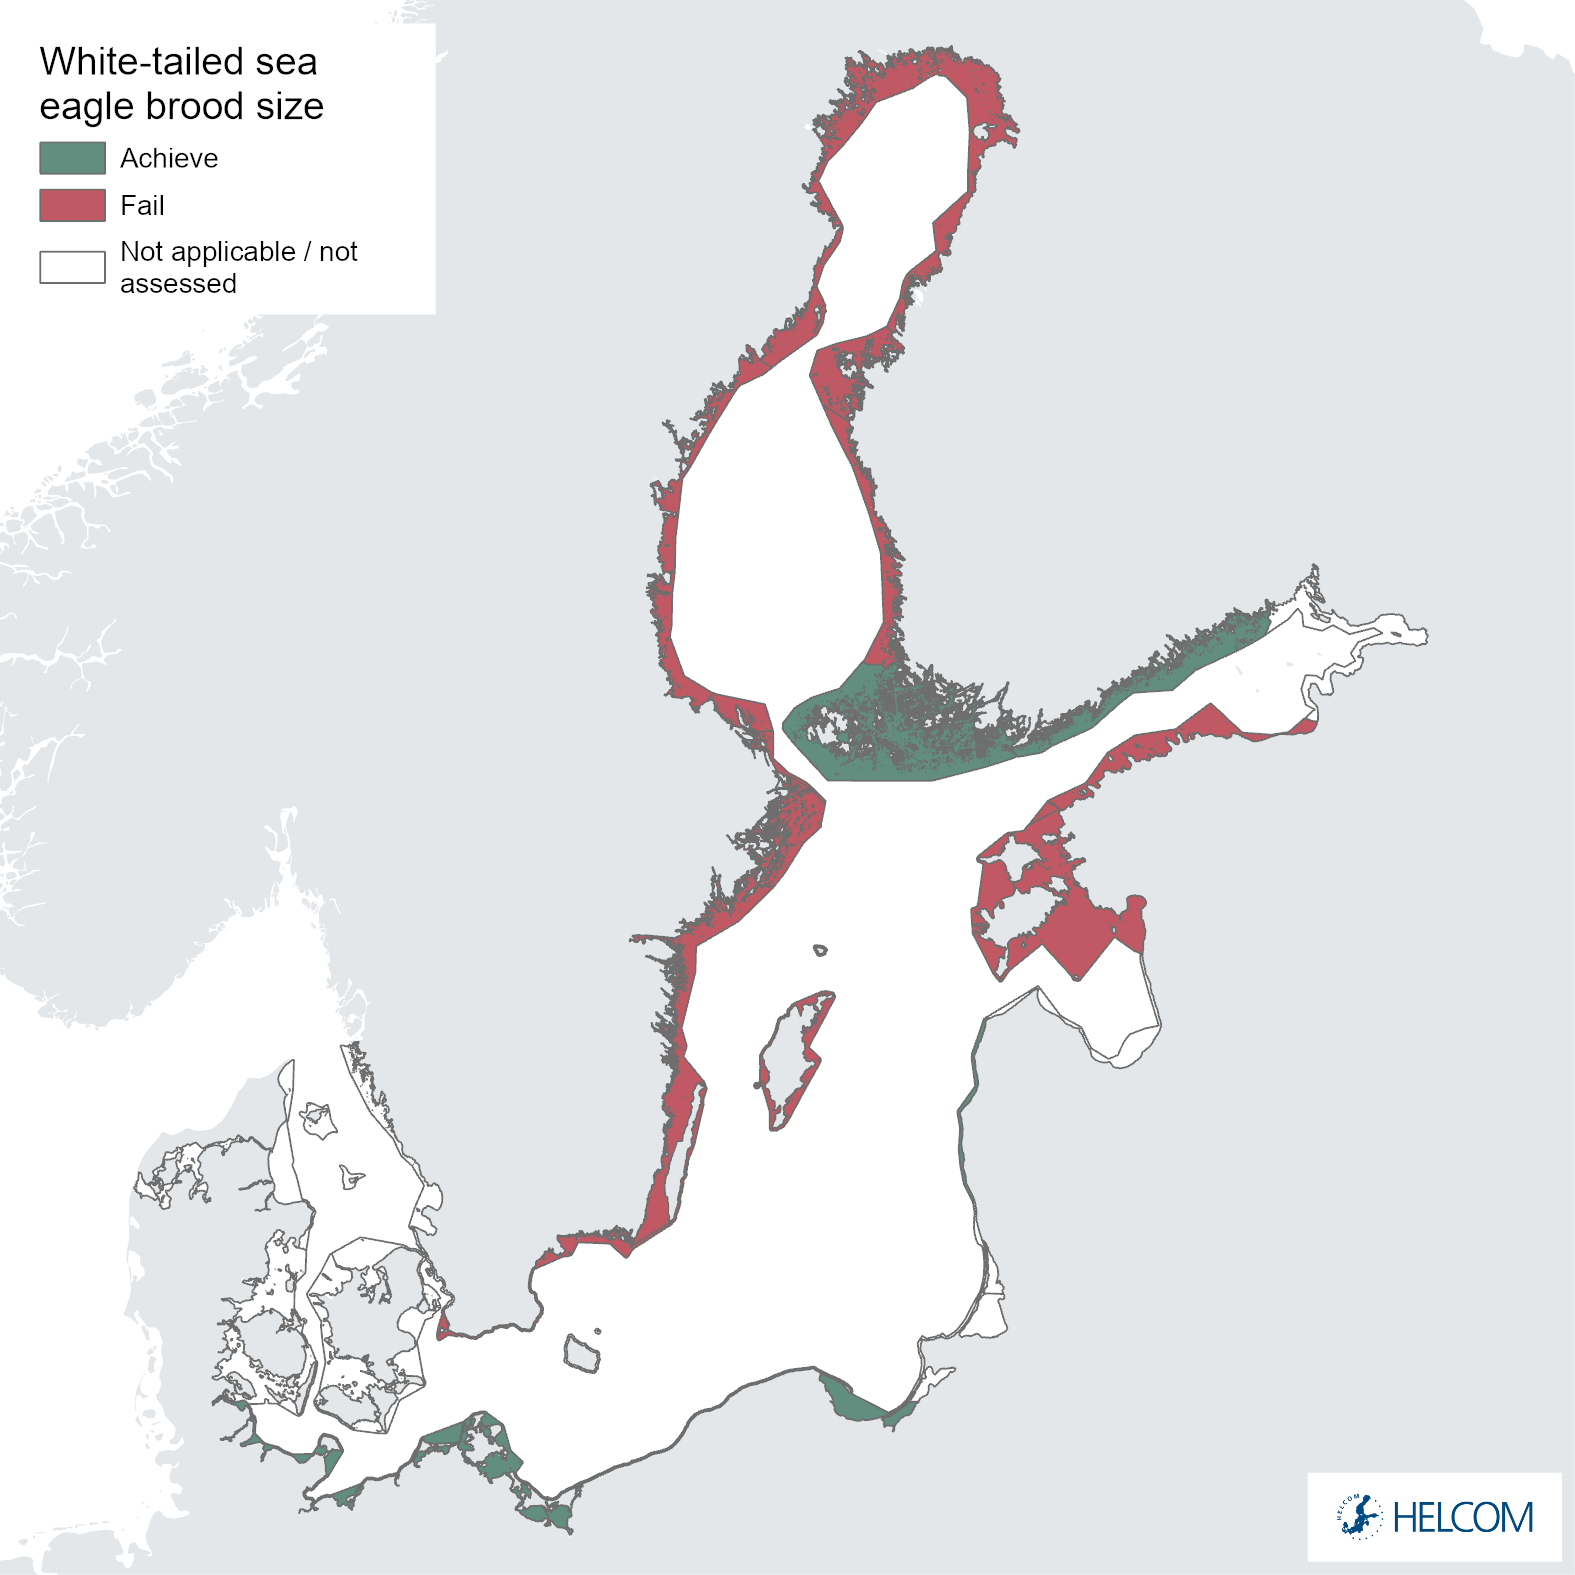
Figure 6. Status evaluation of parameter brood size.
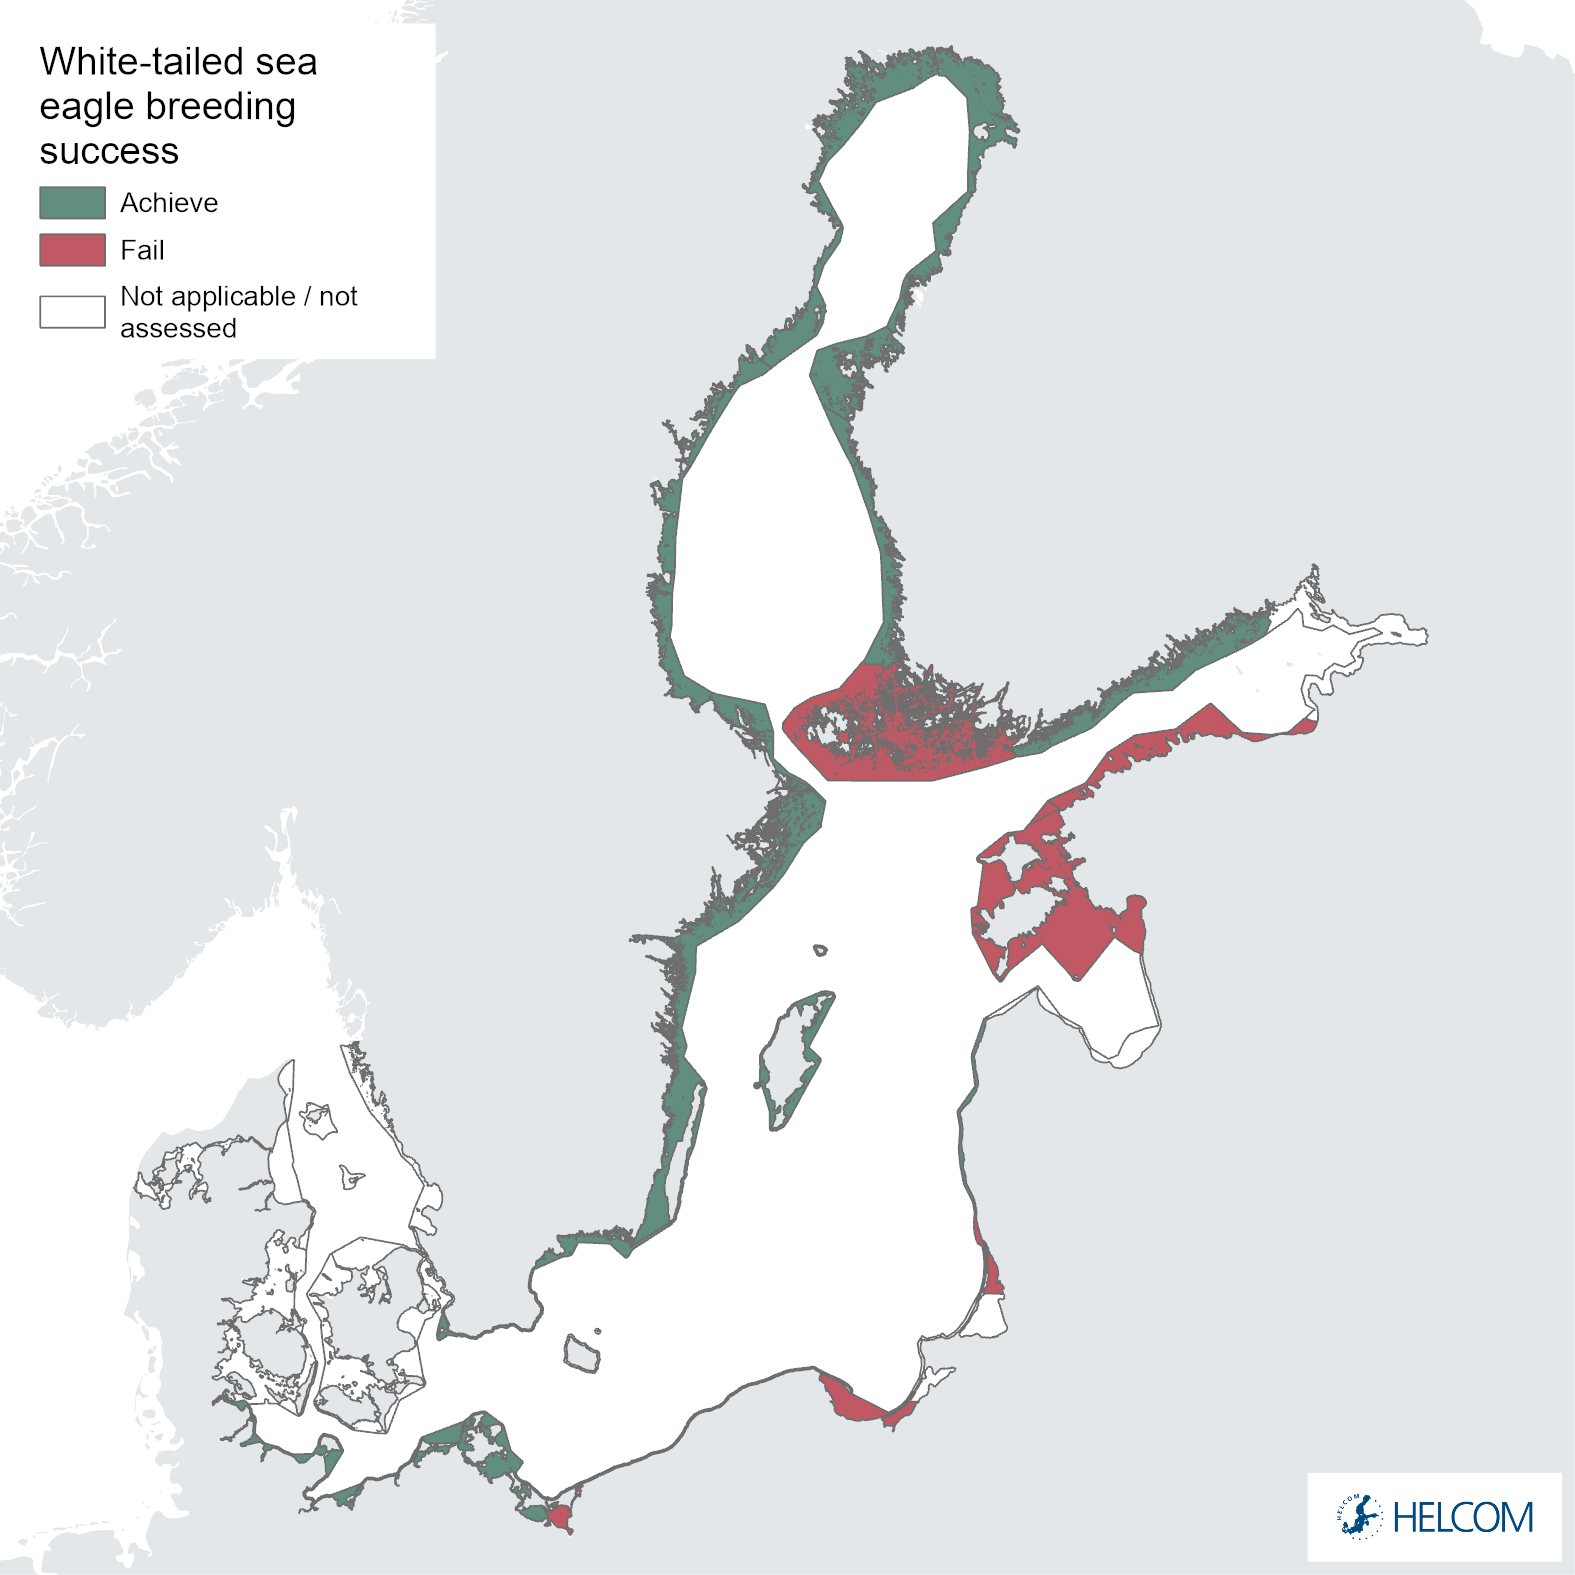
Figure 7. Status evaluation of parameter breeding success.

Figure 8. Status evaluation of parameter productivity.
Table 4. Overview of results for the assessment period 2016-2021 (HOLAS 3) for each parameter and overall. TV = threshold value applied for each parameter.
| Assessment unit (region) | Breeding success
(TV: 0.59, i.e., 59%) |
Brood size
(TV: 1.64 nestlings) |
Productivity
(TV: 0.97 nestlings) |
Overall (One-out-all-out) evaluation |
| Estonia | 0.60 | 1.55 | 0.93 | Sub-GES |
| Finland – Gulf of Bothnia | 0.71 | 1.62 | 1.14 | Sub-GES |
| Finland – Gulf of Finland | 0.79 | 1.69 | 1.34 | GES |
| Finland – Åland | 0.58 | 1.69 | 0.98 | Sub-GES |
| Germany | 0.64 | 1.65 | 1.06 | GES |
| Latvia | 0.73 | 1.74 | 1.28 | GES |
| Lithuania | 0.52 | 1.64 | 0.85 | Sub-GES |
| Poland | 0.42 | 1.65 | 0.69 | Sub-GES |
| Sweden – Baltic Proper | 0.62 | 1.61 | 1.00 | Sub-GES |
| Sweden – Gulf of Bothnia | 0.63 | 1.60 | 1.02 | Sub-GES |
Although a single year of data (2016) was available for Denmark it has not been included in this iteration of the indicator report as no national data was submitted for HOLAS 3 and the 2016 data that was available was part of the HOLAS II process. Furthermore, with only a single year of data available the outcome would likely have ben of low confidence and potentially misrepresent the real status.
4.2 Trends
Productivity
The evaluation of mean annual productivity during 2016-2021 indicates that the threshold value is achieved in all but three of the assessment areas (Figure 8 and Table 4). Note that the full evaluation of the indicator must also consider the brood size and breeding success variables (i.e., in the OOAO summary evaluation, Figure 1). General trends covering the available data periods for each assessment area are shown in Figure 9. It is important to note that no statistical trend analysis has been applied in the current evaluation and that there are significant variations in the length of time series data available for different regions, making clear trends and comparisons difficult.
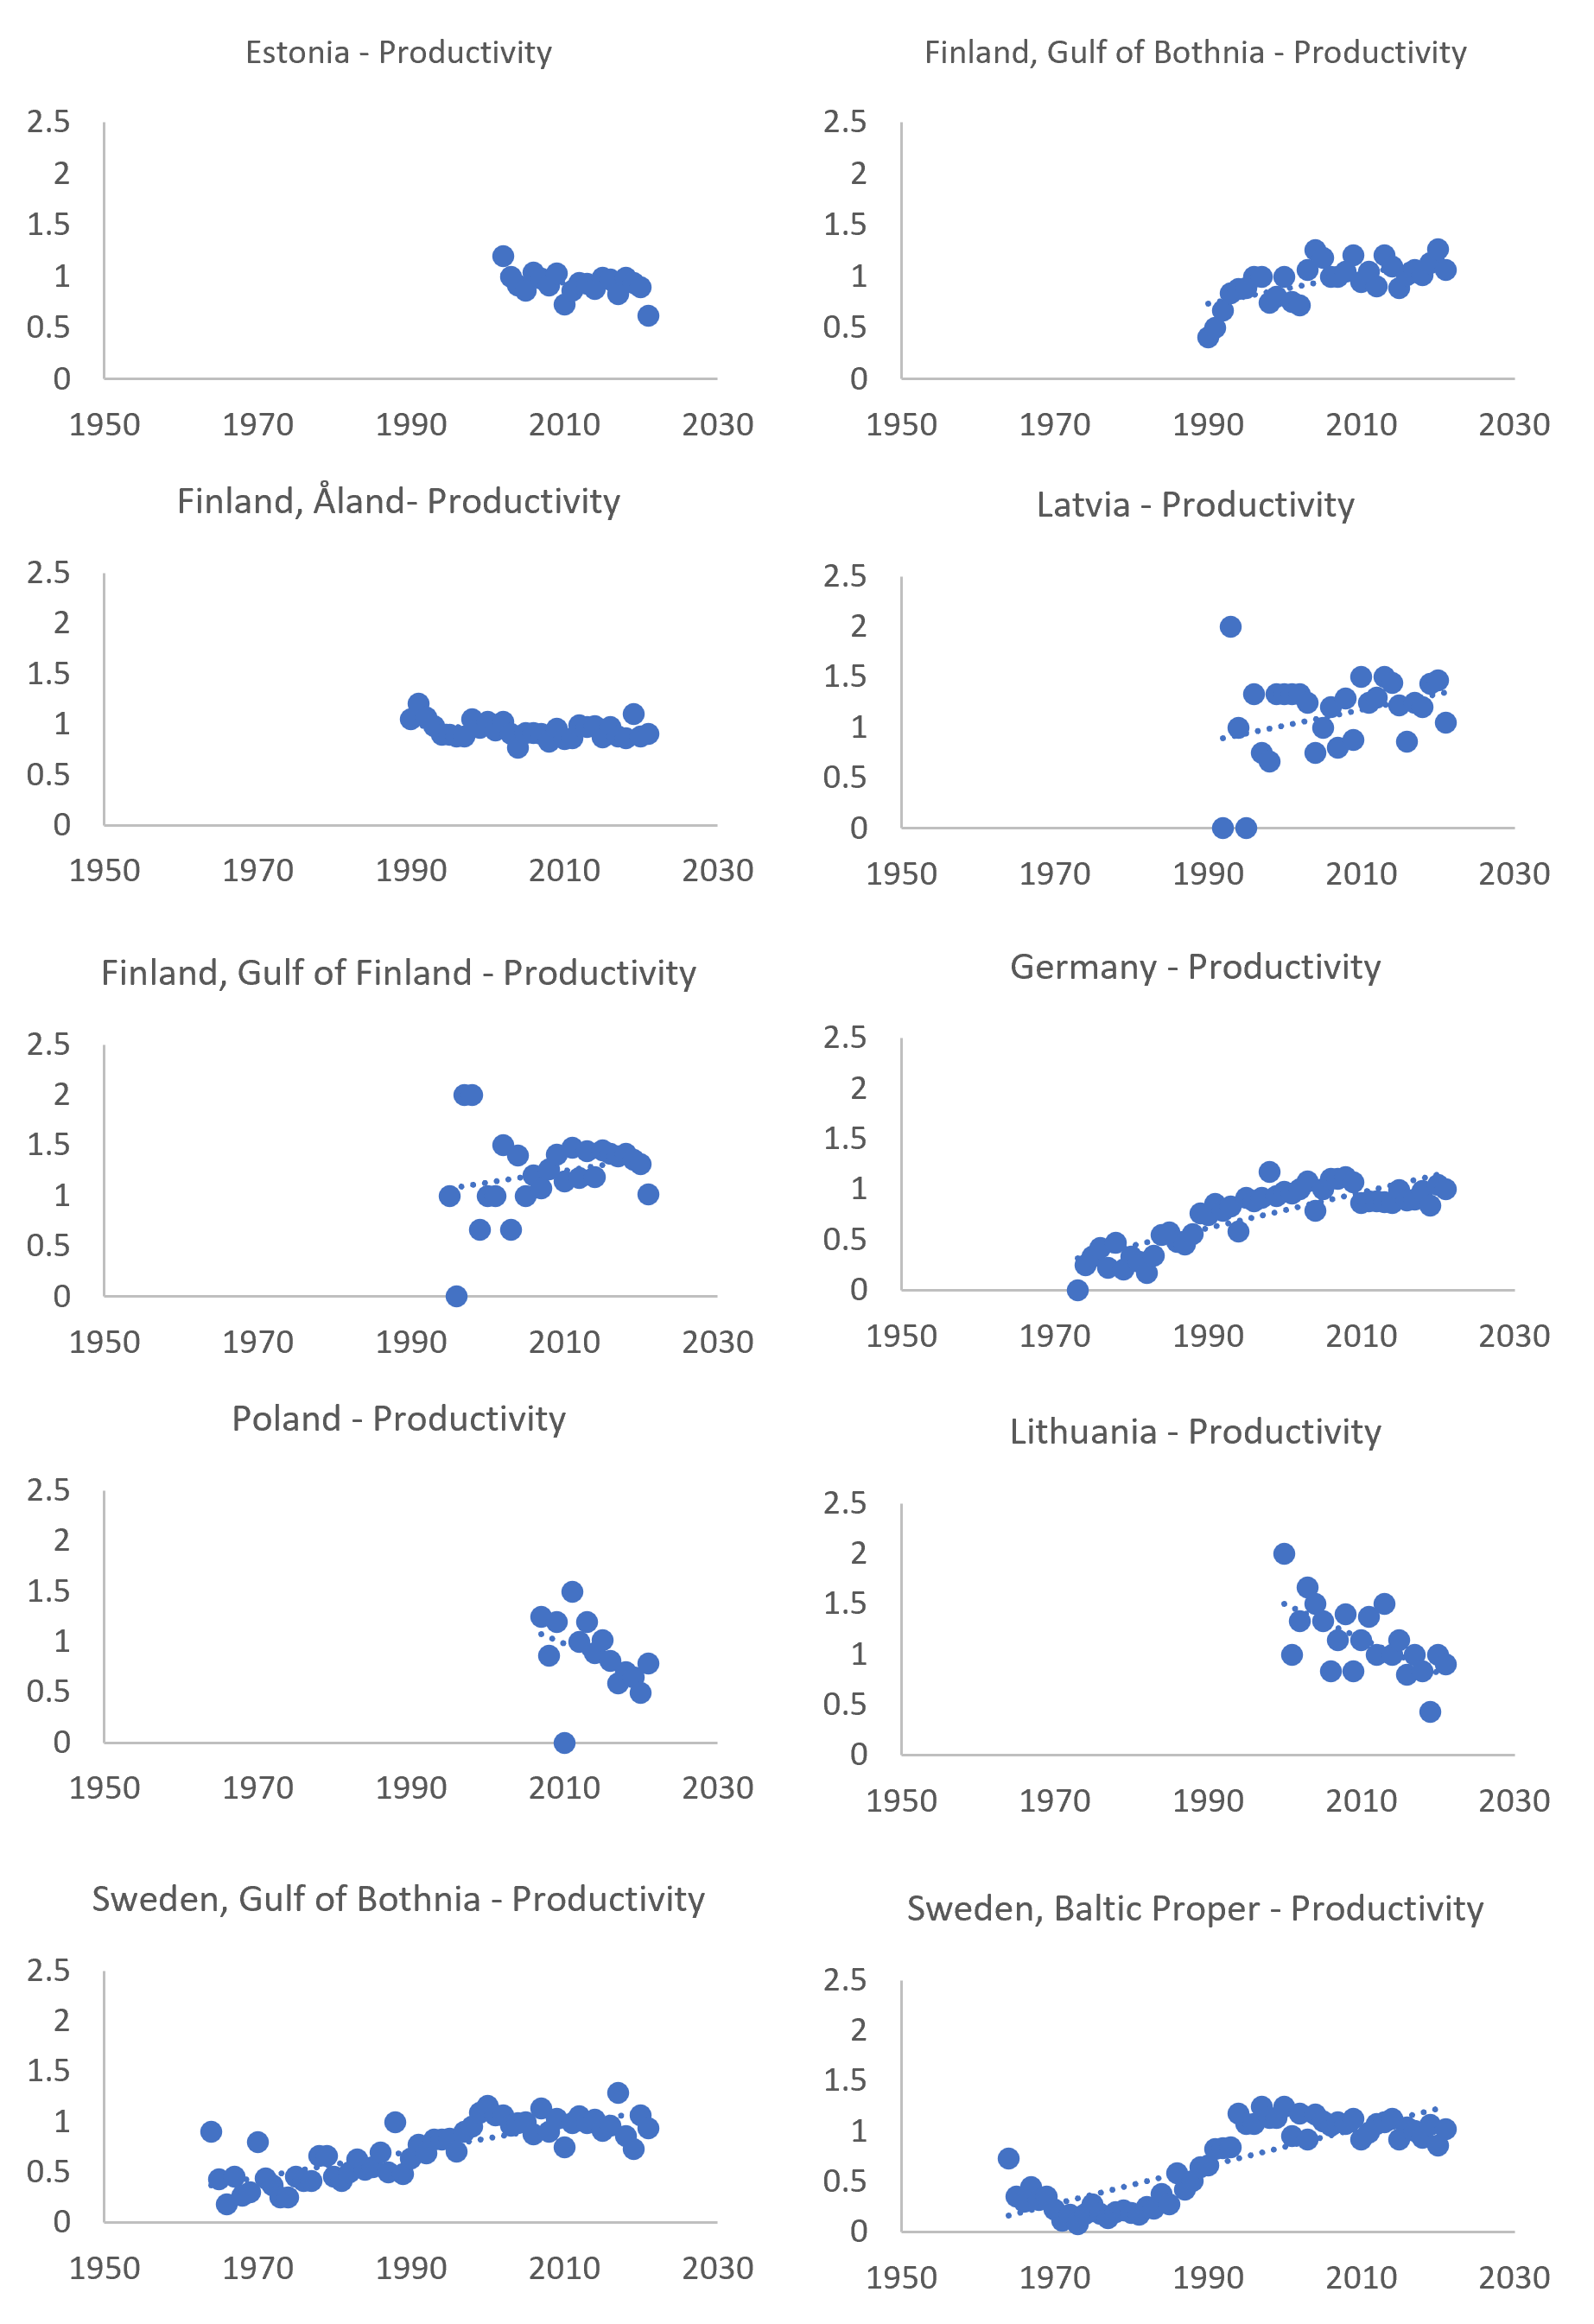
Figure 9. Mean annual productivity (number of nestlings per checked occupied territory) of coastal subpopulations of white-tailed sea eagles around the Baltic Sea. Trend lines (dotted blue lines) are generic linear trends and do not apply any statistical analyses.
The time series since the 1970s (Figure 9), available for some countries, indicates a great increase in productivity since the mid-1980s, and the threshold value was reached or nearly reached mainly during the last 10 years. In several of the studied areas the increase in productivity has stabilized at the lower end of the estimated reference level. See for instance time series for Germany and Sweden. Further work should be considered to explore statistical analyses of these long-term trends, including break points. Studies such as these may provide insights into changes occurring now and may help identify of levelling off (e.g., in Swedish or German areas) or current smaller decreases (e.g., Lithuania, Poland and Estonia) can be connected to other factors such as carrying capacity of the ecosystem being met (e.g., available breading territories or food availability), changes in the food web and thus food availability, or if new hazardous substances (e.g., substances of emerging concern) or re-release of persistent substances may be having an impact.
Nestling brood size
Nestling brood size reached the threshold value in 2016-2021 in six regions, but four regions also failed the threshold value. It is important to note that no statistical trend analysis has been applied in the current evaluation and that there are significant variations in the length of time series data available for different regions, making clear trends and comparisons difficult.
The overall positive long-term trend for regions with the longest data series is obvious, but the times series might also reflect on-going short-term changes. Although difficult to detect if located towards the end of the time series, some regions (Figure 10) show short-term decreases in brood sizes during the evaluation period. This should be taken into consideration, as the failure to achieve threshold values and good status might indicate a downwards change again, after a peak at the turn of the century (see for instance Sweden – Baltic Proper and Finland – Gulf of Bothnia). This development should be followed closely, as alternative explanations do exist. It could for example be explained by hazardous substances or, perhaps more likely, by density-dependent effects. Sea eagle populations might have reached levels where demography and population process are increasingly affected by population density, which might mask effects of hazardous substances. This interplay between ecotoxicology and population ecology should be evaluated further among HELCOM-countries.
However, some results from recent decades likely suggests an impact of hazardous substances! The smaller average nestling brood size on the Swedish coast of the Bothnian Sea during 2000-2009 is due to a significantly higher frequency of nests with young that also contained dead eggs: 7.1% as compared to 2.9% in the Baltic Proper (n = 461 and 932, respectively). This may imply an influence of hazardous substances on the hatching success in the Gulf of Bothnia. This case also indicates that nestling brood size is a more sensitive indicator, specifically for hazardous substances, than productivity.
¨
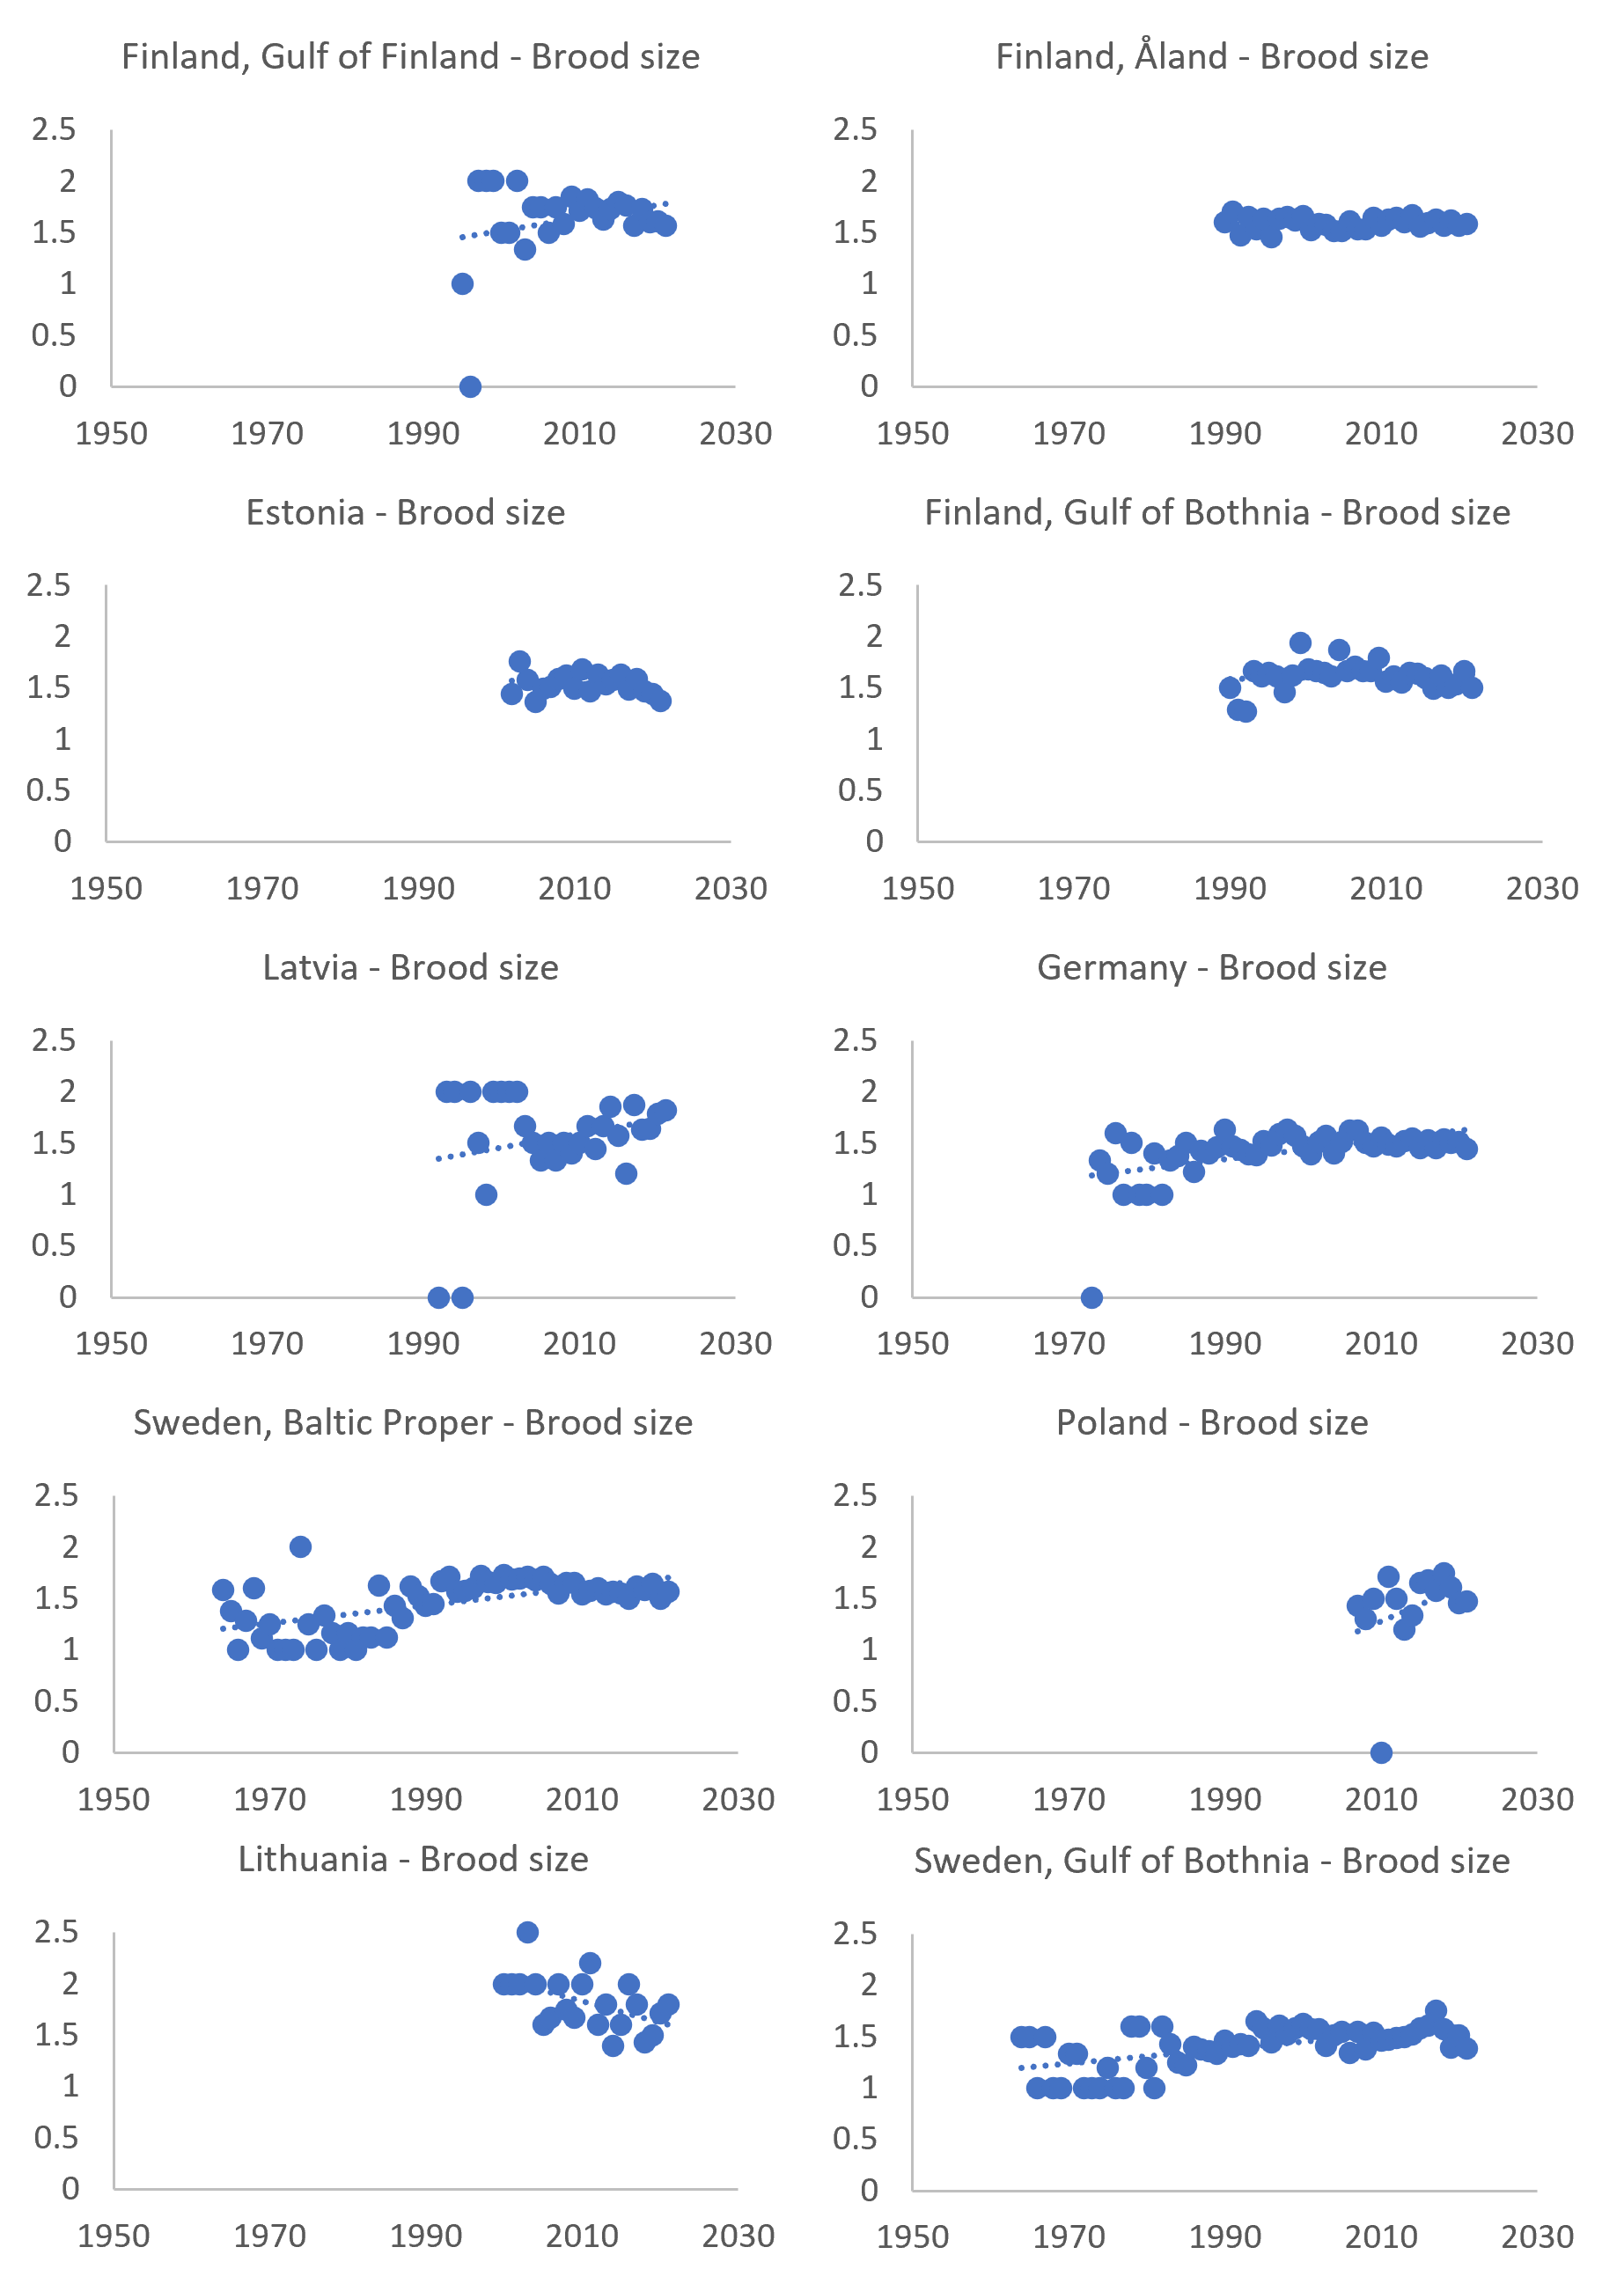
Figure 10. Mean brood size (number of nestlings per successfully breeding pair) of coastal white-tailed sea eagle subpopulations around the Baltic Sea. Trend lines (dotted blue lines) are generic linear trends and do not apply any statistical analyses.
Breeding success
The breeding success of white-tailed sea eagles reached the threshold in six of ten areas along the Baltic Sea during 2016-2021 (Figure 7 and Table 4). Retrospective studies have shown that breeding success along the whole Swedish Baltic Sea coast decreased from an average of 72% in the early 1950s, down to 47% between 1954–1963, and 22% between 1966-1982 (Helander 1985). Breeding success then increased significantly from the early 1980s (Germany, Sweden) and generally reached good status by the mid- to late 1990s. The development in the southern Baltic Sea (Germany) is similar to that in the central parts (Sweden and Finland) (Figure 11). Impacts of intraspecific competition in areas with a high density of breeding pairs in Mecklenburg-Western Pomerania have been discussed as a possible reason for lower breeding success in recent years (Hauff 2009; Heuck & Albrecht 2012; Heuck et al. 2017). In densely populated areas also in Sweden and Finland, fatal territorial fights have been recorded more frequently in recent years. Intraspecific competition in densely populated areas could potentially cause decreases in breeding success, but it should be noted that evidence of decreases in breeding success is not very obvious in the data evaluated here. Rather, it seems that breeding success in general is increasing or stable in most regions. Also note that the reference level is based on data from a more sparse population during the first half of the 20th century, where intra-specific competition likely had a negligible effect. It is important to note that no statistical trend analysis has been applied in the current evaluation and that there are significant variations in the length of time series data available for different regions, making clear trends and comparisons difficult.
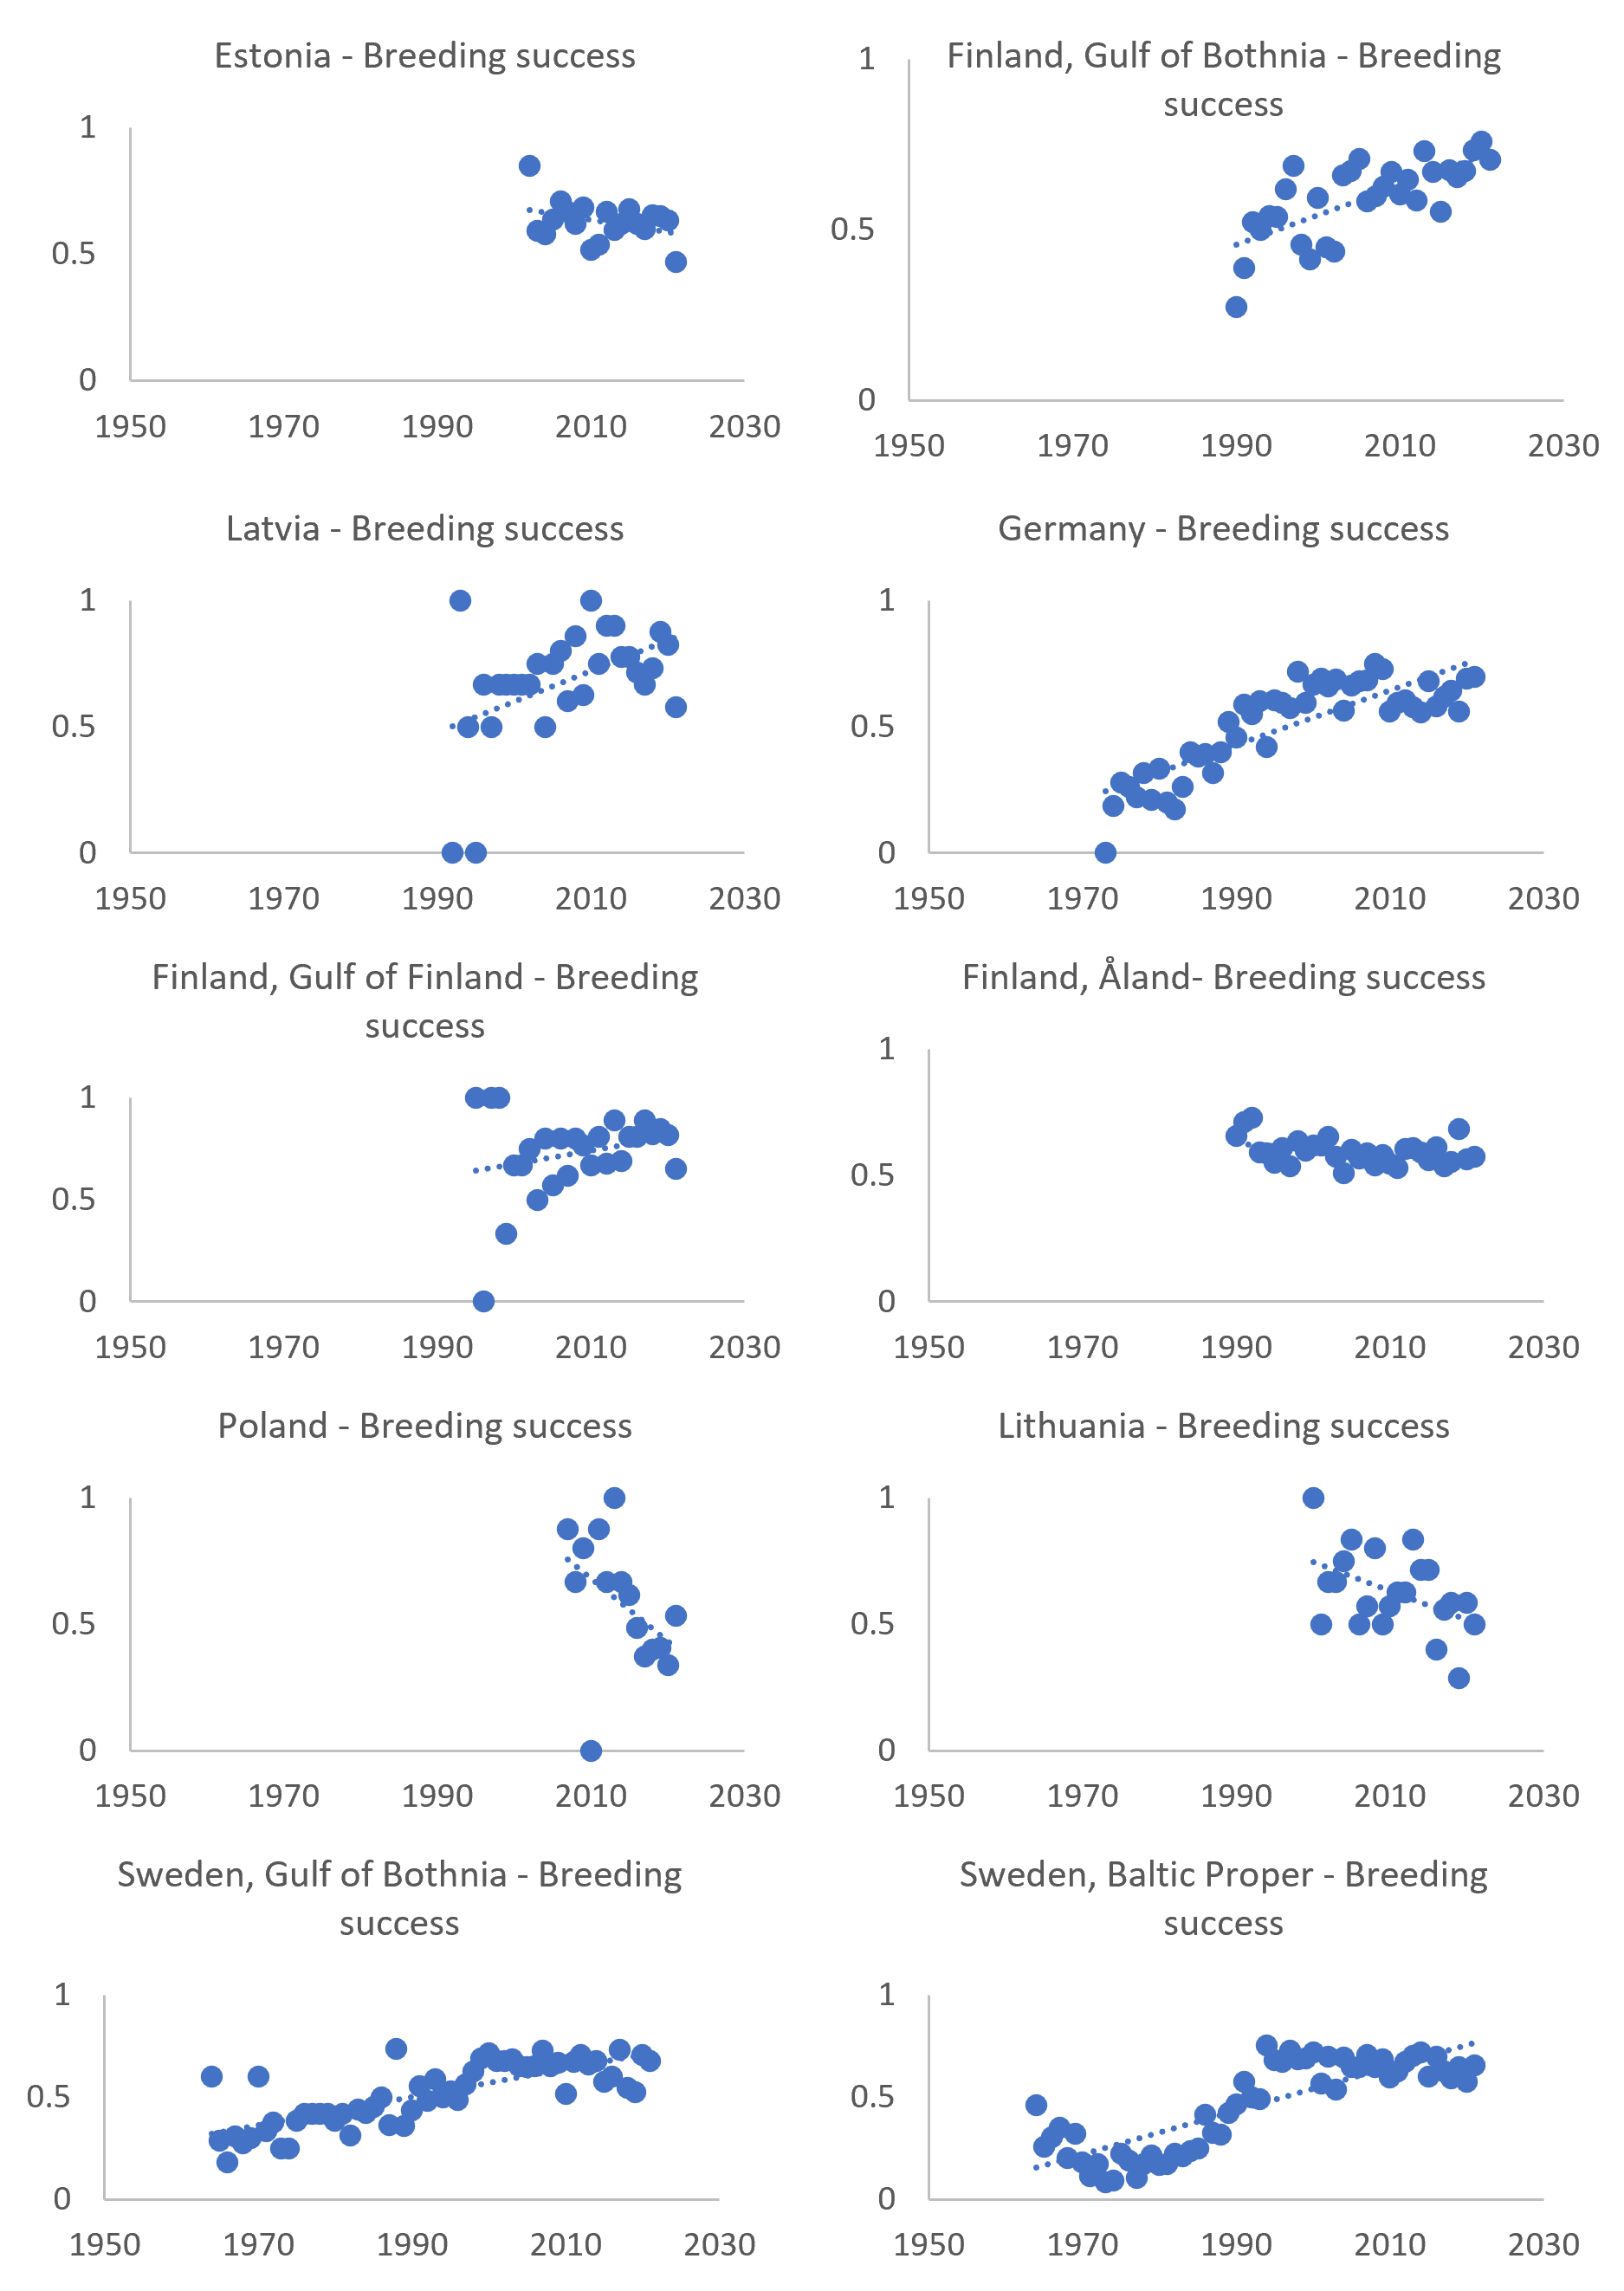
Figure 11. Breeding success in % (proportion of successfully reproducing out of all checked territorial pairs) of coastal white-tailed sea eagle subpopulations around the Baltic Sea. Trend lines (dotted blue lines) are generic linear trends and do not apply any statistical analyses.
Overview and comparison of evaluation and assessment periods
There are a number of changes in status between HOLAS II and HOLAS 3 and in many cases these represent changes that remain close the threshold values applied for the three evaluated parameters (see Table 5 and Table 4). A comparison between the current and previous assessment periods is also provided (Table 5).
Changes in status warrant further investigation to explore if these changes represent small fluctuations close to the threshold values applied or if they represent trends or early effects of serious concern (e.g., lowered breeding success or survival that will impact on future generations of the species).
Table 5. Overview of evaluation outcomes and comparison with previous evaluation.
| HELCOM Assessment unit name (and ID) | Threshold value achieved/failed – HOLAS II | Threshold value achieved/failed – HOLAS 3 | Distinct trend between current and previous evaluation. | Description of outcomes, if pertinent. |
| Estonia | Achieved | Failed | Deterioration in status. Two parameters fall slightly under the threshold values. | Brood size and productivity parameters fail to achieve Good Environmental Status (sub-GES), in general being only slightly under their threshold values. |
| Finland – Gulf of Bothnia | Failed | Failed | No change in status between the two assessment periods. | The failure to achieve the threshold value for brood size drives the sub-GES status. |
| Finland – Gulf of Finland | Achieved | Achieved | No change in status between the two assessment periods. | All parameters achieve their threshold values, thus Good Environmental Status (GES) is achieved. |
| Finland – Åland | Failed | Failed | No change in status between the two assessment periods. | The failure to achieve the threshold value for breading success drives the sub-GES status. |
| Germany | Failed | Achieved | Improvement. Parameters previously just below the threshold value (brood size and productivity) achieve GES in this assessment period. | All parameters achieve their threshold values, thus Good Environmental Status (GES) is achieved. |
| Latvia | Failed | Achieved | Improvement. Parameters previously just below the threshold value (brood size) achieve GES in this assessment period. | All parameters achieve their threshold values, thus Good Environmental Status (GES) is achieved. |
| Lithuania | Achieved | Failed | Deterioration. Breeding success and productivity fall below the threshold value in this assessment period. | The failure to achieve the threshold value for breading success and productivity drives the sub-GES status. |
| Poland | Achieved | Failed | Deterioration. Breeding success and productivity fall below the threshold value in this assessment period. | The failure to achieve the threshold value for breading success and productivity drives the sub-GES status. |
| Sweden – Baltic Proper | Achieved | Failed | Deterioration. Brood size falls below the threshold value in this assessment period. | The failure to achieve the threshold value for brood size drives the sub-GES status. |
| Sweden – Gulf of Bothnia | Failed | Failed | No change in status between the two assessment periods. | The failure to achieve the threshold value for brood size drives the sub-GES status. |
4.3 Discussion text
Using white-tailed sea eagle productivity as a core indicator for assessing status in relation to hazardous substances relies on the experience of the effects of exposure to persistent contaminants on this species over five decades on the Baltic Sea coast. If white-tailed sea eagle reproduction had been monitored in the Baltic Sea earlier during the 20th century, then the negative impact of DDT could have been noticed already in the 1950s. Retrospective studies have shown a significant drop in white-tailed sea eagle breeding success and nestling brood size already in the 1950s, with a further decrease during the 1960s and 1970s (Helander 1985). High concentrations of DDTs and PCBs in white-tailed sea eagle eggs were reported early from Finland (Koivusaari et al. 1980) and Sweden (Helander et al. 1982) and significant relationships were shown between productivity and residue concentrations of DDE and PCB in white-tailed sea eagle eggs (Helander et al. 1982, 1994b, 2002, 2008). While there are clear indications of improvement from pervious lows for this species the threshold value is not achieved in one or more of the parameters evaluated across a number of assessment units, resulting in sub-GES conditions overall in seven of the 10 areas evaluated.
Productivity parameter
The productivity of white-tailed sea eagle in the coastal zone of different parts of the Baltic Sea is an indicator describing not only the effects from biomagnification of contaminants, but also persecution, disturbance of nest sites, food availability and availability of suitable nesting sites. Thus, it describes in reproductive terms the condition of the population and indirectly indicates the potential for increased abundance and distribution. This indicator combines the breeding success and brood size into a single indicator and assesses the reproductive output of the population. It is a useful indicator in studies on relationships between reproduction and human pressures and also a vital parameter in the evaluation of the state of populations from management perspectives.
Brood size and breeding success as supporting parameters
Brood size is a precise parameter following the number of nestlings produced per nest containing young. This is a good indicator for impacts of hazardous substances because as top predators, white-tailed sea eagles accumulate persistent toxins which in turn can cause egg mortality. Breeding success (per cent pairs in the population that produce young) is another indicator for egg mortality, including effects from contaminants and also other anthropogenic disturbance as well as natural factors such as weather, and density dependent breeding failures.
Recent study on wide scope screening of hazardous substances
A recent study demonstrated that white-tailed sea eagles (Haliaeetus albicilla) from Germany are exposed to a wide range of chemicals and that contamination still is widespread. 30 livers of white-tailed sea eagles from northern Germany were analysed for more than 2400 legacy (e.g. POPs of the Stockholm convention) and emerging contaminants (e.g. Pharmaceuticals, Plant protection products, REACH chemicals). In total, 85 chemicals and transformation products from various chemical legislations were detected. Most detected contaminants were medicinal products with oxfendazole (veterinary) and salicylamide (human) being most frequent. Chemicals of the Stockholm Convention such as 4,4′-DDE and PCBs were present in all samples below toxicity thresholds for reproductive impairment in white-tailed sea eagles. Among PFAS, especially PFOS showed compared to other studies elevated concentrations in some individuals (>2000 ng/g wet weight). In contrast, PFCA concentrations were comparability low and increased with preying on piscivorous species (indicated by δ15N). Among the plant protection products, the study frequently detected approved (e.g. spiroxamine) but also expired compounds (e.g. simazine) with increasing concentrations in agricultural landscapes. Especially the combination of legacy POPs and PFAS, is suspected to result in cumulative or synergistic effects in some individuals, which may exceed toxic thresholds and requires further investigation (Badry et al., 2022).
It is therefore recommended that data on the occurrence of emerging contaminants in apex predators should be more commonly considered in risk assessments under the different regulatory frameworks to trigger timely risk management measures before adverse effects in organisms or populations start to manifest.
5 Confidence
The confidence of the indicator status evaluation is considered to be high. Annual data is currently available from nine countries, covering almost the entire Baltic Sea coastal area. White-tailed sea eagle reproduction has been monitored on an annual basis around the Baltic Sea for decades and the available historical data for all three evaluated parameters is considered to increase the overall confidence of the indicator evaluation.
There is no bias in the spatial distribution of the data. The parameters are robust and the comparability of data from different areas is high. Annual sample sizes are big for countries with long stretches of coastline and are adequate for other countries based on averages for 5-10 year periods. The national monitoring is generally focused on the whole population, and subsets of available data is used for HELCOM-purposes.
Sample sizes do however vary in relation to population numbers and size of the assessment units, which also affects confidence of the indicator in statistical terms. There is considerable uncertainty in parameter estimates for some regions (Figure 3, particularly in southeastern Baltic Sea).
6 Drivers, Activities, and Pressures
The productivity of the white-tailed sea eagle is affected by several human pressures that affect the nestling brood size (number of nestlings) and breeding success (success in raising at least one nestling per pair).
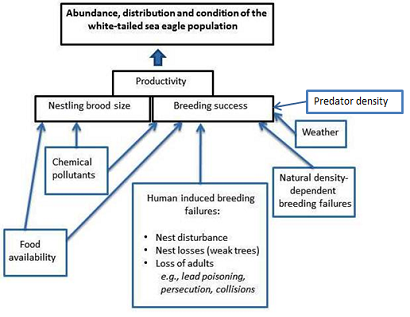
Figure 12. Relationship of white-tailed sea eagle productivity parameters and underlying pressures. “Nest losses (weak trees)” within “Human induced breeding failures” refers to an increasing shortage of suitable nest trees in cultivated forests.
Contaminant burdens
The human pressure that has most clearly affected white-tailed sea eagles after the species was legally protected is the introduction of hazardous substances to the environment. Chemical analyses of the contents of collected dead eggs have provided possibilities to study relationships between the concentrations of contaminants and reproduction. Tissue and egg samples of white-tailed sea eagles have contained among the highest residue concentrations of persistent organochlorine contaminants (e.g. DDTs and PCBs) and heavy metals ever documented in the Baltic Sea area, and worldwide (Henriksson et al. 1966; Jensen 1966; Jensen et al. 1972; Koivusaari et al. 1980; Helander 1994b; Helander et al. 1982, 2002, 2008; Olsson et al. 2000; Nordlöf et al. 2010). Furthermore, studies of individual eagles over time showed that females that were exposed to high concentrations of contaminants during the 1960s and 1970s remained unproductive after residue concentrations in their eggs had declined, indicating persistent effects from previous exposure (Helander et al. 2002).
Trends in productivity and residue concentrations of DDE and PCBs show that residue concentrations of DDE have now generally declined below an estimated critical threshold level for affecting reproduction (Figure 13), but exceptions with very high concentrations have turned up during 2009-2013 among sea eagle eggs from the Gulf of Bothnia.
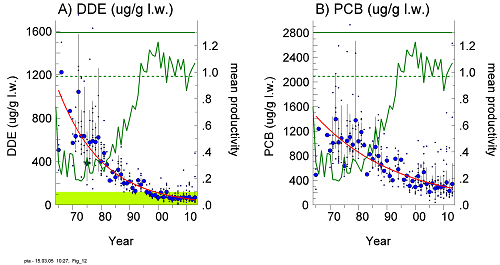
Figure 13. Mean annual productivity (number of nestlings per checked occupied territory) and residue concentrations of DDE and total-PCB (µg/g, lipid weight) in white-tailed sea eagle eggs from the Swedish Baltic coast during 1965-2013. The shaded green area in the left graph indicates a range of concentrations below a previously estimated lowest-observable-effect-level (LOEL) for DDE according to Helander et al. (2002). Large dots = annual geometric means; small dots = individual clutches; vertical lines = 95% confidence limits (for sample sizes > 3). Regression lines for DDE and PCB in the eggs decreased significantly during the study periods (p<0.001). Productivity of the coastal population increased significantly (p<0.001). In a reference freshwater population in Swedish Lapland (not shown here), the concentrations of DDE were below the estimated LOEL and there was no statistically significant change in productivity over the study period.
Since predatory birds are highly exposed to persistent chemicals they are useful for detecting the presence of ‘new’ pollutants that are potentially harmful, as illustrated by the discovery of PCBs in 1966 in a Baltic white-tailed sea eagle (Jensen 1966) and the discovery of the flame retardant congener PBD-209 in peregrine falcon eggs in 2004 (Lindberg et al. 2004). Residue concentrations of brominated flame retardants have been investigated in eagle egg samples from Sweden, (Nordlöf et al. 2010) and concentrations in the Baltic samples were three and six times higher than those from inland samples from southern Sweden and Lapland, respectively. Lethal poisoning connected with consumption of lead ammunition has also been observed to be an important cause of death in white-tailed sea eagle populations (Krone et al 2006).
Other factors
The massive development of wind power parks can lead to a significant increase in mortality among white-tailed sea eagles and can be seen as a reduction in breeding success and productivity (Dahl et al. 2012), but not in nestling brood size. Weather conditions can affect breeding success and productivity, and it will be interesting to follow the possible effects due to climate change.
In theory, also food shortages affect brood size and breeding success, but this has so far not been observed in the Baltic Sea population, where there has been, so far, plenty of food. Body mass can be indicative of food stress and health and such data can usually be easily obtained when assessing reproductive output in the nests and handling nestlings.
Table 6. Brief summary of relevant pressures and activities with relevance to the indicator.
| | General | MSFD Annex III, Table 2a |
| Strong link | The most important human threat to white-tailed sea eagles in modern times has been effects of toxins affecting population health (reproduction). | Contamination by hazardous substances
|
| Weak link | Enhanced mortality from collisions (trains, wind farms etc.).
Enhanced mortality from secondary poisoning by lead ammunition. Vulnerable to direct persecution (now illegal). Habitat loss and prey depletion are potentially serious future threats. |
7 Climate change and other factors
Climate change in the Baltic Sea region is expected to have significant impacts on key processes in the marine environment (HELCOM and Baltic Earth 2021). While there are relatively few studies that fully explore the impacts of such changes on hazardous substances direct parameters such as changes in water temperature, atmospheric deposition, precipitation, river run off and sediment transportation could all alter the flow of contaminants to and within the marine environment. In addition, alterations in metabolic aspects as well as food web structure and function may also alter the transfer of contaminants within the ecosystem and food web and thus alter the levels of bioaccumulation (as well as possible effects). For the white-tailed sea eagle such changes are likely to be significant.
Disturbance and re-dispersal of legacy contaminants that have been shown to impact directly on population level viability of white-tailed sea eagles could result in distinct negative effects. This may occur directly or indirectly, for example if substances are increasingly bioavailable and accumulate or are transferred through vital prey on which the species feeds. Such factors are also relevant for new and emerging substances as climate change may influence their transport and partitioning in the marine ecosystem as well.
Climate change can also be expected to also have relevant impacts on this species that supersede the issue of hazardous substances alone. Changes in the usage of coastal areas may be one issue, for example an increase in wind energy production to mitigate the causes of climate change, but other factors such as changes in marine food webs will likely influence the abundance and quality of key prey items.
8 Conclusions
Good environmental status (GES) is only achieved in three of 10 assessment areas evaluated in this assessment period. In general the parameters brood size and breading success more strongly drive the sub-GES conditions (each being failed in four areas), though the productivity parameter itself is also failed in three assessment areas. As a general rule, when failed the result values are not greatly distant form the threshold values and it is common that only one or two of the three evaluated parameters fails to achieve the applied threshold values. In one assessment area all parameters fail to achieve there threshold values, but the failure of a single parameter results in an overall sub-GES condition for the assessment area.
There is a need for future work to evaluate the significance of the changes in status and trends detected in this evaluation. Understanding if the changes observed fall within the boundaries of normal variation around the threshold values applies, or if they represent significant deteriorations or early warning signs (e.g., of the impact of new contaminants), or may be assigned to populations achieving carrying capacity are critical for management. This understanding is increasingly important in the light of climate change. Another issues that may need to be considered, and may be for example more pertinent in southerly sub-regions, is the occurrence of bird flu as there have been recorded occurrences of dead adults and nestlings in Estonia with bird flu. These factors are important to address in future work to support a strong understanding and appropriate management.
8.1 Future work or improvements needed
During spring (February – April, incubation period) eagle territories are checked from a safe distance (to avoid disturbance) in order to locate occupied nests. Occupied nests are to be revisited during the nestling period (May – June) for the evaluation of breeding success and nestling brood size. It is crucial for the evaluation of breeding success and productivity that unsuccessful as well as successful breeding attempts are recorded equally well. Most breeding failures occur during the early phases of the breeding cycle. The early spring surveys are therefore very important as later during the breeding season there is an increasing risk that unsuccessful breeding attempts are overlooked. A very effective way to perform the early survey in spring is by helicopter. The importance of conducting a first check during the incubation period, to be followed by a second check during the nestling period, has been stressed previously by Postupalsky (1974; 1981; 1983), Steenhof (1987) and Steenhof & Newton (2007). For the evaluation of nestling brood size, it is crucial that the nest content is checked properly by climbing to the nest (or a neighbouring tree) in order to be able to look into the nest. Nests checked only from the ground are not used for evaluation of nestling brood size. The number of nestlings in successful nests observed only from the ground is estimated by applying a correction factor before being used for calculation of productivity. For the future, Unmanned Airborne Systems (UAS) may provide good opportunities for the checking of unclimbed nest to assess actual nestling brood size. Such developments will further strengthen the indicator evaluation.
Further work should also be considered to explore statistical analyses of long-term trends, including to explore break points and changes in more recent years since the occurrence of the major recovery of this species. Studies such as these may provide insights into changes occurring now and may help identify if the levelling off (e.g., in Swedish or German areas) or current smaller decreases (e.g., Lithuania, Poland and Estonia) can be connected to other factors such as carrying capacity of the ecosystem being met (e.g., available breading territories or food availability), changes in the food web and thus food availability, or if new hazardous substances (e.g., substances of emerging concern) or re-release of persistent substances may be having an impact.
A review of the population size and distribution (e.g., to update Table 7) would be a valuable process towards future evaluations and a stronger understanding of the potential impacts of bird flu would is also needed.
Improvements should also be applied to develop a more regular and better defined data flow for the indicator as well as exploring opportunities to discuss the inclusion of this indicator in other relevant HELCOM work (e.g., current work exploring the development of Biological Effects tools).
9 Methodology
9.1 Scale of assessment
White-tailed sea eagles are presently breeding in coastal areas of the whole Baltic Sea. In this evaluation the HELCOM assessment unit scale 3 ‘Open sub-basin and coastal waters’ has been applied with modifications (see Fgure 1 + Appendix 1 for explanations). The assessment units are defined in the HELCOM Monitoring and Assessment Strategy Annex 4.
Where a sub-population within a coastal strip of a marine assessment unit is too small from a statistical point of view, data from coastal strips of adjacent units can be combined. However, since the assessment of status is based on data from a period of at least five years, it will yield a reasonable sample size even for small sub-populations. For example, the sub-population on coastal strip # 15 (Russian part of the Gulf of Finland) has been reported to be only 6 pairs. Over a five year period this would yield a potential sample size of 30, provided that data from all pairs can be collected in all years. This is not the case so far, and the currently available samples are useful only for calculations of mean nestling brood size (Figure 1).
Besides breeding in coastal areas, white-tailed sea eagles also breed inland within all Baltic Sea coastal countries. The boundaries for coastal areas where this indicator applies are set in accordance with Article 1 of the Helsinki Convention (Convention Area) to include landward internal waters (lagoons and estuaries). The inner landward boundary is set in accordance with the Guidelines for the identification of coastal ecosystems proposed by EC Nature (EC Nat 2-5, 1993) and approved by EC 4, stating under point 1.2: ‘For practical reasons in cases where the extension of coastal ecosystems is difficult to define according to a) – c), a strip in a width of at most 10 kilometres inland from the coastal mean water line is taken for a working area of Art. 15.
9.2 Methodology applied
For the evaluation of status, a mean value based on data from a recent five to 10 year period for each of the three parameters is evaluated against its threshold value (and when appropriate, tested with the chi-square or equivalent method). Generalized Additive Models are used to investigate average changes over time (R-code available for all analyses and graphs presented in this report is available from Peter Hellström, Swedish Museum of Natural History). To check for significant nonlinear trend components, a GAM-smoother is applied (e.g. Wood 2017). Statistical power analysis is used to estimate the minimum annual trend likely to be detected at a statistical power of 80% during a monitoring period of 10 years.
Methodology of data analyses
In the following three paragraphs, n1 denotes the number of nests containing 1 young (etcetera).
Productivity
The mean number of nestlings, of at least three weeks of age, out of all occupied nests:

For nests with young that were observed only from the ground, the numbers of nestlings is underestimated since sometimes not all nestlings are visible. A correction is necessary before the total number of nestlings from such observations can be incorporated with the total number of nestlings from climbed nests, to make up the total number of nestlings for the productivity evaluation. A correction is calculated based on the mean number of nestlings in climbed nests divided by the mean number of nestlings observed from the ground, or by applying the mean nestling brood size in climbed nests to all successful nests that were observed only from the ground.
Brood size
The mean number of nestlings, of at least three weeks of age, in nests containing young:

For the calculations of mean brood size only data obtained from nests that have been climbed are included. Even big nestlings that are lying down in the nest are easily overlooked when observations are made from the ground. Data received from observations made from the ground in Germany underestimated the real number of nestlings by 11% (Hauff & Wölfel 2002), using an extended data set (updated until 2014) the difference was 14% (Herrmann, unpublished). For all data used in the State of the Baltic Sea (2017/2018)-evaluation pooled across regions, there was a 10%-difference between ground observations and climbed nests. For some regions the differences were quite large, e.g. up to 50% for instance in Sweden. There was a trend that suggests that the difference is larger in regions with a higher fraction of climbed nests and also with denser populations. In dense populations, less time and fewer visits can be invested to correctly assign brood size. Under such circumstances, brood sizes have in many cases been counted as “at least one nestling” for nests where no nestlings where observed visually during the time of visit, but rather inferred from begging calls, white-wash, droppings, pellets, prey remains etc. In the future it is highly recommended that such observations are identified as brood size “larger than zero, but unknown” rather than lump such observations with brood sizes of 1. This procedure has been suggested by Estonia, and should be preferably be used in the future.
Breeding success
The proportion of nests containing at least one nestling, of at least three weeks of age, out of all occupied nests:

9.3 Monitoring and reporting requirements
Monitoring methodology
The HELCOM common monitoring relevant on white-tailed sea eagles is described on a general level in the HELCOM Monitoring Manual in the sub-programme: Marine bird health.
In addition to the annual monitoring described in the Monitoring Manual, data are collected from eagles found dead in nature. Such specimens belong to the state in all countries around the Baltic Sea, except for in Germany. This provides good opportunities for investigations of the cause of death. State game is normally sent to the national authority for registration and examination of death cause, saving of samples and preparation for museum collections. Professional investigations of causes of death in white-tailed sea eagles are performed in Finland, Germany and Sweden (and possibly elsewhere). Before being opened, all white-tailed sea eagles are inspected macroscopically for body condition and signs of trauma, and x-rayed to assess the presence of lead shot, fractures etc. Distributions of cause of death of sea eagles from Germany, Finland and Sweden are presented in Herrmann et al. (2011). In Finland, Germany and Sweden, organ samples are archived from all reasonably fresh specimens.
Current monitoring
The monitoring activities relevant to the indicator that are currently carried out by HELCOM Contracting Parties are described in the HELCOM Monitoring Manual in the Monitoring Concepts table.
Sub-programme: Marine bird health
Current monitoring, which is carried out by the HELCOM Contracting Parties on an annual basis, is considered adequate.
At present, eagles are breeding along the coasts of almost the whole of the Baltic Sea, as well as in inland freshwater systems within the Baltic Sea catchment area. Populations and reproduction are monitored in a network of national projects that use the same methodology (Helander 1990). Monitoring of white-tailed sea eagle reproduction in Sweden has been included in the National Environment Monitoring Programme since 1989 as an indicator of the effects from chemical pollutants. Pre-1954 background data on breeding success and pre-1950 background data on nestling brood size are available from the Swedish Baltic coastline (Helander 1994a, 2003a). These data are used as reference levels for evaluation of observations within the programme (see below). The current estimates of territorial pairs in the HELCOM coastal area are given below (Table 7), though it should be noted that this information needs to be updated in the future as estimates are from pre-2015. The coastal area is restricted to the 10 km from the coastal zone, with the majority of eagles breeding close to the coastline and in the archipelagos.
White-tailed sea eagles breeding inland in freshwater habitats are usually monitored in the same way as the coastal populations. Freshwater populations are much less exposed to contaminants and observed differences in data can be used to compare exposure to different pressures faced by inland and coastal eagles (Helander et al. 2002).
Table 7. Estimated number of breeding white-tailed sea eagle pairs in the monitoring region. Note: this table has not been updated in recent years and is an aspect that should be considered under future work. Some numbers presented here are now outdated, as, for example, sea eagle populations may have increased.
| Contracting Party | Sub-area if relevant | Estimated number of breeding white-tailed sea eagle pairs within the 10km coastal strip | Estimated number of pairs breeding and feeding inland/freshwater, given for reference |
| Denmark | >30 pairs | c.15 pairs | |
| Estonia | >100 pairs | 35 pairs | |
| Finland | Gulf of Bothnia (Quark) | >100 pairs | c. 50 pairs |
| Åland & Åboland | >250 pairs | ||
| Gulf of Finland | 30 pairs | ||
| Germany | Mecklenburg-Pomerania | >110 pairs | c. 200 pairs |
| Schleswig-Holstein | >20 pairs | c. 50 pairs | |
| Latvia | 10 pairs | c. 40 pairs | |
| Lithuania | 9 pairs | c. 50 pairs | |
| Poland | 106 pairs | >500 pairs | |
| Russia | 6 pairs | Not known but believed to be large | |
| Sweden | Gulf of Bothnia | >120 pairs | >75 pairs |
| Baltic Proper | >200 pairs | >150 pairs |
10 Data
The data and resulting data products (e.g. tables, figures and maps) available on the indicator web page can be used freely given that it is used appropriately and the source is cited.
Result: White-tailed sea eagle productivity
Spatial coverage includes the whole HELCOM Convention area although there are large differences in the size of national eagle populations (Table 7).
The new reporting format discriminates between controls of climbed nests and nests that have been observed only from ground level, in order to allow for calculations of a correction factor based on the data for each national population/sub-area. The correction factor relates to nestling brood size for nests that has been checked only from ground level and is needed for correct estimates of productivity for such nests (see also Description of optimal monitoring).
10.1 Strengths and weaknesses of data
Minimum detectable yearly trend (%) for a 10-year monitoring period, at a statistical power of 80%, has been estimated for Swedish data for different sample sizes, based on random sampling from data collected during 1991–2006 (Helander et al. 2008). Minimum detectable trends based on the raw dataset between 1991–2006 (with a varying annual number of observations) was 1.3% for brood size (Baltic Proper), 2.0% for breeding success (Gulf of Bothnia) and 3.0% for productivity (Gulf of Bothnia). The national survey methods are very similar but population size and thus sample sizes vary between the Contracting Parties.
Data source
In most countries the monitoring and handling of data is carried out on a voluntary basis, often in national projects with devoted members. National data have been submitted from the contracting parties to the Swedish Museum of Natural History for storage and compilation of results in uniform format. The following are examples of national monitoring performance and data handling:
Denmark: Monitoring and data storage is carried out on a voluntary basis within the national project “Örn” under the Danish Ornithological Society.
Estonia: Estonia: Monitoring is coordinated and data storage is carried out by the Estonian Environment Agency. Surveys of breeding populations and reproduction is carried out on a voluntary basis by the national “Eagle Club”, who submit the information as an annual report to the Environment Agency. Dead birds are stored and analysed by Estonian University of Life Sciences.
Finland: Surveys of breeding populations and reproduction, ringing of nestlings and sampling are carried out by voluntary members of WWF Finland’s White-tailed Sea Eagle working group. Data are stored in a competent database. Specimens found dead, DNA-samples from nestlings as well as addled eggs are stored in the Finnish Museum of Natural History, University of Helsinki.
Germany: In Western Pomerania, data are collected by voluntary ornithologists, coordinated by the “Project group for large bird species” under the auspices of the Agency for Environment, Nature Conservation and Geology. The country-wide white-tailed sea eagle data are compiled by Peter Hauff, who submits the annual reports to the mentioned governmental agency.
Poland: Monitoring in Poland is carried out by the Committee for the Protection of Eagles as part of the Monitoring of the Birds of Poland in the State Environmental Monitoring. Monitoring of the Birds of Poland is carried out by a consortium of the Polish Society for the Protection of Birds OTOP BirdLife Poland and the Museum and Institute of Zoology of the Polish Academy of Sciences. The research is commissioned by the government agency Chief Inspectorate for Environmental Protection.
Sweden: Surveys of breeding populations and reproduction with sampling, sample preparation, storage in specimen bank, and evaluation and storage of data are carried out by the Department of Environmental Research and Monitoring at the Swedish Museum of Natural History, Stockholm, and are commissioned by the national EPA. Surveys of breeding populations and reproduction of reference freshwater populations have thus far been carried out by the Swedish Society for Nature Conservation (“Project Sea Eagle”). Chemical analysis is carried out at the Institute of Applied Environmental Research at Stockholm University.
11 Contributors
Peter Hellström, Christof Herrmann, Toni Laaksonen
HELCOM Secretariat: Theodor Hüttel, Owen Rowe
12 Archive
This version of the HELCOM core indicator report was published in April 2023:
The current version of this indicator (including as a PDF) can be found on the HELCOM indicator web page.
Earlier versions of the core indicator report are available:
White-tailed eagle productivity HELCOM core indicator 2018 (pdf)
Core indicator report – web-based version January 2016 (pdf)
Extended core indicator report – outcome of CORESET II project (pdf)
White-tail sea eagle productivity 2013 Biodiversity indicator (pdf)
13 References
Badry, A., Treu, G., Gkotsis, G., Nika, M.-C., Alygizakis, N., Thomaidis, N. S., Voigt, C. C., Krone, O. (2022): Ecological and spatial variations of legacy and emerging contaminants in white-tailed sea eagles from Germany: Implications for prioritisation and future risk management. Environment International 158: 106934
Dahl, E.L., Bevanger, K., Nygård, T., Röskaft, E., Stokke, B.G. (2012) Reduced breeding success in white-tailed sea eagles at Smöla windfarm, western Norway, is caused by mortality and displacement. Biol. Conserv. 145: 79-85.
European Commission (2008) Directive 2008/56/EC of the European Parliament and of the Council of 17 June 2008 establishing a framework for community action in the field of marine environmental policy. Official Journal of the European Union L164, 19–40.
European Commission (2010) Commission decision of 1 September 2010 on criteria and methodological standards on good environmental status of marine waters (2010/477/EU). Official Journal of the European Union L 232/14, 2.9.2010.
Hauff, P. (2009) Zur Geschichte des Seeadlers Haliaeetus albicilla in Deutschland. (In German). Denisia 27: 7-18.
Hauff, P., Wölfel, L. (2002) Seeadler (Haliaeetus albicilla) in Mecklenburg-Vorpommern im 20. Jahrhundert. Corax Special Issue 1: 15-22.
Helander, B. (1983) Reproduction of the white-tailed sea eagle Haliaeetus albicilla in Sweden in relation to food and residue levels of organochlorine and mercury compounds in the eggs. Doctoral dissertation. Department of Zoology, Stockholm University. Gotab, Stockholm. 192 pp.
Helander, B. (1985) Reproduction of the white-tailed sea eagle Haliaeetus albicilla in Sweden. Holarct. Ecol. 8(3): 211-227.
Helander, B. (1990) Sea Eagle Workshop. In: Viksne, J. (ed.). Baltic Birds 5 (1). Zinatne Publ., Riga. pp. 128-135.
Helander, B. (1994a) Pre-1954 breeding success and productivity of white-tailed sea eagles Haliaeetus albicilla in Sweden. In: Meyburg, B.-U. & Chancellor, R.D. (eds). Raptor Conservation Today. WWGBP/The Pica Press. pp. 731–733.
Helander, B. (1994b) Productivity in relation to residue levels of DDE in the eggs of white-tailed sea eagles Haliaeetus albicilla in Sweden. In: Meyburg, B.-U. & Chancellor, R.D. (eds.). Raptor Conservation Today. WWGBP/The Pica Press. pp. 735-738.
Helander, B. (2003a) The white-tailed Sea Eagle in Sweden—reproduction, numbers and trends. In: Helander, B., Marquiss, M. and Bowerman, B. (eds). SEA EAGLE 2000. Åtta.45 Tryckeri AB, Stockholm. pp. 57–66.
Helander, B., Bignert, A., Asplund, L. (2008) Using Raptors as Environmental Sentinels: Monitoring the White-tailed Sea Eagle (Haliaeetus albicilla) in Sweden. Ambio 37(6): 425-431.
Helander, B., Olsson, A., Bignert, A., Asplund, L., Litzén, K. (2002) The role of DDE, PCB, coplanar PCB and eggshell parameters for reproduction in the white-tailed sea eagle (Haliaeetus albicilla) in Sweden. Ambio 31(5): 386-403.
Helander, B., Olsson, M., Reutergårdh, L (1982) Residue levels of organochlorine and mercury compounds in unhatched eggs and the relationships to breeding success in white-tailed sea eagles Haliaeetus albicilla in Sweden. Holarct. Ecol. 5(4): 349-366.
HELCOM and Baltic Earth (2021) Climate Change in the Baltic Sea 2021 Fact Sheet. https://helcom.fi/wp-content/uploads/2021/09/Baltic-Sea-Climate-Change-Fact-Sheet-2021.pdf
Henriksson, K., Karppanen, E., Helminen, M. (1966) High residue levels of mercury i Finnish white-tailed sea eagles. Orn. Fenn. 43: 38-45.
Herrmann, C., Krone, O., Stjernberg, T., Helander, B. (2011) Population Development of Baltic Bird Species: White-tailed Sea Eagle (Haliaeetus albicilla). HELCOM Baltic Sea Environment Fact Sheets 2011.
Heuck, C., Albrecht, J. (2012) Dichteabhängigkeit des Reproduktionserfolges der Seeadler in Mecklenburg Vorpommern. (In German). Report to the Landesamt für Umwelt, Naturschutz und Geologie MV. Stand 28.11.2012.
Heuck, C., Herrmann, C., Schabo, D.G., Brandl, R., Albrecht, J. 2017. Density-dependent effects on reproductive performance in a recovering population of White-tailed Eagles Haliaeetus albicilla. Ibis 159:297-310.
HVMFS (2012) HVMFS2012:18. Havs- och vattenmyndighetens författningssamling. Verkningar av farliga ämnen: 8.2A, 8.2B. (In Swedish).
Jensen, S. (1966) Report on a new chemical hazard. New Scient. 32: 612.
Jensen, S., Johnels, A.G., Olsson, M., Westermark, T. (1972) The avifauna of Sweden as indicators of environmental contamination with mercury and organochlorine hydrocarbons. Proc. Int. Orn. Congr. 15: 455-465.
Koivusaari, J., Nuuja, I., Palokangas, R., Finnlund, M. (1980) Relationships between productivity, eggshell thickness and pollutant contents of addled eggs in the population of white-tailed sea eagles Haliaeetus albicilla L. in Finland during 1969–1978. Environ. Pollut. (Ser. A) 23: 41-52.
Krone O., T. Stjernberg, N. Kenntner, F. Tataruch, J. Koivusaari & I. Nuuja (2006): Mortality, helminth burden and contaminant residues in White-tailed Sea Eagles from Finland. Ambio 35: 98-104.
Lindberg, P., Sellström, U., Häggberg, L., De Wit, C.A. (2004) Higher brominated diphenyl ethers and hexabromocyclododecane found in eggs of peregrine falcons (Falco peregrinus) breeding in Sweden. Environ. Sci. Technol. 38: 93-96.
Nordlöf, U., Helander, B., Bignert, A., Asplund, L. (2010) Levels of brominated flame retardants and methoxylated polybrominated diphenyl ethers in eggs of white-tailed sea eagles breeding in different regions of Sweden. Science of the Total Environment 409: 238-246. doi:10.1016/j.scitotenv.2010.09.042.
Olsson, A., Ceder, K., Bergman, Å., Helander, B. (2000) Nestling blood of the White-tailed Sea Eagle (Haliaeetus albicilla) as an indicator of territorial exposure to organohalogen compounds – an evaluation. Environ. Sci. Technol. 34: 2733-2740.
Postupalsky, S. (1974) Raptor reproductive success: some problems with methods, criteria, and terminology. Raptor Research Report No. 2: 21-31.
Postupalsky, S. (1981) Censusing nesting populations and measuring reproductive success. In: Ingram, T.N. (ed): Bald eagle Management. Eagle Valley Environmentalists: 151-158.
Postupalsky, S. (1983) Techniques and terminology for surveys of nesting bald eagles. In: Grier, J.W., Gramlich, F.J., Green, N.F., Kussman, J.V., Mathisen, J.E., J.P. M (eds): Northern States bald eagle recovery plan. U.S. Fish & Wildlife Service, Denver, CO, Appendix D, pp 1-6.
Steenhof, K. (1987) Assessing raptor reproductive success and productivity. In: Millsap, B.A. & Kline, K.W. (eds.) Raptor management techniques manual. Natl. Wildl. Fed. 1:157-170. Washington D.C.
Steenhof, K., Newton, I. (2007) Assessing nesting success and productivity. In: Bird, D.M. & Bildstein, K.L. (eds.). Raptor research and management techniques. Hancock House Publ. pp.181-191.
Stjernberg, T., Koivusaari, J., Högmander, J. (2003) Population trends and breeding success of the White-tailed Sea Eagle in Finland, 1970–2000. In: Helander, B., Marquiss, M. and Bowerman, B. (eds). SEA EAGLE 2000. Åtta.45 Tryckeri AB, Stockholm. pp. 103–112.
Wood, S.N. 2017. Generalized Additive Models. An Introduction with R. CRC Press, Boca Raton, FL. Second Edition.
14 Other relevant resources
Faxneld, S., Helander, B., Bäcklin, B.-M., Moraeus, C., Roos, A., Berger, U., Egebäck, A.-L., Strid, A., Kierkegaard, A., Bignert, A. (2014) Biological effects and environmental contaminants in herring and Baltic Sea top predators. Swedish Museum of Natural History, Rapport nr 6: 2014.
Helander, B. (1981) Nestling measurements and weights from two white-tailed sea eagle populations in Sweden. Bird Study 28: 235–241.
Helander, B. (2003b) The international colour ringing programme – adult survival, homing and the expansion of the white-tailed sea eagle in Sweden. In: Helander, B., Marquiss, M. and Bowerman, B. (eds). SEA EAGLE 2000. Åtta.45 Tryckeri AB, Stockholm. pp. 145-154.
Helander, B., Axelsson, J., Borg, H., Holm, K., Bignert, A. (2009) Ingestion of lead from ammunition and lead concentrations in white-tailed sea eagles (Haliaeetus albicilla) in Sweden. Sci. Tot. Environ. 407: 5555–5563.
Helander, B., Hailer, F., Vila, C. (2007) Morphological and genetic sex identification of white-tailed sea eagle Haliaeetus albicilla nestlings. J. Ornithol. 148: 435–442.
Helander, B., Räikkönen, J., Ågren, E., Borg, H. (2012) Rapportering från projekt om undersökning av bly i leverprover från havsörn 2005 – 2011. (In Swedish). Naturhistoriska Riksmuseet, Rapport nr 16: 2012.
Helander, B., Stjernberg, T. (eds.) (2003) Action Plan for the conservation of White-tailed sea eagle (Haliaeetus albicilla). Recommendation 92/2002, adopted by the Standing Committee of the Bern Convention in Dec., 2002. BirdLife International. 51 pp.
Henny, C.J., Kaiser, J.L., Grove, R.A., Johnson, J.L., Letcher, R.J. (2009) Polybrominated diphenyl ether flame retardants in eggs may reduce reproductive success of ospreys in Oregon and Washington, USA. Ecotoxicology 18: 802–13.
Isomurso, M., Venäläinen, E.-R., Stjernberg, T. (2014) Lead poisoning – a continuous threat to white-tailed sea eagles in Finland. Poster abstract, EWDA 2014 – 11th European Wildlife Disease Association Conference, Edinburgh.
Krone, O., Langgemach, T., Sömmer, P., Kenntner, N. (2002) Krankheiten und Todesursachen von Seeadlern (Haliaeetus albicilla) in Deutschland. (In German). Corax 19: 102-108.
Krone O., Stjernberg, T., Kenntner, N., Tataruch, F., Koivusaari, J., Nuuja, I. (2006) Mortality, helminth burden and contaminant residues in White-tailed Sea Eagles from Finland. Ambio 35: 98-104.
Krone, O., Kenntner, N., Tataruch, F. (2009) Gefährdungsursachen des Seeadlers (Haliaeetus albicilla L. 1758). (In German). Denisia 27: 139-146.
Nordén, M. (2013) Comparative avian developmental toxicity of PFAAs. Doctoral dissertation. Örebro Studies in Biology 7. ISSN 1650-8793; ISBN 978-91-7668-959-2.
Appendix 1. Custom assessment units used for the white-tailed sea eagle indicator (see Key Message and Figure 1 for explanations). In essence, HELCOM units is not appropriate due to sample size issues, and HELCOM units have been aggregated to the following 13 custom units. The HELCOM-scale 3 units aggregated for each region is given in the column “HELCOM_level_3” and follows the downloadable data from the HELCOM data portal.
| WTSE_ID | COUNTRY | WTSE_ID_text | WTSE_Area | HELCOM_level_3 |
| 1 | DNK | DNK | Denmark | HELCOM_ID In (’27’, ’30’, ’33’, ’34’, ’36’, ’38’, ’40’) |
| 2 | EST | EST | Estonia | HELCOM_ID In (’10’, ’12’, ’14’, ’17’) |
| 3 | FIN | FIN, G of Bothnia | Finland, Gulf of Bothnia | HELCOM_ID In (‘1’, ‘3’, ‘5’) |
| 4 | FIN | FIN, G of Finland | Finland, Gulf of Finland | HELCOM_ID In (’11’) |
| 5 | FIN | FIN, Åland+Åbo | Finland, Åland & Åboland | HELCOM_ID In (‘8’) |
| 6 | DEU | DEU | Germany, M-WP | HELCOM_ID In (’28’, ’31’, ’32’, ’35’) |
| 7 | LVA | LVA | Latvia | HELCOM_ID In (’18’) |
| 8 | LTU | LTU | Lithuania | HELCOM_ID In (’19’) |
| 9 | POL | POL | Poland | HELCOM_ID In (’22’, ’24’, ’26’) |
| 10 | RUS | RUS | Russia | HELCOM_ID In (’13’, ’21’, ’23’) |
| 11 | SWE | SWE, Baltic Prop. | Sweden, Baltic Proper | HELCOM_ID In (‘7’, ‘9’, ’16’, ’20’, ’25’, ’29’) |
| 12 | SWE | SWE, G of Bothnia | Sweden, Gulf of Bothnia | HELCOM_ID In (‘2’, ‘4’, ‘6’) |
| 13 | SWE | SWE, West | Sweden, West Coast | HELCOM_ID In (’37’, ’39’) |