 Zooplankton
2 Relevance of the indicator
Zooplankton includes an array of macro and microscopic invertebrates. They play a vital role in the marine food web. The herbivorous zooplankton feed on phytoplankton and in turn constitute prey to animals at higher trophic levels, including fish. Therefore, zooplankton are an essential link in aquatic food webs, influencing energy transfer in the pelagic food webs and recruitment to fish stocks as well as ecosystem productivity, nutrient and carbon cycling. Hence, the evaluation of zooplankton communities is a prerequisite for analysis of pelagic food web structure.
The mean size of a zooplankter in the community is indicative of both fish feeding conditions and grazing pressure from zooplankton on phytoplankton. Large stocks of zooplankton composed of large-bodied organisms have a higher capacity for transfer of primary producers (phytoplankton) to fish, i.e. higher energy transfer efficiency. By contrast, dominance of small-bodied zooplankton is usually associated with lower energy transfer efficiency, due to higher losses. Thus, a high community biomass of zooplankton with large individual body size represents both favourable fish feeding conditions and a high potential for efficient utilization of primary production. According to ecological theories, this would represent an efficient food web and correspond to a good environmental status. All other combinations of zooplankton stock and individual size would be suboptimal and imply food web limitations in terms of energy transfer through the food web and productivity.
2.1 Ecological relevance
Zooplankton play an important role transferring primary production to zooplanktivorous fish. However, different zooplankton taxa often have different preferences for trophic state of the ecosystem and are of different value as prey for zooplanktivores, because of the variations in size, escape response, and biochemical composition. In the Baltic Sea, alterations in fish stocks and regime shifts received particular attention as driving forces behind changes in zooplankton (Casini et al. 2009). With the position that zooplankton has in the food web – sandwiched between phytoplankton and fish (between eutrophication and overfishing) – data and understanding of zooplankton are a prerequisite for an ecosystem approach to management.
With respect to the eutrophication-driven alterations in food web structure, it has been suggested that with increasing nutrient enrichment of water bodies, total zooplankton abundance or biomass increases (Hanson & Peters 1984), mean size decreases (Pace 1986), and relative abundance of large-bodied zooplankters (e.g. calanoids) generally decrease, while small-bodied forms (e.g., small cladocerans, rotifers, copepod nauplii, and ciliates) increase (Pace & Orcutt 1981).
Total zooplankton abundance and biomass
In lakes and estuaries, herbivorous zooplankton stocks have been reported to correlate with chlorophyll a and phytoplankton biomass (Pace 1986; Nowaczyk et al. 2011; Hsieh et al. 2011), but also with total phosphorus (Pace 1986). In general, total zooplankton stocks increase with increasing eutrophication, which in most cases is a result of the increase in small herbivores (Gliwicz 1969; Pace 1986; Hsieh et al. 2011). Both parameters have been recommended as primary ‘bottom-up’ indicators (Jeppesen et al. 2011).
In most areas of the Baltic Sea, copepods contribute substantially to the diet of zooplanktivorous fish (e.g. sprat and young herring), and fish body condition and weight-at-age (WAA) have been reported to correlate positively to abundance/biomass of copepods (Cardinale et al. 2002; Rönkkönen et al. 2004). In coastal areas of the northern and central Baltic Sea, WAA has been suggested to be used as a proxy for zooplankton food availability and related fish feeding conditions to fish recruitment (Ljunggren et al. 2010).
Herbivorous zooplankton biomass is indirectly impacted by eutrophication via changes in primary productivity and phytoplankton composition, whereas direct impacts are expected mostly from predation, and to a lesser extent, from introduction of synthetic compounds (at point sources) and invasive species (via predation). The latter can also be indirect if invasive species are changing trophic guilds, which may affect zooplankton species. Finally, zooplankton abundance and biomass are affected – both positively and negatively – by climatic changes and natural fluctuations in thermal regime and salinity.
Mean zooplankter size
Evidence is accumulating that a shift in zooplankton body size can dramatically affect water clarity, rates of nutrient regeneration and fish abundance (Moore & Folt 1993). Although these shifts can be caused by a variety of factors, such as increased temperatures (Moore & Folt 1993; Brucet et al. 2010), eutrophication (Yan et al. 2008; Jeppesen et al. 2000), fish predation (Mills et al. 1987; Yan et al. 2008, Brucet et al. 2010), and pollution (Moore & Folt 1993), the resulting change implies a community that is well adapted to eutrophic conditions and provides a poor food base for fish. It has been recommended to use zooplankton size as an index of predator-prey balance, with mean zooplankton size decreasing as the abundance of zooplanktivorous fish increase and increasing when the abundance of piscivores increase (Mills et al. 1987).
2.2 Policy relevance
The indicator on zooplankton mean size and total stock addresses the Baltic Sea Action Plan (BSAP 2021) vision of “a healthy Baltic Sea environment with diverse biological components functioning in balance, resulting in a good ecological status and supporting a wide range of sustainable economic and social activities”, in particular being relevant to the Biodiversity goal of a “Baltic Sea ecosystem is healthy and resilient” and the subsequent ecological objectives of “Natural distribution, occurrence and quality of habitats and associated communities” and “Functional, healthy and resilient food webs”.
The core indicator also contributes to the MSFD in supporting a determination of good environmental status under MSFD Descriptor 4 and Descriptor 1 (Commission Decision (EU) 2017/848). More specifically the indicator addresses size distribution of individuals across the trophic guild and supports an evaluation of condition of the habitat type (pelagic habitats). This core indicator is among the few indicators able to evaluate the structure of the Baltic Sea food web with known links to lower and higher trophic levels (Table 1).
Table 1. Policy relevance of this specific HELCOM indicator.
| Baltic Sea Action Plan (BSAP) | Marine Strategy Framework Directive (MSFD) | |
| Fundamental link | Segment: Biodiversity
Goal: “Baltic Sea ecosystem is healthy and resilient”
|
Descriptor 4 Ecosystems, including food webs
|
| Complementary link | Segment: Biodiversity
Goal: “Baltic Sea ecosystem is healthy and resilient”
|
Descriptor 1 Species groups of birds, mammals, reptiles, fish and cephalopods
|
| Other relevant legislation: | UN Sustainable Development Goal 14 (Conserve and sustainably use the oceans, seas and marine resources for sustainable development) is most clearly relevant, though SDG 12 (Ensure sustainable consumption and production patterns) and 13 (Take urgent action to combat climate change and its impacts) also have relevance. | |
2.3 Relevance for other assessments
The status of biodiversity is assessed using several core indicators. Each indicator focuses on one important aspect of the complex issue. In addition to providing an indicator-based evaluation of the mean size and total stock of zooplankton, this indicator, along with the other biodiversity indicators, contributes to the overall biodiversity assessment of pelagic habitat.
3 Threshold values
This core indicator employs zooplankton mean size (MS; µg wet mass/ind.) and total stock (TS as total zooplankton biomass, mg wet mass/m3) to evaluate pelagic food web structure, with particular focus on lower food webs. MSTS evaluates whether good status is achieved using two threshold values, one for the mean size and one for the total stock of zooplankton (Figure 2 and Table 2).
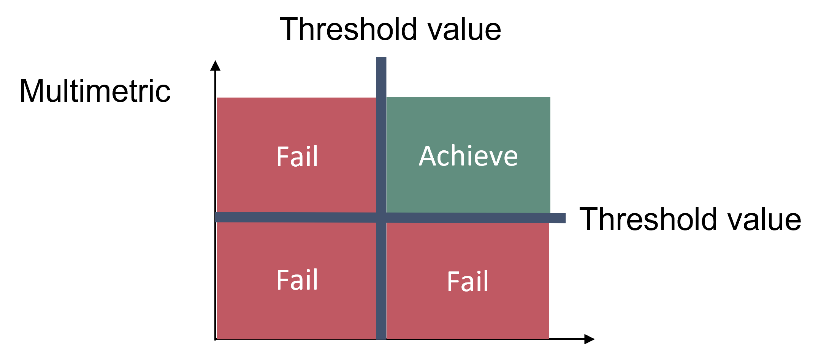
Figure 2. Schematic representation of the threshold value applied in the ‘Zooplankton mean size and total stock’ core indicator (see Table 2 for the threshold values).
An area is evaluated as having achieved good status using the MSTS indicator when both mean size and total stock are above their specific threshold values (Figure 3), and one-sided lower CuSum values (see section 9.2) confirm no significant deviation from the target.
Table 2. Due to strong environmental gradients affecting structure of plankton communities, including zooplankton, in the sub-basins of the Baltic Sea, the threshold values for each indicator component (mean size and total stock) are specific for each assessment unit. The indicator is evaluated using Scale 2 HELCOM assessment units.
| Assessment unit (Scale 2) | Threshold value mean size (µg wet weight ind-1) / total stock (mg m-3) |
| Kattegat (SEA-001) | Not currently evaluated |
| Great Belt (SEA-002) | Not currently evaluated |
| The Sound (SEA-003) | Not currently evaluated |
| Kiel Bay (SEA-004) | Not currently evaluated |
| Bay of Mecklenburg (SEA-005) | Not currently evaluated |
| Arkona Basin (SEA-006) | Not currently evaluated |
| Bornholm Basin (SEA-007) | 14.9 / 273 |
| Gdansk Basin (SEA-008) | 10.2 / 103 |
| Eastern Gotland Basin (SEA-009) | 14.1 / 104 |
| Western Gotland Basin (SEA-010) | 5.1 / 220 |
| Gulf of Riga (SEA-011) | 4.7 / 253 |
| Northern Baltic Proper (SEA-012) | 9.8 / 123 |
| Gulf of Finland (SEA-013) | 8.6 / 125 |
| Åland Sea (SEA-014) | 10.3 / 55 |
| Bothnian Sea (SEA-015) | 8.5 / 84 |
| The Quark (SEA-016) | Not currently evaluated |
| Bothnian Bay (SEA-017) | 23.7 / 161 |
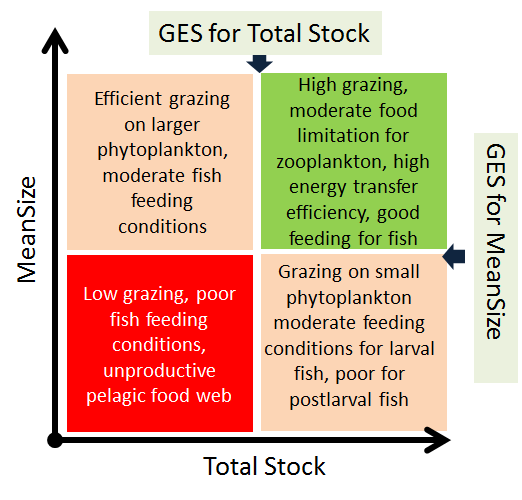
Figure 3. The MSTS concept (left) and a data example (right) to illustrate the use of the indicator. The green area on the left panel represents good status conditions, orange areas represent not good status where only one of the two parameters is adequate and the red area represents not good status where both parameters fail to meet the threshold value. On the right panel, an example of long-term zooplankton data for mean size and total biomass (stations B1 and BY31, Western Gotland Basin) were analysed. The corresponding thresholds are shown as red and blue lines, respectively. The years in green were classified as in good status and those in red as not in good status. Years of the assessment period are shown as stars. Generally, all years located in the right upper quadrant (green area in panel A) reflect good status. However, some years (e.g., 1979, 1985, 1994, etc.) are classified as reflecting good status, although they are placed outside of the green area. For these years, even though the absolute values for the indicator components (MeanSzie and Biomass) are below the threshold value, the deviation is not significant as determined by CuSum analysis. To achieve a significantly sub-GES value, the change must be persistent and cumulative negative change must exceed 5σ difference from the threshold value. Similarly, some years (e.g., 2007) are classified as sub-GES, although they are placed in the green area; during these years the observed values were above the thresholds, however this has not resulted in a significant shift in any of the MSTS component that was sufficiently persistent to return the MSTS values in the GES state. See the Assessment protocol for details.
3.1 Setting the threshold values
The threshold values are set using a reference period which defines a status when the food web structure was not measurably affected by eutrophication and represents good fish feeding conditions within the time series of existing data. Thus, the reference periods for MSTS reflects a time period when effects of eutrophication (defined as ‘acceptable’ chlorophyll a concentration) are low, whereas nutrition of zooplanktivorous fish is adequate for optimal growth. Hence, these are the periods when eutrophication and overfishing related food web changes are negligible. In some cases, reference periods can be adopted from neighbouring areas, for which longer datasets are available.
As the indicator evaluates the structural- and functional integrity of the food web, the threshold values are conceptually achieved when:
- there is a high proportion of large-sized individuals (usually older copepodites and adults of copepods but also adult cladocerans) in the zooplankton community that efficiently graze on phytoplankton and provide good-quality food for zooplanktivorous fish, and
- the biomass (abundance) of zooplankton is at an adequate level to transfer primary production to the higher trophic levels, support fish growth and exert control over phytoplankton production.
Two alternative strategies for setting reference conditions are possible.
- The first approach should be used when the data series are very short or when chlorophyll a concentration or zooplanktivorous fish body condition indices are invariant for the entire length of the zooplankton data series. Conceptually this approach is similar to using a trend as a threshold value. When using this approach, the long-term mean and corresponding variance (95% confidence interval, CI) for both the mean size and the total stock parameter are calculated based on the entire available dataset. The lower bound of 95%-CI is then used as threshold value to evaluate deviations in the current observations. This approach was used in the MSTS-based evaluation of the Gulf of Riga in 2016-2021.
- The second approach is based on (i) specific reference conditions for chlorophyll a concentration (RefConChl) that have been defined for the different sub-basins of the Baltic Sea (either observed in the past or based on models), and (ii) reference data on clupeid fish (young herring and sprat) that are used to identify the reference time periods (RefConFish) when both the fish growth (i.e. weight-at-age, WAA, or other body condition indices, such as fat content) and fish stocks were relatively high in the relevant ICES subdivisions. Once the reference time periods have been identified based on chlorophyll a and fish time series, the threshold values for both mean size and total stock were defined as the lower bound of the 99%-CI for the respective mean values calculated for zooplankton time series during the reference time period. This approach was used for the 2016-2021 assessment period in most of the assessment units (Figure 3).
4 Results and discussion
The results of the indicator evaluation that underlie the key message map and information are provided below.
4.1 Status evaluation
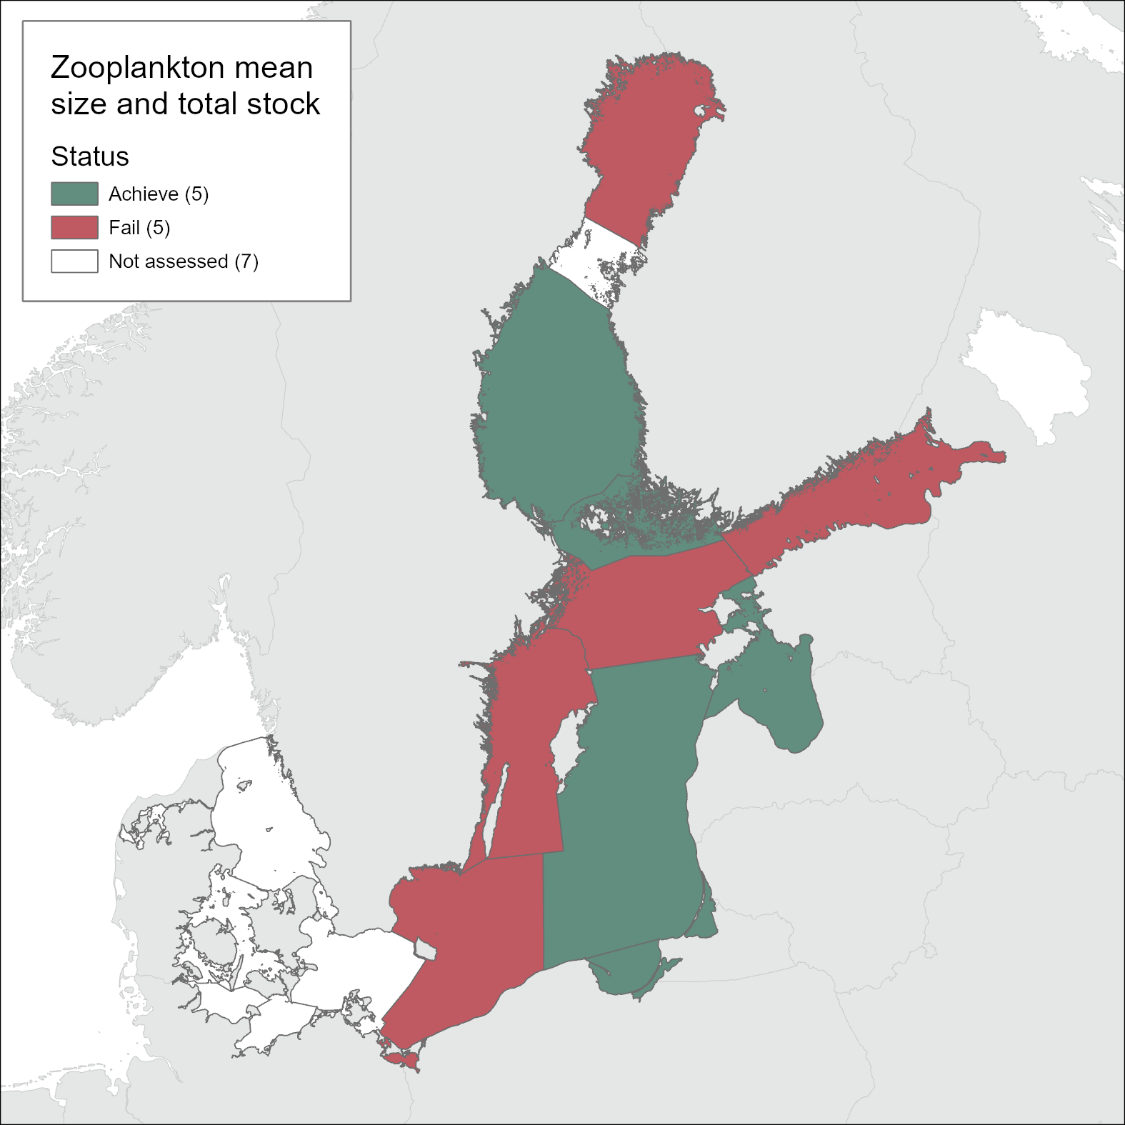
The evaluation of zooplankton mean size and total stock (MSTS) for the period 2016-2021 indicates that in the Bothnian Sea, Åland Sea, Gulf of Riga, Eastern Gotland Basin, and the Gdansk Basin, the MSTS values were above the threshold values indicating good status. By contrast, in the Bothnian Bay, Northern Baltic Proper, Gulf of Finland, Western Gotland Basin, and Bornholm, the MSTS values were significantly below the threshold values, which implies that good status has not been achieved. The details for each of the evaluated sub-basins are presented below.
In the Bothnian Bay (Figure 4a), MSTS has changed over the assessment period, with biomass value decreasing below its threshold, whereas MS value did not change appreciably. The biomass decline occurred over the entire data series (1979 – 2016); however, up to the 2016-2021 period, the occasional deviations of the annual average values were not sufficient to produce a significant deviation from the threshold value as indicated by CuSum analysis. During 2016-2021, however, the continued biomass decline resulted in sub-GES values, with annual values for 2020 and 2021 falling below the 5σ below the threshold. The populations that were responsible for this decline will be identified in the final evaluation report.
In the Bothnian Sea (Figure 4b), MSTS suggests good food web structure, with no indication of the decline in the overall status over the assessed period. In the Åland Sea (Figure 4c), starting from 1996, zooplankton mean size stayed significantly below the threshold and the total biomass values were often below the threshold values. In 2016-2020, the mean size has increased (most likely, due to the increased population of the large copepod Limnocalanus macrurus, following that in the Bothnian Bay (Mann-Kendall test, P< 0.01). As a result, the mean size reached the target values, and the threshold crossing was significant. The overall evaluation for MSTS indicator in this basin was, therefore in-GES, although this evaluation was based on the limited number of observations and will be revised when the Finnish data are incorporated.
In the Gulf of Finland (Figure 4d), the values of the mean size indicate that the system was not in good status from 2001 onwards. Also, the biomass failed the threshold during the same years on multiple occasions, albeit not significantly. Thus, MSTS indicates that in 2016-2021, the zooplankton community was not in good status, i.e., the overall status did not change since the previous assessment period. Moreover, the mean size was significantly decreasing for the entire time series, including the last decade (trends table 1).
In the Northern Baltic Proper (Figure 4e), the MSTS indicates that the system was not in good status since 1997, progressively worsening. In 2016-2021, the zooplankton community was not in good status due to the low mean size, whereas the total biomass was not significantly below the threshold.
In the Western Gotland Basin (Figure 4f), the MSTS indicates that the system was not in good status since 1998, although some signs of recovery, such as significantly increasing mean size, appear during the last decade (trends table 1). Nevertheless, during the assessment period 2016-2021, zooplankton community was not in good status.
In the Gulf of Riga (Figure 4g), the MSTS indicates that the system was in good status, although occasionally low values for the mean size were observed in some years. Moreover, the biomass in this sub-basin is progressively increased since the start of the time series (i.e., 1993).
In the Eastern Gotland Basin, (Figure 4h), the MSTS indicates that the system was still in good status, although both mean size biomass values were very close to the threshold for several years. Moreover, the increasing trend for the abundance without a corresponding increase in biomass (Table 3) suggests changes in the community structure, which need to be evaluated in order to understand the population-level responses over time.
In the Gdansk Basin (Figure 4j), the MSTS values indicate that the system was in good status, with no decrease from its reference state for the last 30 years with regard to both mean size and biomass values. On the contrary, zooplankton abundance, biomass and mean size have been increasing during the last 12 years (Table 3).
In the Bornholm Basin (Figure 4k), the MSTS indicates that the system was not in good status, mostly due to the significantly sub-GES mean size values. Notably, the threshold for the mean size was crossed already in the year 2006. When only the last 12 years of the data were considered, no significant trend in either the mean size or the biomass were detected.
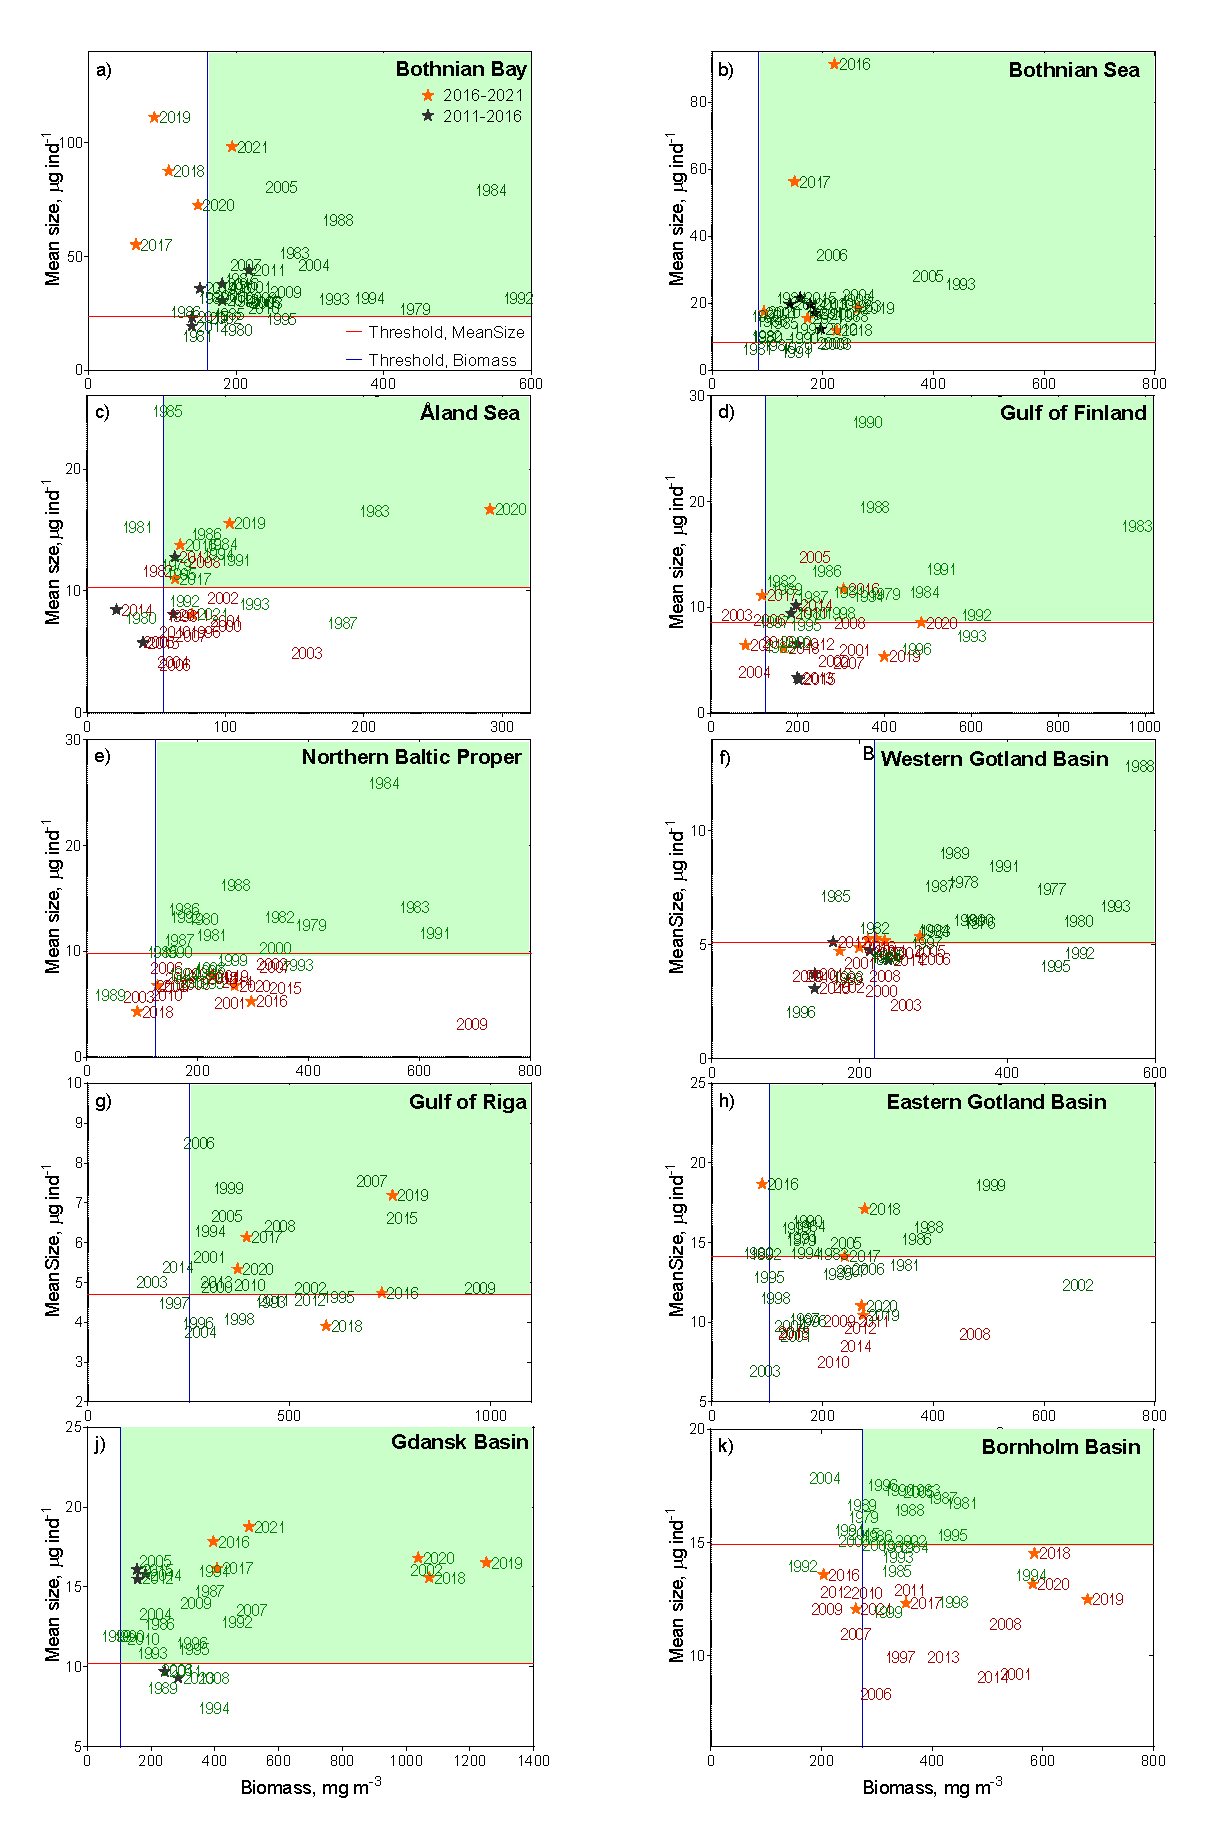
Figure 4. Evaluation results on the performance of MSTS indicator, which integrates mean size (Y axis) and total biomass of zooplankton (X axis). Blue and red lines show threshold values for the total biomass and mean size, respectively. The green-shaded quartile indicates good status. Observations in good and in not good status are shown as green and red years, respectively. Stars indicate the assessment period years (black: 2011 to 2016, orange: 2016-2021). Note that some years falling below the threshold values were assigned as being in good status because these values were not judged as significantly different from the threshold value according to the CuSum analysis, which is based on the cumulative summing of the persistent deviations from the reference mean.
4.2 Trends
Significant long-term trends were observed for zooplankton stock metrics (abundance and biomass) and the mean size in all evaluated sub-basins with the Bothnian Sea as a single exception (Table 3 and Figure 5). When the entire time series were considered, the most prominent change was observed for the mean size that declined in six out of 10 sub-basins. This decline was no longer detectable for the last 12 years in the Åland Sea, Northern Baltic Proper, Eastern Gotland Basin, and Bornholm Basin, partly due to the lower statistical power for the shorter data sets, but also because in some cases (e.g., Western Gotland Basin), the trend became positive.
Table 3. Long-term trends for zooplankton biomass, abundance, and mean size in the sub-basins evaluated in HOLAS 3. The Mann-Kendall test for trend was applied using the entire data series available and then repeated for the last 12 years to understand the most recent changes. The significant (p < 0.05) increasing and decreasing trends are indicated as ↑ and ↓, respectively, and → indicates no significant change. Data are taken as provided in ICES DOME database.
| Sub-basin | Entire time series | Last 12 years | |||||
| Biomass | Abundance | Mean size | Period (years) | Biomass | Abundance | Mean size | |
| Bothnian Bay | ↓ | ↓ | ↑ | 1979-2021 | ↓ | → | ↑ |
| Bothnian Sea | ↑ | → | ↑ | 1979-2021 | → | → | → |
| Åland Sea | → | → | ↓ | 1982-2021 | → | → | → |
| Northern Baltic Proper | → | ↑ | ↓ | 1979-2021 | → | → | → |
| Gulf of Finland | → | ↑ | ↓ | 1980-2021 | → | → | → |
| Gulf of Riga | ↑ | → | → | 1993-2021 | → | → | → |
| Eastern Gotland Basin | → | ↑ | ↓ | 1979-2021 | → | → | → |
| Western Gotland Basin | ↓ | → | ↓ | 1976-2021 | → | → | ↑ |
| Gdansk Bay | → | → | ↑ | 1986-2021 | ↑ | ↑ | ↑ |
| Bornholm | → | → | ↓ | 1979-2021 | → | → | → |
| All subbasins assessed | → | ↑ | ↓ | 1976-2021 | → | ↑ | → |
To understand the reasons behind the observed changes in the indicator components, and, especially, the mean size, population studies are needed, with a particular focus on the demography of the key taxa. For example, when the zooplankton community structure in the Western Gotland Basin is explored.
Figure 5. Pair-wise comparisons between the MSTS values observed during the current assessment period (2016-2021) and in HOLAS II (2011-2016) for mean zooplankton size (Mean size; A) and total zooplankton biomass (Total biomass; B) in the Bothnian Bay (BB), Bothnian Sea (BS), Åland Sea (ÅS), Northern Baltic Proper (NBP), Gulf of Finland (GoF), Western Gotland Basin (WGB), Gulf of Riga (GoR), Gdansk Basin (GB), and Bornholm Basin (BB). The basin-specific data were compared using unpaired t-test with Welch correction and statistically significant differences (p < 0.05) are indicated with percent change and red asterisk. For the nearly significant difference in ÅS, the p value is shown. Percentage values indicate change (positive or negative) in the value observed for the assessment period relative to the reference period. Data are shown as means and standard deviations for the untransformed data; the statistical comparisons were done using Box-Cox transformed values that were normally distributed.
4.3 Discussion
Developments from the last assessment period
The difference in the MSTS components between the reference conditions and the HOLAS 3 assessment period varied from -34% to +75% for the mean zooplankter size (µg ind-1) and from -42% to +42% for the total biomass (mg m-3) among the sub-basins (Figure 5). Prominent decreases in both body size and total biomass of zooplankton were observed in the Åland Sea, Gulf of Finland and Western Gotland Basin, where size and total biomass decreased by 39% and 38%, respectively, from the reference period to the assessment period (2011-2016). Similar changes occurred in the Bornholm Basin (preliminary evaluation) where mean size and biomass decreased by 20% and 39%, respectively.
Contrary to all other sub-basins, both mean size and biomass have increased in the Bothnian Sea from the reference period to the assessment period (Figure 4). The increase observed in the Bothnian Sea is related to an increased population size of the large-bodied copepod Limnocalanus macrurus. This species, which is a glacial relict in the Baltic Sea, responded positively to the low salinity conditions during the last decade, which improved herring feeding conditions (Rajasilta et al. 2014) as well as MSTS values in this sub-basin. In the other sub-basins, species that contributed to the detected changes in the MSTS components varied. However, regardless of the variability among the species and species groups contributing to general declines in body size and biomass values among the sub-basins, an increase in proportion of small-sized taxa and groups was observed in all assessment units (except the Bothnian Sea). In the Gulf of Finland, the change is largely attributed to a decline in the biomass of large cladocerans. In the Western Gotland Basin and the Bornholm Basin, the decline in mean size and total biomass is mostly due to declining copepod populations and thus shifting size spectra and biomass of the zooplankton communities.
An overview is provided in Table 4.
Table 4. Evaluation summary for each assessment unit and comparison between assessment periods, where relevant.
| HELCOM Assessment unit name (and ID) | Threshold value achieved/failed | Distinct trend between current and previous evaluation. | Description of outcomes, if pertinent. |
| Kattegat (SEA-001) | Not evaluated | NA | Not evaluated |
| Great Belt (SEA-002) | Not evaluated | NA | Not evaluated |
| The Sound (SEA-003) | Not evaluated | NA | Not evaluated |
| Kiel Bay (SEA-004) | Not evaluated | NA | Not evaluated |
| Bay of Mecklenburg (SEA-005) | Not evaluated | NA | Not evaluated |
| Arkona Basin (SEA-006) | Not evaluated | NA | Not evaluated |
| Bornholm Basin (SEA-007) | Failed | First iteration of indicator | Zooplankton abundance (but not the biomass) has been increasing from the mid-1990-ties (significant trend), whereas the mean size of the organisms significantly decreased. In 2016-2020, the mean size of zooplankton was significantly lower than in the reference period. |
| Gdansk Basin (SEA-008) | Achieved | No change | Zooplankton abundance, biomass, and mean size have been increasing since the mid-1980-ties (significant trend). In 2016-2020, the biomass was significantly higher than in the reference period. |
| Eastern Gotland Basin (SEA-009) | Achieved | First iteration of indicator | Zooplankton abundance has been increasing since the mid-1980-ties (significant trend), whereas biomass and mean size decline. If the trend continues, the status in the next reference period can be sub-GES. |
| Western Gotland Basin (SEA-010) | Failed | Partially improved | Zooplankton biomass and mean size have been decreasing since the mid-1970-ties (significant trends). However, during the last decade, the mean size significantly increased and now is close to the target value, although both biomass and mean size are still significantly lower than during the reference period. |
| Gulf of Riga (SEA-011) | Achieved | First iteration of indicator | Zooplankton biomass and mean size are not below their respective target values. Moreover, the biomass has been significantly increasing since the beginning of the time series. The increase is related to both large-sized (copepods) and small-sized (rotifers and small cladocerans) biomasses (data not shown). |
| Northern Baltic Proper (SEA-012) | Failed | First iteration of indicator | Abundance of small-sized organisms has been significantly increasing since the mid-1980-ties, resulting in a significant decrease of the total biomass and the mean size of zooplankton. In 2016-2021, the mean size was significantly lower than during the reference period and a similar, albeit not significant, tendency was observed for the biomass. |
| Gulf of Finland (SEA-013) | Failed | Partially improved. | Zooplankton abundance has been increasing since the beginning of the time series, due to increase in small-sized taxa, which resulted in a significant decrease of the mean size. During the previous and the current assessment periods, the mean size was significantly below the target value, with no appreciable change between the periods. However, the biomass significantly increased in relation to both reference period and 2011-2015/16, which can be considered as, at least, a partial improvement of the fish feeding conditions. |
| Åland Sea (SEA-014) | Achieved | Improved | The mean size has been decreasing since the beginning of the time series. Although the trend has not been significantly reversed during the last decade, both mean size and biomass values for the 2016-2019 were above the threshold and were considered as in-GES. |
| Bothnian Sea (SEA-015) | Achieved | No change | Zooplankton biomass and mean size are not below their respective target values. Moreover, the mean size has significantly increasing compared to the previous assessment period due to increase in the large copepod population abundance and biomass. |
| The Quark (SEA-016) | Not evaluated | NA | |
| Bothnian Bay (SEA-017) | Failed | Worsened | The abundance and biomass of zooplankton have been significantly decreasing since the end of 1970-ties. During the assessment period, the biomass decline resulting in crossing the threshold and the overall status became sub-GES. |
The methodology and previously established threshold values (i.e. as applied in HOLAS II) have not been altered between the current (HOLAS 3) and prior (HOLAS II) assessment periods. Therefore, a direct comparison between the two periods is valid.
5 Confidence
The overall confidence of the evaluation varies from low to high between the assessment units. With regard to the spatial coverage, the confidence varies from low to intermediate because the number of sampling stations used for the evaluation is relatively low (1 to 4). With regard to the temporal coverage, the sampling frequency varies from annual (e.g., Gdansk Basin) to bi-weekly (e.g., WGB); therefore, the confidence is evaluated as low to high. With regard to the methodology, the confidence is high, because in the Baltic Sea, zooplankton sampling, analysis and evaluation are well harmonized between the national laboratories.
The data availability is the main reason for the variation in the confidence across the assessment units. Also, confidence of the evaluation accuracy depends on the time series length and between-year variability during the reference period. It is also important that confidence is comparable for the reference and the evaluation values, which usually holds for our zooplankton data (Figure 5) as the number of stations and sampling frequency are relatively stable between years.
Zooplankton monitoring stations are generally found in every Baltic Sea sub-basin, and suitable monitoring data series are available for relatively long (>18 years) time periods from most of the sub-basins. A similar confidence in the evaluation (moderate to high) is expected for the most evaluated basins with fairly similar length of the data sets and similar number of observations (number of data points per basin and per year). However, in case of low observation frequency (for example, Åland Sea and Gdansk Basin, where only August data were used from a single station each year), the confidence is low.
The accuracy component of the confidence is considered to be high also because of the statistical method evaluating whether the thresholds for the mean size and biomass values defined as acceptable have been significantly crossed when comparing the values observed during the assessment period and the reference period. This confidence classification is due to:
(1) the CuSum technique that is used to determine whether the observed value reflects good status or not is considered to be a very sensitive method for detecting persistent small changes (Lucas 1982),
(2) the lower bound of 99% confidence interval around the baseline (reference condition) was used as threshold, thus minimizing the risk of false negatives (i.e., assigning not good status to an observation that is in fact reflecting good status), and
(3) using a pre-cautionary principle by selecting the higher value after comparing threshold values obtained for RefConFish and RefConChl for each part of the indicator (i.e. mean size and total biomass).
6 Drivers, Activities, and Pressures
In aquatic ecosystems, a hierarchical response across trophic levels is commonly observed; that is, higher trophic levels may show a more delayed response or a weaker response to eutrophication than lower ones (Hsieh et al. 2011). Therefore, alterations in planktonic primary producers and primary consumers have been considered among the most sensitive ecosystem responses to anthropogenic stress, including eutrophication (Schindler 1987; Stemberger & Lazorchak 1994).
The core indicator responds to fishing and eutrophication but also other drivers causing changes in the food web, such as salinity and temperature, that are particularly relevant in the context of the Baltic Sea. Other pressures that might be involved are environmental contaminants causing adverse effects on the zooplankton (e.g., Vezi et al. 2019) and bottom hypoxia (e.g., Keister and Tuttle, 2013). The regression analysis conducted during the evaluation procedure confirmed that all metrics in question (mean size, total zooplankton abundance, and total biomass) can change significantly when chlorophyll a and herring weight-at-age (WAA) values are outside of their reference conditions (Gorokhova et al. 2016). The effects of fishery activities and eutrophication, although potentially co-occurring, would have different outcomes:
Increased eutrophication and dominance of bacterio- and picoplankton leads to a selective advantage for grazing by small-sized zooplankton taxa. Hence, the declining trend in mean size, but not total stock are likely to occur due to the increased abundance of the microphagous taxa. In moderately eutrophied systems, an increase in the total abundance and/or biomass can be observed (Figure 6).
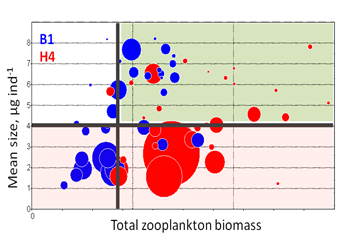
Figure 6. MSTS for two coastal stations (B1 and H4) in the Western Gotland Basin/northern Baltic Proper (years 1976-2010). Data are non-transformed mean values for summer (June-September) and circle size indicates average biovolume of filamentous cyanobacteria during the same period. In the Baltic Sea, the extensive cyanobacteria blooms are commonly considered a sign of eutrophication. Therefore, lower mean size observed during years with particularly strong blooms suggests negative effects of eutrophication primarily on mean size. By contrast, no clear effect on the total stock is apparent. Thick lines show threshold values and the green area corresponds to good status conditions.
Increased fishery leads to an increase in zooplanktivorous fish stocks that would affect both mean size and total zooplankton biomass negatively. Moreover, in addition to the community-level decrease in zooplankton mean size, a decrease in the population-level mean size would be observed due to selective predation on older life stages (Figure 7). Hence, the declining trend in the mean size (most likely) due to the increased relative abundance of the younger stages together with the declining total stock (probably) would be observed.
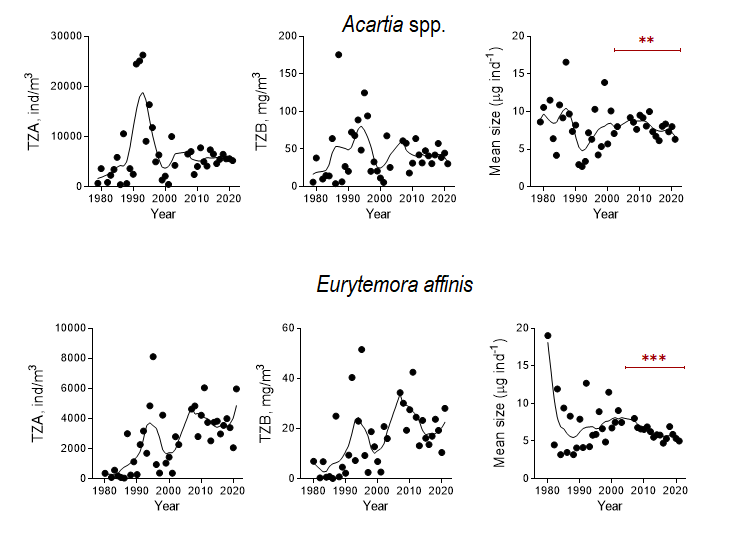
Figure 7. Zooplankton stock metrics (total zooplankton abundance, TZA, and total zooplankton biomass, TZB) and mean size for the dominant copepod populations of Acartia spp. and Eurytemora affinis in the Western Gotland Basin (years 1979-2021). Data are non-transformed mean values for summer (June-September). The significant decline in the mean size for both copepods was observed during the last two decades (Mann Kendall test, p < 0.01 in both cases), whereas the stock metrics were relatively stable (Acartia) or decreasing (Eurytemora). The decreasing mean size is most likely related to the size-selective predation by zooplanktivorous fish, with preferential removal of the older copepodite stages.
A number of directly policy relevant pressures are listed in Table 5.
Table 5. A brief summary of relevant pressures and activities with relevance to the indicator.
| | General | MSFD Annex III, Table 2a |
| Strong link | Fishery-induced mortality of larger zooplankters (both with populations and communities).
Eutrophication leading to dominance of small-sized phytoplankton supporting feeding of microphagous zooplankters. |
Biological
– Extraction of, or mortality/injury to, wild species (by commercial and recreational fishing and other activities). Substances, litter and energy – Input of nutrients – diffuse sources, point sources, atmospheric deposition. |
| Weak link | Higher salinity favouring species of marine origin.
Higher temperature favouring warm-water taxa and parthenogenic reproduction of rotifers and some cladocerans, which are generally smaller zooplankters. Changes in oxygen concentration decrease habitat space for large-sized copepods. Invasive species (predatory zooplankters) affect native copepods and cladocerans. Environmental contaminants may have adverse effects on the most sensitive species; however, at present they are unknown in the Baltic Sea. |
7 Climate change and other factors
Climate change is expected to add further cumulative pressures to already existing anthropogenic ones in the Baltic Sea (HELCOM/Baltic Earth 2021) and thus to affect zooplankton mean size and total stock via various factors. Although exact details are not yet known in full detail, direct parameters causing changes in zooplankton mean size and total stock are most likely to be caused by changes in water temperature, sea ice, salinity and saltwater inflows, precipitation, river run-off, carbonate chemistry, as well as riverine nutrient loads and atmospheric deposition. Indirect parameters most likely to have direct effects on zooplankton are changes by climate change on the microbial community and processes, pelagic and demersal fish, occurrence of non-indigenous species, and ecosystem functions.
8 Conclusions
For HOLAS 3, the applicability of the MSTS indicator was expanded covering four new assessment units, the Northern Baltic Proper, Gulf of Riga, Eastern Gotland Basin, and Bornholm Basin. In half of the assessment units, zooplankton communities failed to comply with good environmental status. Moreover, the reason for this failure was the mean zooplankter size (in all cases but one), indicating that zooplankton communities show signs of losing large taxa and large (adult) individuals within populations. In several cases (Gulf of Finland, Eastern Gotland Basin, and Bornholm Basin), the decrease in the mean body size coincided with an increase in total zooplankton stocks (biomass and/or abundance), i.e., that change that would be expected at moderate eutrophication. Also, the intrapopulation dynamics of the mean size and increased relative contribution of the young stages at stable population total abundances are indicative of the predation pressure affecting zooplankton community structure. The interpretation of MSTS is facilitated by the integration with the results of the eutrophication status assessment by BEAT and, in the future, would be instrumental for the integrated food web assessment.
8.1 Future work or improvements needed
At present, the MSTS indicator has not been evaluated for all open sea assessment units in the Baltic Sea where zooplankton monitoring is conducted. The applicability of the indicator and the determination of relevant threshold values are still needed in The Quark and much of the southern Baltic Sea, Kattegat and Skagerrak before evaluation for these areas can be conducted.
Temperature- and salinity-induced MSTS responses also need to be further evaluated and, if relevant and significant, they need to be accounted for in the indicator-based evaluation of the pelagic food webs.
In order to evaluate the status of the food webs in the Baltic Sea, further development of the interpretation of the indicator results in relation to other evaluation results is needed. Future development should also include inventory and exploration of the coastal stations and data that can be used for the indicator-based evaluation. This would be critical if we are to establish pelagic habitat evaluation at scale 3.
A full evaluation of pelagic food webs is still to be developed, and the outcome of the MSTS-based evaluation needs to be considered in conjunction with other food web indicators.
Indicator development for HOLAS 3 has been supported by the Baltic Data Flows project, by enabling necessary data flows and indicator calculation improved for a developed R-script. Furthermore the HELCOM BLUES project enabled the development of new threshold values and enabling approval of the proposed threshold values via HELCOM processes. Future developments and improvements might need to secure necessary resources for further work on the indicator.
9 Methodology
The indicator uses mean zooplankton size and total stock (MSTS) for evaluating whether good environmental status is achieved or not. The indicator uses the parameter mean zooplankter size (mean size) which is presented as a ratio between the total zooplankton abundance (TZA) and total biomass (TZB). This metrics is complemented with an absolute measure of total zooplankton stock, TZA or TZB, to provide MSTS. Thus, MSTS is a two-dimensional, or a multimetric, indicator representing a synthetic descriptor of zooplankton community structure. The methodology and basis of the indicator evaluation is provided below. The indicator calculation workflow (Figure 8) is available as an R script from GitHub (Labuce and Gorokhova, in press.).
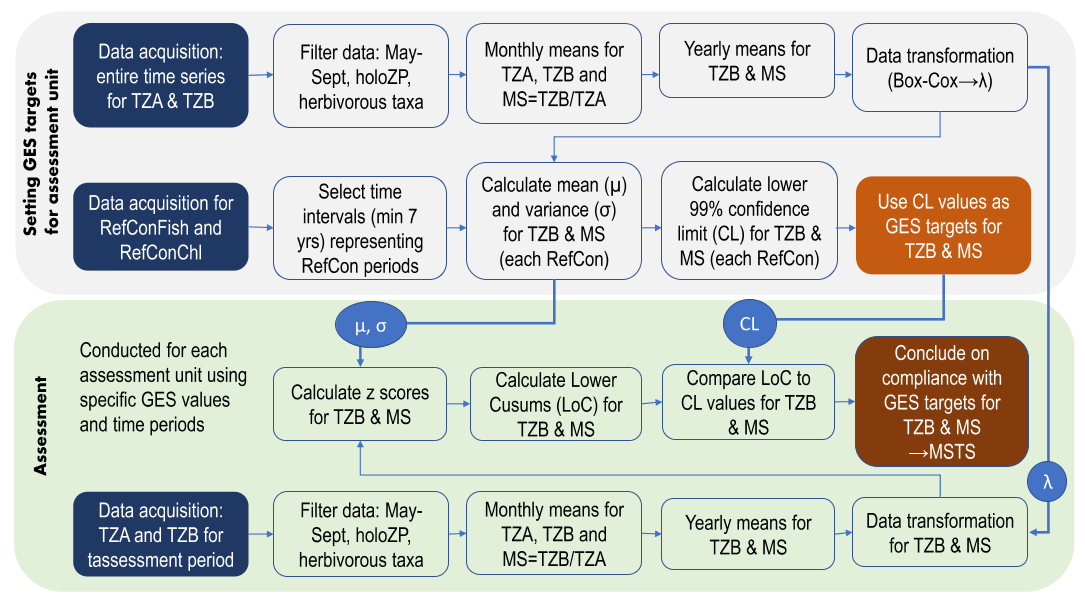
Figure 8. Workflow for MSTS calculations as implemented in the script runMSTS consists of Part I (Setting target values for good environmental status (GES) in the assessment unit; upper panel) and Part II (Conducting the evaluation; lower panel). holoZP – holoplanktonic zooplankton; MS – mean zooplankter size; MSTS – zooplankton mean size total stock indicator; RefCon – reference periods, either RefConFish or RefConChl; TZA – total zooplankton abundance; TZB – total zooplankton biomass. See Labuce and Gorokhova, in press., for details, and the script.
9.1 Scale of assessment
The indicator is evaluated using HELCOM assessment scale 2, which is consists of 17 Baltic Sea sub-basins. In the future it should be further discussed whether a higher spatial resolution (i.e. separating coastal and offshore areas) is needed. The assessment units are defined in the HELCOM Monitoring and Assessment Strategy Annex 4.
9.2 Methodology applied
Data period: The MSTS evaluations are currently restricted to the analysis of zooplankton communities observed during June-September. This seasonal time period was chosen because it is covered most extensively by the monitoring sampling programmes supplying the data; moreover, this is also the period of the highest plankton productivity as well as predation pressure on zooplankton (Johansson et al. 1993; Adrian et al. 1999). The structure of the marine food web is naturally variable; therefore, the indicator is designed to detect changes in the community structure that significantly deviate from the natural variability during the growth season.
Control charts: The time series of the MSTS components (mean size and total stock) for each zooplankton community are analyzed with cumulative sum (CuSum) control charts. The CuSum methods are designed to detect persistent small changes when the long-term mean changes in observed processes or periods. A control chart uses information about the natural variation of the process that is evaluated to examine if the process, i.e. the structure of the zooplankton community, is moving beyond the expected stochastic variability which is defined as desirable tolerance. If the process is in control, i.e. the zooplankton community structure is not affected by pressures, then subsequent observations are expected to lie within the tolerance boundaries. The hypothesis that the process is in control is rejected if the observations fall outside the desired tolerance boundaries. As a test statistic, control charts employ the controlling mean (μ) and specify control limits of n × standard deviations (σ) above and below the mean or the confidence intervals (CI). The upper and lower control limits are defined using a conservative approach of ±5σ for μ estimated for either RefConFish (reference conditions for fish) or RefConChl (reference conditions for chlorophyll a concentrations).
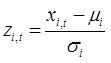
All datasets used for setting the thresholds values for evaluating status are >30 years of observations. The normality of each data series is first tested for normality (D’Agostino & Pearson omnibus normality test, Shapiro-Wilk and Kolmogorov-Smirnov normality tests). As both mean size and total zooplankton biomass often deviate significantly from the normal distribution, the values can be transformed using Box-Cox procedure and all calculations are then carried out on the transformed data. Once a controlling mean (μi) and standard deviation (σi) have been specified based on the chosen period used to determine the baseline against which status evaluation is made, indicator values (xi,t) within the time series are standardized to z-scores (zi,t) as:
The approach for setting the reference period used a window of the available data corresponding to the selected reference period, i.e. years representing sub-basin specific reference conditions for (i) food webs not measurably affected by eutrophication; these are based on environmental quality ratio (EQR) and historical data on chlorophyll a (HELCOM 2009) when defining RefConChl, and (ii) high feeding conditions for zooplanktivorous fish when defining RefConFish (Figure 9).
The μi and σi are defined based on the conditions during the reference period.
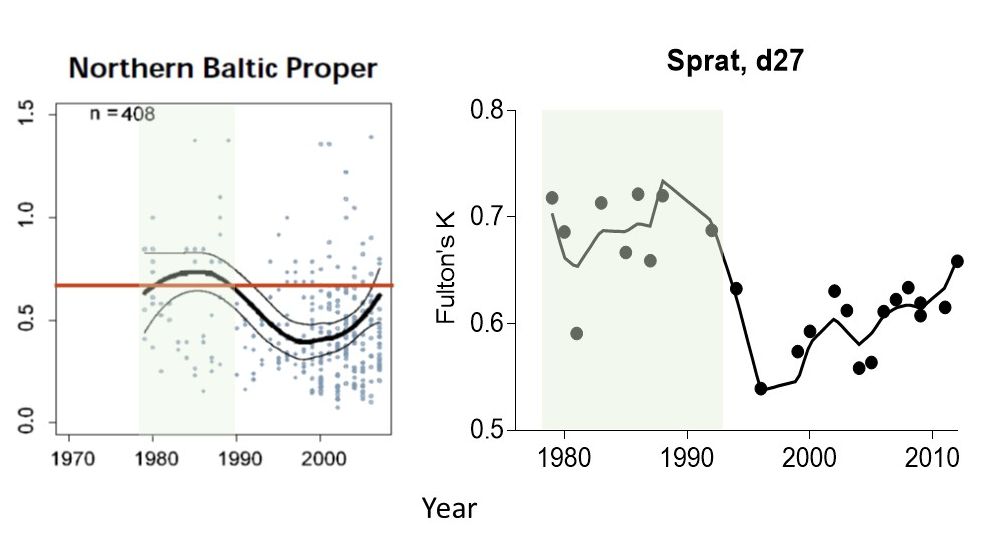
Figure 9. Examples for setting RefConChl and RefConFish using long-term variability in chlorophyll a expressed as ecological quality ratio (EQR) in the northern Baltic Proper (modified from HELCOM 2009) (left) and body condition index (Fulton’s K) of sprat in the ICES subdivision 27 (right) used to identify time period (green area) when zooplankton community was sufficient to efficiently transfer primary production to secondary consumers.
To investigate trends in accumulated small changes for the zooplankton mean size and total stock over long time periods, the CuSum charts (Figure 10) are constructed by first determining a decision-interval CuSum (DI-CuSum) that is calculated by recursively accumulating negative deviations (one-sided lower CuSum) as:
![]()
with Si=0 = 0. The k value is the allowance value in the process, expressed in z units, reflecting natural variability of the mean shift one wishes to detect. Thus, deviations smaller than k are ignored in the recursions. The default choice of k = 0.5 is considered appropriate for detecting a 1-σ shift in the process mean (Lucas 1982).
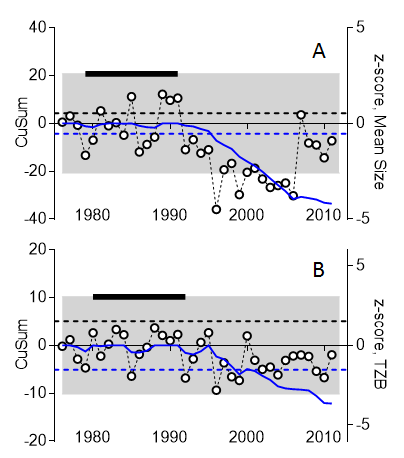
Figure 10. CuSum analysis of mean size (A) and total zooplankton biomass, TZB (B) using data series for station B1 (Askö station, Western Gotland Basin). The data are normalized to z-scores (right Y axis, open symbols). The threshold values are shown as dashed blue lines (-5σ from the mean for the reference period; σ is standard deviation) and the reference period (years) is indicated as a black bar on the top. The lower CuSum (solid blue line) indicates accumulated changes in the mean size and TZB; the CuSum lines are crossing the respective good status threshold values in 1995 (mean size) and 1999 (TZB). According to this chart, from 1995 onwards, MSTS indicates food web structure being in not good status.
A strategy that was used for obtaining an overall status evaluation when several datasets are available for an assessment unit is based on the integrated datasets. Since all zooplankton data are generated by national laboratories following HELCOM-Monitoring Manual guidelines and standardized gears and analysis methods, the data used for MSTS calculations are likely to be comparable. In order to arrive at a meaningful decision scheme, the main properties of the datasets should be considered. This includes issues such as length of the time series, their variability within defined reference periods, length of the time series overlapping with the reference periods, statistical properties of yearly mean values (i.e. number of samples contributing), quality control practices in the analysing laboratories, etc. These issues were carefully considered and discussed before this two-stage evaluation algorithm (first, comparing the datasets, and second, generating integrated data for the assessment unit) was applied.
9.3 Monitoring and reporting requirements
Monitoring methodology
HELCOM common monitoring of relevance to the core indicator is described on a general level in the HELCOM Monitoring Manual in the Sub-programme: Zooplankton species composition, abundance and biomass.
Specific guidelines are under review with the aim to be included in the HELCOM Monitoring Manual at a later stage.
According to HELCOM guidelines for biological monitoring (HELCOM 1988), zooplankton were collected by vertical tows from either ~5 m above the bottom to the surface (shallow stations, ≤ 30 m bottom depth) or by stratified tows (deep stations, ≥ 30 m) as designed and specified by regional monitoring programmes. The standard sampling gear is a 100 μm WP-2 net (diameter 57 cm) equipped with a flow meter.
Samples are preserved upon collection in formalin and analysed by national laboratories within the respective monitoring programmes (see Data table 1). Copepods are classified according to species, developmental stage (copepodites CI-III and CIV-V classified as younger and older copepodites, respectively), and sex (adults); naupliar stages are not separated. Rotifers and cladocerans are identified to the lowest possible taxonomic level; moreover, the latter are classified according to sex, and females as ovigerous or non-ovigerous. Biomass is estimated using individual wet weights recommended by Hernroth (1985); for species not included in this list, either measured or calculated individual weights based on length measurements are used.
Current monitoring
The monitoring activities relevant to the indicator that are currently carried out by HELCOM Contracting Parties are described in the HELCOM Monitoring Manual in the Monitoring Concepts table.
Sub-programme: Zooplankton species composition, abundance and biomass Monitoring Concepts table
Zooplankton monitoring stations are located in every Baltic Sea sub-basin. Most of the stations are offshore but there are also some coastal stations.
Time series of zooplankton used for setting thresholds value for mean size and total stock (MSTS) assessment are > 30 years. Due to considerable variations in the sampling frequency between the monitoring programmes and datasets, the data that are currently recommended for use in the MSTS evaluation are restricted to the summer period (June-September) as the most representative in the currently available datasets (due to sampling schedules in the national monitoring programmes).
Description of optimal monitoring
In general, current monitoring is considered sufficient, although effects of the sampling frequency on the indicator performance remain to be evaluated. Evaluating the effect of sampling frequency on the indicator performance would be relevant for evaluating the confidence of the indicator.
Different strategies are employed in the national monitoring programmes with regard to sampling frequency and spatial coverage. In future work, this should be addressed to provide recommendations for zooplankton monitoring in the Baltic Sea.
If more resources are available, they should be used for development and implementation of methods for automated analysis and growth rate evaluation that may complement standard analysis at the existing monitoring sites and provide specific information on zooplankton productivity.
10 Data
The data and resulting data products (e.g. tables, figures and maps) available on the indicator web page can be used freely given that it is used appropriately and the source is cited.
Result: Zooplankton mean size and total stock
Data: Zooplankton mean size and total stock
The data are provided by national monitoring programmes with HELCOM COMBINE parameters and methods. The indicator is based on routine data obtained within current monitoring schemes in the Baltic Sea, and is applicable in all areas where the programme is implemented. All HELCOM Contracting Parties carry out relevant monitoring.
An overview of data utilised for the current evaluation and the establishment of threshold values is provided in Tables 6 and 7, respectively.
Please note that due to national database issues Danish zooplankton data are not included in this assessment.
Table 6. Overview of the datasets used for MSTS evaluation for the period 2016-2021. The sampling stations indicated for the zooplankton data are referred to by their names used in ICES/DOME database.
| Sub-basin | Countries providing data | Station names |
| Bothnian Bay | Sweden, Finland | A5, A13, F3/A5, F9/A13, BO3, F2 |
| Bothnian Sea | Sweden, Finland | C3, C15, SR5, US5B |
| Åland Sea | Finland | F64 |
| Northern Baltic Proper | Finland, Estonia | LL12, LL17, 25, H1, H2 |
| Gulf of Finland | Finland | GF1, LL3A, LL7, LL7S, LL9, XV1, XIV3, UUS23-Långden |
| Eastern Gotland Basin | Sweden, Finland, Lithuania, Latvia | 32, 34a, BY15, 46, B4, F80 |
| Gulf of Riga | Latvia Estonia, | 121, 119, 121A, 142, 114A, G1, 111, 114, 107, 125 |
| Western Gotland Basin | Sweden, Finland | B1, BY31, LL23 |
| Gdansk Basin | Poland | P1 |
| Bornholm Basin | Poland, Germany | PL-P5C (P5)*, BMPK2, (TF-0213, OMBMPK2)* |
*In parentheses, the stations names used in national station registers and HELCOM map and data service are provided.
Table 7. Historical data used for setting TVs for MSTS evaluation for the period 2011-2016; deviations in the sampling methods from the HELCOM COMBINE guidelines are indicated.
| Data set code | Area | Monitoring station(s) | Geographic coordinates | Max. sampling depth (m) | Time period (gaps) | Sampling frequency a | Deviations in sampling methods from HELCOM guidelines |
| ASKÖ | Western Gotland Basin | B1 | N 58° 48′ 19, E 17° 37′ 52 | 40 m | 1976-2010 (1990, 1993) |
8-10 | Water bottleb (1983-1988), otherwiseWP2, 90-µm mesh sizec |
| Landsort | Western Gotland Basin | 2-10 | WP2, 90-µm mesh sizec | ||||
| GoFFI | Gulf of Finland | LL7 | N 59.5101, E 24.4981 |
95 m | 1979-2010 (1999, 2009) |
1d | none |
| LL3A | N 60.0403, E 26.8020, |
60 m | 1979-2010 (1989, 1990, 1999, 2000, 2009) |
||||
| ÅlandFI | Åland Sea | F64 | N 59.5101, E 24.4981 |
280 m | 1979-2010 (1988-1990,1997, 1999, 2009) |
||
| BoSFI | Bothnian Sea | SR5 | N 61.0500, E 19.3478 |
125 m | 1979-2010 (1989, 1997, 1999, 2009) |
||
| US5B | N 62.3517, E 19.5813 |
116 m | 1980-2010 (1989, 1997, 1999, 2009) |
||||
| BoBFI | Bay of Bothnia | BO3e | N 64.1812, E 22.2059 |
100 m | 1979-2010 (1989, 1990,1997-1999, 2009) |
||
| F2f | N 65.2302, E 23.2776 |
90 m | 1979-2010 (1983, 1989, 1990,1997-2000, 2009) |
||||
| Gdansk Deep | Gdansk Basin | P1 | N 54°50.042′
E 19°19.683′ |
112 m | 1986-2016 (1988, 1997-1998, 2000-2001) | 1d |
a if not specified otherwise, this frequency is a number of samples collected during June-September;
b 23-L water bottle was used to sample water column every 5 m (bottom to surface) and pooled for counting using a 90-µm sieve;
c WP2 nets with mesh size of 90 and 100 µm were compared in 2003 in the Western Gotland Basin/northern Baltic proper and found to provide statistically similar sampling efficiencies for all relevant zooplankton groups (Gorokhova, pers. observations);
d August;
e or stations BO3N and/or BO3S located in a close proximity;
f or station F2A located in a close proximity;
g total for all stations
11 Contributors
Elena Gorokhova
HELCOM Zooplankton Expert Network
HELCOM Secretariat: Owen Rowe, Jana Wolf
Contributing projects: ZEN-QAI project, Baltic Data Flows, HELCOM BLUES
12 Archive
This version of the HELCOM core indicator report was published in April 2023:
The current version of this indicator (including as a PDF) can be found on the HELCOM indicator web page.
Earlier versions of the core indicator report are available:
Zooplankton mean size and total stock HELCOM core indicator 2018 (pdf)
HOLAS II component – Core indicator report – web-based version July 2017 (pdf)
Zooplankton mean size and total abundance indicator report 2013 (pdf)
13 References
Adrian, R., Hansson, S., Sandin, B., DeStasio, B., Larsson, U. (1999) Effects of food availability and predation on a marine zooplankton community—a study on copepods in the Baltic Sea. Int Rev Hydrobiol 84: 609–626.
Brucet, S. et al. (2010) Factors influencing zooplankton size structure at contrasting temperatures in coastal shallow lakes: Implications for effects of climate change. Limnol. Oceanogr. 55: 1697-1711.
Cardinale, M., ,Casini, M., Arrhenius, F. (2002) The influence of biotic and abiotic factors on the growth of sprat (Sprattus sprattus) in the Baltic Sea. Aquat. Liv. Res.: 273-281.
Casini, M., Hjelm, J., Molinero, J.C., Lövgren, J., Cardinale, M., Bartolino, V., Belgrano, A., Kornilovs, G. (2009) Trophic cascades promote threshold-like shifts in pelagic marine ecosystems. Proc. Natl. Acad. Sci. USA 106: 197-202.
Gliwicz, Z.M. (1969) Studies on the feeding of pelagic zooplankton in lakes with varying trophy. Ekol. Pol., 17: 663-708.
Gorokhova, E., Lehtiniemi, M., Postel, L., Rubene, G., Amid, C., Lesutiene, J., Uusitalo, L., Strake, S. and Demereckiene, N., 2016. Indicator properties of Baltic zooplankton for classification of environmental status within Marine Strategy Framework Directive. PloS one, 11(7), p.e0158326.
Hanson, J.M., Peters, R.H. (1984) Empirical prediction of zooplankton and profundal macrobenthos biomass in lakes. Can. J. Fish. Aquat. Sci. 41: 439-455.
HELCOM (1988) Guidelines for the Baltic monitoring programme for the third stage. Part D. Biological determinants. Baltic Sea Environment Proceedings No. 27D.
HELCOM (2009) Eutrophication in the Baltic Sea – An integrated thematic assessment of the effects of nutrient enrichment and eutrophication in the Baltic Sea region. Baltic Sea Environment Proceedings No. 115B.
HELCOM/Baltic Earth (2021) Climate Change in the Baltic Sea. 2021 Fact Sheet. Baltic Sea Environment Proceedings n°180
Hernroth, L. (1985) Recommendations on methods for marine biological studies in the Baltic Sea. Mesozooplankton biomass assessment. The Baltic Marine Biologists, Publ. 10. 32 pp.
Hsieh, C.H. et al. (2011) Eutrophication and warming effects on long-term variation of zooplankton in Lake Biwa. Biogeosciences 8: 593-629.
Jeppesen, E., Jensen, J.P., Søndergaard, M., Lauridsen, T. L., Landkildehus, F. (2000) Trophic structure, species richness and biodiversity in Danish Lakes: changes along a phosphorus gradient. Freshwater Biology 45: 201–218.
Jeppesen, E. et al. (2011) Zooplankton as indicators in lakes: a scientific-based plea for including zooplankton in the ecological qualitya ssessment of lakes according to the European Water Framework Directive (WFD). Hydrobiologia 676: 279-297.
Johansson, S., Hansson, S., Araya-Nunez, O. (1993) Temporal and spatial variation of coastal zooplankton in the Baltic Sea. Ecography 16:167–173.
Keister, J.E., Tuttle, L.B., 2013. Effects of bottom-layer hypoxia on spatial distributions and community structure of mesozooplankton in a sub-estuary of Puget Sound, Washington, U.S.A. Limnol. Oceanogr. 58, 667–680.
Labuce, A., Gorokhova, E. (in press) A script-based workflow to calculate zooplankton community indicator for environmental status assessment in the Baltic Sea. Ecological Informatics.
Ljunggren, L., Sandström, A., Bergström, U., Mattila, J., Lappalainen, A., Johansson, G., Sundblad, G., Casini, M., Kaljuste, O., Eriksson, B.K. (2010) Recruitment failure of coastal predatory fish in the Baltic Sea coincident with an offshore ecosystem regime shift. ICES Journal of Marine Science 67: 1587-1595.
Lucas, J.M. (1982) Combined Shewhart-CUSUM quality control schemes. J Qual Tech 14: 51-59.
Mills, E.L., Green, D.M., Schiavone, A. (1987) Use of zooplankton size to assess the community structure of fish populations in freshwater lakes. N. Am. J. Fish. Manage. 7: 369-378.
Moore, M., Folt, C. (1993) Zooplankton Body Size and Community Structure: Effects of Thermal and Toxicant Stress. Trends in Ecology and Evolution 8: 178-183.
Nowaczyk, A. et al. (2011) Metazooplankton diversity, community structure and spatial distribution across the Mediterranean Sea in summer: evidence of ecoregions. Biogeosciences Discussions 8: 3081-3119.
Pace, M.L. (1986) An empirical analysis of zooplankton community size structure across lake trophic gradients. Limnol. Oceanogr. 31: 45-55.
Pace, M.L., Orcutt, J.D., Jr. (1981) The relative importance of protozoans, rotifers and crustaceans in freshwater zooplankton community. Limnol. Oceanogr. 26: 822-830.
Rajasilta M, Hänninen J, Vuorinen I (2014) Decreasing salinity improves the feeding conditions of the Baltic herring (Clupea harengus membras) during spring in the Bothnian Sea, northern Baltic. ICES Journal of Marine Science 71: 1148-1152.
Rönkkönen, S., Ojaveer, E., Raid, T., Viitasalo, M. (2004) Long-term changes in Baltic herring (Clupea harengus membras) growth in the Gulf of Finland. Canadian Journal of Fisheries and Aquatic Sciences 61: 219-229.
Schindler, D.W. (1987) Detecting ecosystem responses to anthropogenic stress. Can. J. Fish. Aquat. Sci. 44 (Suppl.1): 6-25.
Stemberger, R.S., Lazorchak, J.M. (1994) Zooplankton assemblage responses to disturbance gradients. Can. J. Fish. Aquat. Sci. 51: 2435-2447.
Yan, N.D. et al. (2008) Long-term trends in zooplankton of Dorset, Ontario, lakes: the probable interactive effects of changes in pH, total phosphorus, dissolved organic carbon, and predators. Can. J. Fish. Aquat. Sci. 65: 862-877.
Vezi, M., Downs, C.T., Wepener, V., O’Brien, G., 2019. Response of zooplankton communities to altered water quality and seasonal flow changes in selected river dominated estuaries in KwaZulu-Natal, South Africa. Ecohydrology & Hydrobiology. https://doi.org/10.1016/j.ecohyd.2019.01.005
14 Other relevant resources
No additional information is required for this indicator.