 Acidification
Ocean acidification reduces calcification of shell forming organisms and affects a range of physiological processes especially related to cellular ion regulation. Based on current knowledge, most organisms react negatively to acidification but the responses vary between species and communities. Primary producers may benefit from the improved carbon uptake energetics, whereas negative effects are most common in macrozoobenthos, but potentially also in fish. Acidification may lead to shifts in plankton community composition and alter flows of energy and organic matter partitioning. The Baltic Sea plankton system may shift towards the microbial loop (lower trophic level heterotrophy), with negative effects on food supply to the higher trophic levels. The effects of acidification are strongly modified by interactions with other drivers, including increases in temperature, stratification, deoxygenation and eutro-/oligotrophication.
2.1 Ecological relevance
Ocean acidification threatens calcifying organisms, including clams, mussels and brittle stars (Dupont and Pörtner 2013, Gao et al. 2019). It leads to decreased saturation states of the mineral forms of calcium carbonate, aragonite and calcite, which calcifying organisms generally use in their skeletal structures. Acidification also alters various other physiological processes, especially ones related to cellular ion regulation, and the non-calcifying organisms, including invertebrates and fish, are often equally adversely affected (Thor and Dupont, 2018). Photoautotrophic organisms may also benefit from rising pCO2 levels through improved carbon uptake energetics. Growth of macroalgae generally increases with rising pCO2 (Gao et al., 2019), whereas phytoplankton responses range between communities and species from positive to negative (Gao et al., 2019; Hutchins and Fu, 2017).
Most information on the species responses comes from relatively short-term incubations, and there are major gaps in the knowledge on effects from long-term exposure to acidification (Pansch et al. 2018), and the capacity of species and ecosystems to adapt to rising pCO2 (Riebesell and Gattuso, 2015; Vargas et al., 2017). While attention largely has focused on single-species response to a single factor (Riebesell and Gattuso, 2015), recent studies emphasize the need to account for the effects on communities and habitat structure and complexity (Riebesell and Gattuso, 2015; Sunday et al., 2017), and on multiple stressors including acidification, global warming, increased stratification and de-oxygenation (Jutterström et al., 2014; Riebesell and Gattuso, 2015; Boyd et al., 2018). Warming, for example, intensifies stratification during the warm season leading to increased nutrient limitation, which in some areas might override the effect of increased CO2 supply on phytoplankton (Hutchins and Fu, 2017).
In the Baltic Sea, biota naturally faces large fluctuations in pH, mainly driven by diurnal and seasonal decoupling of primary production and respiration, with ranges far exceeding the atmospheric signal predicted for the next 100 years (e.g. Rossoll et al., 2013). Especially in coastal areas, frequent upwelling events entrain CO2 rich deep water into the surface layer, drawing the surface water pH further down. It is likely that long term acclimation and adaptation of species (Frommel et al., 2013; Pansch et al. 2013a) and adaptation of the communities (Rossoll et al., 2013) to high pCO2 and strong pH fluctuations occur in the Baltic Sea. However, peak pCO2 values in productive estuarine areas could increase to values >4000 µatm, most probably having detrimental effects on e.g. calcifying organisms (Thomsen et al., 2010).
Plankton communities
The Baltic Sea plankton communities appear tolerant to pCO2 levels up to 1000-1400 µatm (Rossoll et al., 2013; Wulff et al., 2018). Phytoplankton and nitrogen fixing cyanobacteria show mainly subtle or no response to acidification (e.g. Kremp et al., 2012; Karlberg and Wulff, 2013; Paul et al., 2015; 2016; 2018). Higher pCO2 levels may affect the plankton community composition e.g. by supporting picoeukaryotic primary producers and small sized microzooplankton and decreasing the diversity of microzooplankton community in summer (Crawfurd et al., 2017; Paul et al., 2015). The mesozooplankton community was found tolerant to acidification in a mesocosm experiment (Lischka et al., 2017). The same was true for offspring production of the copepod Eurytemora affinis (Almén et al., 2016), whereas development of copepod Acartia tonsa nauplii was slower at high pCO2 levels (Vehmaa et al., 2016). There is no available information on the response of gelatinous zooplankton in the Baltic Sea, but the results from nearby areas indicate they respond neutrally or positively to acidification (Havenhand et al., 2019).
Acidification may alter the energy transfer and organic matter partitioning in the planktonic systems. Net primary production has been demonstrated to increase with increasing pCO2 in mesocosm experiment, but without concomitant increase in C export, implying that increased primary production would not counteract the increasing atmospheric CO2 concentration (Paul et al., 2015; Spilling et al., 2016). Some studies indicate that the toxin production of toxic dinoflagellate blooms may increase with acidification (Kremp et al., 2012).
Benthic communities
Calcifying organisms, such as bivalve Limecola balthica (previously Macoma balthica) and blue mussels of genus Mytilus, belong to key species of the benthic communities in the Baltic Sea. All life forms of L. balthica have been shown to react negatively to acidification (Jansson, 2017). Even a small decrease in pH may slow down the growth rate and survival of the larval stage (Jansson, 2017), and metabolic rates and energy demand of adult stage increase with acidification (Jakubowska and Normant-Saremba, 2015; Jansson, 2017). Adult bivalves Mytilus edulis and Arctica islandica appear robust against acidification until 1400-1700 µatm (Hiebenthal et al., 2013; Thomsen et al., 2010; 2013). Calcification and shell growth of M. edulis however may decrease with increasing acidification (Thomsen and Melzner, 2010), and extreme pCO2 levels of > 4000 µatm most likely affect the shell growth (Thomsen et al., 2010; Thomsen and Melzner, 2010). Non-calcifying larval stages of barnacles are generally robust to near future acidification levels (Pansch et al., 2013b). The growth and survival of adult barnacles differs notably between traits, with higher tolerance to high pCO2 levels in barnacles from habitats with high pCO2 fluctuations compared to barnacles from more stable pCO2 habitats (Pansch et al., 2014). Sensitive populations have been shown to only partially acclimate to long-term elevated pCO2, with significant effects on reproduction (Pansch et al., 2018).
Negative impacts of acidification on adult bivalve growth largely occur through increasing energy demand for maintaining the physiological balance (Jansson, 2017; Thomsen and Melzner, 2010). It is suggested that sufficient food supply would mediate the ability of calcifying species to cope with rising pCO2 levels (Thomsen et al., 2010; Pansch et al., 2014). Effects of acidification on mussel calcification can also be counteracted by macrophyte-driven elevation of mean pH and temporal refugee from acidification due to fluctuations in the carbonate system in dense algae and seagrass habitats (Wahl et al., 2018). Growth of seagrass Zostera marina slightly benefits from the rising pCO2 concentration (Eklöf et al., 2012; Takolander et al., 2017), whereas responses of bladder wrack Fucus vesiculosus differ between studies from negative to weakly positive (Takolander et al., 2017; Graiff et al., 2015). A review of the current knowledge indicates that red algae respond positively to acidification, whereas for green algae both positive and negative responses have been recorded (Takolander et al., 2017). The community level response of microvegetation to acidification further depends on the relative growth responses of Fucus vesiculosus and Zostera marina and their epiphytes (Wahl et al., 2018).
Fish
Commercially and ecologically important fish species, cod and herring, potentially respond negatively to acidification in the Baltic Sea. The fertilization success of cod in laboratory experiments was unaffected by pCO2 <1360 µatm (Frommel et al., 2010), and egg stages of both herring and cod have been found robust to high levels of pCO2 (Franke and Clemmesen, 2011; Frommel et al., 2013). Response of larval cod to acidification experiments has ranged from tolerance to high pCO2 levels (~3200 µatm; Frommel et al., 2013) to doubling of daily mortality at pCO2 ~1100 µatm (Stiasny et al., 2016). Acidification may reduce the protein synthesis of the herring embryos implying reduction of larval growth (Franke and Clemmesen, 2011). Fish populations may be further hampered by the effects of acidification on the food web: a review of the current knowledge indicates that acidification drives the energy flow towards microbial loop, reducing the energy supply of higher trophic levels, zooplankton and fish (Havenhand et al., 2019).
2.2 Policy relevance
Increasing CO2 in the atmosphere is the major driver for acidification of marine waters. The 2021 HELCOM Baltic Sea Action Plan reiterated that the effects of climate change on the Baltic Sea are already evident, and that climate change will continue to have an increasingly significant impact on the Baltic Sea ecosystem, necessitating even more stringent action. The BSAP emphasized the need for continued research and adaptive management to mitigate the effects and strengthen the resilience of the Baltic Sea to climate change by reducing other human pressures on the ecosystems and also underscored the need to further adapt HELCOM’s policies and Recommendations to take into account the effects of climate change. The BSAP also includes action HT5 on developing a strategic approach to ocean acidification for the Baltic Sea with first steps addressing the knowledge gaps by 2025.
The indicator also addresses the following qualitative descriptors and criteria of the MSFD for determining good environmental status:
- D1C6 The condition of the habitat type, including its biotic and abiotic structure and its functions (e.g. its typical species composition and their relative abundance, absence of particularly sensitive or fragile species or species providing key function, size structure of species), is not adversely affected due to anthropogenic pressures.
- D6C5 The extent of adverse effects from anthropogenic pressures on the condition of the habitat type, including alteration to its abiotic and biotic functions (e.g. its typical species composition and their relative abundance, absence of particularly sensitive or fragile species or species providing key function, size structure of species), does not exceed a specified proportion of the natural extent of the habitat type in the assessment area.
The indicator further addresses MSFD D5 “Human-induced eutrophication is minimised, especially adverse effects thereof, such as losses in biodiversity, ecosystem degradation, harmful algae blooms and oxygen deficiency in bottom waters”. The relationship of the indicator with eutrophication is dual: Firstly, eutrophication intensifies pCO2 fluctuations and leads to seasonal and subsurface acidification, and secondly, acidification may benefit primary production and hence intensify eutrophication.
The indicator is also relevant for United Nations’ Sustainable Development Goal 14 Target ‘‘Minimize and address the impacts of ocean acidification, including through enhanced scientific cooperation at all levels”. The policy relevance is indicated in Table 1.
Table 1. Policy relevance of the indicator.
| Baltic Sea Action Plan (BSAP) | Marine Strategy Framework Directive (MSFD) | |
| Fundamental link | Segment: Horizontal topics, theme: Climate change
|
Descriptor 1 Pelagic habitat.
|
| Complementary link | Segment: Biodiversity
Goal: “Baltic Sea ecosystem is healthy and resilient”
Segment: Eutrophication Goal: “Baltic Sea unaffected by eutrophication”
|
Descriptor 5 Eutrophication.
Descriptor 7 Hydrographical conditions.
|
| Other relevant legislation: |
|
|
2.3 Relevance for other assessments
At present, acidification is not considered as part of the holistic assessment but the topic and report will be used to develop key interactions with relevant topics such as eutrophication or pelagic habitats under the relevant thematic assessments.
3 Threshold values
There are no universal thresholds for acidification parameters that apply to all organisms, but two main aspects of acidification should be considered, hypercapnia and decalcification. It should also be mentioned that increasing pCO2 may stimulate productivity, thereby favouring some species over others, which may alter the community compositions and food-web interactions (Havenhand et al., 2019). However, our current knowledge on such indirect effects is limited and will not be considered here.
Hypercapnia is the elevation of pCO2 in the environment, which may cause intracellular pH to decrease, potentially reaching critical levels where essential physiological cell functions cease, or may increase energy costs of maintaining relatively constant intracellular pH, changing the fitness and competition between organisms and thereby altering communities. As indicated in Section 2.1, these responses are variable among species and even among stages, e.g. juvenile stages appear to be more sensitive to hypercapnia. Another important issue is the length of exposure to high pCO2 levels. Whereas most organisms do not exhibit direct pathological effects to elevated pCO2 levels in their present acidification regime, the overall shifting baseline of decreasing pH and increasing pCO2 may potentially lead to detrimental acidification levels precipitating more acute physiological effects. However, establishing critical thresholds of pCO2 for Baltic Sea marine species poses a scientific challenge that needs to be resolved.
Acidification alters the speciation of the carbonate system, leading to lower the saturation states for the two calcium carbonate polymorphs that marine organisms use to construct their shells or tests – aragonite and calcite (Doney et al., 2009). The saturation state for these two forms are expressed by their Ω-values, with values <1 indicating undersaturation, which may cause decalcification of calcifying organisms. Except for the Gulf of Bothnia, basins in the Baltic Sea are typically oversaturated in calcium carbonate during the productive period, when production upregulate pH, albeit most basins also display undersaturated conditions during winter. Most marine organisms are still capable of calcifying even if Ω<1 due to the organic matrix of their skeletons and tests (Melzner et al., 2013). Consequently, Ω=1 cannot be considered a critical threshold for decalcification. Nevertheless, calcifying organisms in waters with undersaturated conditions do not exploit their full growth potential, e.g. shells from blue mussels are smaller in waters with low pH and Ω –values less than 1 (Melzner et al., 2011; Gazeau et al., 2010). As for pCO2, establishing critical thresholds for Ω-values is a scientific challenge that should be addressed.
3.1 Setting the threshold value(s)
As indicated in Section 3, setting threshold values for pCO2 and Ω remains a scientific challenge and is not part of the current indicator approach. An elements indicator is an indicator that chronicles an important processes or factor of direct relevance to the marine environment. There are no threshold values applied in this indicator at this stage and potentially threshold values may not be directly applicable to an Element indicator. The Element indicator acts dominantly as a fact sheet to which other relevant topics can reference.
4 Results and discussion
4.1 Status assessment
Marine ecosystems exhibit variations in parameters of the carbonate system on daily, seasonal and interannual scales (Duarte et al., 2013), with ranges exceeding 1 pH unit in poorly buffered systems like parts of the Baltic Sea (Carstensen and Duarte, 2019). Such variations can be natural and organisms have adapted to them. Similarly, there are large gradients in the carbonate system parameters across the Baltic Sea, where pH in the surface gradually increases from mean levels around 7.7 in the poorly buffered Bothnian Bay to 8.1 in the Baltic Proper towards the Kattegat (Table 2). On average, the Bothnian Bay and the Bothnian Sea are presumably sources of atmospheric CO2, whereas the remaining parts presumably operate as CO2 sinks. pH is typically higher during summer when production dominates over respiration, leading to a net uptake of CO2, and lower during winter when respiration dominates over production, leading to a net release of CO2. The seasonal variability in pH is largest in the Gulf of Finland (range = 0.84) and lowest in the Kattegat (range = 0.17), whereas seasonal variability in pCO2 is largest in the Baltic Proper (range = 363 µatm) and lowest in the Kattegat (range = 148 µatm). In bottom waters where respiration dominates, pH values are lower than in surface waters and pH below 7 is not uncommon in oxygen depleted zones. Correspondingly, pCO2 typically increases with depth, reaching as high as 3-4000 µatm in the Landsort Deep and Gotland Basin.
Table 2. Mean level and seasonal variability, given as range of monthly means, in surface pH and pCO2 (in µatm) assessed by the BALTSEM model (Gustafsson and Gustafsson 2020) for a period with low anthropogenic influence, compared to more recent conditions (2000-2017) assessed from monitoring data of pH and AT at representative HELCOM stations. Note that not all basins had sufficient data to determine all the parameters of the carbonate system and that model results aggregated to less resolution than the HELCOM Assessment units (as indicated by footnotes) reflecting the sparse spatial coverage of the observations.
| Basin | Historical conditions (1850-1900) | Contemporary conditions | ||||||
| Mean | Seasonal range | Mean | Seasonal range | |||||
| pH | pCO2 | pH | pCO2 | pH | pCO2 | pH | pCO2 | |
| Bothnian Bay1 | 7.88 | 351 | 7.73-7.97 | 279-503 | 7.71 | 454 | 7.62-7.92 | 284-545 |
| Bothnian Sea2 | 8.06 | 307 | 7.96-8.18 | 225-360 | 7.96 | 383 | 7.69-8.24 | 173-630 |
| Baltic Proper3 | 8.15 | 303 | 8.09-8.27 | 218-369 | 8.13 | 350 | 7.91-8.42 | 165-528 |
| Gulf of Finland | 8.07 | 349 | 7.87-8.30 | 193-537 | 8.07 | 7.67-8.51 | ||
| Gulf of Riga | 8.20 | 345 | 8.07-8.31 | 250-483 | ||||
| Bornholm Basin | 8.16 | 296 | 8.09-8.27 | 215-376 | 8.10 | 375 | 7.93-8.28 | 236-519 |
| Arkona Basin | 8.16 | 293 | 8.08-8.27 | 215-370 | 8.08 | 345 | 7.92-8.44 | 249-445 |
| Danish Straits4 | 8.14 | 291 | 8.04-8.31 | 181-378 | ||||
| Kattegat | 8.13 | 292 | 8.06-8.32 | 179-359 | 8.07 | 359 | 7.98-8.15 | 284-432 |
1Includes Bothnian Bay and Northern half of The Quark
2Includes Bothnian Sea, Southern half of The Quark and Åland Sea
3Includes Eastern and Western Gotland Basin, and Northern Baltic Proper
4Includes The Sound, Great Belt, Kiel Bay and Bay of Mecklenburg
Thus, there are natural spatial gradients in pH and other carbonate system parameters across the Baltic Sea. These gradients are mainly linked to salinity gradients, but also to differences in productivity and thus CO2 uptake by autotrophs. Temporal variations are on the other hand predominantly controlled by the metabolic balance between production and respiration, although hydrology also plays a role in oligotrophic systems (Carstensen and Duarte, 2019). Temporal variability in pH increases with eutrophication in high-latitude systems, where production and respiration are seasonally decoupled, and in stratified systems, where production and respiration further are spatially decoupled. Thus, in order to assess the ecosystem effect of acidification, it is necessary to consider deviations from the natural mean level and variability, and to combine these deviations with assessments of potential consequences for the naturally occurring biota as well as their interactions with repercussions for ecosystem functioning (Havenhand et al., 2019).
Added value as eutrophication indicator
Apart from the fact that carbonate system parameters, in particular pH, provide the most direct indicator for acidification, monitoring of the carbonate system also provides an additional powerful indicator of eutrophication. A generally accepted definition of the term “eutrophication” was given by Nixon (1995) who considers eutrophication as “an increase in the rate of supply of organic matter to an ecosystem”. Regarding the autochthonous supply, hence, biomass production, observations of the surface water carbonate system constitute an ideal tool to quantify organic matter production rates and thus monitor eutrophication. This was demonstrated by Schneider and Müller (2018) who, for the base case year 2009, used high resolution surface water pCO2 records to calculate the net community production. The latter corresponds to the amount of organic matter that has the potential to cause oxygen depletion and hydrogen sulphide formation after sinking into deeper water layers. The production rates determined for the Baltic Sea proper on the basis of the pCO2 data exceeded the estimates obtained from the traditional nutrient approach by up to 70 %. The reasons for this discrepancy are not fully understood, but can partly be explained by non-Redfield production stoichiometry, in particular during the mid-summer cyanobacteria bloom. It has to be emphasized that the oxygen demand at depth resulting from organic matter decomposition is mainly linked to the oxidation of carbon, and thus carbon-based productivity estimates provide the closest link to oxygen deficiency.
4.2 Trends
Ocean acidification due to increasing atmospheric CO2 concentrations causes a predictable decline of pH (~0.02 per decade) and increase of pCO2 (~2 µatm per year), whereas coastal systems experience changes over time which can exceed those of the ocean significantly (Duarte et al., 2013; Carstensen and Duarte, 2019). The Baltic Sea is no exception to this (Figure 2), where first eutrophication apparently led to increasing pH in surface waters due to enhanced uptake of CO2 and later nutrient reduction caused pH to decline. Thus, pH changes in the Baltic Sea are tightly coupled to eutrophication/oligotrophication.
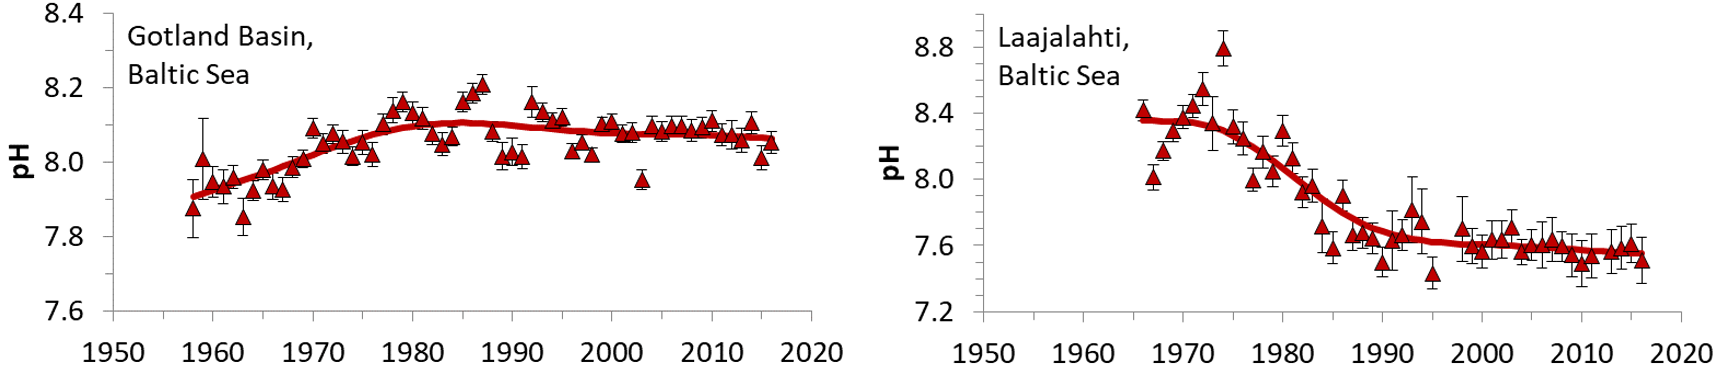
Figure 2: Trends in pH estimated from monitoring data from the Gotland Basin and Laajalahti Bay near Helsinki. From Carstensen and Duarte (2019).
Another process influencing the carbonate system is the change in AT. AT inputs change with land use and enhanced weathering from climate change (Raymond and Cole, 2003). This is also observed for the Baltic Sea (Figure 3).
Figure 3: Flow-weighted concentration of AT in Swedish rivers (www.slu.se) and Danish streams discharging into Skive Fjord. From Duarte et al. (2013) and Carstensen et al. (2018).
Despite the increased AT buffering acidification, pH is decreasing and pCO2 is increasing significantly over time in some Danish estuaries (Figure 4). The pH declines are ~2.5 times faster than ocean acidification (OA) and caused by the combination of increasing atmospheric CO2 (~1 OA trend), reduced nutrient input (~1 OA trend) and warming (~0.5 OA trend) (Carstensen et al., 2018). However, it should be stressed that these trends do not uniformly apply to all coastal areas and the open Baltic Sea.
Figure 4: Trends in pH and pCO2 in two Danish estuaries. From Carstensen et al. (2018).
For the major basins, trends in AT have recently been statistically evaluated based on a compilation of all available AT -data, including the CANIBAL data, the SMHI data base, the BONUS Baltic-C data compilation and the FMI monitoring data (Müller et al., 2016). The evaluation shows that AT measurements since 1995, where standard reference materials for AT and dissolved inorganic carbon (CT) became available (Dickson et al., 2007), can be very reliably used for a trend analysis. The authors show an increase of AT of ~70 µmol kg-1 between 1995 and 2014, corresponding to an annual increase of 3.4 µmol kg-1 yr-1 (Figure 5). The highest trends of 7.4 µmol kg-1 yr-1 was observed in the Gulf of Bothnia at a salinity of 3, which represents an increase of almost 20% over the same time frame.
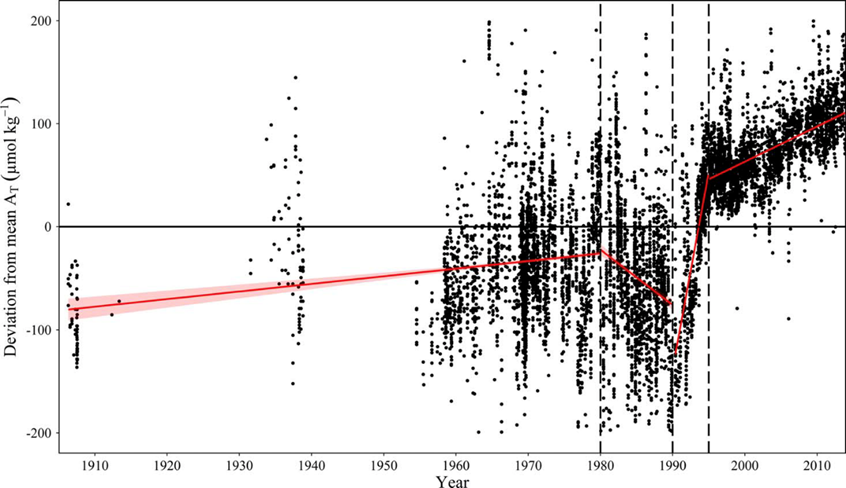
Figure 5: Temporal AT trends in the Central Baltic Sea from 1900 to 2015. Displayed are deviations (dAT) of observed AT from mean AT values for individual salinity intervals of 0.2 (over a range from 6.5-7.7). From Müller et al. (2016).
Müller et al. (2016) further demonstrate that for the central Baltic Sea, the observed AT trend has the potential to largely compensate for the pH decrease due to rising atmospheric CO2 levels during the same time frame, to increase the storage potential for carbon dioxide, and to almost entirely mitigate the reduction of carbonate saturation (ΩCaCO3), (Figure 6).
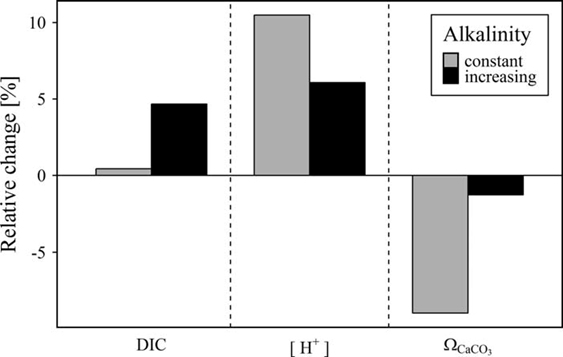
Figure 6: Combined influence of simultaneous changes in atmospheric pCO2 and seawater AT on dissolved inorganic carbon (DIC), proton concentration [H+], and calcium carbonate saturation (ΩCaCO3) in the Central Baltic Sea from 1995 to 2014. Based on an atmospheric pCO2 increase from 360 to 400 µatm, the relative changes in DIC, [H+], and ΩCaCO3 were computed for two AT scenarios: The observed AT trend of 3.4 µmol kg-1 yr-1 was taken into account (black bars) and the AT was assumed to be constant at mean AT (grey bars). From Müller et al. (2016).
Due to the larger trend of up to 7.4 µmol kg-1, these effects are even stronger in the Northern Basins, in particular the Bothnian Bay where the increase in AT could completely compensate for acidification. However, with the lack of other carbonate system parameters measured simultaneously, the real effect of the observed AT trend cannot be addressed.
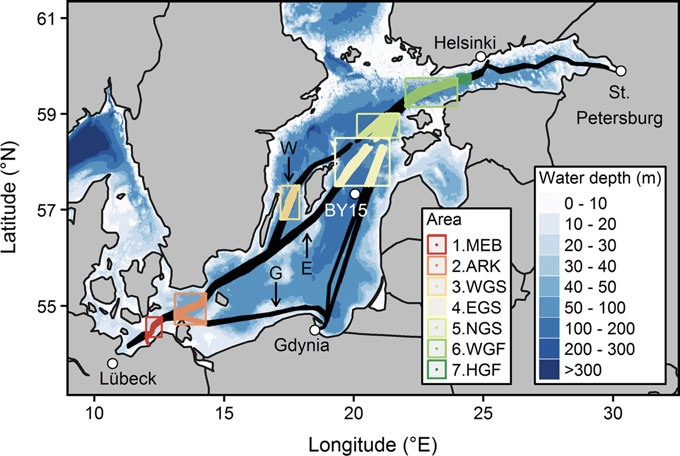
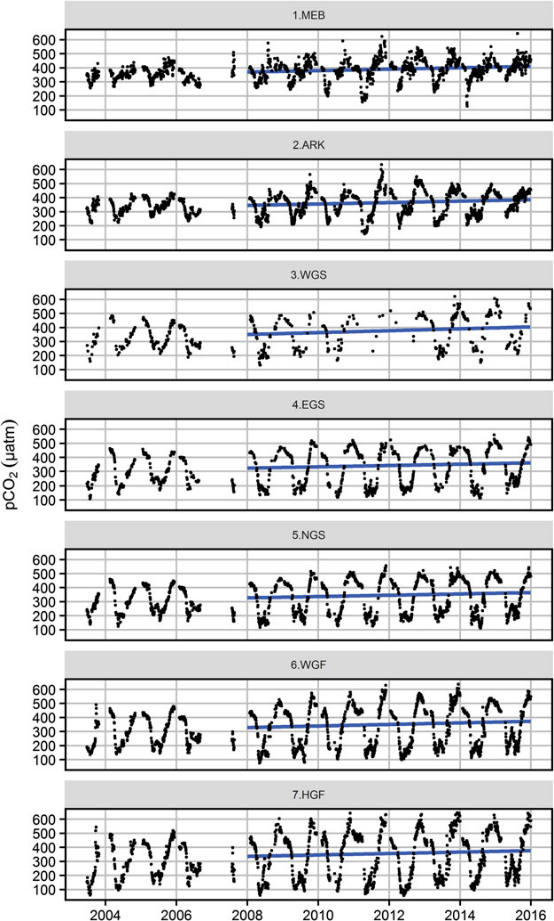
Figure 7: Upper figure: Main route of the commercial ship Finnmaid, on which pCO2 has been monitored from 2003 in a cooperation between IOW and SYKE. Seven sub-regions are defined: MEB Mecklenburg Bight, ARK Arkona Sea, WGS Western Gotland Sea, EGS Eastern Gotland Sea, NGS Northern Gotland Sea, WGF Western Gulf of Finland and HGF Gulf of Finland, approach to Helsinki. Lower figure: pCO2 data and trendline for the time interval 2008-2015. The annual increase in pCO2 varies from 4.6 to 6.1 µatm yr-1, vastly exceeding the atmospheric increase of ~ 2 µatm yr-1.
For the assessment of the carbonate system in surface waters, the measurement of pCO2 through water-air equilibration coupled to infrared spectroscopy developed into an internationally used approach (Dickson et al., 2007), which led to the SOCAT database for surface water pCO2 (Bakker et al., 2016). Continuous measurements have been recorded on the commercial vessel Finnmaid since 2003 and recently been compiled in Schneider and Müller (2018). Surface water pCO2 trends amounted 4.6-6.1 µatm yr-1 in the individual basins, exceeding the atmosphere pCO2 increase (approximately 2 µatm yr-1) by a factor 2-3 (Figure 7), with reasons currently being unclear. This shows the complexity of the processes that control the carbonate system and highlights the necessity to monitor pH. Surface monitoring of pCO2 is currently initiated on several other commercial vessels as action of the BONUS Project BONUS INTEGRAL, see https://www.io-warnemuende.de/integral-home.html.
4.3 Discussion text
The Baltic Sea is experiencing acidification to a variable degree depending on location. Observed carbonate system parameters display trends over decadal time-scales – trends that depend on several different factors such as the increasing atmospheric CO2 level, changes coupled to eutrophication/oligotrophication, as well as changes in AT. The impact of acidification in the Baltic Sea is so far small, but unless CO2 emissions are reduced, the potential future effects on the marine ecosystem are considerable (Section 2.1). Our knowledge on this environmental problem is however scattered among few sites, where data are available and studies have been made.
5 Confidence
The confidence in assessing status and trends of carbonate system parameters depends on the spatial and temporal coverage of data as well as the accuracy of measurements. Measurement of carbonate system parameters is straightforward, although precise pH measurements is a challenge (see Section 9.2). Long-term time-series of pH and AT are available for several open water stations and a few coastal sites, but the limited coverage of monitoring data both spatially and temporarily affects the confidence in assessing status and trends of acidification development in the Baltic Sea on a broader scale.
The confidence of the assessment is overall moderate but can be further detailed as:
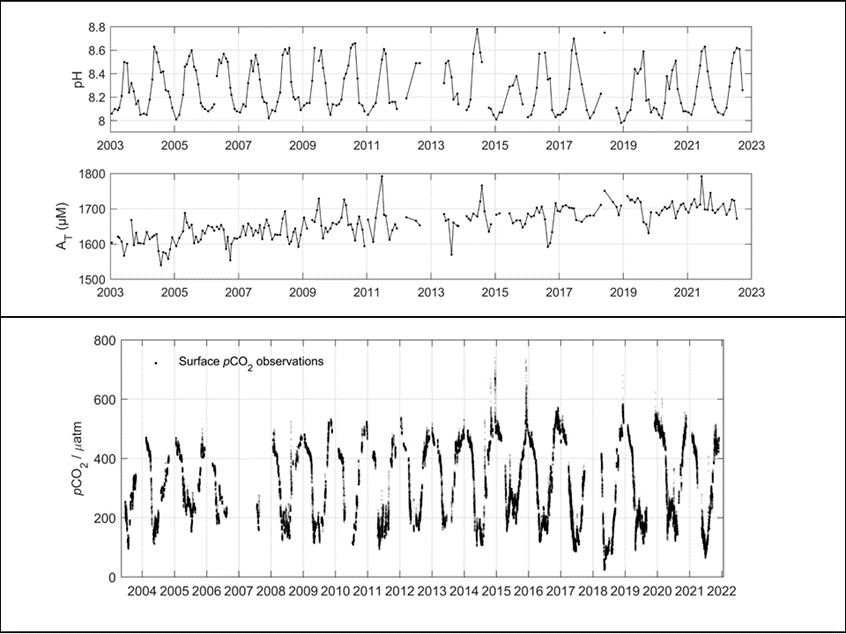
- High in the central Baltic Sea where long-term measurements of pH and AT exist, as well as continued pCO2 measurements recorded on the Finnmaid vessel (Figure 1 and 7).
- Moderate in the Kattegat, the Danish Straits, and the major gulfs (i.e., the Gulf of Bothnia, Finland, and Riga, respectively), where in particular AT has been measured more sporadically, and where pCO2 measurements are few and scattered or non-existent.
The main driver of acidification is the release of anthropogenic CO2. The oceans currently absorb ~30% of our emissions (Friedlingstein et al., 2022), leading to an average pH decrease of ~0.02 per decade in the open ocean. In coastal seas, pH trends are often observed to differ largely from the open ocean trends, due to the influence of various other drivers, such as changes in eutrophication/oligotrophication and AT (Carstensen and Duarte, 2019). Deviations from open ocean pH trends are certainly observed in the Baltic Sea as well, for reasons that are not yet fully understood (Section 4.2).
AT in different areas of the Baltic Sea depends on the relative proportions of ocean water and freshwater, as well as the AT of individual rivers. Ocean water AT usually differs from river water AT, which means that linear AT-salinity relations can be observed along surface water salinity gradients (e.g. Müller et al., 2016). For that reason, changes in salinity also leads to changes in AT and in extension pH. River loads of AT can change over time both as a result of changes in precipitation and runoff, but also as a result of changing weathering rates which influence riverine AT concentrations. Surface water AT is also directly influenced by depositions of acids, such as sulphuric acid (Omstedt et al., 2015).
Changes in nutrient loads and eutrophication status can also cause significant pH trends over time (Figure 2). A more eutrophic state generally leads to larger seasonal pH variations, with higher pH maxima in summer and lower pH minima in winter (Gustafsson and Gustafsson, 2020). Pressures and activities are indicated in Table 3.
Table 3. Brief summary of relevant pressures and activities with relevance to the indicator.
| | General | MSFD Annex III, Table 2a |
| Strong link | Pressures:
Activities:
|
Pressures (Table 2a)
Physical
Substances, litter and energy
Activities (Table 2b) Production of energy
Cultivation of living resources
Transport
Urban and industrial uses
|
| Weak link |
7 Climate change and other factors
Increasing atmospheric CO2 on one hand drives climate change, but is on the other hand also the main driver of large-scale and long-term pH trends – for that reason, ocean acidification is commonly referred to as “the other CO2 problem” (e.g. Doney et al., 2009). Depending on emission scenario, the CO2-induced acidification in the Baltic Sea can be expected to lead to a pH decrease in a range 0.1-0.3 units by year 2100 compared to present-day values (Gustafsson and Gustafsson, 2020). But, as described in Sections 4 and 5, other processes such as eutrophication and changing AT can lead to pH trends in coastal seas that significantly differ from the open ocean acidification trend (Duarte et al., 2013; Carstensen and Duarte, 2019).
Runoff is projected to increase in the northern Baltic Sea, resulting in decreased AT and in extension pH due to the lower salinity. A higher atmospheric CO2 level could on the other hand enhance weathering in Baltic Sea catchment areas, leading to increasing riverine AT . The net effect on AT is currently not known (HELCOM, 2021). Organic matter production and mineralization together with changes in temperature and stratification control seasonal surface water pCO2 and pH patterns. Eutrophication leads to larger seasonal variations, i.e., higher pH maxima in summer and lower pH minima in winter, while mean pH is only affected to a smaller degree (Gustafsson and Gustafsson, 2020). Reduced nutrient loads and primary production following BSAP could thus on one hand lead to lower pH peaks in summer, but on the other hand also a less pronounced pH decrease in winter.
Nevertheless, sensitivity experiments indicate that the development of atmospheric CO2 will dominate long-term pH trends in open Baltic Sea waters during the 21st century (Gustafsson and Gustafsson, 2020). The atmospheric CO2 level could in a worst-case scenario exceed 950 ppm by year 2100, i.e., more than a doubling of today’s level. It is in such a case highly unlikely that the CO2-induced acidification can be counteracted by other processes in the Baltic Sea (Gustafsson and Gustafsson, 2020).
Several processes influence pH and the marine carbonate system in coastal seas, but in the long run the atmospheric CO2 level is likely to dominate over all other processes unless emissions are mitigated. The impact of acidification on populations of marine organisms in the Baltic Sea is so far small. In a worst-case emission scenario, detrimental effects could however be anticipated in species that cannot adapt to a warmer and more acidified Baltic Sea, and furthermore plankton community composition and food-web interactions could be altered.
It is a scientific challenge to set threshold values regarding both hypercapnia and decalcification effects (Section 3). The reason for this is the large variations between species and also within species depending on e.g. age class and adaption. Ecosystem effects of acidification can further be strongly modified by interactions with other drivers, such as changes in temperature, salinity, stratification, and oxygen conditions. Several studies have for those reasons emphasized the need for a multi-stressor approach on community and habitat levels rather than studies of single-species response to a single stressor (e.g. Havenhand, 2011).
It is important to improve the temporal and spatial monitoring of acidification parameters to be able to identify key areas where acidification effects are likely to become a problem. In such areas, reducing the impact of other environmental stressors will become increasingly important if it is not possible to mitigate the main driver of acidification, i.e., the increasing atmospheric CO2 level.
Future work or improvements needed
Our knowledge of the development of acidification in the Baltic Sea is currently limited to a few sites. To improve and broaden our knowledge, AT and pH should be included as standard variables in the monitoring programs of all contracting parties. In addition, the measurement procedures for pH needs to be homogenized to ensure high quality data (see also Section 9.2-3).
AT has showed increasing trends in the Baltic Sea over the past decades, but the reason is not known (Müller et al., 2016). Furthermore, AT budgets have revealed that riverine and internal AT sources are not sufficient to explain the observed AT concentrations in the Baltic Sea, indicating the existence of a significant “unresolved AT source“ (Gustafsson et al., 2019a, b). Recent findings imply that dissolution of calcium carbonate mobilized via coastal and seabed erosion can significantly contribute to AT generation, which could largely explain the unresolved AT source (Wallmann et al., 2022). This hypothesis needs further testing.
9.1 Scale of assessment
The entire Baltic Sea is covered by the assessment. Currently no assessment is made directly utilising the HELOCM Scales of assessment, but relevant sub-basins (i.e. HELCOM Scale 2 assessment units) are referred to.
9.2 Methodology applied
The carbonate system is described by the four parameters CT, AT, pH, and pCO2. Measurement of all four parameters is straightforward (Dickson et al., 2007). pCO2 and CT are not explicitly mentioned in the COMBINE General Guidelines for monitoring of the Baltic Sea (HELCOM, 2006), but straightforward SOPs exist (Dickson et al., 2007; Pfeil et al., 2013), and the methodological approach does not differ from that for open ocean waters. For AT and pH, general guidelines exist and have been updated in 2017. Yet, pH remains a challenging parameter as the generally used and still recommended potentiometric measurement would require the use of buffer solutions at ionic strength close to that of the measured sample. Also, defining appropriate standards is problematic. Recent advances in spectrophotometric pH measurements in brackish waters (Müller et al., 2018a; Douglas and Byrne 2017; Müller et al., 2018b; Müller and Rehder., 2018) suggest that this method will soon be the most accurate and precise method for pH detection also in brackish waters. At least one instrument is currently commercially available, a second to be launched soon. Thus, due to its higher accuracy and superior long-term traceability, the progress in theory and technology of this method for brackish water applications should be closely followed.
AT and pH are not consistently monitored across the Baltic Sea (Figure 8), and data have been measured and reported with varying precision and quality. Many areas only have a few spot samples, particularly in the coastal zone, whereas longer time series exist for the open Baltic Sea. The amount of pH observations increased from the 1970s and peaked in the early 2000s, reaching a contemporary level of ~1500 profiles per year (Figugre 9). This is substantially lower than the similar data amount for nutrients, chlorophyll, and oxygen. A consequence is that acidification trends can be assessed only for the regular open water stations and a limited amount of coastal stations.
Historical data from various monitoring programs have been collected and quality assured in the Baltic Environmental Database (BED). This work has been carried out as part of a number of different research projects. Although the precision of pH measurements is generally low (typically 0.1 pH unit), trends considered are generally much larger (Figure 2) and based on many observations, which partly remediates the poor precision and accuracy of the pH data.
For the open Baltic Sea, long-term traceable monitoring of pH as the prime variable of acidification with highest possible precision and accuracy has not been achieved. One of the main reasons for this shortcoming was the lack of availability of a method for long-term traceable measurement of pH at a resolution reflecting gradual nature in brackish water systems. Recent advances in technology now allow to overcome this problem.
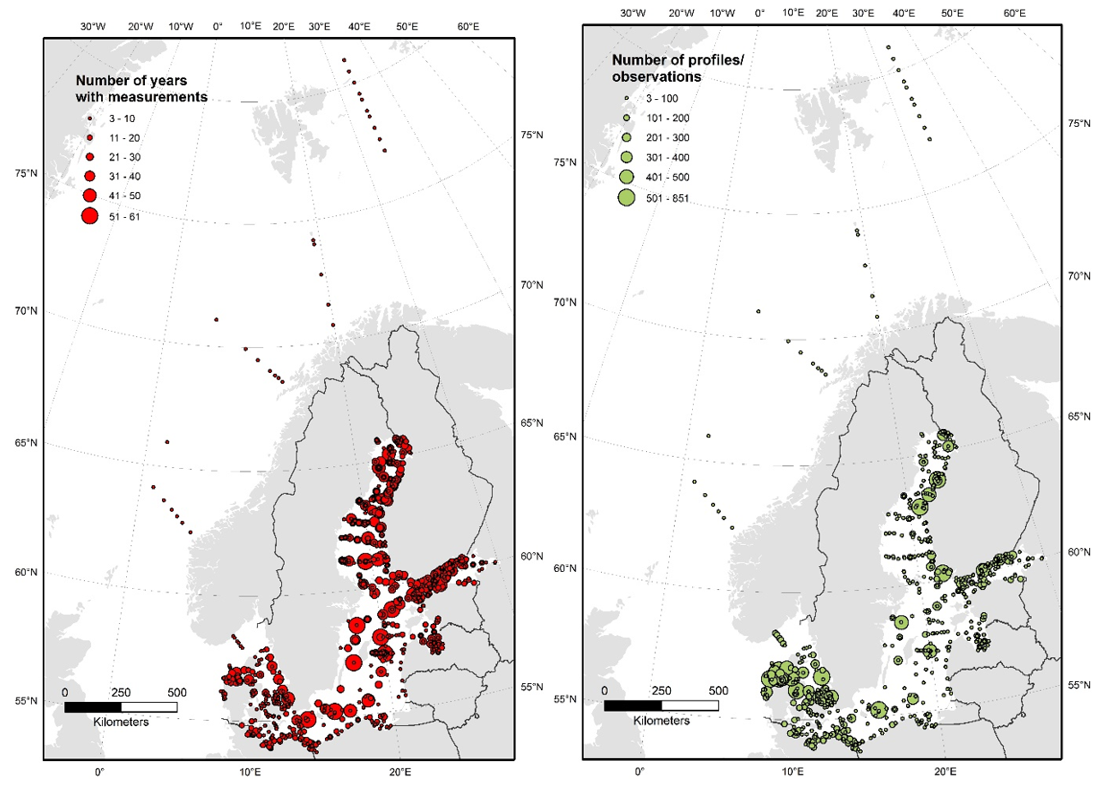
Figure 8: Length of time series number of profiles/observations of pH across the Baltic Sea. Data from ICES and Danish monitoring program, compiled by the TRIACID project.
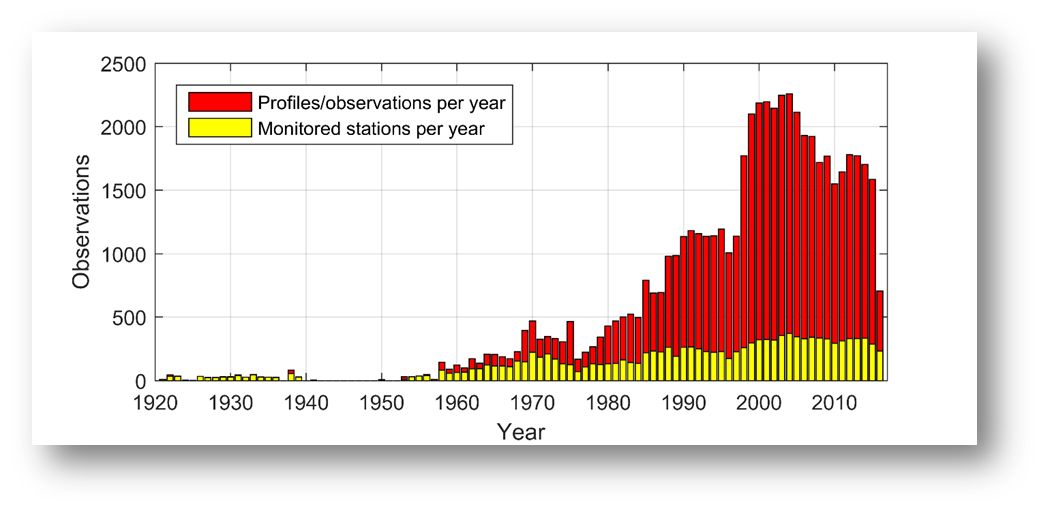
Figure 9: Amount of profiles/observations of pH over time. Data from ICES and Danish monitoring program, compiled by the TRIACID project.
9.3 Monitoring and reporting requirements
AT and pH should be monitored as standard hydrochemistry variables in the monitoring programs of contracting parties. AT and pH are low-cost measurements that are fairly simple to analyse and therefore, adding these to existing monitoring programs will only marginally increase the cost of monitoring. The measurement procedures for pH should be further homogenized and mean quality of data should be improved.
Bo G. Gustafsson1,2, Henry Bittig3, Jacob Carstensen4, Vivi Fleming5, Erik Gustafsson1, Laura Hoikkala5,6, Gregor Rehder3, Jukka Seppälä5
1 Baltic Nest Institute, Baltic Sea Centre, Stockholm University, Stockholm, Sweden
2 Tvärminne Zoological Station, University of Helsinki, Hanko, Finland
3 Leibniz Institute for Baltic Sea Research Warnemünde (IOW), Rostock, Germany
4 Department of Ecoscience, Aarhus University, Roskilde, Denmark
5 Marine Research Centre, Finnish Environment Institute, Helsinki, Finland
6 Helsinki University Center for Environment, University of Helsinki, Helsinki, Finland
This study was supported by two projects funded by the Nordic Council of Ministers: the TRIACID project (grant no. 170019) and the OMAI project (grant no. 190009).
This version of the HELCOM core indicator report was published in April 2023:
The current version of this indicator (including as a PDF) can be found on the HELCOM indicator web page.
No earlier versions of this indicator currently exist.
Almén, A.-K., Vehmaa, A., Brutemark, A., Bach, L., Lischka, S., Stuhr, A., Furuhagen, S., Paul, A., Bermúdez, J.R., Riebesell, U., Engström-Öst, J., 2016. Negligible effects of ocean acidification on Eurytemora affinis (Copepoda) offspring production. Biogeosciences 13, 1037–1048. https://doi.org/10.5194/bg-13-1037-2016
Bakker, D.C.E., Pfeil, B., Landa, C.S., Metzl, N., O’Brien, K.M., Olsen, A., Smith, K., Cosca, C., Harasawa, S., Jones, S.D., Nakaoka, S., Nojiri, Y., Schuster, U., Steinhoff, T., Sweeney, C., Takahashi, T., Tilbrook, B., Wada, C., Wanninkhof, R., Alin, S.R., Balestrini, C.F., Barbero, L., Bates, N.R., Bianchi, A.A., Bonou, F., Boutin, J., Bozec, Y., Burger, E.F., Cai, W.-J., Castle, R.D., Chen, L., Chierici, M., Currie, K., Evans, W., Featherstone, C., Feely, R.A., Fransson, A., Goyet, C., Greenwood, N., Gregor, L., Hankin, S., Hardman-Mountford, N.J., Harlay, J., Hauck, J., Hoppema, M., Humphreys, M.P., Hunt, C.W., Huss, B., Ibánhez, J.S.P., Johannessen, T., Keeling, R., Kitidis, V., Körtzinger, A., Kozyr, A., Krasakopoulou, E., Kuwata, A., Landschützer, P., Lauvset, S.K., Lefèvre, N., Lo Monaco, C., Manke, A., Mathis, J.T., Merlivat, L., Millero, F.J., Monteiro, P.M.S., Munro, D.R., Murata, A., Newberger, T., Omar, A.M., Ono, T., Paterson, K., Pearce, D., Pierrot, D., Robbins, L.L., Saito, S., Salisbury, J., Schlitzer, R., Schneider, B., Schweitzer, R., Sieger, R., Skjelvan, I., Sullivan, K.F., Sutherland, S.C., Sutton, A.J., Tadokoro, K., Telszewski, M., Tuma, M., van Heuven, S.M.A.C., Vandemark, D., Ward, B., Watson, A.J., Xu, S., 2016. A multi-decade record of high-quality fCO2 data in version 3 of the Surface Ocean CO2 Atlas (SOCAT). Earth System Science Data 8, 383–413. https://doi.org/10.5194/essd-8-383-2016
Boyd, P.W., Collins, S., Dupont, S., Fabricius, K., Gattuso, J.-P., Havenhand, J., Hutchins, D.A., Riebesell, U., Rintoul, M.S., Vichi, M., Biswas, H., Ciotti, A., Gao, K., Gehlen, M., Hurd, C.L., Kurihara, H., McGraw, C.M., Navarro, J.M., Nilsson, G.E., Passow, U., Pörtner, H.-O., 2018. Experimental strategies to assess the biological ramifications of multiple drivers of global ocean change—A review. Global Change Biology 24, 2239–2261. https://doi.org/10.1111/gcb.14102
Carstensen, J., M. Chierici, B. Gustafsson and E. Gustafsson, 2018., Long-term and seasonal trends in estuarine and coastal carbonate systems. Global Biogeochemical Cycles, 32: 497-513. https://doi:10.1002/2017GB005781
Carstensen, J. and C. M. Duarte, 2019. Drivers of pH Variability in Coastal Ecosystems. Environmental Science and Technology, 53: 4020-4029. https://doi:10.1021/acs.est.8b03655
Crawfurd, K.J., Alvarez-Fernandez, S., Mojica, K.D.A., Riebesell, U., Brussaard, C.P.D., 2017. Alterations in microbial community composition with increasing fCO2: a mesocosm study in the eastern Baltic Sea. Biogeosciences (BG) 14, 3831–3849. https://doi.org/10.5194/bg-14-3831-2017
Dickson, A. G., C. L. Sabine, and J. R. Christian. 2007. Guide to best practices for ocean CO2 measurements, PICES SpecialPublication 3, North Pacific.
Doney, S.C., Fabry, V.J., Feely, R.A., Kleypas, J.A., 2009. Ocean Acidification: The Other CO2 Problem. Annual Review of Marine Science 1, 169–192. https://doi.org/10.1146/annurev.marine.010908.163834
Douglas, N.K., Byrne, R.H., 2017. Spectrophotometric pH measurements from river to sea: Calibration of mCP for 0≤S≤40 and 278.15≤T≤308.15K. Marine Chemistry 197, 64–69. https://doi.org/10.1016/j.marchem.2017.10.001
Duarte, C.M., Hendriks, I.E., Moore, T.S., Olsen, Y.S., Steckbauer, A., Ramajo, L., Carstensen, J., Trotter, J.A., McCulloch, M., 2013. Is Ocean Acidification an Open-Ocean Syndrome? Understanding Anthropogenic Impacts on Seawater pH. Estuaries and Coasts 36, 221–236. https://doi.org/10.1007/s12237-013-9594-3
Dupont, S., Pörtner, H., 2013. Get ready for ocean acidification. Nature 498, 429–429. https://doi.org/10.1038/498429a
Eklöf, J.S., Alsterberg, C., Havenhand, J.N., Sundbäck, K., Wood, H.L., Gamfeldt, L., 2012. Experimental climate change weakens the insurance effect of biodiversity. Ecology Letters 15, 864–872. https://doi.org/10.1111/j.1461-0248.2012.01810.x
Franke, A., Clemmesen, C., 2011. Effect of ocean acidification on early life stages of Atlantic herring (Clupea harengus L.). Biogeosciences (BG) 8, 3697–3707. https://doi.org/10.5194/bg-8-3697-2011
Friedlingstein, P., Jones, M.W., O’Sullivan, M., Andrew, R.M., Bakker, D.C.E., Hauck, J., Le Quéré, C., Peters, G.P., Peters, W., Pongratz, J., Sitch, S., Canadell, J.G., Ciais, P., Jackson, R.B., Alin, S.R., Anthoni, P., Bates, N.R., Becker, M., Bellouin, N., Bopp, L., Chau, T.T.T., Chevallier, F., Chini, L.P., Cronin, M., Currie, K.I., Decharme, B., Djeutchouang, L.M., Dou, X., Evans, W., Feely, R.A., Feng, L., Gasser, T., Gilfillan, D., Gkritzalis, T., Grassi, G., Gregor, L., Gruber, N., Gürses, Ö., Harris, I., Houghton, R.A., Hurtt, G.C., Iida, Y., Ilyina, T., Luijkx, I.T., Jain, A., Jones, S.D., Kato, E., Kennedy, D., Klein Goldewijk, K., Knauer, J., Korsbakken, J.I., Körtzinger, A., Landschützer, P., Lauvset, S.K., Lefèvre, N., Lienert, S., Liu, J., Marland, G., McGuire, P.C., Melton, J.R., Munro, D.R., Nabel, J.E.M.S., Nakaoka, S.-I., Niwa, Y., Ono, T., Pierrot, D., Poulter, B., Rehder, G., Resplandy, L., Robertson, E., Rödenbeck, C., Rosan, T.M., Schwinger, J., Schwingshackl, C., Séférian, R., Sutton, A.J., Sweeney, C., Tanhua, T., Tans, P.P., Tian, H., Tilbrook, B., Tubiello, F., van der Werf, G.R., Vuichard, N., Wada, C., Wanninkhof, R., Watson, A.J., Willis, D., Wiltshire, A.J., Yuan, W., Yue, C., Yue, X., Zaehle, S., Zeng, J., 2022. Global Carbon Budget 2021. Earth System Science Data 14, 1917–2005. https://doi.org/10.5194/essd-14-1917-2022
Frommel, A., Stiebens, V., Clemmesen, C., Havenhand, J., 2010. Effect of ocean acidification on marine fish sperm (Baltic cod: Gadus morhua). Biogeosciences (BG) 7, 3915–3919. https://doi.org/10.5194/bg-7-3915-2010
Frommel, A.Y., Schubert, A., Piatkowski, U., Clemmesen, C., 2013. Egg and early larval stages of Baltic cod, Gadus morhua, are robust to high levels of ocean acidification. Mar Biol 160, 1825–1834. https://doi.org/10.1007/s00227-011-1876-3
Gao, K., Beardall, J., Häder, D.-P., Hall-Spencer, J.M., Gao, G., Hutchins, D.A., 2019. Effects of Ocean Acidification on Marine Photosynthetic Organisms Under the Concurrent Influences of Warming, UV Radiation, and Deoxygenation. Front. Mar. Sci. 6. https://doi.org/10.3389/fmars.2019.00322
Gazeau, F, Gattuso, J. P., Dawber, C., Pronker, A. E., Peene, F., Peene, J., Heip, C. H. R., Middelburg, J. J., 2010. Effect of ocean acidification on the early life stages of the blue mussel Mytilus edulis. Biogeosciences, 7(7), 2051–2060. https://doi.org/10.5194/bg-7-2051-2010
Graiff, A., Bartsch, I., Ruth, W., Wahl, M., Karsten, U., 2015. Season Exerts Differential Effects of Ocean Acidification and Warming on Growth and Carbon Metabolism of the Seaweed Fucus vesiculosus in the Western Baltic Sea. Front. Mar. Sci. 2. https://doi.org/10.3389/fmars.2015.00112
Gustafsson, E., Hagens, M., Sun, X., Reed, D.C., Humborg, C., Slomp, C.P., Gustafsson, B.G., 2019a. Sedimentary alkalinity generation and long-term alkalinity development in the Baltic Sea. Biogeosciences 16, 437–456. https://doi.org/10.5194/bg-16-437-2019
Gustafsson, E., Hagens, M., Sun, X., Reed, D.C., Humborg, C., Slomp, C.P., Gustafsson, B.G., 2019a. Corrigendum: sedimentary alkalinity generation and long-term alkalinity development in the Baltic Sea. Biogeosciences 16, 437–456. https://doi.org/10.5194/bg-16-437-2019
Havenhand, J.N., 2012. How will Ocean Acidification Affect Baltic Sea Ecosystems? An Assessment of Plausible Impacts on Key Functional Groups. AMBIO 41, 637–644. https://doi.org/10.1007/s13280-012-0326-x
Havenhand, J.N., Filipsson, H.L., Niiranen, S., Troell, M., Crépin, A.-S., Jagers, S., Langlet, D., Matti, S., Turner, D., Winder, M., de Wit, P., Anderson, L.G., 2019. Ecological and functional consequences of coastal ocean acidification: Perspectives from the Baltic-Skagerrak System. Ambio 48, 831–854. https://doi.org/10.1007/s13280-018-1110-3
HELCOM, 2006. Manual for marine monitoring in the COMBINE programme of HELCOM. PART B. General guidelines on quality assurance for monitoring in the Baltic Sea.
HELCOM, 2021. Climate Change in the Baltic Sea. 2021 Fact Sheet. Baltic Sea Environment Proceedings n°180. HELCOM/Baltic Earth 2021.
Hiebenthal, C., Philipp, E.E.R., Eisenhauer, A., Wahl, M., 2013. Effects of seawater pCO2 and temperature on shell growth, shell stability, condition and cellular stress of Western Baltic Sea Mytilus edulis (L.) and Arctica islandica (L.). Mar Biol 160, 2073–2087. https://doi.org/10.1007/s00227-012-2080-9
Hutchins, D.A., Fu, F., 2017. Microorganisms and ocean global change. Nature Microbiology 2, 1–11. https://doi.org/10.1038/nmicrobiol.2017.58
Jakubowska, M., Normant-Saremba, M., 2015. The Effect of CO2-Induced Seawater Acidification on the Behaviour and Metabolic Rate of the Baltic Clam Macoma balthica. anzf 52, 353–367. https://doi.org/10.5735/086.052.0509
Jansson, A. 2017. Ocean acidification in the Baltic Sea — Implications for the bivalve Macoma balthica (Doctoral thesis, Åbo University, Finland). Available from http://urn.fi/URN:ISBN:978-952-12-3514-6
Jutterström, S., Andersson, H.C., Omstedt, A., Malmaeus, J.M., 2014. Multiple stressors threatening the future of the Baltic Sea–Kattegat marine ecosystem: Implications for policy and management actions. Marine Pollution Bulletin 86, 468–480. https://doi.org/10.1016/j.marpolbul.2014.06.027
Karlberg, M., Wulff, A., 2013. Impact of temperature and species interaction on filamentous cyanobacteria may be more important than salinity and increased pCO2 levels. Mar Biol 160, 2063–2072. https://doi.org/10.1007/s00227-012-2078-3
Kremp, A., Godhe, A., Egardt, J., Dupont, S., Suikkanen, S., Casabianca, S., Penna, A., 2012. Intraspecific variability in the response of bloom-forming marine microalgae to changed climate conditions. Ecology and Evolution 2, 1195–1207. https://doi.org/10.1002/ece3.245
Lischka, S., Bach, L. T., Schulz, K.-G., and Riebesell, U., 2017. Ciliate and mesozooplankton community response to increasing CO2 levels in the Baltic Sea: insights from a large-scale mesocosm experiment, Biogeosciences, 14, 447–466. https://doi.org/10.5194/bg-14-447-2017
Melzner, F., J. Thomsen, W. Koeve, A. Oschlies, M. A. Gutowska, H.W. Bange, H.P. Hansen, A. Körtzinger, 2013. Future ocean acidification will be amplified by hypoxia in coastal habitats. Mar. Biol. 160: 1875–1888. https://doi.org/10.1007/s00227-012-1954-1
Melzner F, Stange P, Trübenbach K, Thomsen J, Casties I, Panknin U, Gorb SN, Gutowska MA, 2011. Food supply and seawater pCO2 impact calcification and internal shell dissolution in the blue mussel Mytilus edulis. PLoS ONE 6(9):e24223. https://doi.org/10.1371/journal.pone.0024223
Müller, J.D., Rehder, G., 2018. Metrology of pH Measurements in Brackish Waters—Part 2: Experimental Characterization of Purified meta-Cresol Purple for Spectrophotometric pHT Measurements. Front. Mar. Sci. 5. https://doi.org/10.3389/fmars.2018.00177
Müller, J.D., Bastkowski, F., Sander, B., Seitz, S., Turner, D.R., Dickson, A.G., Rehder, G., 2018b. Metrology for pH Measurements in Brackish Waters—Part 1: Extending Electrochemical pHT Measurements of TRIS Buffers to Salinities 5–20. Front. Mar. Sci. 5. https://doi.org/10.3389/fmars.2018.00176
Müller, J.D., Schneider, B., Aßmann, S., Rehder, G., 2018. Spectrophotometric pH measurements in the presence of dissolved organic matter and hydrogen sulfide. Limnology and Oceanography: Methods 16, 68–82. https://doi.org/10.1002/lom3.10227
Müller, J.D., Schneider, B., Rehder, G., 2016. Long-term alkalinity trends in the Baltic Sea and their implications for CO2-induced acidification. Limnol. Oceanogr. 61, 1984–2002. https://doi.org/10.1002/lno.10349
Nixon, S.W., 1995. Coastal marine eutrophication: A definition, social causes, and future concerns. Ophelia 41, 199–219. https://doi.org/10.1080/00785236.1995.10422044
Omstedt, A., Edman, M., Claremar, B., Rutgersson, A., 2015. Modelling the contributions to marine acidification from deposited SOx, NOx, and NHx in the Baltic Sea: Past and present situations. Continental Shelf Research, Coastal Seas in a Changing World: Anthropogenic Impact and Environmental Responses 111, 234–249. https://doi.org/10.1016/j.csr.2015.08.024
Pansch, C., Nasrolahi, A., Appelhans, Y.S., Wahl, M., 2013a. Tolerance of juvenile barnacles (Amphibalanus improvisus) to warming and elevated pCO2. Mar Biol 160, 2023–2035. https://doi.org/10.1007/s00227-012-2069-4
Pansch, C., Schlegel, P., Havenhand, J., 2013b. Larval development of the barnacle Amphibalanus improvisus responds variably but robustly to near-future ocean acidification. ICES J Mar Sci 70, 805–811. https://doi.org/10.1093/icesjms/fst092
Pansch, C., Schaub, I., Havenhand, J., Wahl, M., 2014. Habitat traits and food availability determine the response of marine invertebrates to ocean acidification. Global Change Biology 20, 765–777. https://doi.org/10.1111/gcb.12478
Pansch, C., Hattich, G.S.I., Heinrichs, M.E., Pansch, A., Zagrodzka, Z., Havenhand, J.N., 2018. Long-term exposure to acidification disrupts reproduction in a marine invertebrate. PLOS ONE 13, e0192036. https://doi.org/10.1371/journal.pone.0192036
Paul, A.J., Bach, L.T., Schulz, K.-G., Boxhammer, T., Czerny, J., Achterberg, E.P., Hellemann, D., Trense, Y., Nausch, M., Sswat, M., Riebesell, U., 2015. Effect of elevated CO2 on organic matter pools and fluxes in a summer Baltic Sea plankton community. Biogeosciences 12, 6181–6203. https://doi.org/10.5194/bg-12-6181-2015
Paul, A.J., Achterberg, E.P., Bach, L.T., Boxhammer, T., Czerny, J., Haunost, M., Schulz, K.G., Stuhr, A., Riebesell, U., 2016. No observed effect of ocean acidification on nitrogen biogeochemistry in a summer Baltic Sea plankton community. Biogeosciences (BG) 13, 3901–3913. https://doi.org/10.5194/bg-13-3901-2016
Paul, A.J., Sommer, U., Paul, C., Riebesell, U., 2018. Baltic Sea diazotrophic cyanobacterium is negatively affected by acidification and warming. Marine Ecology Progress Series 598, 49–60. https://doi.org/10.3354/meps12632
Pfeil, B., Olsen, A., Bakker, D. C. E., Hankin, S., Koyuk, H., Kozyr, A., Malczyk, J., Manke, A., Metzl, N., Sabine, C. L., Akl, J., Alin, S. R., Bates, N., Bellerby, R. G. J., Borges, A., Boutin, J., Brown, P. J., Cai, W.-J., Chavez, F. P., Chen, A., Cosca, C., Fassbender, A. J., Feely, R. A., González-Dávila, M., Goyet, C., Hales, B., Hardman-Mountford, N., Heinze, C., Hood, M., Hoppema, M., Hunt, C. W., Hydes, D., Ishii, M., Johannessen, T., Jones, S. D., Key, R. M., Körtzinger, A., Landschützer, P., Lauvset, S. K., Lefèvre, N., Lenton, A., Lourantou, A., Merlivat, L., Midorikawa, T., Mintrop, L., Miyazaki, C., Murata, A., Nakadate, A., Nakano, Y., Nakaoka, S., Nojiri, Y., Omar, A. M., Padin, X. A., Park, G.-H., Paterson, K., Perez, F. F., Pierrot, D., Poisson, A., Ríos, A. F., Santana-Casiano, J. M., Salisbury, J., Sarma, V. V. S. S., Schlitzer, R., Schneider, B., Schuster, U., Sieger, R., Skjelvan, I., Steinhoff, T., Suzuki, T., Takahashi, T., Tedesco, K., Telszewski, M., Thomas, H., Tilbrook, B., Tjiputra, J., Vandemark, D., Veness, T., Wanninkhof, R., Watson, A. J., Weiss, R., Wong, C. S., and H. Yoshikawa-Inoue: A uniform, quality controlled Surface Ocean CO2 Atlas (SOCAT), Earth Syst. Sci. Data, 5, 125-143, doi:10.5194/essd-5-125-2013, 2013.
Raymond, P. and J. J. Cole, 2003. Increase in the export of alkalinity from North America’s largest rivers, Science, 301, 88-91, https://doi.org/10.1126/science.1083788
Riebesell, U., Gattuso, J.-P., 2015. Lessons learned from ocean acidification research. Nature Climate Change 5, 12–14. https://doi.org/10.1038/nclimate2456
Rossoll, D., Sommer, U., Winder, M., 2013. Community interactions dampen acidification effects in a coastal plankton system. Marine Ecology Progress Series 486, 37–46. https://doi.org/10.3354/meps10352
Schneider, B. and Müller, J.D., 2018. Biogeochemical Transformations in the Baltic Sea – Observations Through Carbon Dioxide Glasses. Springer Oceanographie. Springer.
Spilling, K., Schulz, K.G., Paul, A.J., Boxhammer, T., Achterberg, E.P., Hornick, T., Lischka, S., Stuhr, A., Bermudez, R., Czerny, J., Crawfurd, K., Brussaard, C.P.D., Grossart, H.-P., Riebesell, U., 2016. Effects of ocean acidification on pelagic carbon fluxes in a mesocosm experiment. Biogeosciences (BG) 13, 6081–6093. https://doi.org/10.5194/bg-13-6081-2016
Stiasny, M.H., Mittermayer, F.H., Sswat, M., Voss, R., Jutfelt, F., Chierici, M., Puvanendran, V., Mortensen, A., Reusch, T.B.H., Clemmesen, C., 2016. Ocean Acidification Effects on Atlantic Cod Larval Survival and Recruitment to the Fished Population. PLOS ONE 11, e0155448. https://doi.org/10.1371/journal.pone.0155448
Sunday, J.M., Fabricius, K.E., Kroeker, K.J., Anderson, K.M., Brown, N.E., Barry, J.P., Connell, S.D., Dupont, S., Gaylord, B., Hall-Spencer, J.M., Klinger, T., Milazzo, M., Munday, P.L., Russell, B.D., Sanford, E., Thiyagarajan, V., Vaughan, M.L.H., Widdicombe, S., Harley, C.D.G., 2017. Ocean acidification can mediate biodiversity shifts by changing biogenic habitat. Nature Climate Change 7, 81–85. https://doi.org/10.1038/nclimate3161
Takolander, A., Cabeza, M., Leskinen, E., 2017. Climate change can cause complex responses in Baltic Sea macroalgae: A systematic review. Journal of Sea Research 123, 16–29. https://doi.org/10.1016/j.seares.2017.03.007
Thomsen, J., Gutowska, M., Saphörster, J., Heinemann, A., Trübenbach, K., Fietzke, J., Hiebenthal, C., Eisenhauer, A., Körtzinger, A., Wahl, M., Melzner, F., 2010. Calcifying invertebrates succeed in a naturally CO2 enriched coastal habitat but are threatened by high levels of future acidification. Biogeosciences (BG) 7, 3879–3891. https://doi.org/10.5194/bg-7-3879-2010
Thomsen, J., Melzner, F., 2010. Moderate seawater acidification does not elicit long-term metabolic depression in the blue mussel Mytilus edulis. Mar Biol 157, 2667–2676. https://doi.org/10.1007/s00227-010-1527-0
Thomsen, J., Casties, I., Pansch, C., Körtzinger, A., Melzner, F., 2013. Food availability outweighs ocean acidification effects in juvenile Mytilus edulis: laboratory and field experiments. Global Change Biology 19, 1017–1027. https://doi.org/10.1111/gcb.12109
Thor, P., and Dupont, S., 2018. Ocean acidification, In: M. Salomon, M. Till (Eds) Handbook on Marine Environment Protection Science, impacts and sustainable management. Springer.
Vargas, C.A., Lagos, N.A., Lardies, M.A., Duarte, C., Manríquez, P.H., Aguilera, V.M., Broitman, B., Widdicombe, S., Dupont, S., 2017. Species-specific responses to ocean acidification should account for local adaptation and adaptive plasticity. Nature Ecology and Evolution 1, 1–7. https://doi.org/10.1038/s41559-017-0084
Vehmaa, A., Almén, A.-K., Brutemark, A., Paul, A., Riebesell, U., Furuhagen, S., and Engström-Öst, J., 2016. Ocean acidification challenges copepod phenotypic plasticity, Biogeosciences, 13, 6171–6182. https://doi.org/10.5194/bg-13-6171-2016
Wahl, M., Covachã, S.S., Saderne, V., Hiebenthal, C., Müller, J.D., Pansch, C., Sawall, Y., 2018. Macroalgae may mitigate ocean acidification effects on mussel calcification by increasing pH and its fluctuations. Limnology and Oceanography 63, 3–21. https://doi.org/10.1002/lno.10608
Wallmann, K., Diesing, M., Scholz, F., Rehder, G., Dale, A.W., Fuhr, M., Suess, E., 2022. Erosion of carbonate-bearing sedimentary rocks may close the alkalinity budget of the Baltic Sea and support atmospheric CO2 uptake in coastal seas. Frontiers in Marine Science 9. https://doi.org/10.3389/fmars.2022.968069
Wulff, A., Karlberg, M., Olofsson, M., Torstensson, A., Riemann, L., Steinhoff, F.S., Mohlin, M., Ekstrand, N., Chierici, M., 2018. Ocean acidification and desalination: climate-driven change in a Baltic Sea summer microplanktonic community. Mar Biol 165, 63. https://doi.org/10.1007/s00227-018-3321-3