 Coastal fish key groups
The state of coastal fish communities reflects the ecological state of coastal ecosystems, and in some areas where cyprinids and mesopredators are targeted, the effects of mainly small-scale coastal commercial fisheries. Changes in the long-term development of the abundance of coastal fish functional groups reflects the effects of increased water temperature and eutrophication in coastal areas, and/or changes in the level of human exploitation (mainly habitat degradation), natural predation pressure, and in some areas fishing.
2.1 Ecological relevance
Coastal fish are recognized as being important components of coastal food webs and ecosystem functioning and high abundances of cyprinids and mesopredatory fish are generally indicative of poorer environmental conditions in the coastal ecosystem (Eriksson et al. 2009; Baden et al. 2012; Bergström et al. 2016b, 2019; Östman et al. 2016). High abundances of cyprinids and mesopredators might reflect lack of top-down regulation, elevated eutrophication and increased water temperatures. In Sweden and Finland, a fishery targeting cyprinids has developed during recent years (Lappalainen et al. 2019; Dahlin et al. 2021), and resulting effects on targeted populations might hence be seen in the future.
Moreover, since many coastal fish species are rather local in their appearance (Saulamo & Neuman 2005; Laikre et al. 2005; Olsson et al. 2011; Östman et al. 2017a), the temporal development of coastal fish communities might reflect the general environmental state in the monitoring locations (Bergström et al. 2016b, 2019; Östman et al. 2017b).
2.2 Policy relevance
The core indicator on abundance of coastal fish functional groups addresses the Baltic Sea Action Plan’s (BSAP 2021). Biodiversity and nature conservation segment’s ecological objectives ‘Natural distribution and occurrence of plants and animals’ and ‘Thriving and balanced communities of plants and animals’.
The core indicator is relevant to the following specific BSAP actions:
- ‘to develop long-term plans for, protecting, monitoring and sustainably managing coastal fish species, including the most threatened and/or declining, including anadromous ones (according to the HELCOM Red list of threatened and declining species of lampreys and fishes of the Baltic Sea, BSEP No. 109), by 2012’ and
- ‘develop a suite of indicators with region-specific reference values and targets for coastal fish as well as tools for evaluation and sustainable management of coastal fish by 2012’.
The core indicator also addresses the following qualitative descriptors of the MSFD for determining good environmental status:
Descriptor 4: ‘All elements of the marine food webs, to the extent that they are known, occur at normal abundance and diversity and levels capable of ensuring the long-term abundance of the species and the retention of their full reproductive capacity’.
and the following criteria of the Commission Decision:
- Criterion D4C2 (Trophic guilds, balance of total guild abundance).
In some Contracting Parties the indicator also has potential relevance for implementation of the EU Habitats Directive.
A summary is provided in Table 1.
Table 1. Policy relevance
| Baltic Sea Action Plan (BSAP) | Marine Strategy Framework Directive (MSFD) | |
| Fundamental link | Segment: Biodiversity
Goal: “Baltic Sea ecosystem is healthy and resilient”
|
Descriptor 4 Ecosystems, including food webs – Trophic guilds of an ecosystem
|
| Complementary link | Segment: Biodiversity
Goal: “Baltic Sea ecosystem is healthy and resilient”
|
|
| Other relevant legislation: | In some Contracting Parties of HELCOM – potentially also EU Habitats Directive.
UN Sustainable Development Goal 14 (Conserve and sustainably use the oceans, seas and marine resources for sustainable development) is most clearly relevant, though SDG 12 (Ensure sustainable consumption and production patterns) and 13 (Take urgent action to combat climate change and its impacts) also have relevance. |
|
2.3 Relevance for other assessments
The status of biodiversity is assessed using several core indicators. Each indicator focuses on one important aspect of the complex issue. In addition to providing an indicator-based evaluation of the abundance of selected functional groups of coastal fish, this indicator also contributes to the overall biodiversity assessment along with the other biodiversity core indicators.
Good status is achieved when the abundance of cyprinids/mesopredators is within an acceptable range. The quantitative threshold values for coastal fish are based on location-specific reference conditions where time series covering more than 15 years are available (ten or more years reference period + five or more years assessment period). In areas where shorter time series (i.e. less than 15 years) are available, a trend-based approach is used.
A reference period needs to be defined for determining the threshold value. The period used to define the reference needs to cover at least ten years in order to extend over more than twice the generation time of the typical species represented in the indicator and thus cater for natural variation in the indicator value, due for example to strong and weak year classes. For the period used to determine the reference to be relevant, it must also be carefully selected to reflect time periods with stable environmental conditions, as stated within the MSFD (European Commission 2008). Substantial turnovers in ecosystem structure in the Baltic Sea were apparent in the late 1980s, leading to shifts in the baseline state (Möllmann et al. 2009), and for coastal fish communities, substantial shifts in community structure have been demonstrated in the late 1980s and early/mid 1990s (Olsson et al. 2012; Bergström et al. 2016a). In some areas, there have also been minor shifts in fish community structure later. To account for this, the ASCETS method (Östman et al. 2020) is applied on time-series with more than 15 years of data. This method offers a refined approach to infer structural changes in indicator values over time and establish threshold values for the state during a reference period based on the observed variation in indicator values.
Estimates of the relative abundance and/or biomass are used to determine whether coastal fish key functional groups in the Baltic Sea achieve good status or not. These estimates are derived from fishery independent monitoring. Since there are strong environmental gradients in the Baltic Sea and coastal fish communities, stocks are typically local in their appearance and respond mainly to area-specific environmental conditions. The evaluations for coastal fish key functional groups are thus carried out on a relatively local scale.
The assessment period applied when using the ASCETS method should cover at least five years to cater for natural variability. Good status is evaluated based on the deviation of the median value of the indicator during the assessment period in relation to the threshold value (Figure 3).
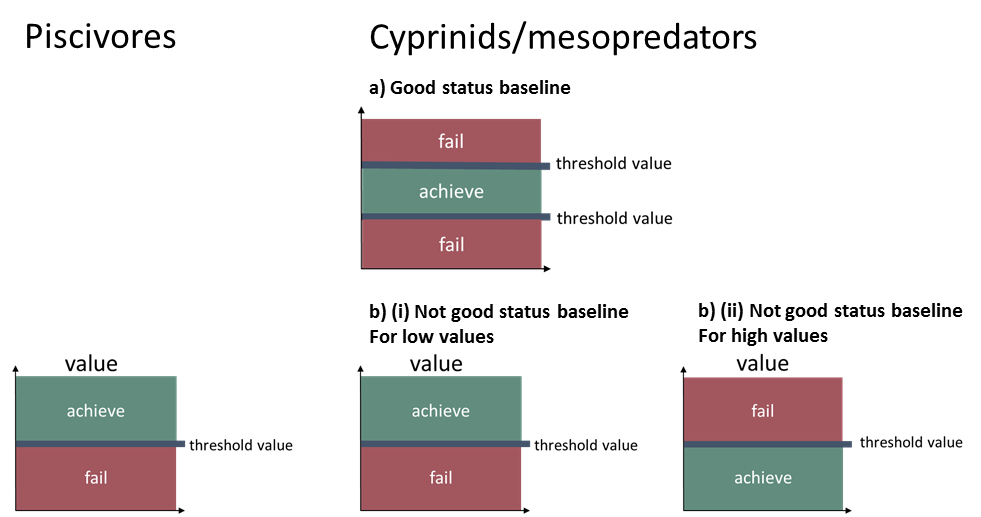
Figure 3. Determination of acceptable range from baseline.
When using the trend-based approach, environmental status is evaluated based on the direction of the trend towards good status, over the time period 2014-2020 (Figure 4).
![]()
Figure 4. Application of the trend-based approach for evaluating environmental. The status is defined based on the direction of the trend of the indicator compared to the desired direction of the indicator over time. GS = good status, nGS = not good status.
The functional groups used in this indicator are members of the cyprinid family. In areas where cyprinids do not exist naturally, mesopredatory fish species are used e.g. any mid-trophic level species that are not piscivorous. The composition of cyprinid and mesopredator species differ along the coast. The most abundant species in the Cyprinid family (Cyprinidae) in the less saline eastern and northern parts of the Baltic Sea are for example roach (Rutilus rutilus) and bream (Abramis sp.), whereas mesopredatory fish are representative of the more exposed coastal parts of the central Baltic Sea and in its more saline western region.
Table 2. Species included in the two functional groups cyprinids and mesopredators in the different countries for which the indicator is currently applicable. Presence is indicated according to the following; X: Occurs in monitoring in representative numbers, X*: Occurs in monitoring in representative numbers, but no identification of the different species is possible, x: Occurs in monitoring but in low and non-representative numbers, blank: Not applicable in the country. Countries: FI: Finland, EE: Estonia, LV: Latvia, LT: Lithuania, PL: Poland, SE: Sweden.
3.1 Setting the threshold value(s)
To determine the status of the indicator, the ASCETS method first derives a bootstrapped distribution of median values from a time series of observed indicator values during a reference period. Specific threshold values for changes in indicator state is set, and for key species, these are based on the 5th and 98th percentile values of the bootstrapped distribution. In this way, the derived boundaries of this interval can function as threshold values for a change in state per assessment unit of each species. Second, the bootstrapped median indicator value during the assessment period is evaluated in relation to the threshold values derived from the reference period depending on how much of the bootstrapped median distribution from the assessment period that falls below, within, or above the 5th and 98th percentiles.
If the requirements for defining quantitative baseline conditions are not met (e.g. short time-series), then a trend-based evaluation should be used. All available data starting from year 2014 is included in trend analyses. In the trend-based approach, good status is defined based on the direction of the trend at p<0.1 of the indicator compared to the desired direction of the indicator over time.
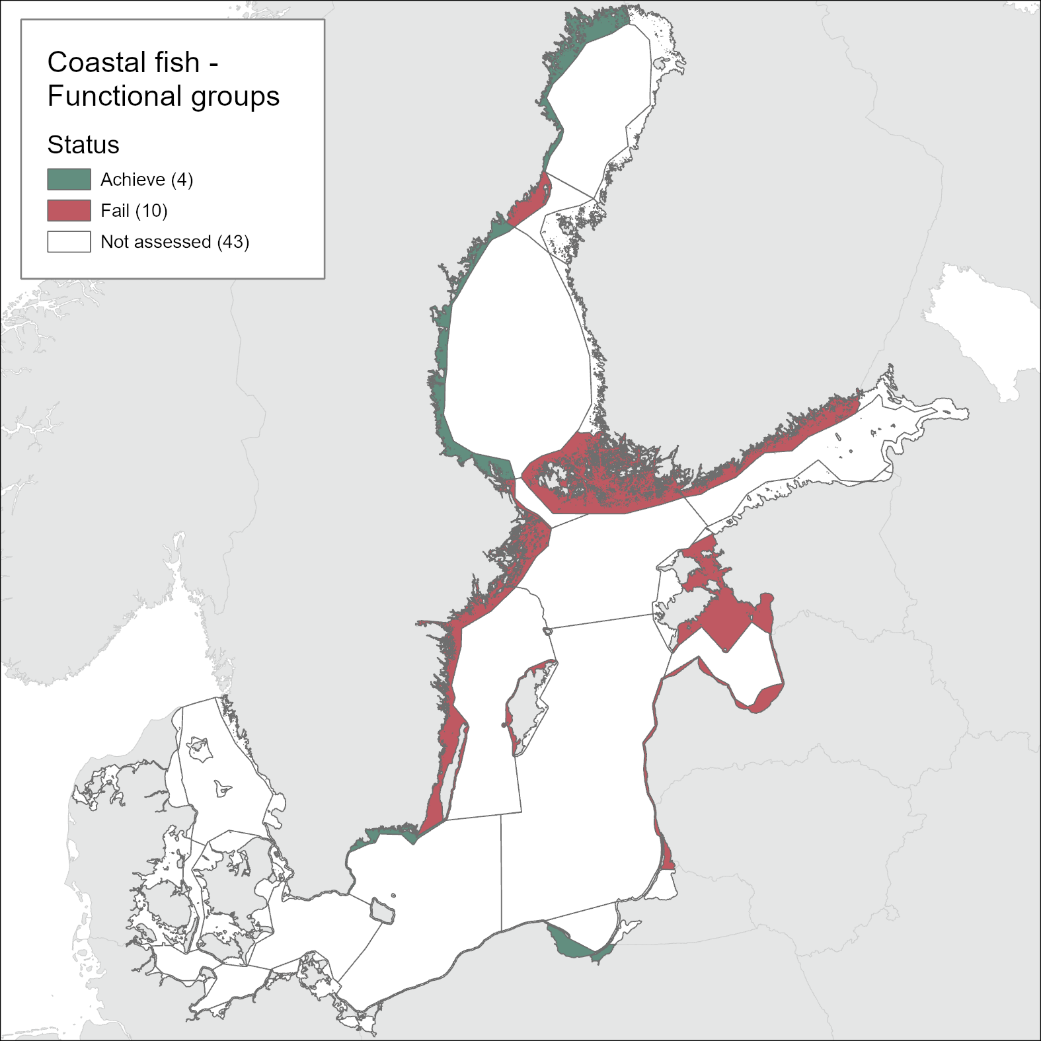
The results of the indicator evaluation that underlie the key message map and information are provided below.
4.1 Status evaluation
The current evaluation of coastal fish environmental status covers the period 2016-2020. The evaluation is based on time-series data of varying length depending on the temporal coverage of data collection in each monitoring location. Time series thus start between the years 1998 and 2015 (Table 2) and depending on the time-series coverage, either the ‘ASCETS approach’ or a ‘trend-based evaluation’ is used. Evaluations were carried out for 14 of the in total 42 scale 3 assessment units and time series data up to and including the year 2020 were available for all 14 of these units.
The environmental status of cyprinids and mesopredator abundance is generally not good. Good status is achieved in 63 % of the evaluated monitoring locations (20 out of in total 32 locations), but only 4 out of 14 assessment units achieve good status (see Table 3). In the locations classified as not good, the abundance of cyprinids and mesopredators was too high in all but two (Hiiumaa, Estonia, and Jurkalne, Latvia) of the 12 locations.
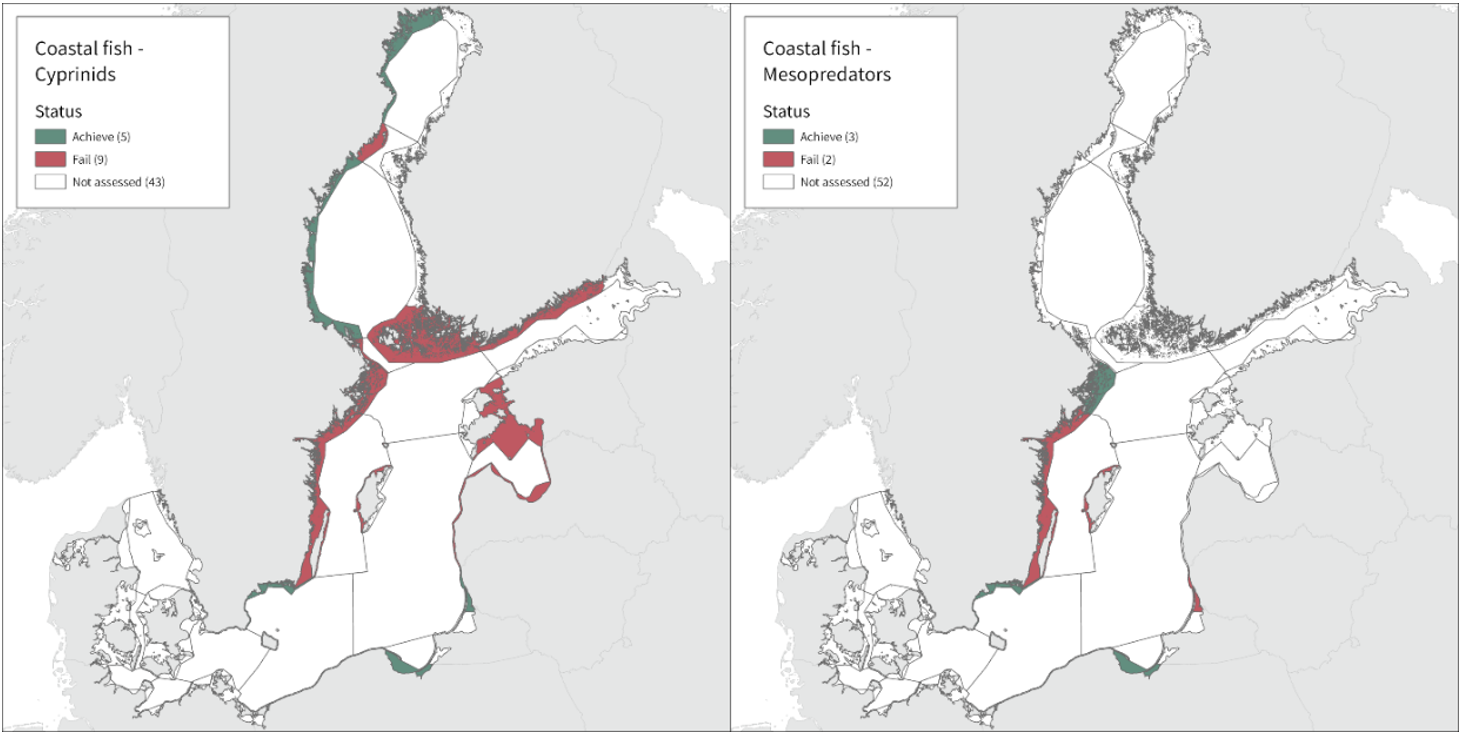
In the majority of the monitoring locations (24 locations) cyprinids is evaluated, and in 13 of these the threshold is met. For mesopredators the status appears to be better as the threshold is met in 7 of the in total 9 locations evaluated. Note that in one Swedish location (Kvädöfjärden), both cyprinids and mesopredators are evaluated, and neither meets the threshold, and in two Swedish areas included, the time-series is too short to allow for an evaluation of status.
There are some geographical patterns in the status of the cyprinids/mesopredators, and good status is generally not achieved in more central parts of the Baltic Sea including the Swedish part of the Quark, Åland Sea, Northern Baltic Proper and Western Gotland Basin, in more southern Finnish coastal waters (Archipelago Sea and Gulf of Finland), and in Estonian and Latvian coastal waters.
Evaluations of the indicator were only carried out for cyprinids/mesopredators in the central and northern parts of the Baltic Sea since monitoring to support the indicator is currently lacking in Germany and Denmark, and in the Northern parts of Finland (Bothnian Bay and Bothnian Sea). Coastal fish monitoring is not available in Russia.
Table 3. Cyprinid/mesopredators evaluation results for the assessment period 2016-2021. GS = good status, nGS = not good status.
In the northernmost parts of the Baltic Sea, data is only available for Sweden. The status is generally good in the Bothnian Bay, but poor in the Quark (Table 3 and Figure 5). In the Quark the abundance of cyprinids is high and increasing in both locations evaluated, whereas in the two Swedish Bothnian Bay locations abundances are stable and meet the threshold for good status.
In the Swedish areas of the Bothnian Sea and Åland Sea, the relative abundance of cyprinids is generally stable and acceptable (indicating good status), except for one location (Lagnö, Åland Sea) where the abundance is increasing indicating a poor status. By contrast, the status is not good due too high or increasing abundances of cyprinids along the Finnish coast of the Archipelago Sea (see Figure 5).
In the central parts of the Baltic Sea (Northern Baltic Sea, Gulf of Finland, Gulf of Riga and Gotland Basin) the status is good in all but two Swedish locations (Vaxholm and Kvädöfjärden) and all but one Finnish location (Helsinki). Along the Estonian and Latvian coasts, the status is not good in all three locations, as a result of too low abundances of cyprinids in two locations and too high abundance in one location. In the four Lithuanian locations the status appears to be good in all but one location (Monciskes and Butinge) where the abundances of mesopredators is too high during recent years.
In the five southernmost locations in Sweden and Poland, the evaluation of cyprinids and mesopredators indicates good status in all locations.
4.2 Figures and graphs
Bothnian Bay
Sweden
The Quark
Sweden
Bothnian Sea
Sweden
Åland Sea
Sweden
Archipelago Sea
Finland
Northern Baltic Sea
Sweden
Gulf of Finland
Finland
Gulf of Riga
Estonia
Latvia
Western Gotland Basin
Sweden
Eastern Gotland Basin
Latvia
Lithuania 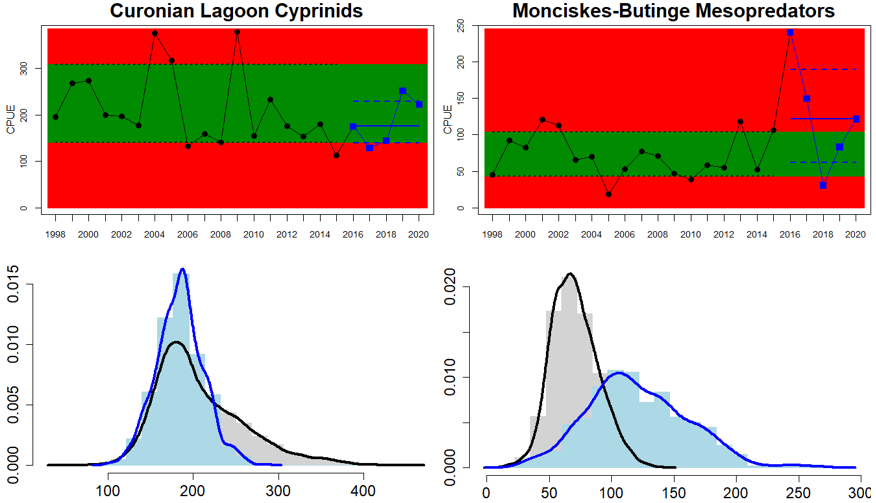
Sweden
Gdansk Basin
Poland
Bornholm Basin
Sweden
Arkona Basin
Sweden
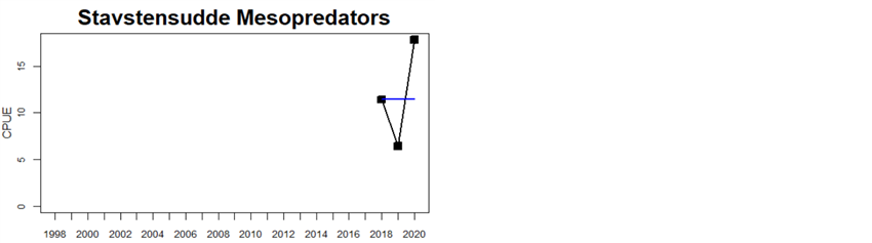
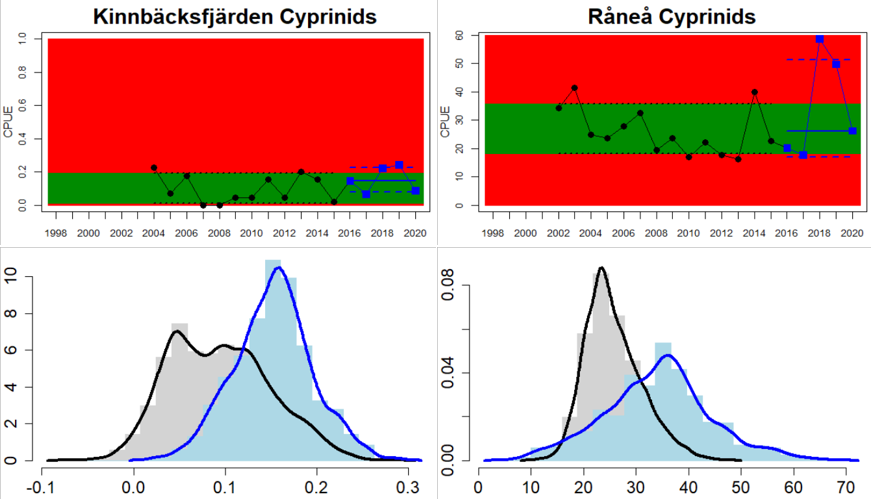
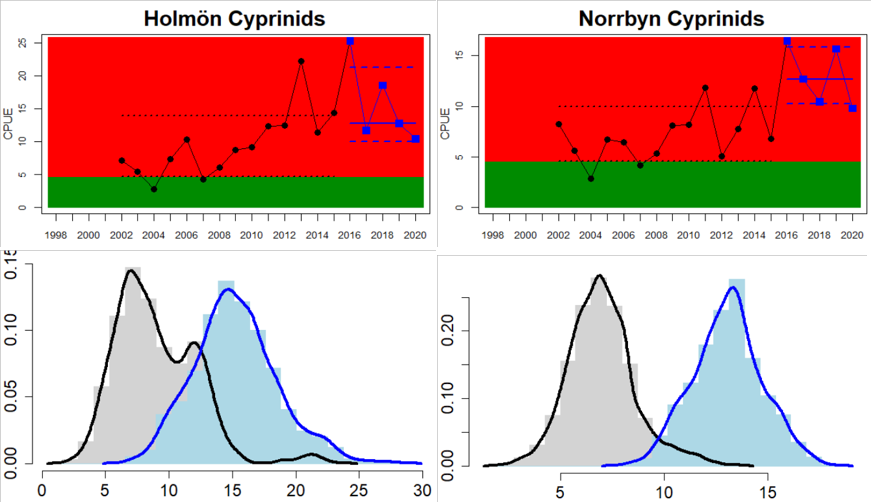
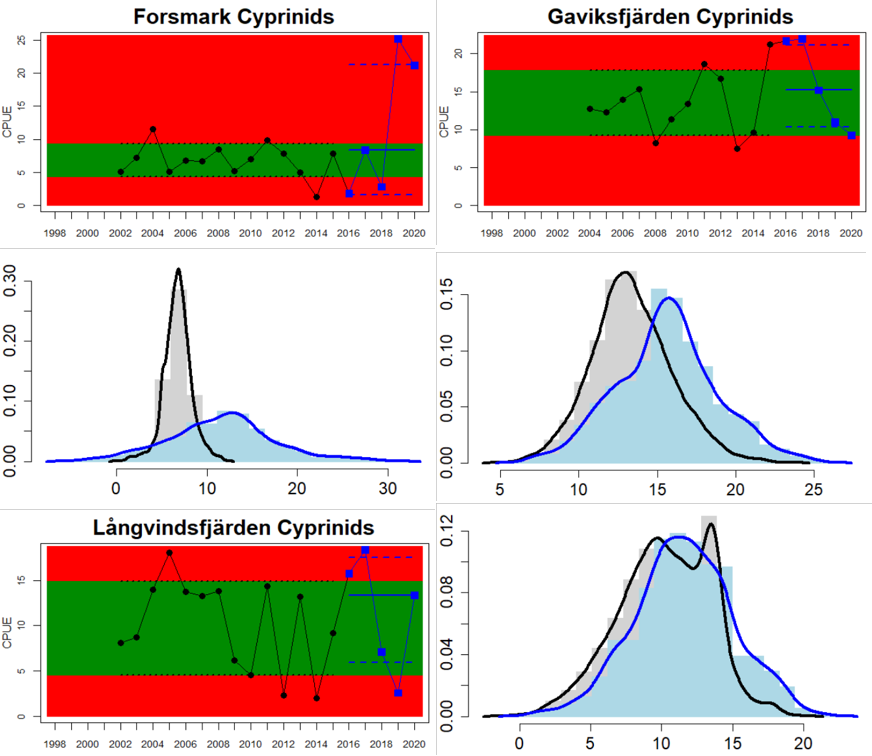
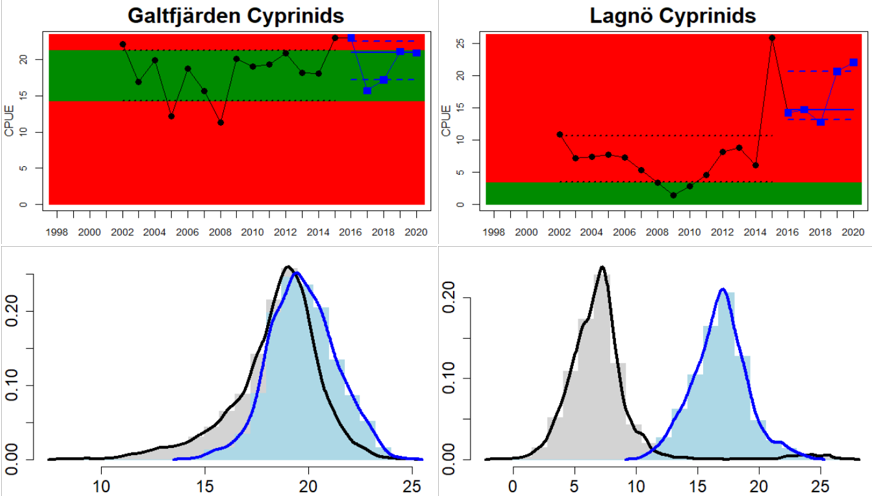
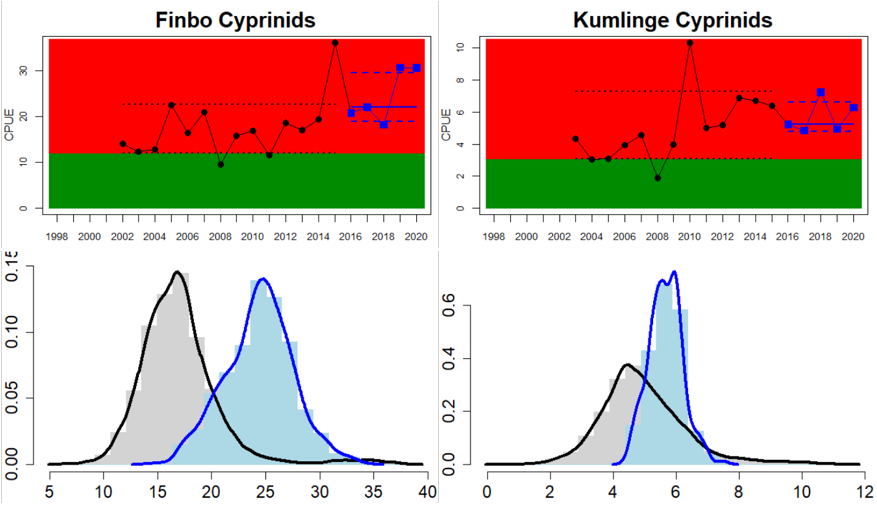
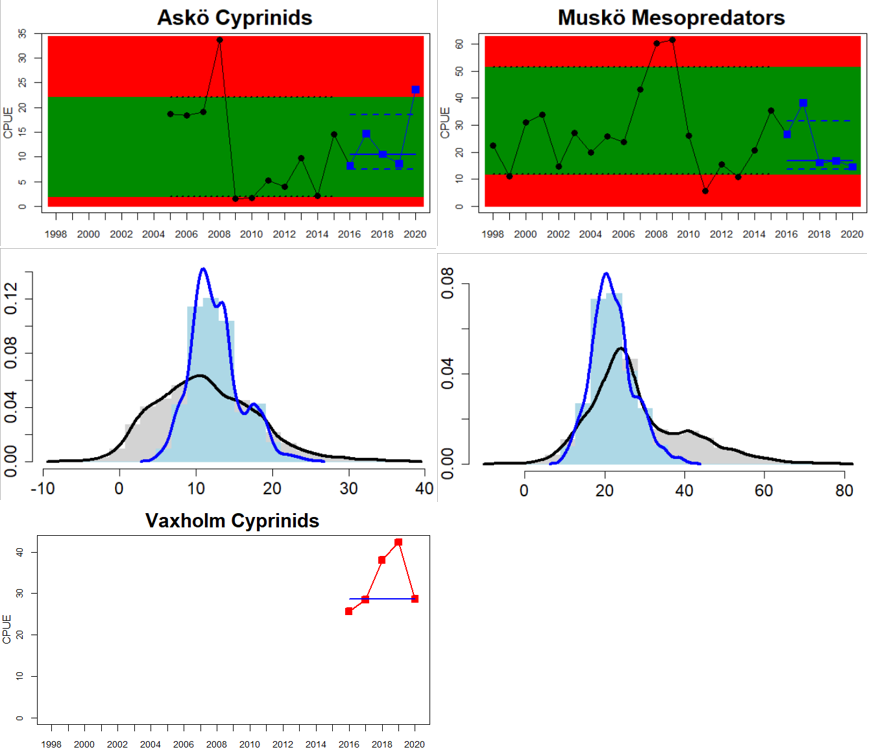
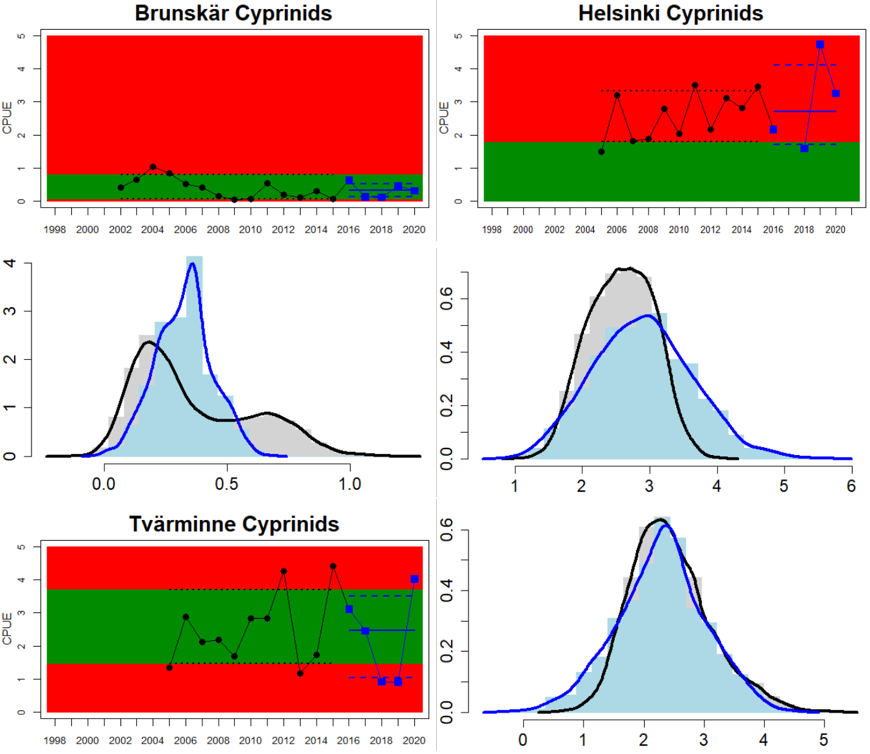
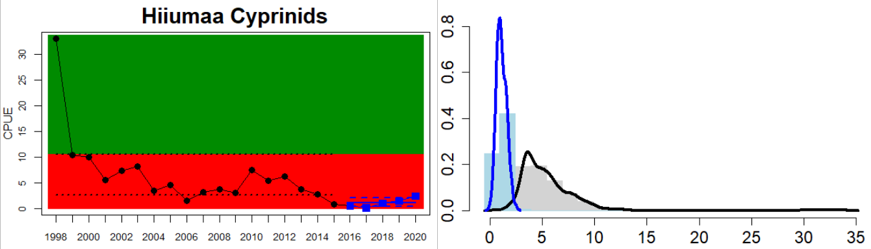
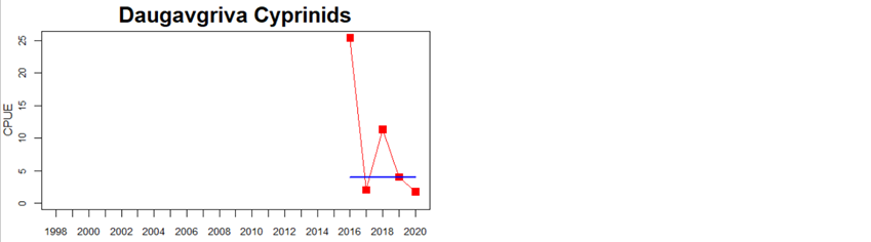
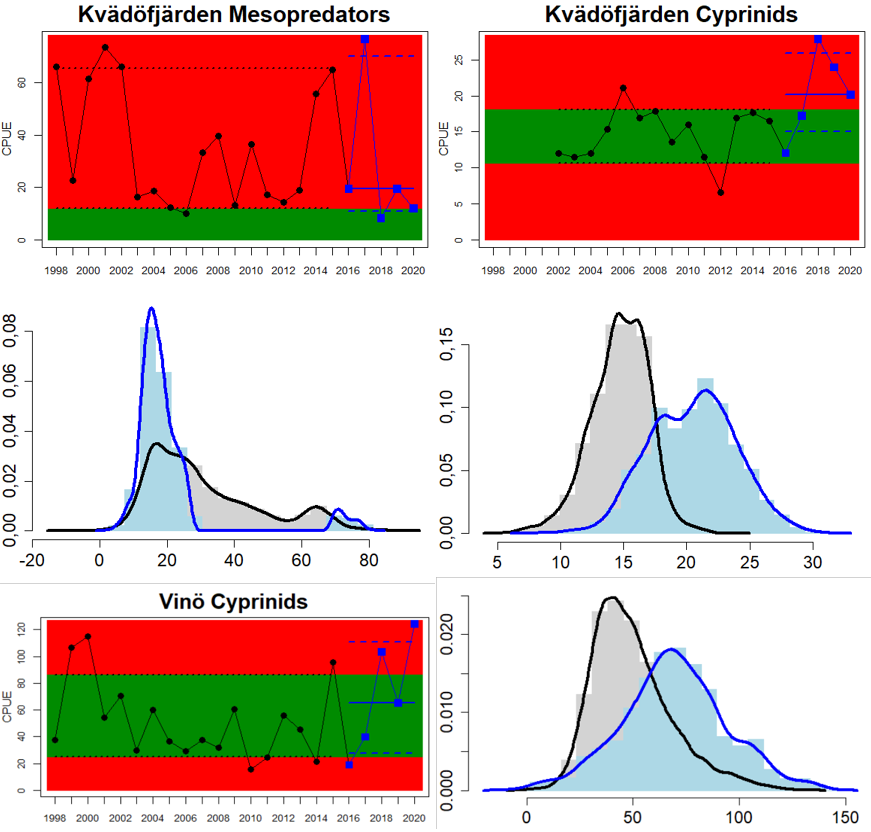
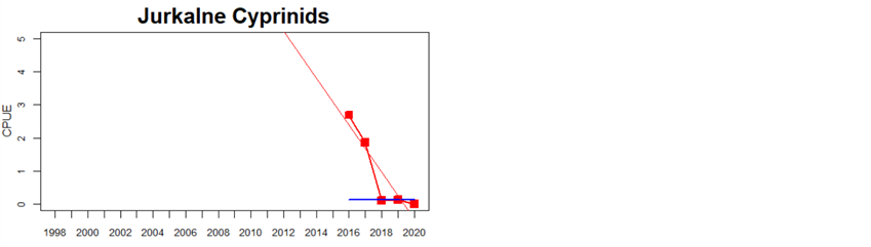
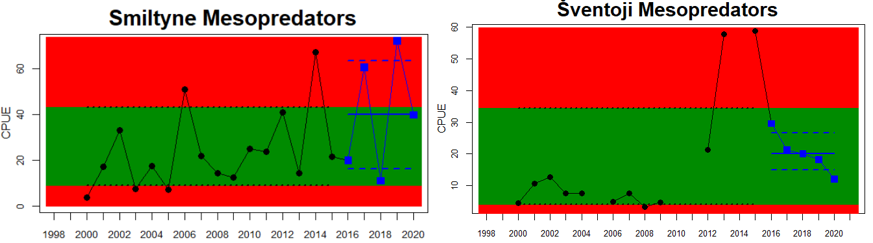
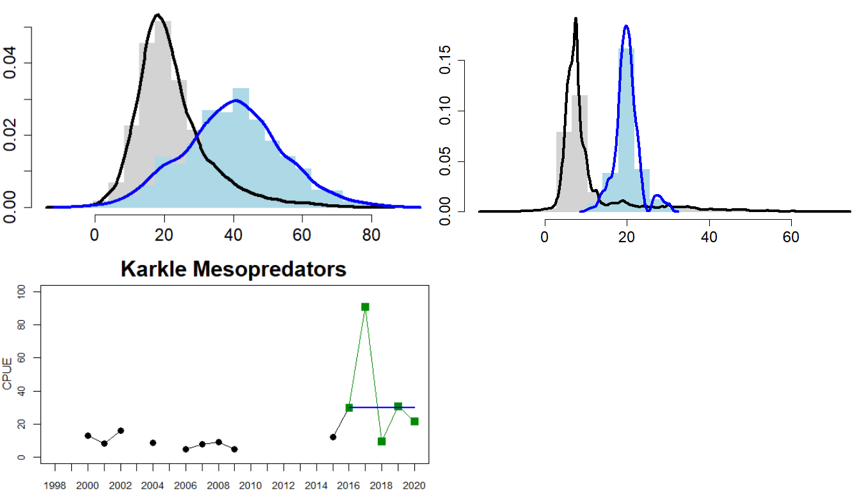
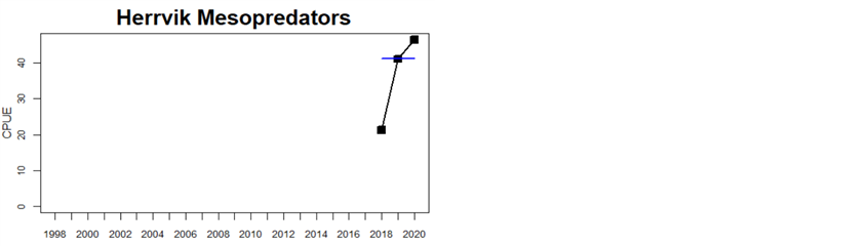
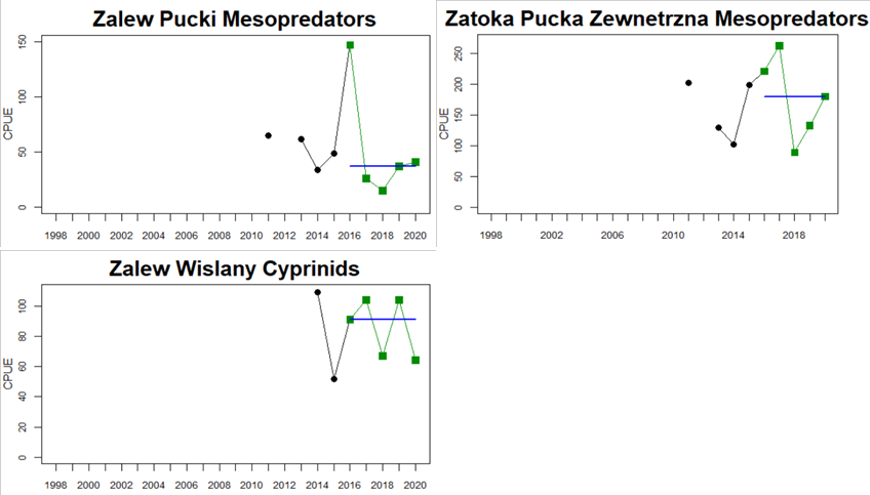
Figure 5. Cyprinid/mesopredator evaluation outcome. All evaluations are displayed per sub-basin and country for each monitoring location. In locations where the ASCETS approach is applied, threshold values are displayed by black dotted lines between fields in green (good status) and red (not good status), with the colour of the fields determined by the status during the reference period. The evaluation of good status/not good status is performed for the assessment period compared to the reference period by comparing the location of the median during the assessment period (full blue line) with the location of the respective threshold line. The 95th percentile intervals associated with the median displayed in hatched blue lines. Below each ASCETS graph, a small graph shows the smoothed bootstrapped medians of the indicator values from the reference period (bars in grey with a black line) and the assessment period (bars in blue with a blue line). For assessment units where the available data only allowed for a trend-based evaluation, green squares denote a good status evaluation outcome during the assessment period whereas red squares denote a not good status evaluation outcome. The hatched trend-line indicates a significant positive (green) and negative (red) trend at p < 0.1 during 2014-2020 for the times-series in each location.
4.3 Trends
There is a tendency for a slight decrease in the status of coastal fish in the Baltic Sea when considering cyprinids and mesopredators between this evaluation and HOLAS 2, conducted in 2018 including data until 2016 (Table 3). In three of the assessment units also considered in HOLAS 2, the status has decreased, and in the remaining ten assessment units there is no change over time in status. However, the decreased overall status partly reflects the inclusion of additional areas and functional groups (mesopredators) in some assessment units and areas (see comments in Table 3). The use of a stricter integrating approach across monitoring locations (majority rule in HOLAS 2 vs One-Out-All-Out principle in the current evaluation), might also contribute to the pattern observed.
Table 4. Overview of trends between current and previous evaluation in year 2018 (HOLAS 2, including data until 2016). For each HELCOM assessment unit, it is noted whether the integrated status using the BEAT tool achieves of fails to achieve the threshold value. The current integrated status is compared to the pervious status with regards to any distinct increasing or decreasing trend. In case of changed integrated status, the outcome is briefly described focusing on the relevant changes compared to the previous evaluation.
| HELCOM Assessment unit name | Threshold value: achieved/failed | Distinct trend between current and previous evaluation | Description of outcomes |
| Archipelago Sea Coastal waters | failed | no change | |
| Bornholm Basin Swedish Coastal waters | achieved | no change | |
| Bothnian Bay Finnish Coastal waters | NA | NA | Included in HOLAS 2, but not in HOLAS III |
| Bothnian Bay Swedish Coastal waters | achieved | no change | |
| Bothnian Sea Finnish Coastal waters | NA | NA | Included in HOLAS 2, but not in HOLAS III |
| Bothnian Sea Swedish Coastal waters | achieved | no change | |
| Eastern Gotland Basin Latvian Coastal waters | failed | no change | |
| Eastern Gotland Basin Lithuanian Coastal waters | failed | decrease | Inclusion of 3 new monitoring locations, all with GS, but status is decreased due to nGS in Mon/But |
| Gulf of Finland Finnish Coastal waters | failed | no change | |
| Gdansk Basin Polish Coastal waters | achieved | NA | Not included in HOLAS 2 |
| Gulf of Riga Estonian Coastal waters | failed | no change | |
| Gulf of Riga Latvian Coastal waters | failed | no change | |
| Northern Baltic Proper Swedish Coastal waters | failed | decrease | Inclusion of two new monitoring locations, status has decreased due to inclusion of Vaxholm |
| The Quark Finnish Coastal waters | NA | NA | Included in HOLAS 2, but not in HOLAS III |
| The Quark Swedish Coastal waters | failed | no change | |
| Western Gotland Basin Swedish Coastal waters | failed | decrease | Due to inclusion of mesopredators in Kvädöfjärden, status has decreased |
| Åland Sea Swedish Coastal waters | failed | no change |
4.4 Discussion text
The overall environmental status of coastal fish in the Baltic Sea is poor. When summarising the results across cyprinids and mesopredators good status is only achieved in 4 out of the 14 assessment units analysed. 32 monitoring locations are considered in total, and among these, good status is achieved in 20 locations only. In the locations classified as not good, the abundance of cyprinids and mesopredators was too high in all but two (Hiiumaa, Estonia, and Jurkalne, Latvia) of the 12 locations.
There are some geographical patterns in the status of the cyprinids/mesopredators. Good status is only achieved along the Swedish coasts of the Bothnian Bay and Bothnian Sea, as well as along the southernmost Swedish coast (Bornholm Basin) and Polish coastal areas (Gdansk Basin).
In general, the confidence varies between assessment units, countries and monitoring programmes since, for example, the number of years for which coastal fish monitoring has been carried out varies between locations, as does the spatial coverage of monitoring within assessment units. Generally, the confidence of the evaluation is higher in locations where monitoring started before 1999 and where data is available for all years during the assessment period (2016-2020) and where there is good spatial coverage of monitoring.
The confidence scoring followed the principles as outlined in the HELCOM integrated biodiversity assessment. Confidence was scored using four criteria with three different levels (1 = high, 0.5 = intermediate, and 0 = low). The criteria used were:
Confidence in the accuracy of the estimate (ConfA). In the ASCETS approach, confidence in the evaluation is determined by the C(S) value. C(S) varies between 0 and 1, with values <0.1 representing high confidence of changed status and values >0.9 high confidence of unchanged status (Level 1). Values of 0.1-0.3 represent medium confidence in changed status and 0.7-0.9 medium confidence in unchanged status (Level 0.5). Values of 0.3-0.5 represent low confidence of changed status and 0.5-0.7 low confidence in unchanged status (Level 0). In the trend-based approach, confidence in the evaluation is determined by the p-value of the linear regression, with p-values <0.05 representing high confidence in a trend, p<0.1 medium confidence in a trend, p 0.10-0.20 low confidence in no trend, p 0.21-0.49 medium confidence in no trend, and p 0.5-1.0 high confidence in no trend.
Confidence in the temporal coverage of evaluation (ConfT). Level 1 = data for all years during 2016-2020, 0.5 = data missing for one or two years during 2016-2020, and 0 = data missing for three or more years during 2016-2020.
Confidence in spatial representability of the evaluation (ConfS). Level 1 = full coverage/several monitoring locations per assessment unit given its size, 0.5 = two or more monitoring locations per assessment unit, and 0 = one monitoring location per assessment unit.
Methodological confidence (ConfM). For coastal fish all assessment units reach level 1 since all monitoring programs included in the evaluation are described in the coastal fish monitoring guidelines.
Table 5. Confidence in the status evaluation of the cyprinids/mesopredators indicator according to the criteria developed within HELCOM for the integrated biodiversity assessment.
The confidence in the accuracy of the evaluation (ConfA) is high in 14, medium in 11, and low in 7 of the in total 32 monitoring locations considered. In the locations scoring low for ConfA, there is either short time-series or substantial interannual variation in the indicator value during the assessment period leading to a lower confidence in the evaluation of status. The confidence in the temporal coverage (ConfT) is high in all areas except for the locations of Helsinki (Gulf of Finland, Finland) and Zatoka Pucka Zewnętrzna (Gulf of Gdansk, Poland) due to missing data in one or more of the years in the assessment period. The confidence in spatial representability (ConfS) is only high along the Lithuanian and Polish coasts and low along the southern Swedish coast (Arkona basin) and in Latvian and Estonian coastal waters. In all other areas, ConfS is scored as being intermediate. The methodological confidence (ConfM) is high an all locations evaluated. The integrated confidence considering all four categories varies between high (five assessment units) and intermediate (nine assessment units), but with no clear spatial pattern (Figure 6).
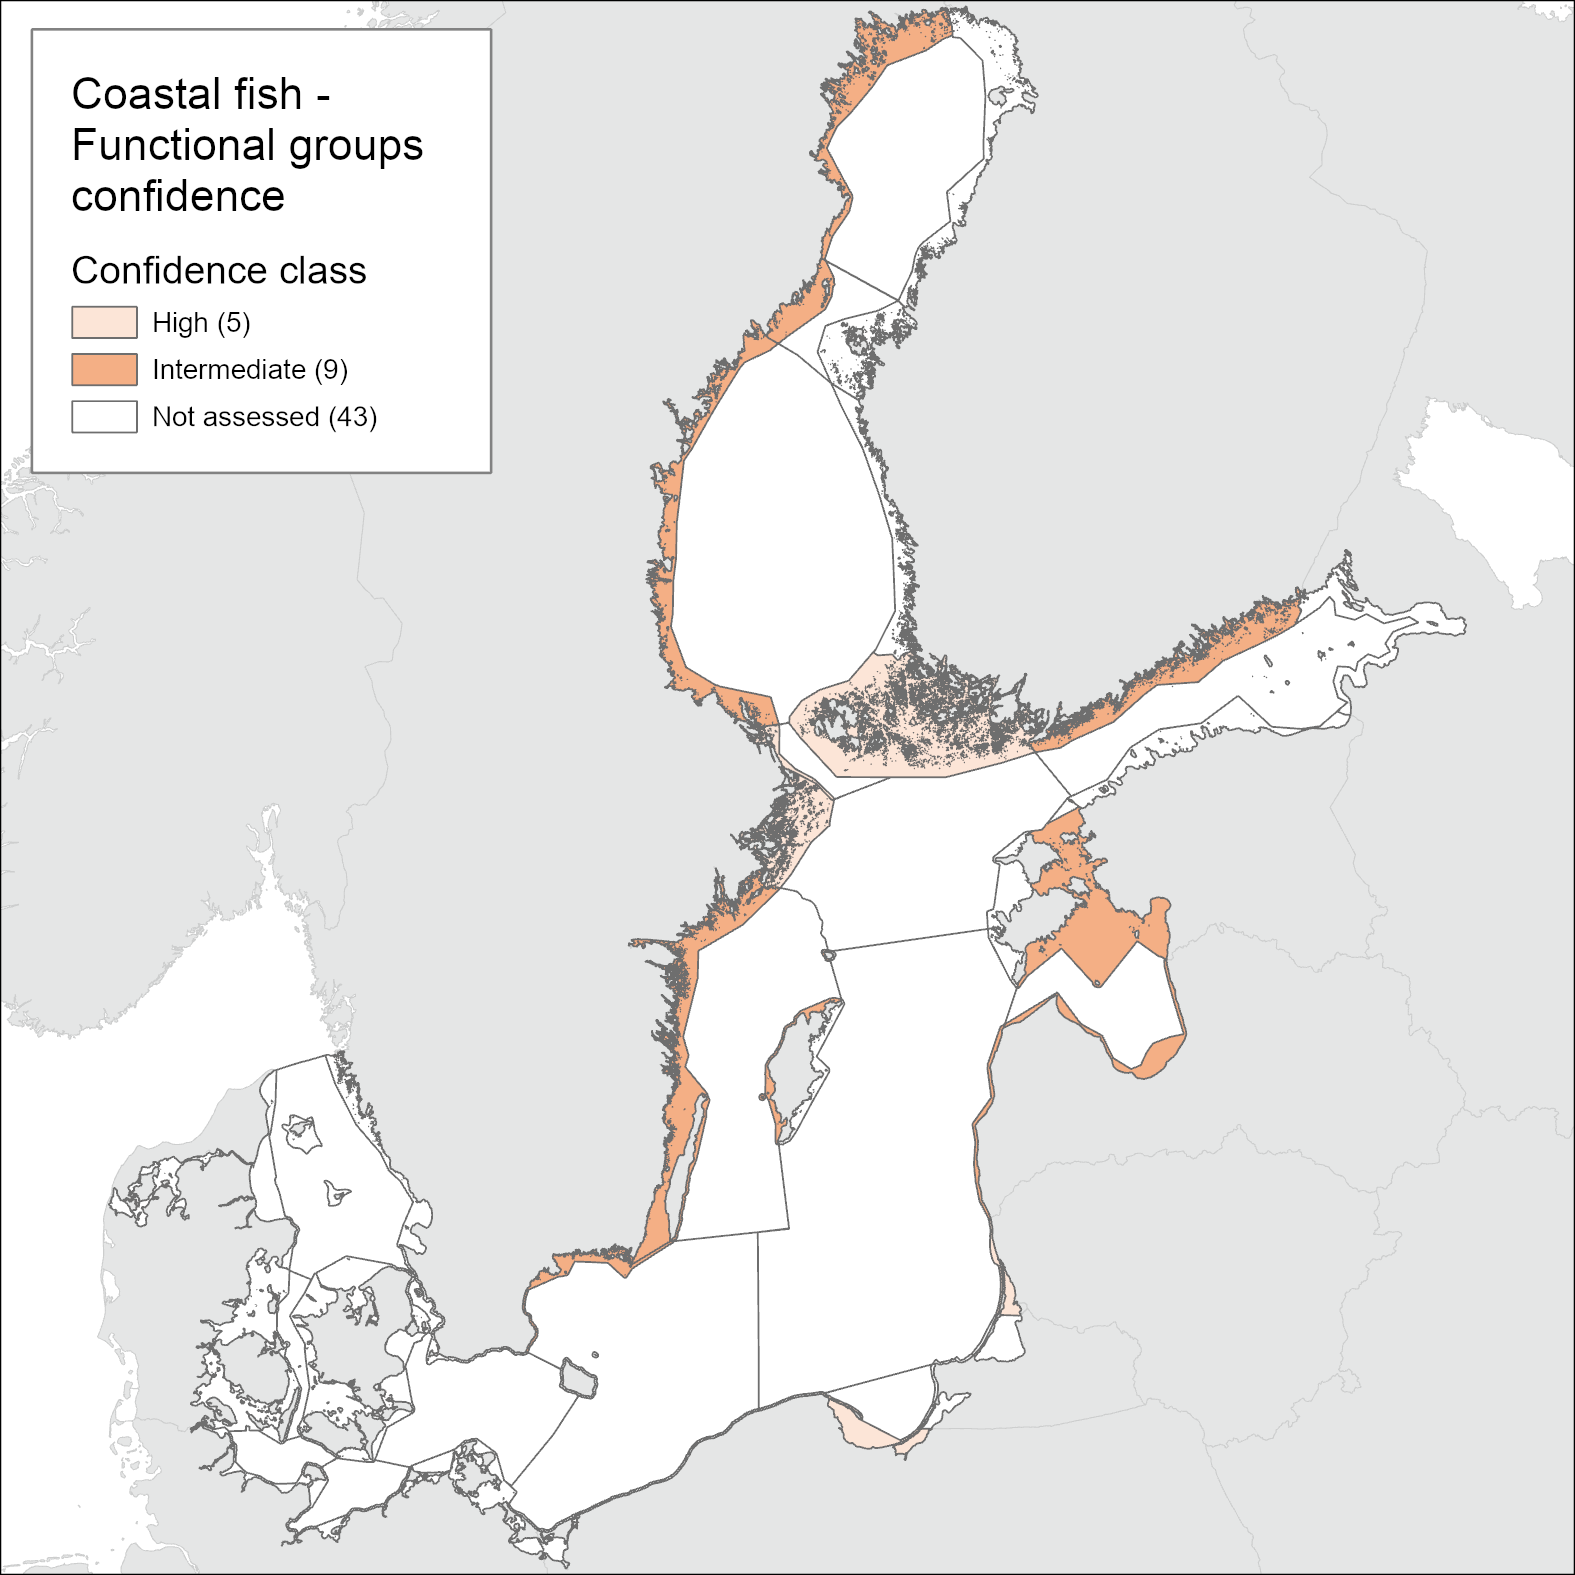
Figure 6. Map of confidence of the current evaluation of the cyprinids/mesopredators indicator. See Table 5 for details.
The confidence concept as developed for the HELCOM integrated biodiversity assessment is not fully applicable to coastal fish as further evaluation of the precision in data and the congruence in status across monitoring locations within assessment units would provide additional information that is needed.
The state of key functional groups of coastal fish in the Baltic Sea is influenced by multiple pressures, including climate, eutrophication, exploitation of essential habitats, and in a few areas fishing mortality. Natural processes such as food web interactions and predation from apex predators are also of importance.
The functional groups considered in this indicator are generally heavily affected by the impacts of a changing climate (Olsson et al. 2012; Bergström et al. 2016b, 2019; Östman et al. 2017b) (cf. Chapter 7), including alterations in the food web (Eriksson et al. 2009; 2011; Östman et al. 2016), the impact of increased water temperature and, for cyprinids in particular, also lowered salinity (Härmä et al. 2008; Östman et al. 2017b).
Among pressures related to human activities, exploitation of essential habitats (Sundblad et al. 2014; Sundblad & Bergström 2014; Kraufvelin et al. 2018) impact cyprinids/mesdopredators throughout the Baltic, whereas fishing generally affects mainly cyprinids locally in Sweden and Finland (Lappalainen et al. 2019; Dahlin et al. 2021), and to some extent in the Baltic States and Polish coasts.
The effect of eutrophication on the state of coastal fish communities do mainly affect cyprinids (Härmä et al. 2008; Bergström et al. 2016b, 2019), and might increase with higher latitude (Östman et al. 2017b).
Cyprinids and mesopredatory fish species typically represent lower trophic levels in being planktivores and benthivores. As such, these groups of species are both impacted by bottom-up mechanisms such as eutrophication (Härmä et al. 2008; Östman et al. 2016) as well as by top-down regulation by piscivorous fish species (Eriksson et al. 2011; Baden et al. 2012; Casini et al. 2012; Östman et al. 2016) and apex predators (Östman et al. 2012; Hansson et al. 2018). Hence, high abundances of cyprinids and mesopredators often characterize ecosystems in an undesirable environmental state.
Natural interactions such as predation pressure from apex predators, foremost cormorants (Phalacrocorax carbo), could at least locally impact the state of coastal fish communities (Vetemaa et al. 2010; Östman et al. 2012; Hansson et al. 2018). In some areas the outtake of coastal fish by cormorants exceeds, or is of a similar magnitude, to that of the commercial and recreational fisheries (Östman et al. 2013; Hansson et al. 2018). The state of groups of mesopredatory fish species such as wrasses, sticklebacks and gobies, and potentially also cyprinids, could be affected by the food web structure in coastal areas and neighbouring ecosystems (Eriksson et al. 2011; Baden et al. 2012; Casini et al. 2012). Especially decreased predation pressure from declining stocks of piscivorous fish species might favour the increase in abundance of mesopredatory fish species (Östman et al. 2016). On the other hand, the mesopredators are an important part of the diet of cormorants, which may locally compensate the lack of predatory fish.
Table 6. Brief summary of relevant pressures and activities with relevance to the indicator.
| | General | MSFD Annex III, Table 2a |
| Strong link | Several pressures, both natural and human, acting in concert affect the state of key functional groups of coastal fish. These include climate, eutrophication, fishing, and exploitation and loss of essential habitats. To date, no analyses on the relative importance of these variables have been conducted. | Biological Extraction of, or mortality/injury to, wild species (e.g. selective extraction of species, including incidental non-target catches)PhysicalPhysical disturbance to seabed (e.g. abrasion and selective extraction)Physical loss (e.g.sealing) Changes to hydrological processes (e.g. significant changes in thermal and/or salinity regime) SubstancesInputs of nutrients (e.g. inputs of fertilisers and other nitrogen and phosphorus-rich substances) |
| Weak link | There might also be effects of hazardous substances and non-indigenous species on the state of coastal fish key functional groups | Substances
Input of other substances (e.g. synthetic substances, non-synthetic substances, radionuclides) Biological Input or spread of non-indigenous species |
The functional groups considered in this indicator are generally heavily affected by the impacts of a changing climate (Olsson et al. 2012; Bergström et al. 2016b, 2019; Östman et al. 2017b), including alterations in the food web (Eriksson et al. 2009; 2011; Östman et al. 2016), the impact of increased water temperature and, for cyprinids in particular, also lowered salinity (Härmä et al. 2008; Östman et al. 2017b) (cf. section 6 of this report).
8.1 Future work or improvements needed
Due to the presence of natural environmental gradients across the Baltic Sea, and the rather local appearance of coastal fish communities (and hence their differing structures and responses to environmental change), the spatial coverage of monitoring should be improved in some areas in order to enhance the confidence of the evaluation outcome. When designating new potential monitoring programmes, it should be considered that the levels of direct human impact on the coastal fish communities in many of the existing monitoring areas are low, and future locations should also include more heavily affected areas.
In addition, as a multitude of factors with natural environmental gradients in the Baltic Sea potentially impact coastal fish communities and species, the magnitude of importance of different factors in different coastal areas should be understood. A more mechanistic understanding of how pressures impact upon coastal fish in local contexts will enable managers to take relevant measures to halt declining trends of coastal fish species in some coastal areas.. More specifically, the role of fishing (both commercial and recreational) and natural predation needs further investigation.
This indicator uses two different approaches for evaluating whether Good Status is achieved. The approach used depends on the availability of data. If certain criteria are met, the ASCETS method is used (Östman et al. 2020). If not, the trend-based approach is used.
The methodology and basis of the indicator evaluation is provided below.
9.1 Scale of assessment
Due to the local appearance of typical coastal fish populations, status evaluations of coastal fish communities are representative of rather small geographical scales, however, there is scope to further interrogate the citizen science monitoring data to try and develop a mesopredator index independent of the abundances of flounder and eelpout, which are currently used in the “Abundance of coastal fish species” indicator. In this evaluation the HELCOM assessment unit scale 3 ‘Open sub-basin and coastal waters’ has been applied. The indicator is not evaluated for the open sea sub-basins since the species in focus are coastal.
Evaluations for both indicators were carried out for 16 coastal HELCOM assessment units, but in two Swedish units the time-series was too short to allow for an evaluation against a quantitative threshold value. The number of units evaluated is currently restricted by the availability of monitoring data.
For the integration of status across species and monitoring locations within assessment units, the One-Out-All-Out principle is applied (Dierschke et al. 2021).
The assessment units are defined in the HELCOM Monitoring and Assessment Strategy Annex 4.
9.2 Methodology applied
ASCETS approach
Coastal fish datasets must meet certain criteria in order to be able to apply an evaluation of good status using the ASCETS approach:
- The time period used to determine the reference period should cover a minimum number of years that is twice the generation time of the species most influential in the indicator evaluation. This is to ensure that the influences of strong year classes are taken into account. For coastal fish, this is typically about ten years. In this evaluation, the time period used to determine the reference period against which good status is evaluated spans the years 1998 to 2015, with varying numbers of years depending on data availability for each time series.
- Before evaluating good status, it should be decided whether or not the reference period reflects good status. If a previous status evaluation exists from HOLAS 2, the reference period is assigned the same status as the assessment period in HOLAS 2 (2011-2016). If a previous status evaluation does not exist, this can is done by using data dating back earlier than the start of the period used to determine the reference period, using additional information, or by expert judgment. For example, if data from time periods preceding the period used for determining the reference period have much higher indicator values, the reference might represent not good status (in case of an indicator where higher values are indicative of a good environmental state) or good status (in case of an indicator where higher values are indicative of an undesirable state).
The ASCETS method (Östman et al. 2020) offers a refined approach to infer structural changes in indicator values over time and establish threshold values for the state during a reference period based on the observed variation in indicator values. ASCETS also gives estimates on the confidence of an apparent change in state of indicator values between a reference period and an assessment period. Thus, by applying ASCETS to time series data, it is possible to derive threshold values for addressing structural changes in indicator values over time and a developed evaluation of the confidence of the derived current indicator state relative to previous indicator values. To determine the status of the indicator, the ASCETS method first derives a bootstrapped distribution of median values from a time series of observed indicator values during a reference period. Specific threshold values for changes in indicator state is set based on the Xth and XXth percentile values of the bootstrapped distribution. For functional groups, the percentiles are 5 and 95/98 percent (depending on the status of the reference period, see below), representing the confidence interval of median indicator values. In this way, the derived boundaries of the confidence interval can function as threshold values for a change in state per assessment unit of each species. Because ASCETS bootstraps median indicator values during the reference period it is possible that one or several observed indicator values during the reference period will fall outside of the 95% confidence interval, because the bootstrapping reduces the influence of what may be large sampling errors. Second, the bootstrapped median indicator value during the assessment period is evaluated in relation to the threshold values derived from the reference period depending on how much of the bootstrapped median distribution from the assessment period that falls below, within, or above the Xth and XXth percentiles (cf. Figure 3 and decision tree in Figure 7):
- In situations where the baseline state reflects good status, the median of the years in the assessment period should be above the 5th percentile and below the 95th percentile to reflect good status.
- In situations where the baseline state reflects not good status, in order to reflect good status, the median of the years in the assessment period should be above the 98th percentile if the baseline status is indicative of too low abundances, and below the 5th percentile if the baseline status is indicative of too high abundances.
Trend-based approach
If the requirements for defining quantitative baseline conditions are not met (e.g. short time series), then a trend-based evaluation should be used. All available data starting from year 2014 is included in trend analyses.
In the trend based approach, good status is defined based on the direction of the trend compared to the desired direction of the indicator over time (cf. Figure 4). Where the first years in the evaluated time series represent good status, the trend of the indicator over time should not exhibit any direction in order to reflect good status. If, on the other hand, the first years of the evaluated time series represent not good status, the trend should be in the desired direction to reflect good status. The significance level for these trends should be p <0.1.
Decision tree for evaluation using coastal fish community structure
The assessment protocol is found in figure 7.
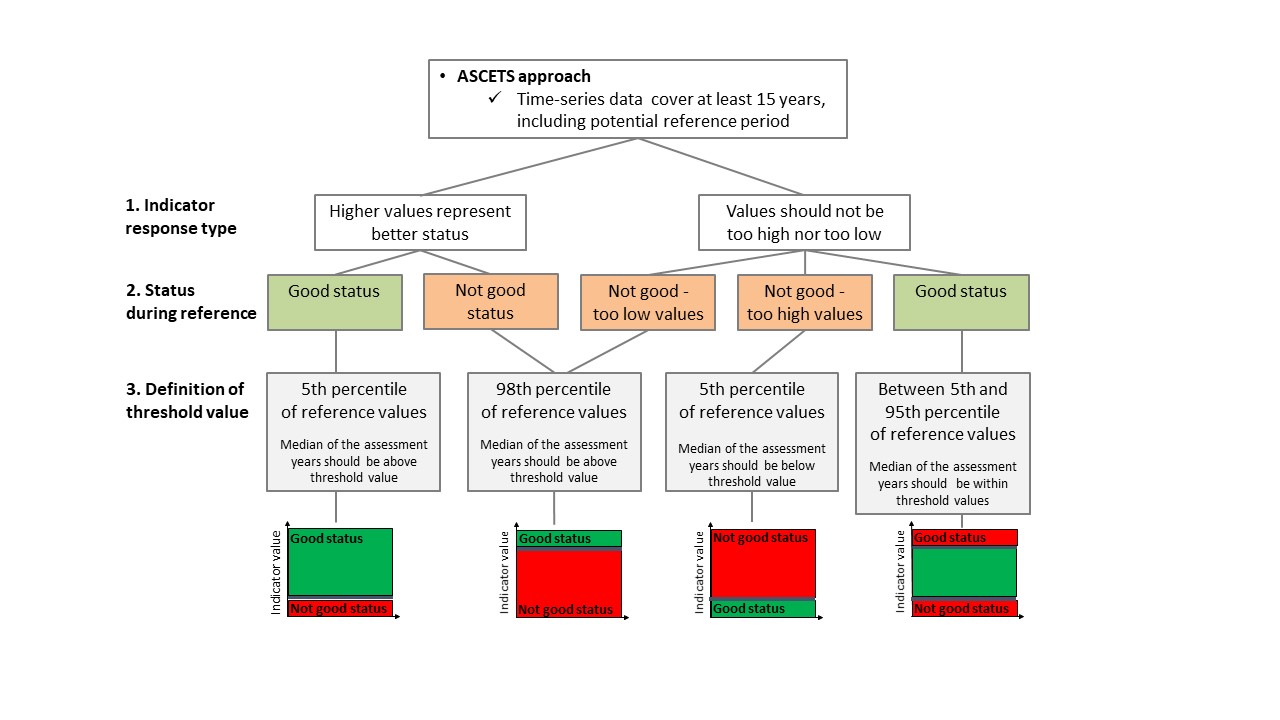
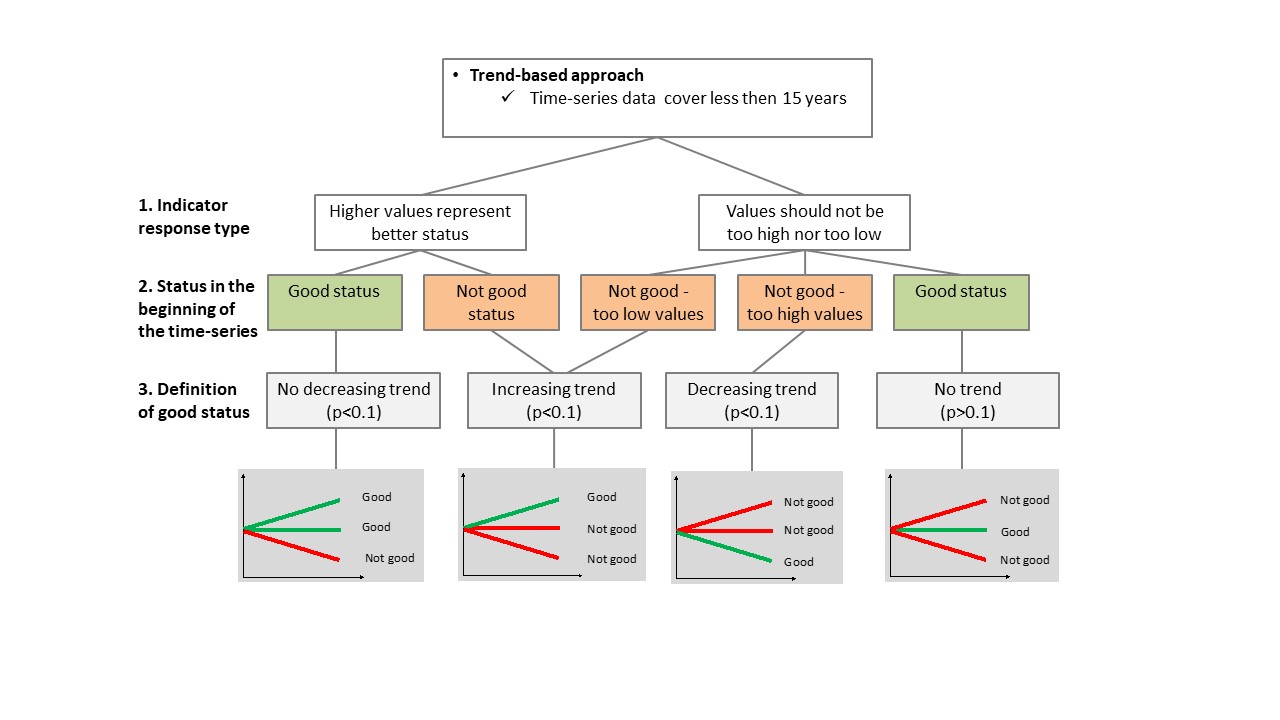
Figure 7. Decision tree for status evaluation using coastal fish community structure. ASCETS approach (top figure) and the threndbased approach (bottom figure) are presented.
Data analyses
The data used for the evaluations are derived from fishery independent monitoring. The analyses are based on catch per unit effort (CPUE) data from annual averages of all sampling stations in each area. Individuals smaller than 12 cm (Nordic Coastal multimesh nets) or 14 cm (other net types) were excluded from the evaluation in order to only include species and size-groups suited for quantitative sampling by the method. Abundance is calculated as the number of individuals of the species included in the indicator per unit effort (CPUE).
9.3 Monitoring and reporting requirements
Monitoring methodology
The HELCOM common monitoring on coastal fish is described on a general level in the
HELCOM Monitoring Manual in the sub-programme: Coastal fish.
The HELCOM common monitoring on coastal fish is described in guidelines that were adopted in 2014 and updated in 2019.
Current monitoring
The monitoring activities relevant to the indicator that are currently carried out by HELCOM Contracting Parties are described in the HELCOM Monitoring Manual in the Monitoring Concepts table as well as in the guidelines for coastal fish monitoring.
Sub-programme: Coastal fish
Coastal fish monitoring is rather widespread in the Baltic Sea, and at present covers 32 of the in total 42 ‘scale 3 HELCOM assessment units’. Coastal areas that lack coastal fish monitoring includes Russia and Germany (in total 7 assessment units) where there is no current and official monitoring program for coastal fish, two assessment units in Finland (Åland Sea Finnish coastal waters and Northern Baltic Proper Finnish coastal waters) and one in Denmark (Kiel Bight Danish coastal waters). The current monitoring where information cyprinds/mesopredators can be extracted to date is less extensive, covering 14 assessment units.
The current monitoring of coastal fish in the Baltic Sea represents a minimum level of effort and serves as a first step for evaluating the status of coastal fish communities.
The current monitoring likely yields insights into major and large-scale changes in coastal fish communities in the Baltic Sea, but unique and departing responses are possible in some areas.
In Estonia and Latvia, coastal fish monitoring is carried out at several locations, but the evaluation has only been made for one location in Estonia and two in Latvia. In Denmark, no data is available to support the cyprinids/mesopredators, and the Finnish commercial catch data is not applicable for assessing status of non-targeted fish species. In Germany, there is no coordinated monitoring program for coastal fish, but a project aiming to establish such a program was initiated in 2020 in the coastal areas of Schleswig-Holstein.
The data and resulting data products (e.g. tables, figures and maps) available on the indicator web page can be used freely given that it is used appropriately and the source is cited.
Result: Abundance of coastal fish key functional groups – integrated result
Result: Abundance of coastal fish key functional groups – cyprinids
Result: Abundance of coastal fish key functional groups – mesopredators
Data: Abundance of coastal fish key functional groups
Data are typically collected annually in August by national and regional monitoring programmes (cf. HELCOM (2019) for details). For future updates of this evaluation, data should be collected in each location on an annual basis.
A few time series of coastal fish began in the 1970s (Olsson et al. 2012), whereas others were started in the 1980s and the mid-1990s (HELCOM 2019). In Finland and Sweden, a new coastal fish monitoring programme with a higher spatial resolution was established in the early 2000s, and in Poland monitoring data is typically available from the mid 2010s. For more information, see HELCOM 2019.
The raw data on which this evaluation is based, are stored in national databases. Each country has its own routines for quality assurance of the stored data. From 2017, each country calculates indicator values for their monitoring locations from the raw data from fish monitoring. The indicator data and values are then during the first half of the year uploaded to the HELCOM database for coastal fish core indicators, COOL as hosted by the HELCOM secretariat. Indicator data for status evaluations are extracted from the COOL database, and the evaluation undertaken by the lead country (Sweden) according to the assessment protocol outlined in this report.
Data source
Coastal fish monitoring is coordinated within the HELCOM FISH-PRO III expert network. The network compiles data from various sources of data for coastal fish in Finland, Estonia, Latvia, Lithuania, Poland, Germany, Denmark and Sweden (HELCOM 2019). In Germany, there is no coordinated monitoring program for coastal fish, but a project aiming to establish such a program was initiated in 2020 in the coastal areas of Schleswig-Holstein.
The institutes responsible for sampling are: Natural Resources Institute Finland (Luke) (Finland), Provincial Government of Åland Islands (Finland), Estonian Marine Institute (Estonia), University of Tartu (Estonia), Institute of Food Safety, Animal Health and Environment “BIOR” (Latvia), Nature Research Center (Lithuania), Klaipeda University (Lithuania), National Marine Fisheries Research Institute, Gdynia (Poland), Association Fish and Environment Mecklenburg-Vorpommern e.V. (Germany), University of Rostock (Germany), National Institute of Aquatic Resources, Technical University of Denmark (Denmark), Department of Aquatic Resources, Swedish University of Agricultural Sciences (Sweden).
The HELCOM FISH PRO III expert network on coastal fish:
Jens Olsson, Elisabeth Bolund, Lena Bergström, Örjan Östman, Noora Mustamäki and Rahmat Naddafi, Department of Aquatic Resources, Swedish University of Agricultural Sciences, Sweden
Mikko Olin and Antti Lappalainen, Natural Resources Institute Finland (Luke), Finland
Linda Sundström, Provincial Government of Åland Islands, Finland
Lauri Saks and Roland Svirgsden, Estonian Marine Institute, University of Tartu, Estonia
Laura Briekmane, Institute of Food Safety, Animal Health and Environment “BIOR”, Latvia
Tomas Zolubas and Antanas Kontautas, Klaipeda University, Lithuania.
Linas Lozys and Justas Dainys,Nature Research Center, Vilnius, Lithuania
Adam Lejk and Łukasz Dziemian, National Marine Fisheries Research Institute, Gdynia, Poland
Elliot John Brown, National Institute of Aquatic Resources, Technical University of Denmark, Denmark
HELCOM Secretariat: Jannica Haldin, Owen Rowe.
This version of the HELCOM core indicator report was published in April 2023:
The current version of this indicator (including as a PDF) can be found on the HELCOM indicator web page.
Earlier versions of the core indicator report include:
Abundance of coastal fish key functional groups HELCOM core indicator 2018 (pdf)
HOLAS 2 component – Core indicator report – web-based version July 2017 (pdf)
Core indicator report – web-based version October 2015 (pdf)
Extended core indicator report – outcome of CORESET II project (pdf) (2015)2013 Indicator report (pdf)
Baden, S. et al. (2012) Shift in seagrass food web structure over decades is linked to overfishing. Mar Ecol Prog Ser 451: 61–73.
Bergström, L. et al. (2016a) Long term changes in the status of coastal fish in the Baltic Sea. Estuarine, Coastal and Shelf Science, 169: 74–84.
Bergström, L. et al. (2016b) Coastal fish indicators response to natural and anthropogenic drivers – variability at temporal and different spatial scales Long term changes in the status of coastal fish in the Baltic Sea. Estuarine, Coastal and Shelf Science 183: 62–72.
Bergström, L. et al. (2019) Relative impacts of fishing and eutrophication on coastal fish assessed by comparing a no-take area with an environmental gradient. Ambio 48: 565-579.
Casini, M. et al. (2012) Predator transitory spillover induces trophic cascades in ecological sinks. PNAS 109: 8185-8189.
Dahlin, I. et al. (2021) Fishing cyprinids for food-Evaluation of ecosystem effects and contaminants in cyprinid fish. Sveriges lantbruksuniversitet. Aqua reports; 2021:20.
European Commission (2008) Directive 2008/56/EC of the European Parliament and of the Council of 17 June 2008 establishing a framework for community action in the field of marine environmental policy. Official Journal of the European Union L164, 19–40.
Eriksson, B.K. et al. (2009) Declines in predatory fish promote bloom-forming macroalgae. Ecological Applications 19: 1975-1988.
Eriksson, B.K. et al. (2011) Effects of altered offshore food webs on coastal ecosystems emphasizes the need for cross-ecosystem management. Ambio 40: 786-797.
et al.et al.Dierschke V. et al. (2021) Integration methods for Marine Strategy Framework Directive’s biodiversity assessments, EUR 30656 EN, Publications Office of the European Union, Luxembourg.
Hansson, S. et al. (2018) Competition for the fish – fish extraction from the Baltic Sea by humans, aquatic mammals, and birds. ICES J Mar 75: 999-1008.
HELCOM (2012) Indicator-based assessment of coastal fish community status in the Baltic Sea 2005-2009. Baltic Sea Environment Proceedings No. 131.
HELCOM (2019) Guidelines for coastal fish monitoring sampling methods of HELCOM. Online.
HELCOM (2015b) Recreational fisheries in the Baltic Sea and availability of data. http://www.helcom.fi/Documents/HELCOM%20at%20work/Projects/FISH-PRO%20II/Recreational%20fisheries%20in%20the%20Baltic%20Sea%20and%20availability%20of%20data.pdf
Kraufvelin, P. et al. (2018) Essential coastal habitats for fish in the Baltic Sea. Estuarine, Coastal and Shelf Science 204: 14-30.
Härmä, M. et al. (2008) Reproduction areas of roach (Rutilus rutilus) in the northern Baltic Sea: potential effects of climate change. Canadian Journal of Fisheries and Aquatic Science 65(12): 2678–2688.
Laikre, L. et al. (2005) Spatial genetic structure of northern pike (Esox lucius) in the Baltic Sea. Mol Ecol 14: 1955–1964.
Lappalainen, A. et al. (2019). Tehostetun pyynnin vaikutuksista Saaristomeren lahna- ja särkikantoihin. [About the effects of targeted fishing on the Archipelago Sea bream and roach stocks] Luonnonvara- ja biotalouden tutkimus 74.
Möllmann, C. et al. (2009) Reorganization of a large marine ecosystem due to atmospheric and anthropogenic pressure: a discontinuous regime shift in the Central Baltic Sea. Global Change Biology 15: 1377–1393.
Olsson, J. et al. (2011) Genetic population structure of perch, Perca fluviatilis L, along the Swedish coast of the Baltic Sea. Journal of Fish Biology 79: 122–137.
Olsson, J. et al. (2012) Abiotic drivers of coastal fish community change during four decades in the Baltic Sea. ICES Journal of Marine Science 69: 961-970.
Östman, Ö. et al. (2012) Do cormorant colonies affect local fish communities in the Baltic Sea? Canadian Journal of Fisheries and Aquatic Sciences 69: 1047-1055.
Östman, Ö. et al. (2013) Estimating competition between wildlife and humans – a case of cormorants and coastal fisheries in the Baltic Sea. Plos One 8: e83763.
Östman, Ö. et al. (2016) Top‐down control as important as nutrient enrichment for eutrophication effects in North Atlantic coastal ecosystems. Journal of Applied Ecology. 53:1138-1147
Östman, Ö. et al. (2017a) Inferring spatial structure from population genetics and spatial synchrony in population growth of Baltic Sea fishes: implications for management. Fish and Fisheries. 18: 324-339.
Östman, Ö. et al. (2017b) Temporal development and spatial scale of coastal fish indicators in reference sites in coastal ecosystems: hydroclimate and anthropogenic drivers. Journal of Applied Ecology. 2: 557-566.
Östman, Ö. et al. (2020) Analyses of structural changes in ecological time series (ASCETS). Ecological Indicators 116: 106469.
Saulamo, K., Neuman, E. (2002) Local management of Baltic fish stocks – significance of migrations. Finfo 2002, No. 9.
Sundblad, G. et al. (2014) Nursery habitat availability limits adult stock sizes. ICES Journal of Marine Science 71: 672-680.
Sundblad, G., Bergström, U. (2014) Shoreline development and degradation of coastal fish reproduction habitats. Ambio 43: 1020-1028.
Vetemaa, M. et al. (2010) Changes in fish stocks in an Estonian estuary: overfishing by cormorants? ICES Journal of Marine Science 67: 1972–1979.
Bergström, U. et al. (2007) Effekter av fredningsområden på fisk och kräftdjur i svenska vatten. (In Swedish) Finfo 2007:2.
Bergström, U. et al. (2013) Evaluating eutrophication management scenarios in the Baltic Sea using species distribution modelling.
Böhling, P. et al. (1991) Variations in year-class strength of different perch (Perca fluviatilis) populations in the Baltic Sea with special reference to temperature and pollution. Canadian Journal of Fisheries and Aquatic Sciences 48: 1181-1187.
Edgren, J. (2005) Effects of a no-take reserve in the Baltic Sea on the top predator, northern pike (Esox lucius). Master thesis, Stockholm University.
Fenberg, P.B. et al. (2012) The science of European marine reserves: Status, efficacy, and future needs. Marine Policy 36(5): 1012-1021.
Florin, A.B. et al. (2013) Effects of a large northern European no‐take zone on flatfish populations. Journal of fish biology 83(4): 939-962.
Heikinheimo, O. et al. (2014) Spawning stock – recruitment relationship in pikeperch, Sander lucioperca, in the Baltic Sea, with temperature as environmental effect. Fisheries Research 155: 1–9.
Heikinheimo, O. et al. (2016) Estimating the mortality caused by great cormorant predation on fish stocks: pikeperch in the Archipelago Sea, northern Baltic Sea, as an example. Can. J. Fish. Aquat. Sci. 73: 84–93.
Kokkonen, E. et al. (2015) Probabilistic maturation reaction norm trends reveal decreased size and age at maturation in an intensively harvested stock of pikeperch Sander lucioperca. Fisheries Research 167: 1–12.
Lappalainen, A., et al. (2016) Length at maturity as a potential indicator of fishing pressure effects on coastal pikeperch (Sander lucioperca) stocks in the northern Baltic Sea. Fisheries Research 174: 47–57.
Lehikoinen, A. et al. (2011) Temporal changes in the diet of great cormorant (Phalacrocorax carbo sinensis) on the southern coast of Finland – comparison with available fish data. Boreal Environment Research 16 (suppl. B): 61-70.
Lehikoinen, A., et al. (2017) The role of cormorants, fishing effort and temperature on the catches per unit effort of fisheries in Finnish coastal areas. Fisheries Research 190: 175–182.
Linlokken, A. et al. (2008) Environmental correlates of population variables of perch (Perca fluviatilis) in boreal lakes. Environmental Biology of Fishes 82(4): 401-408.
Neuman, E. (1974) Temperaturens inverkan på rörelseaktivteter hos fisk i en Östersjövik. (In Swedish) Statens naturvårdsverk, PM 477. 84 pp.
Olsson, J., et al. (2015) Using catch statistics from the small scale coastal Baltic fishery for status assessment of coastal fish. Aqua reports 2015:13. Sveriges lantbruksuniversitet, Öregrund. 65 pp.
Smoliński, S., Całkiewicz, J. (2015) A fish-based index for assessing the ecological status of Polish transitional and coastal waters. Marine Pollution Bulletin, 101: 497–506.
Thoresson, G. (1996) Guidelines for coastal fish monitoring. Swedish Board of Fisheries, Kustrapport 1996:2.
Voipio, A. (1981) The Baltic Sea. Elsevier, Helsinki.