 Coastal fish key species
2 Relevance of the indicator
Coastal fish communities are of high ecological and socio-economic importance in the Baltic Sea, both for ecosystem functioning and for recreational and small-scale coastal commercial fishery activities. As such, the state of coastal fish communities generally reflects the ecological state in the coastal ecosystems.
Changes in the long-term development of the abundance of key coastal fish species mainly reflects effects of changes in the level of human exploitation (fishing and habitat degradation), natural predation pressure, increased water temperature and altered hydrographical conditions, and eutrophication in coastal areas.
2.1 Ecological relevance
Coastal fish, especially piscivorous species, are recognized as being important components of coastal food webs and ecosystem functioning (Eriksson et al. 2009; Baden et al. 2012; Olsson et al. 2012; Östman et al. 2016; Olsson 2019). Moreover, since many coastal fish species are rather local in their appearance (Saulamo & Neuman 2005; Laikre et al. 2005; Olsson et al. 2011; Östman et al. 2017a), the temporal development of coastal fish communities might reflect the general environmental state in the monitoring locations (Bergström et al. 2016b; Östman et al. 2017b).
Piscivorous fish species in coastal ecosystems generally have a structuring role in the ecosystem, mainly via top-down control on lower trophic levels (reviewed in Olsson 2019). Viable populations of key coastal fish species are generally considered to reflect an environmental status with few eutrophication symptoms and balanced food webs (Eriksson et al. 2011; Baden et al. 2012; Östman et al. 2016; Eklöf et al. 2020). Key coastal fish species are generally piscivores and/or benthivores species.
2.2 Policy relevance
The core indicator is relevant to the following specific 2021 Baltic Sea Action Plan actions:
- B15: Develop and coordinate monitoring and assessment methods, where ecologically relevant, for specified representative coastal fish species, populations and communities, by 2023. Based on these assessment methods, to regularly assess the state of the coastal fish community through selected coastal fish species and groups, including threatened species, by at latest 2023. Based on the results of the assessment, develop and implement management measures with the ambition to maintain or improve the status of coastal fish species, including migratory species by 2027. Cross-reference to actions in other segments.
- B35: By 2024 operationalize a set of indicators for the assessment of fish population health, including size and age distribution, where applicable, and, by 2029, for any remaining relevant species.
The core indicator also addresses the following qualitative descriptors of the MSFD for determining good environmental status:
An overview is provided in Table 1.
Table 1. Policy relevance of this specific HELCOM indicator.
| Baltic Sea Action Plan (BSAP) | Marine Strategy Framework Directive (MSFD) | |
| Fundamental link | Segment: Biodiversity
Goal: “Baltic Sea ecosystem is healthy and resilient”
|
Descriptor 1 Species groups of birds, mammals, reptiles, fish and cephalopods. Species of birds, mammals, reptiles and non-commercially-exploited species of fish and cephalopods, which are at risk from incidental by-catch in the region or subregion.
|
| Complementary link | Segment: Hazardous substances
Goal: “Baltic Sea unaffected by hazardous substances and litter”
|
Descriptor 3 Populations of all commercially-exploited fish and shellfish are within safe biological limits, exhibiting a population age and size distribution that is indicative of a healthy stock. Commercially-exploited fish and shellfish.
|
| Other relevant legislation: |
|
|
Descriptor 1: ‘Biological diversity is maintained. The quality and occurrence of habitats and the distribution and abundance of species are in line with prevailing physiographic, geographic and climatic conditions’
Descriptor 3: ‘Populations of commercially exploited fish and shellfish are within safe biological limits, exhibiting a population age and size distribution that is indicative of a healthy stock’
and the following criteria of the Commission Decision:
- Criterion D1C3 (population demographic characteristics of the species),
- Criterion D3C3 (the age and size distribution of individuals in the population).
In some Contracting Parties the indicator also has potential relevance for implementation of the EU Habitats Directive.
The indicator supports the UN Sustainable Development Goal 14: Conserve and sustainably use the oceans, sea and marine resources for sustainable development.
2.3 Relevance for other assessments
The status of biodiversity is assessed using several core indicators. Each indicator focuses on one important aspect of the complex issue. In addition to providing an indicator-based assessment of the abundance of key coastal fish species, this indicator also contributes to the overall biodiversity assessment along with the other biodiversity core indicators.
3 Threshold values
Good Status is achieved when key species abundance is above a specified threshold value. The quantitative threshold values for coastal fish are based on location-specific reference conditions where time series covering more than 15 years are available (ten or more years potential reference period + five or more years assessment period). In areas where shorter time series are available (<15 years), a trend-based approach is used. The specific approach used in the various monitoring locations is presented in the Results section.
A reference period needs to be defined for determining the threshold value. The period used to define the reference needs to cover at least ten years in order to extend over more than twice the generation time of the typical species represented in the indicator and thus cater for natural variation in the indicator value, due for example to strong and weak year classes. For the period used to determine the reference to be relevant, it must also be carefully selected to reflect time periods with stable environmental conditions, as stated within the MSFD (European Commission 2008). Substantial turnovers in ecosystem structure in the Baltic Sea were apparent in the late 1980s, leading to shifts in the baseline state (Möllmann et al. 2009), and for coastal fish communities, substantial shifts in community structure have been demonstrated in the late 1980s and early/mid 1990s (Olsson et al. 2012; Bergström et al. 2016a). In some areas, there have also been minor shifts in fish community structure later. To account for this, the ASCETS method (Östman et al. 2020) is applied on time-series with more than 15 years of data. This method offers a refined approach to infer structural changes in indicator values over time and establish threshold values for the state during a reference period based on the observed variation in indicator values.
Estimates of the relative abundance and/or biomass of key coastal fish species are used to evaluate whether the threshold value is achieved or not. These estimates are derived from fishery independent monitoring, citizen science and/or commercial catch statistics. Since there are strong environmental gradients in the Baltic Sea and coastal fish communities and stocks are typically local in their appearance and respond mainly to area specific environmental conditions, the evaluations for coastal key fish species are carried out on a relatively local scale.
The assessment period applied when using the ASCETS methods should cover at least five years to cater for natural variability. Good status is evaluated based on the deviation of the median value of the indicator during the assessment period in relation to the threshold value (Figures 2 and 3).
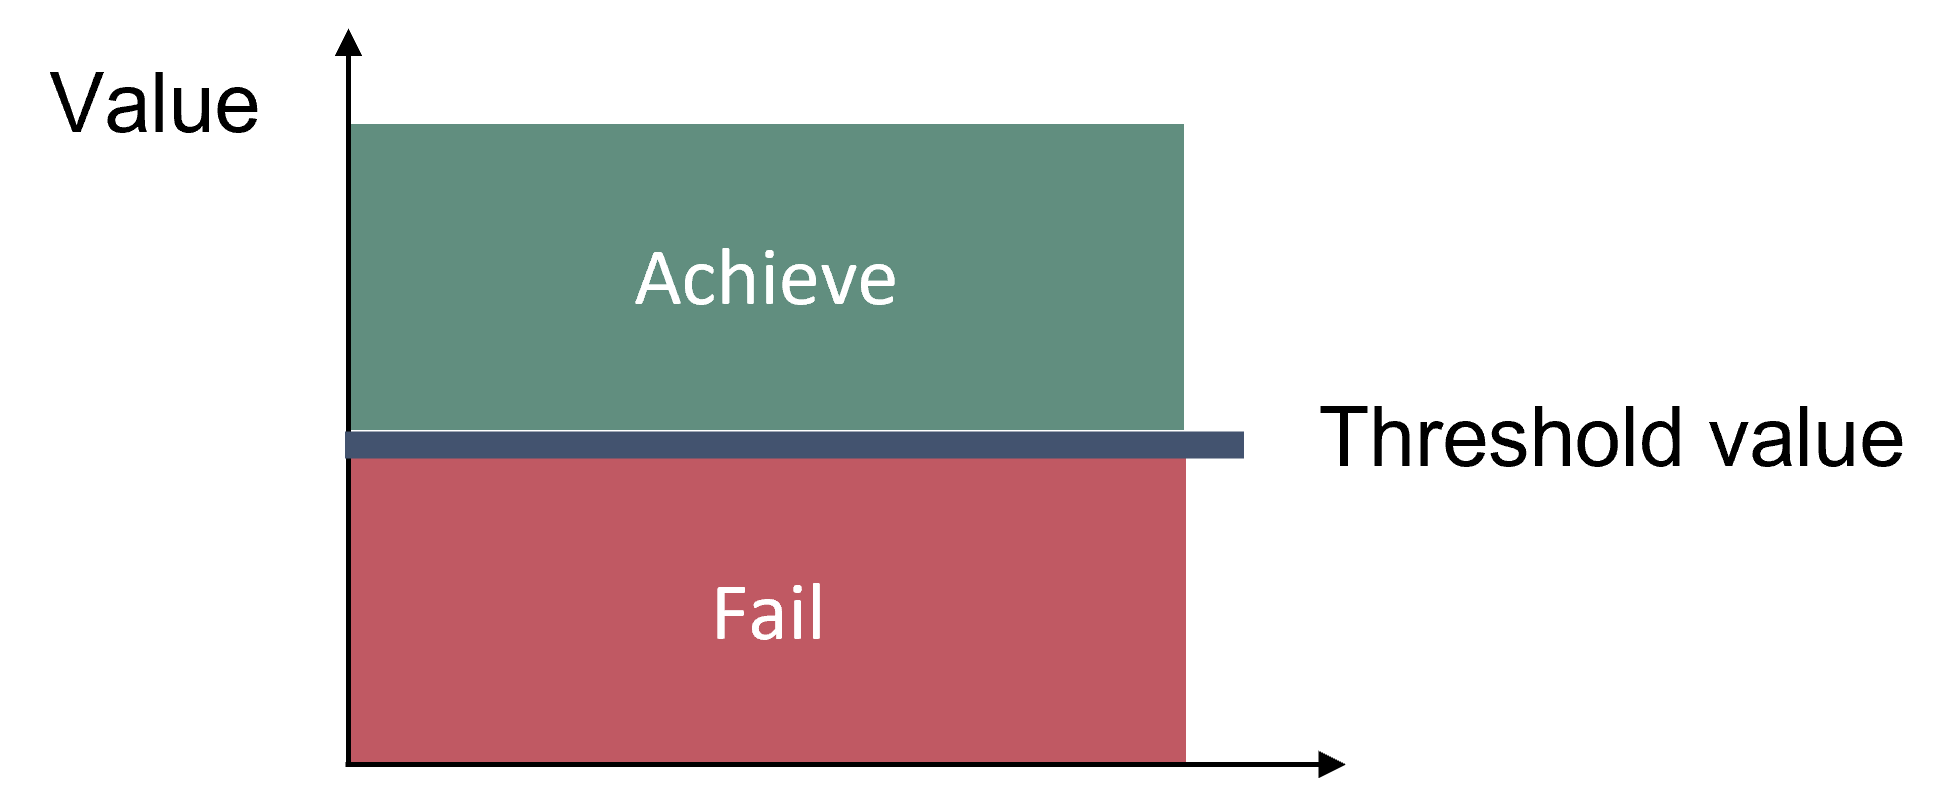
Figure 2: Acceptable deviation from baseline is used to define the threshold value between good status and not good status.
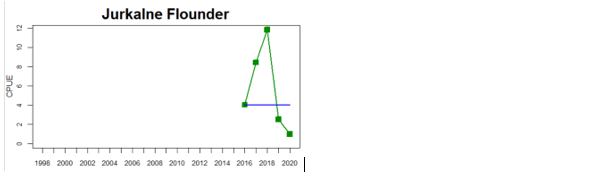
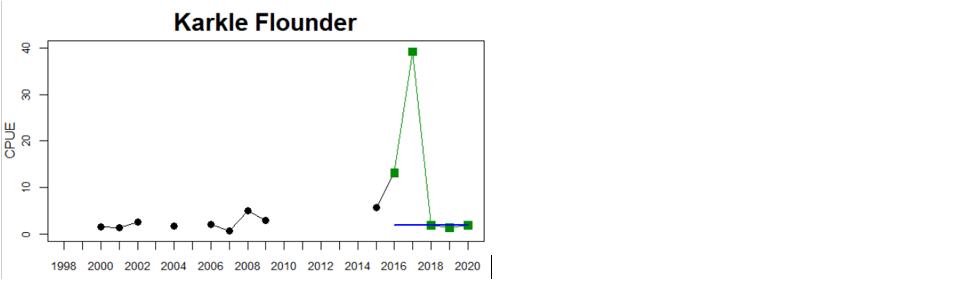
When using the trend-based approach, environmental status is evaluated based on the direction of the linear trend towards good status, over the time period 2014-2020 (Figure 3).
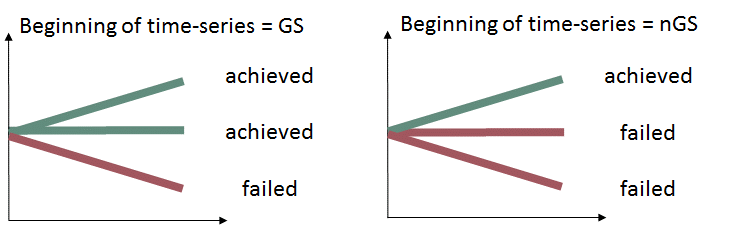
Figure 3: Application of the trend-based approach for evaluating environmental status where the status is defined based on the direction of the trend of the indicator compared to the desired direction of the indicator over time. GS = good status, nGS = not good status. See description in the assessment protocol.
Typical species considered in the context of this indicator are perch (Perca fluviatilis), flounder (European flounder, Platichthys flesus, and Baltic flounder, Platichthys solemdali), pike (Esox lucius), pikeperch (Sander lucioperca), whitefish (Coregonus maraena) and eelpout (Zoarces viviparous), depending on the location, coastal area and sub-basin. Perch, pike, pikeperch, and whitefish are generally the key species in coastal fish communities in the less saline eastern and northern Baltic Sea (Sweden, Finland, Estonia, and Latvia), and in more sheltered coastal areas in Lithuania, Poland and Germany. In the more exposed coastal parts of the central Baltic Sea and in its western parts, the abundance of perch is generally lower and flounder and eelpout is used as key species. Perch and flounder are considered in most assessment units, but where data is available pike, pikeperch, whitefish, and eelpout are used as complementary species in the evaluation.
3.1 Setting the threshold value(s)
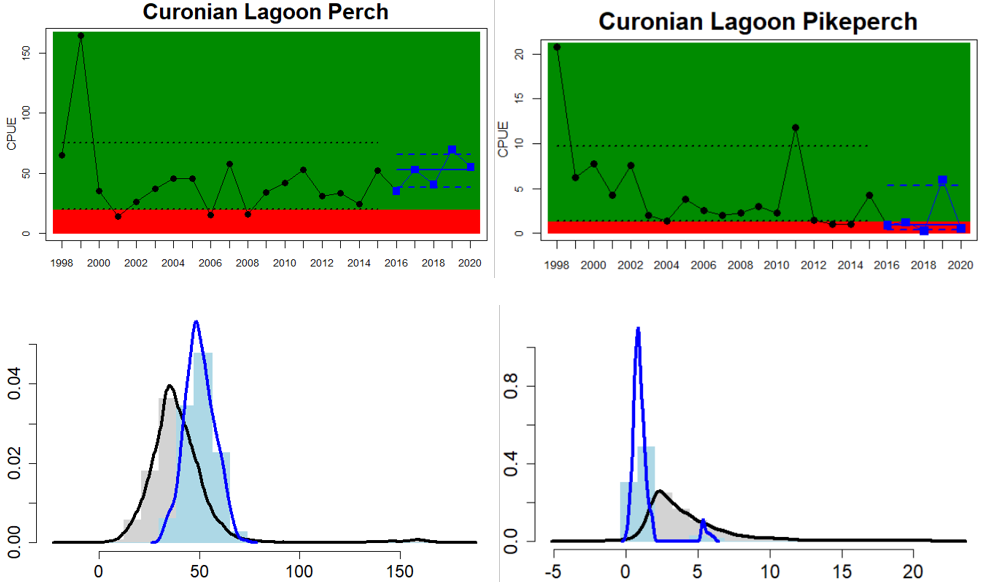
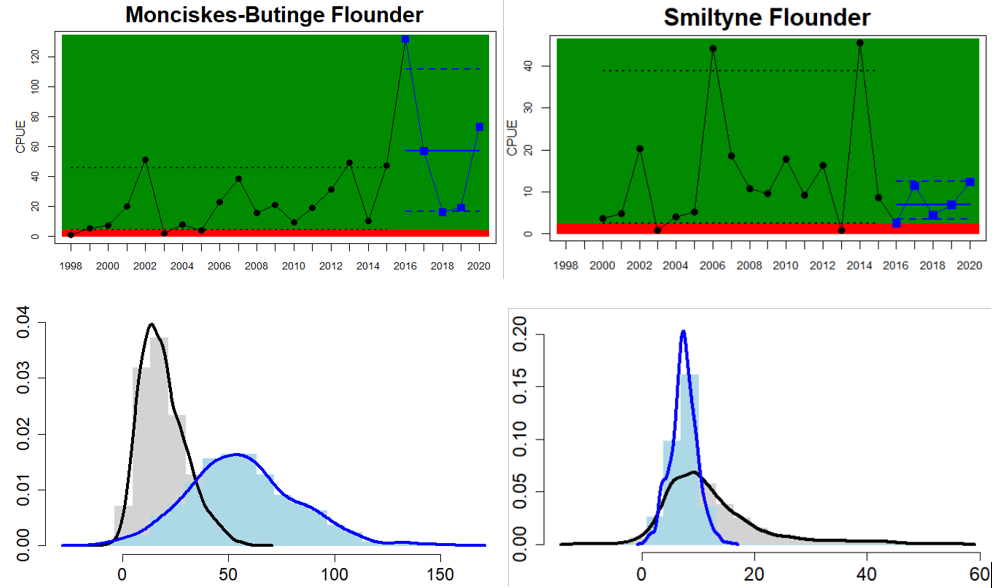
To determine the status of the indicator, the ASCETS method first derives a bootstrapped distribution of median values from a time series of observed indicator values during a reference period. Specific threshold values for changes in indicator state is set, and for key species, these are based on the 5th and 98th percentile values of the bootstrapped distribution. In this way, the derived boundaries of this interval can function as threshold values for a change in state per assessment unit of each species. Second, the bootstrapped median indicator value during the assessment period is evaluated in relation to the threshold values derived from the reference period depending on how much of the bootstrapped median distribution from the assessment period that falls below, within, or above the 5th and 98th percentiles.
If the requirements for defining quantitative baseline conditions are not met (e.g. short time series), then a trend-based evaluation should be used. All available data starting from year 2014 is included in trend analyses. In the trend-based approach, good status is defined based on the direction of the trend at p<0.1 of the indicator compared to the desired direction of the indicator over time.
4 Results and discussion
The results of the indicator evaluation that underlie the key message map and information are provided below.
4.1 Status evaluation
The current evaluation of environmental status using coastal fish covers the assessment period from 2016 to 2020. The evaluation is based on time series data of varying length depending on the temporal coverage of data collection in each monitoring location. Time series thus start between the years 1998 and 2015 (Table 2) and depending on the time series coverage, either the ‘ASCETS approach’ or a ‘trend-based evaluation’ is used. Evaluation was carried out for 24 of the in total 42 ‘scale 3 assessment units’ and time-series data up to and including the year 2020 were available for all 24 of these units (Figure 4). Due to short time-series in two of the Swedish assessment units, an evaluation against a quantitative threshold was not possible here, and a status evaluation was hence only carried out for in total 22 assessment units. For more information on assessment units, see the Assessment protocol.
Overall, this evaluation included one to five key species per monitoring location. Good status for perch was achieved in 24 of 31 monitoring locations, and for flounder in 8 of 26 locations. An additional two monitoring locations were evaluated for flounder abundance, but time-series remained too short in these locations to do a full status evaluation. For the remaining species, considerably fewer locations were evaluated and yielded the following results: 2 of 7 locations achieved good status for pike, 6 of 9 for pikeperch, 5 of 11 for whitefish, and 10 of 14 for eelpout. Adding up all species-monitoring location combinations, totalling 98 status evaluations, 43 achieved good status. When comparing the two best represented key species, perch and flounder, good status is generally more often reached in areas in the northern and eastern parts of the Baltic Sea where perch is the key species. In the western and southern areas of the Baltic Sea where flounder is the key species, the status is more often not good. For pike, pikeperch, whitefish, and eelpout, the more limited data does indicate that the status for pike and whitefish tend to be poor in the majority of locations, while pikeperch and eelpout both achieve good status in two thirds or more of monitoring locations.
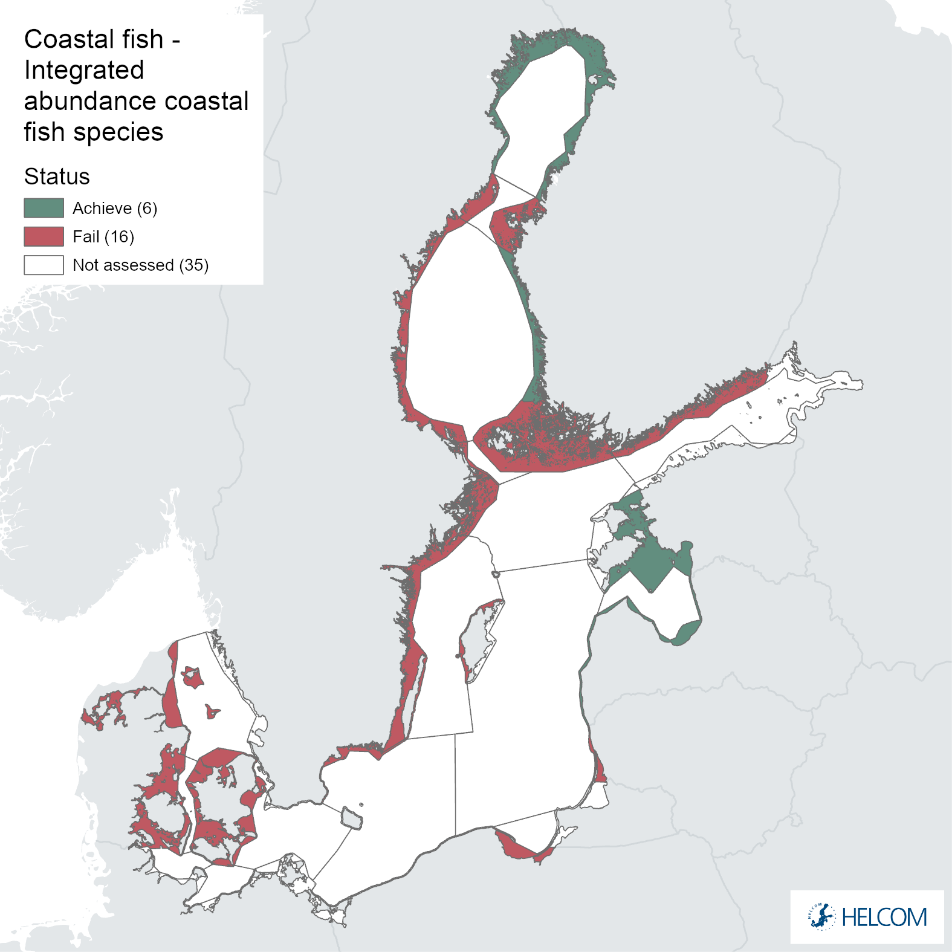
When considering the integrated status across species in all 55 monitoring locations, in more than half of them (32 locations), one or more species do not reach the threshold for good status. Within some assessment units there are discrepancies in status across species and monitoring locations, likely reflecting differences in the local appearance of coastal fish communities. When summarising over HELCOM assessment units, good status is achieved in 6 out of 22 evaluated units, indicating an overall poor environmental status of key coastal fish species in the Baltic Sea. Good status is only achieved in the Bothnian Bay, the Finnish side of the Bothnia Sea, and along the coasts of Estonia, and Latvia.
Table 2. Status evaluation outcome per monitoring location and assessment unit for the assessment period 2016-2020. GS = good status, nGS = not good status. The status for each assessment unit is derived using the One-Out-All-Out principle across species and monitoring locations.
In the northernmost parts of the Baltic Sea (i.e. the Bothnian Bay and The Quark), the status is generally good in the Bothnian Bay across all assessment units, locations and species (perch, whitefish, and pike). In the Quark neither of the two assessment units meets the threshold due to non-good status for perch in one of the Finnish and both Swedish monitoring locations. The abundance of whitefish is only evaluated in Sweden and show good status in both monitoring locations considered.
Whereas the overall status is good for the Finnish parts of the Bothnian Sea where both perch and pikeperch are considered, the status is considerably lower along the Swedish parts of the Bothnian Sea and Åland Sea, and in the Finnish Archipelago Sea. Perch abundance is above the threshold for good status in all five monitoring locations considered in the Swedish parts of the Bothnian Sea and Åland Sea, whereas the abundance pikeperch, pike, and whitefish are below the threshold leading to an overall poor status in the two assessment units. The overall poor status in the Archipelago Sea is attributable to low abundances of whitefish in one of the locations (Kumlinge), whereas the abundances of perch, pike and pikeperch are all above the threshold for good status in the in total three locations considered.
In the central parts of the Baltic Sea (Northern Baltic Proper, Gulf of Finland, Gulf of Riga and Western Gotland Basin), there are differences in the status across the monitoring locations and assessment units. In the more northern regions (Finnish parts of the Gulf of Finland and Swedish parts of Northern Baltic Proper) the overall status is poor as a result of poor status for perch in one (Tvärminne) of four considered locations in the Finnish parts of the Gulf of Finland. The abundance of perch and pikeperch in the remaining locations of this assessment unit meets the threshold. In the Swedish parts Northern Baltic Proper, the overall poor status is due to poor status of perch, pike and flounder in two of the monitoring locations considered, whereas the status of whitefish is good as is the status of both perch and pikeperch in one location. In the Gulf of Riga, the status is good in both Estonian and Latvian coastal areas where only perch is considered, but in the Western Gotland basin where perch, pike, pikeperch, flounder and whitefish are considered the overall status is poor. This is the result of poor status of all species except for pikeperch that is considered in only one of the two locations included in the evaluation.
In the Eastern Gotland Basin, data is available for Latvia and Lithuania. In Latvia the assessment unit meets the threshold for good status, and only flounder is considered as key species, whereas in Lithuania the overall status for the assessment unit is poor due poor status of pikeperch in the Curonian Lagoon. For the other four monitoring locations where flounder is considered the key species, the abundances meet the threshold for good status.
In the Bornholm, Gdansk and Arkona Basins there is data from two Swedish, three Polish, and one Danish location. Species that are considered are perch (Sweden and Poland), flounder (Sweden, Poland and Denmark), pike (Sweden), and eelpout (Denmark). The overall status is poor in the Swedish parts of the Bornholm Basin as a result of poor status for pike and flounder, but not for perch. The overall status is poor in the Polish parts of the Gdansk basin because, while both perch and flounder meet the threshold for good status in most areas considered, flounder does not meet the threshold in one area. Finally, the overall status is poor in the Danish parts of the Arkona basin as a result of poor status for flounder, but good for eelpout.
In the most western parts of the Baltic Sea, only Danish monitoring locations are considered. The overall status is poor in all four assessment units, as a result of overall poor status in 14 of the 17 monitoring locations considered. The three monitoring locations that achieved good overall status were found in Danish waters of Kattegat, the Mecklenburg Bight and Belts Sea. In general eelpout have a better status (good status in 10 out of 14 monitoring locations), compared to flounder (good status in 2 out of 14 monitoring locations)
Bothnian Bay
Finland
Sweden
The Quark
Finland
Sweden
Bothnian Sea
Finland
Sweden
Åland Sea
Sweden
Archipelago Sea
Finland
Northern Baltic Sea
Sweden
Gulf of Finland
Finland
Gulf of Riga
Estonia
Latvia
Western Gotland Basin
Sweden
Eastern Gotland Basin
Latvia
Lithuania
Sweden
Gdansk Basin
Poland
Bornholm Basin
Sweden 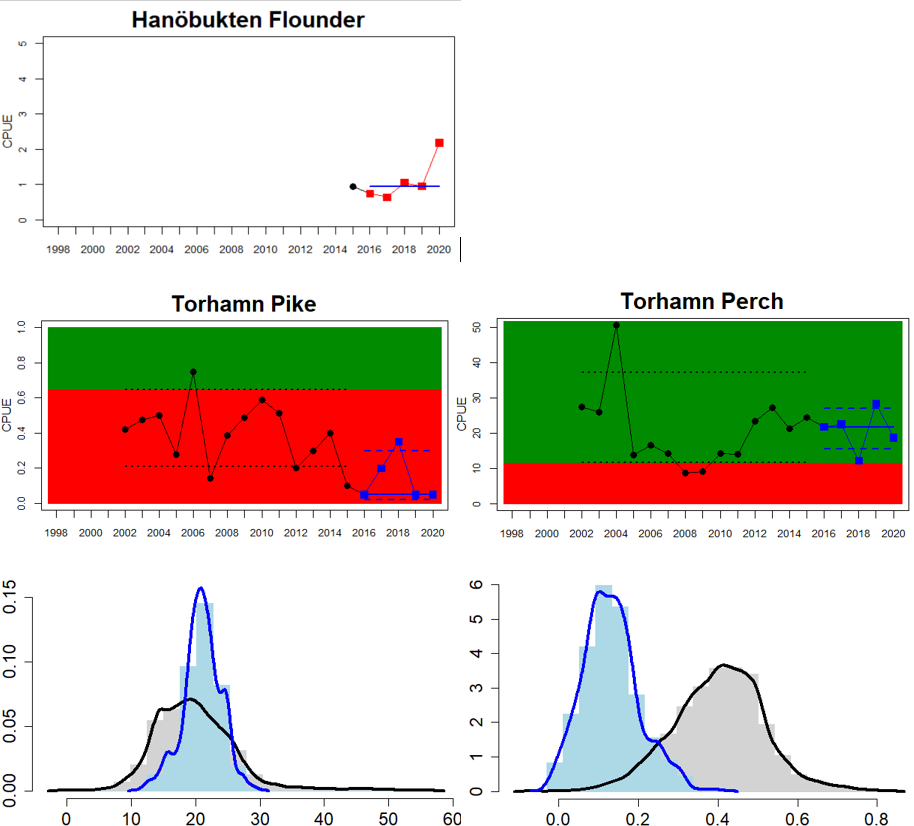
Arkona Basin
Denmark
Sweden
Mecklenburg Bight
Denmark
Belt Sea
Denmark
The Sound
Denmark
Kattegat
Denmark

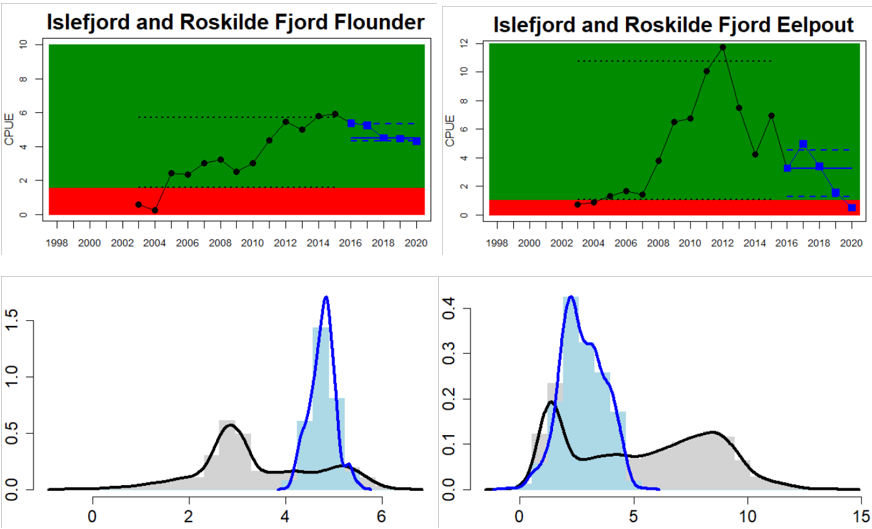
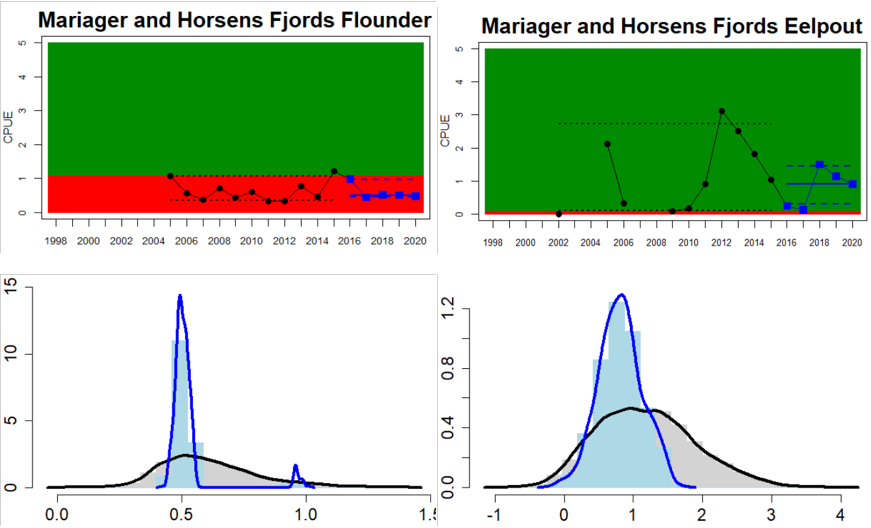
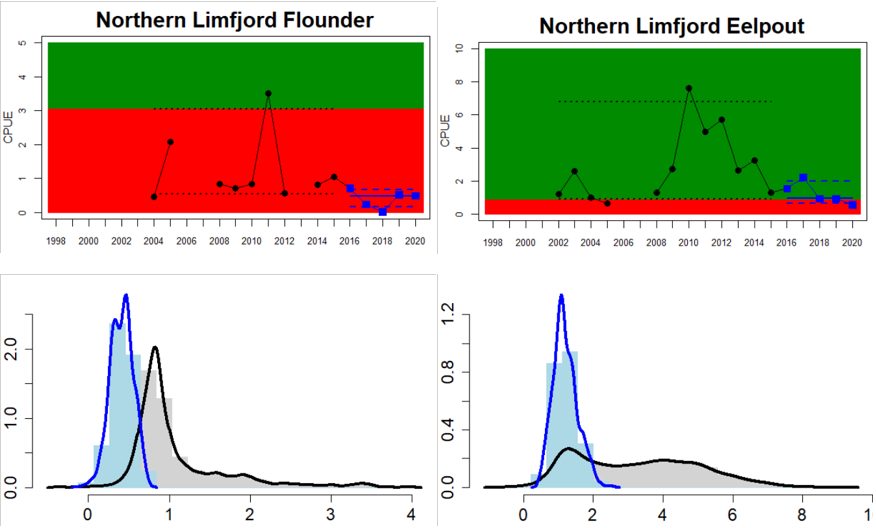
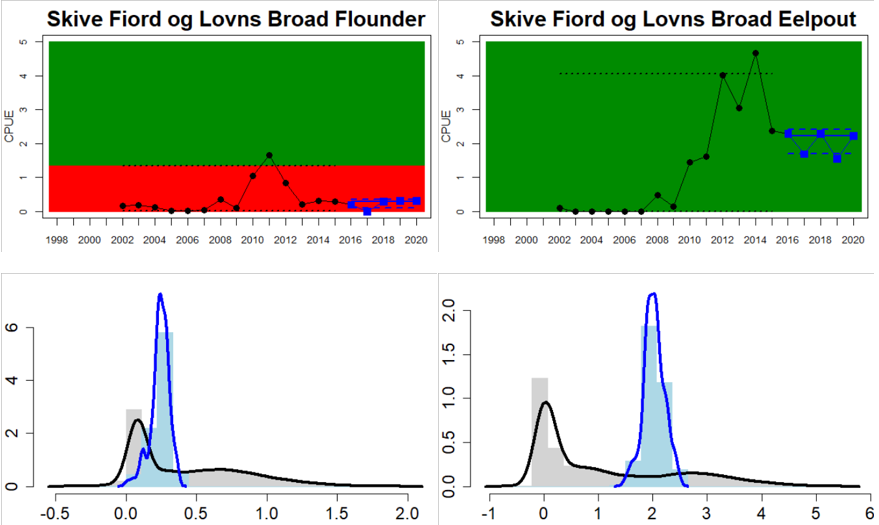
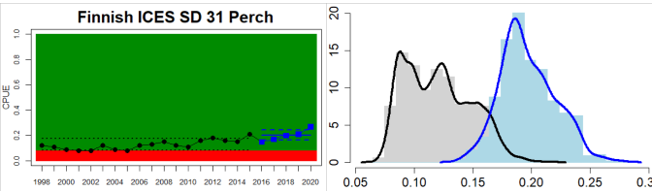
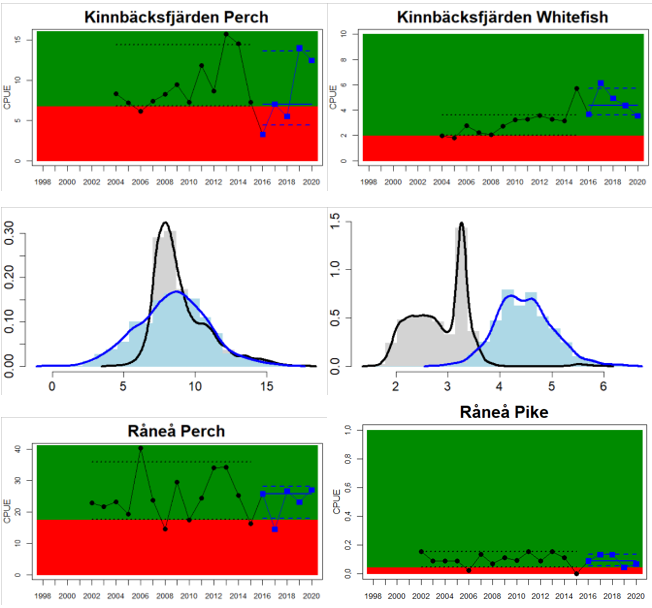
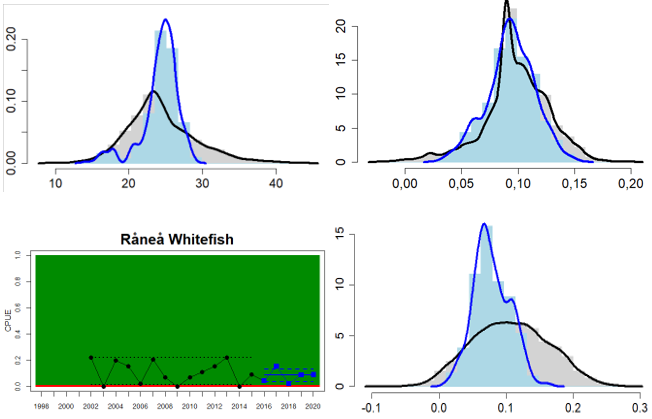
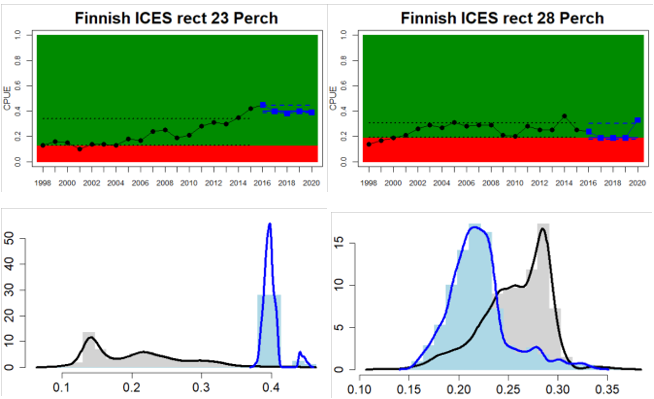
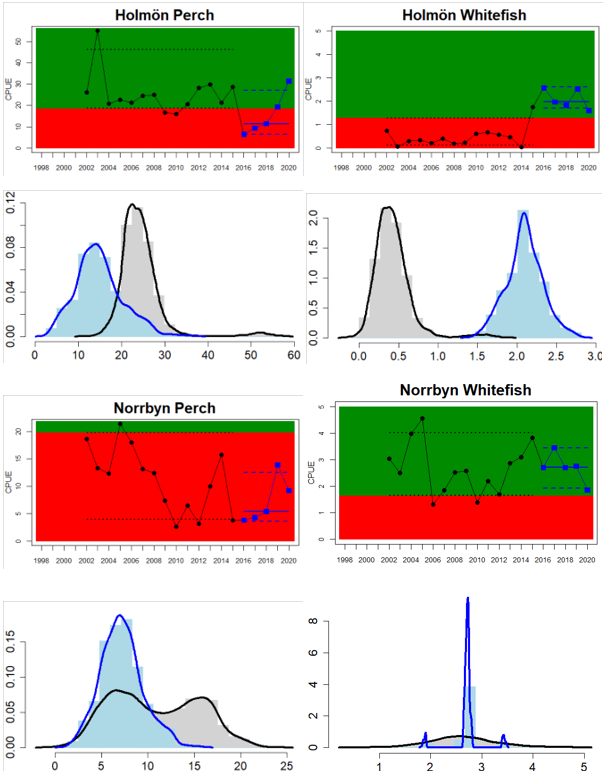
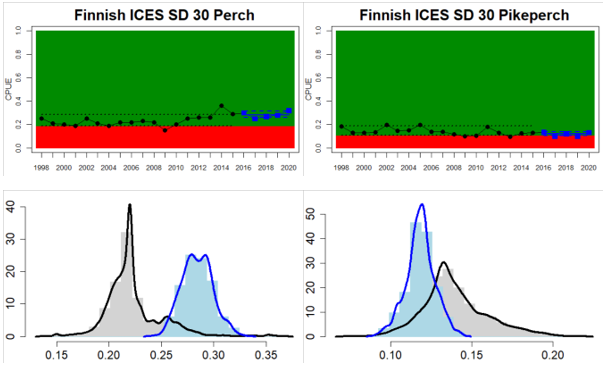
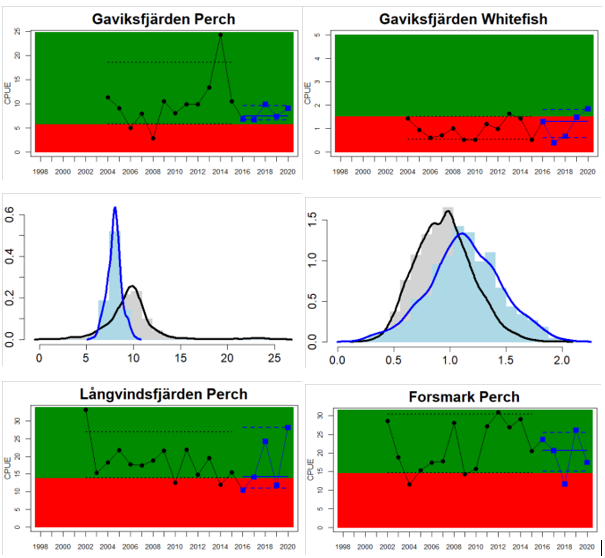
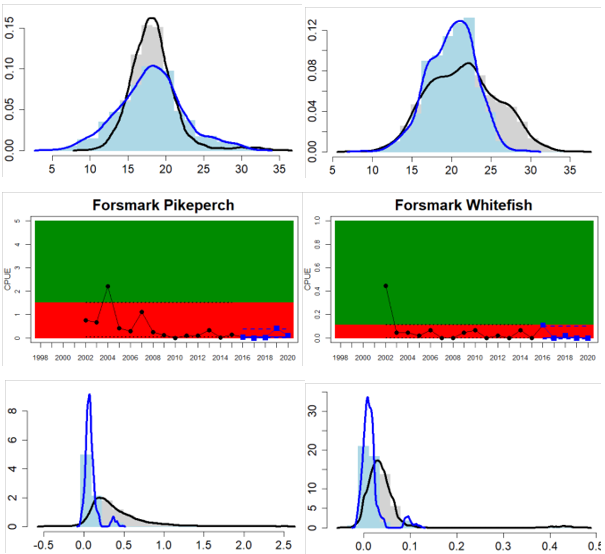
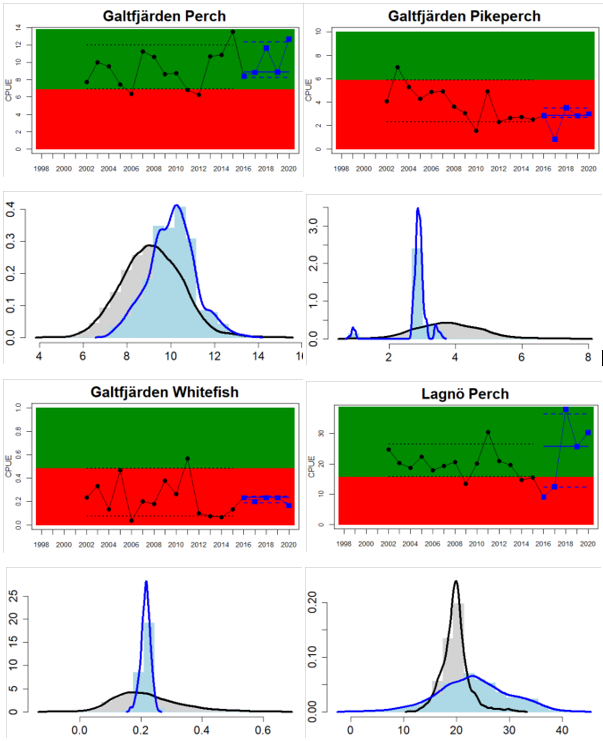
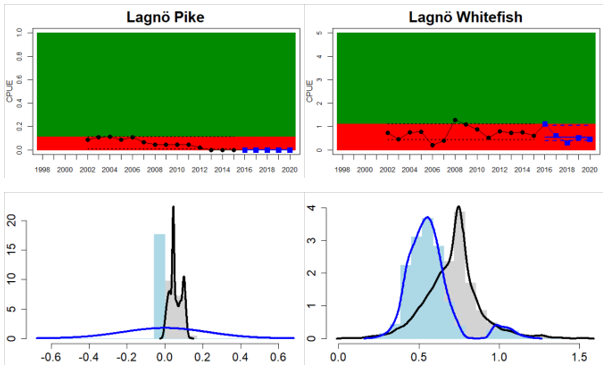
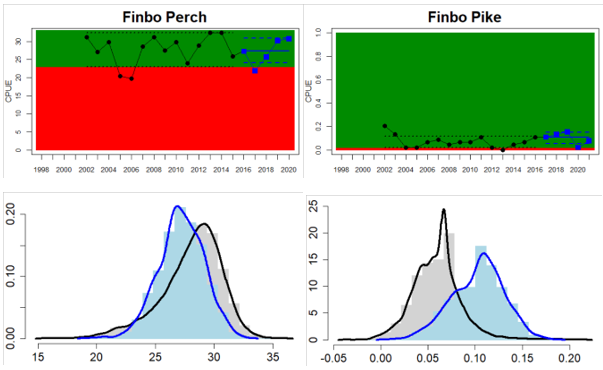
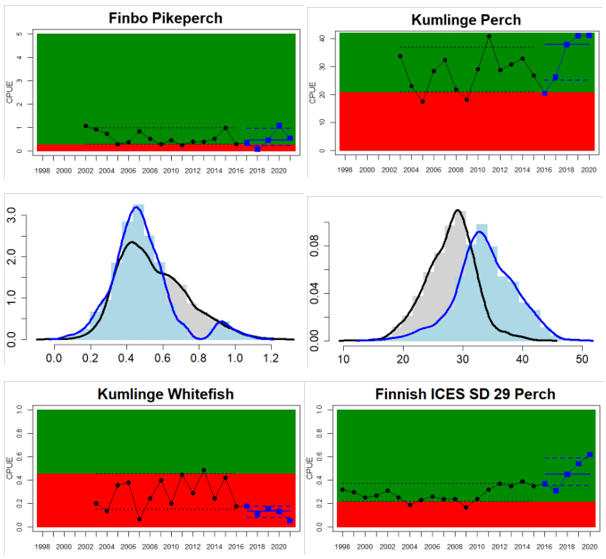
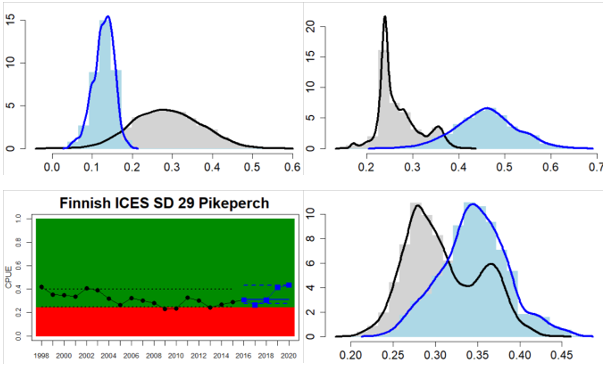
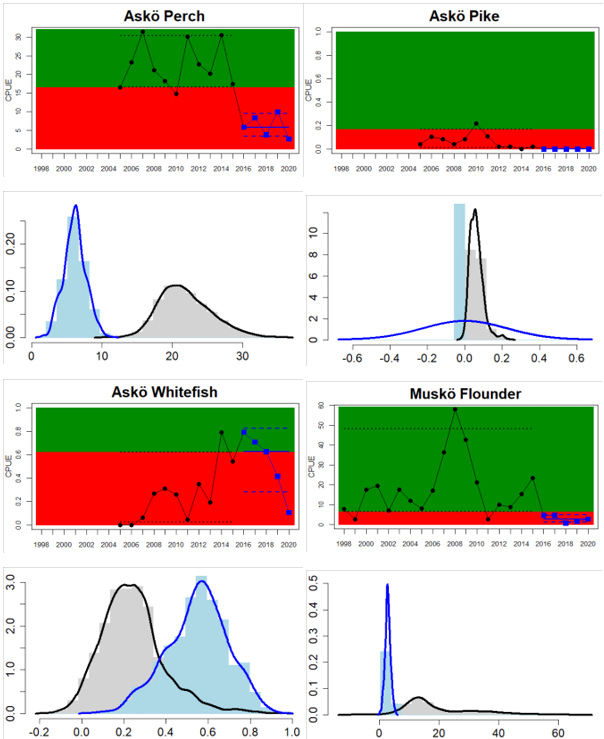
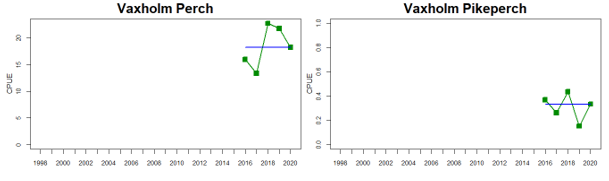
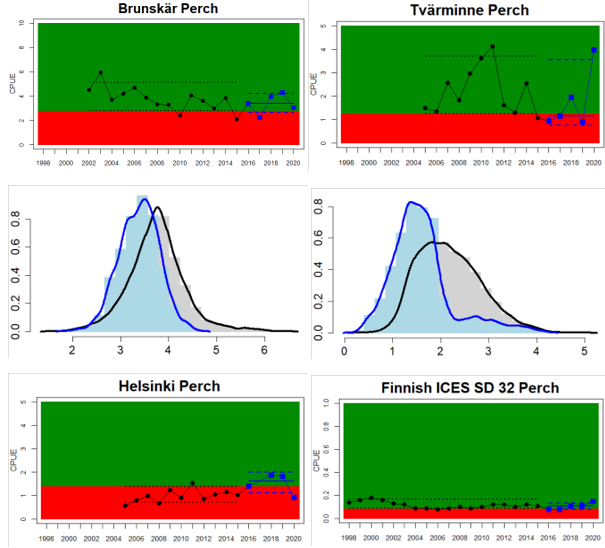
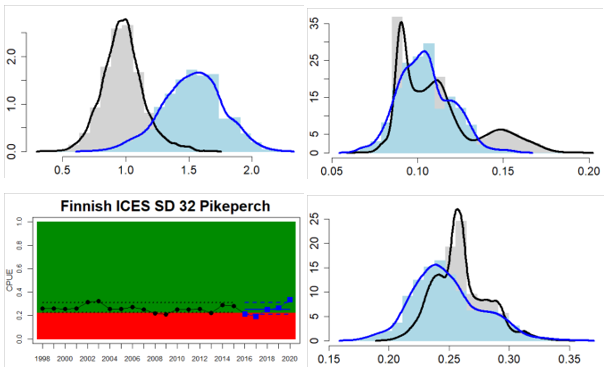
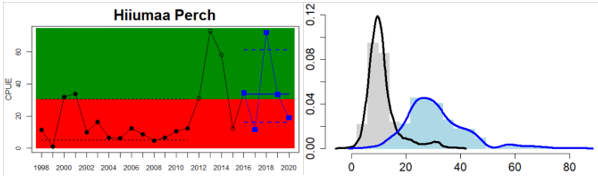
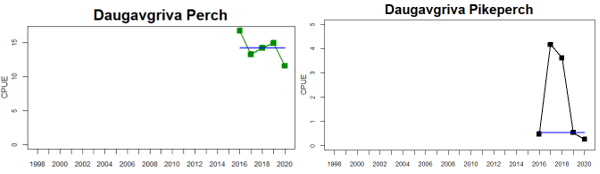
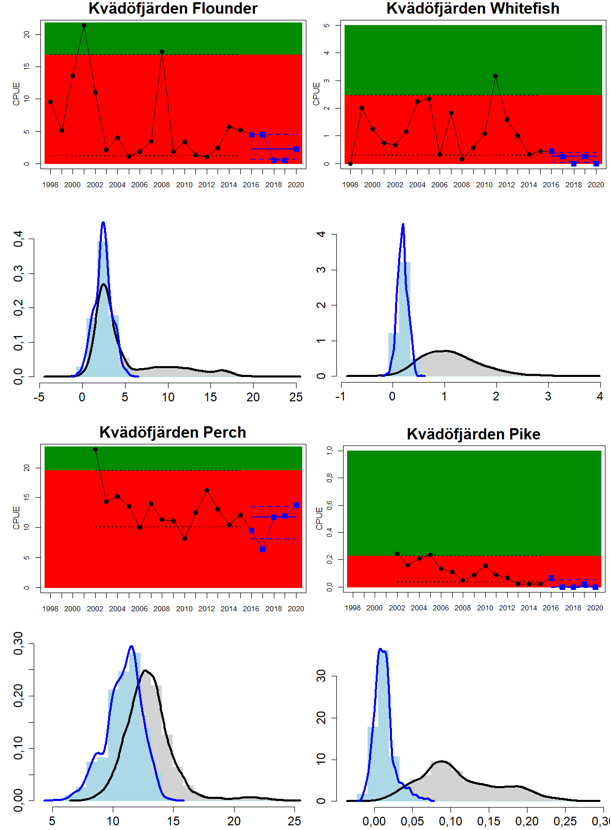
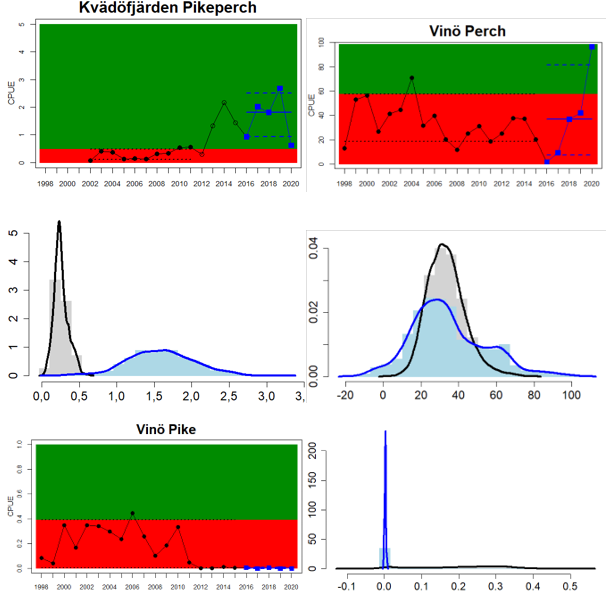
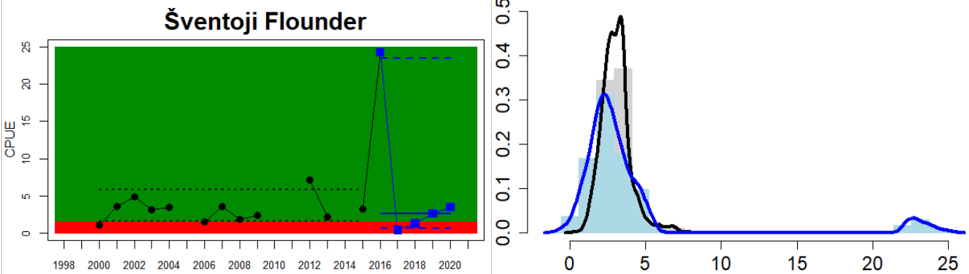
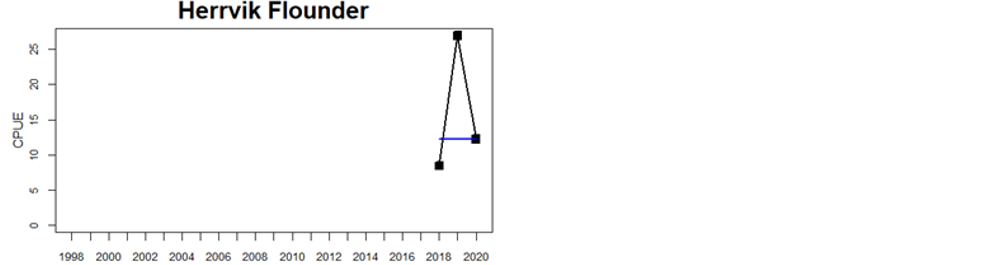
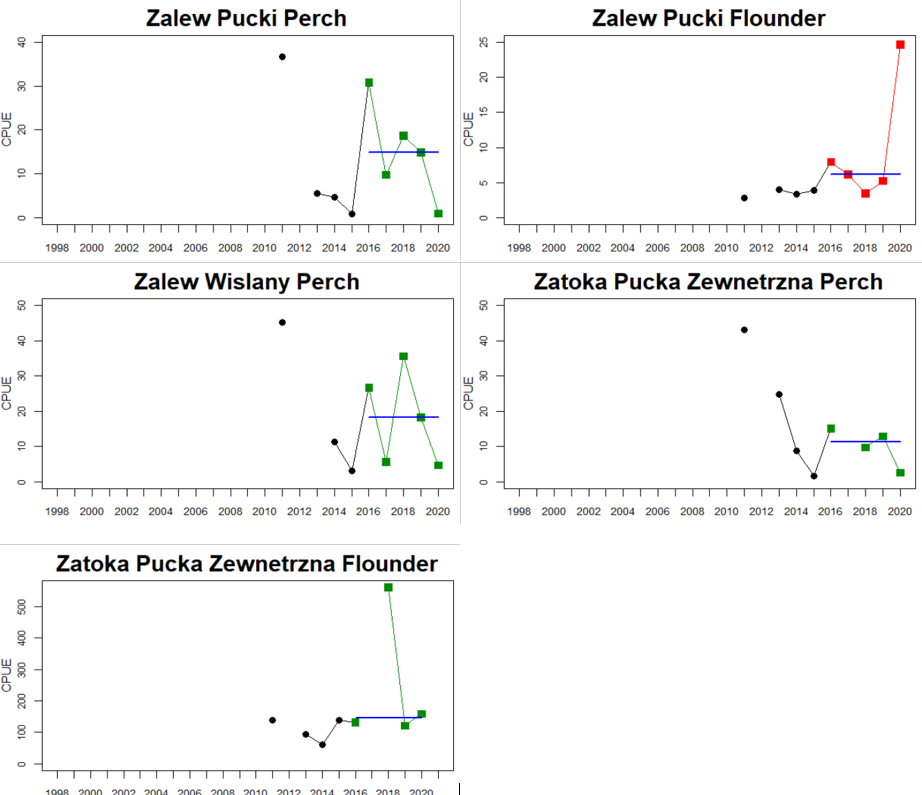
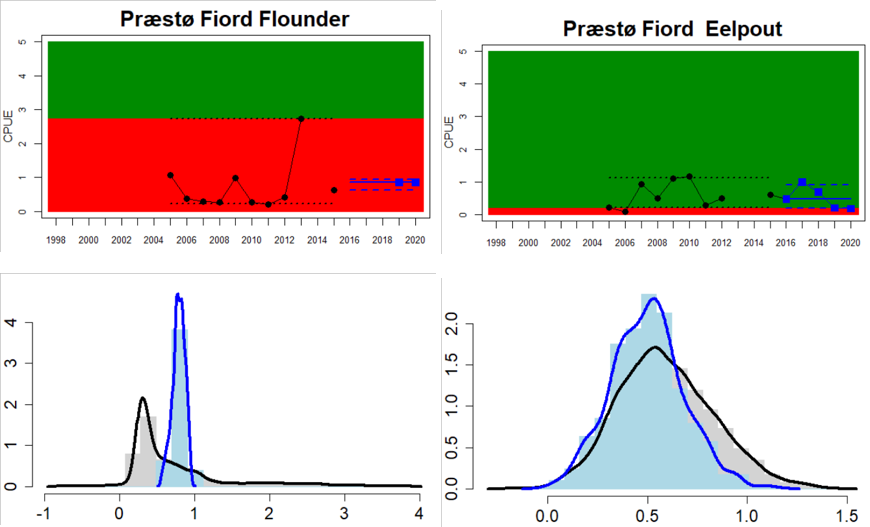
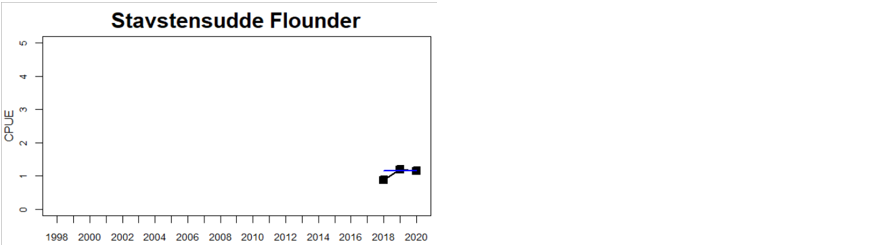
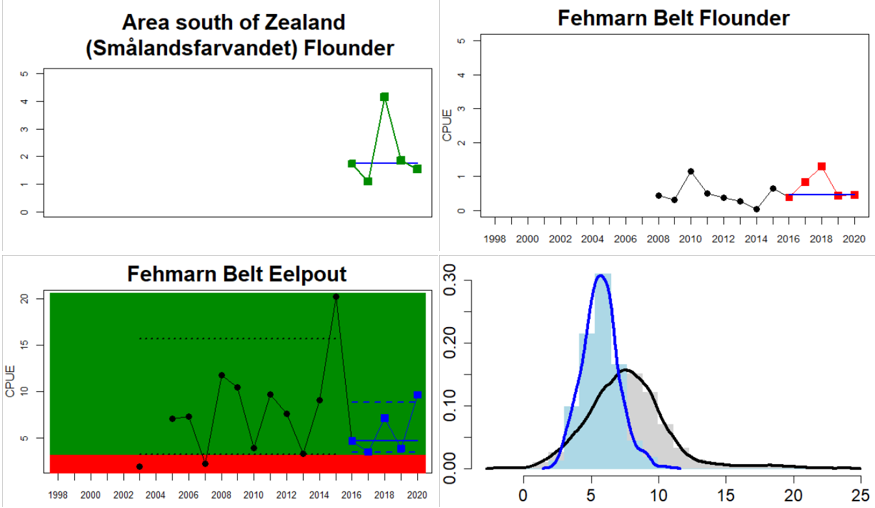
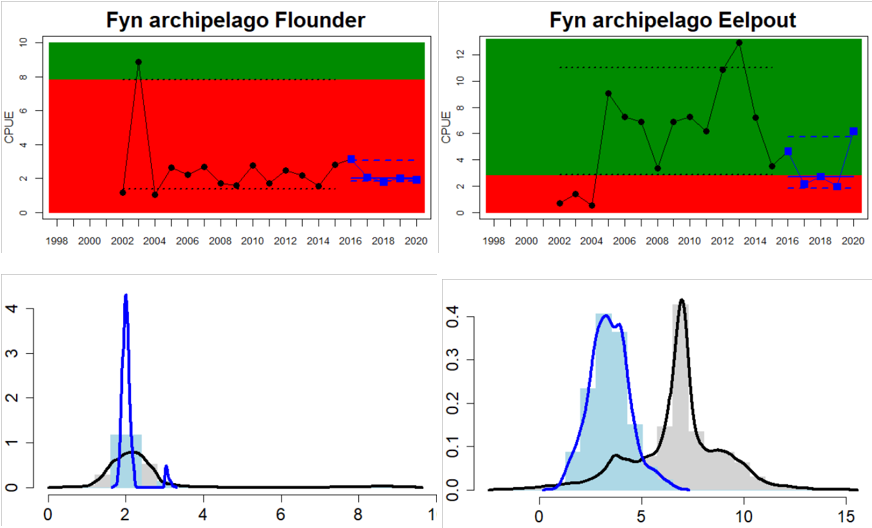
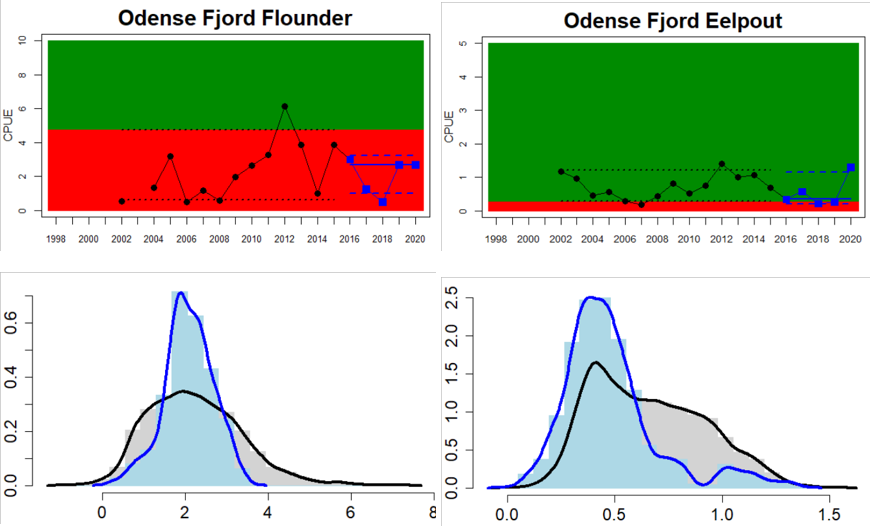
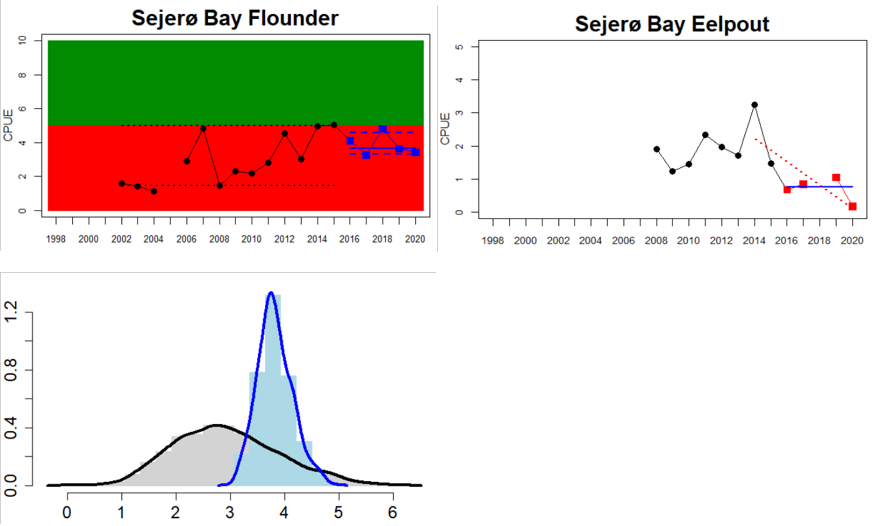
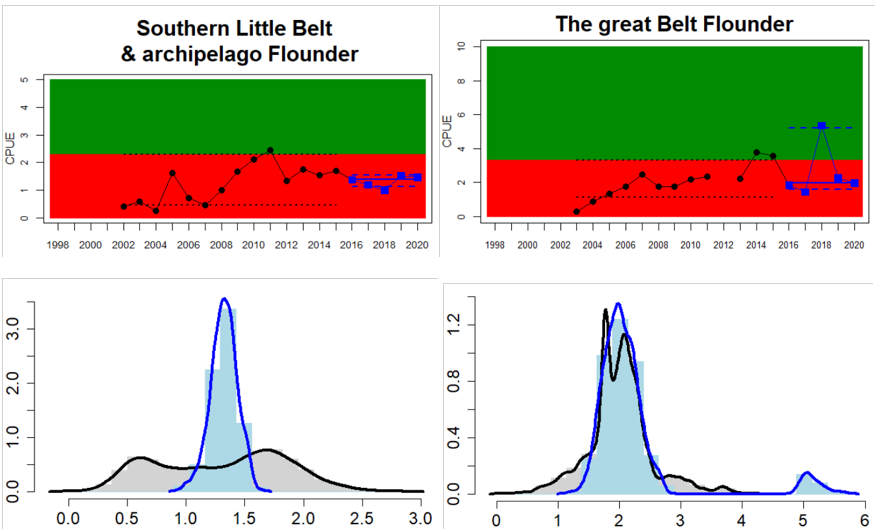
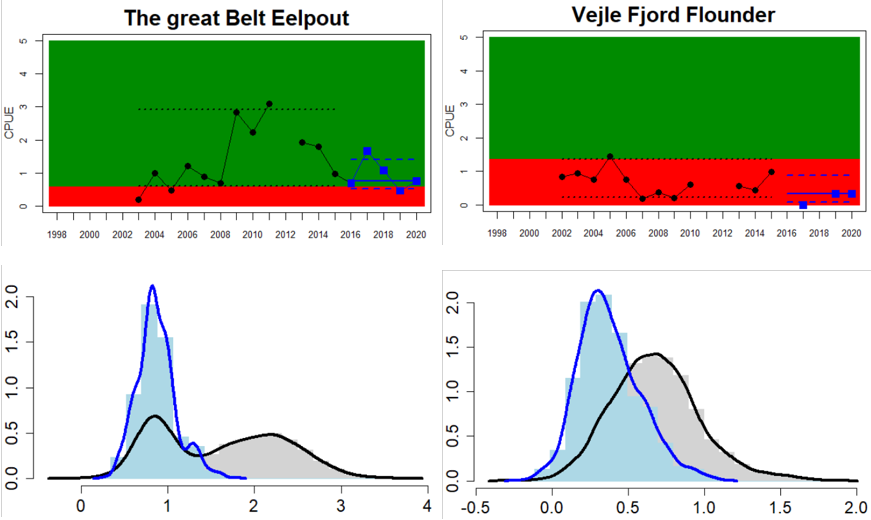
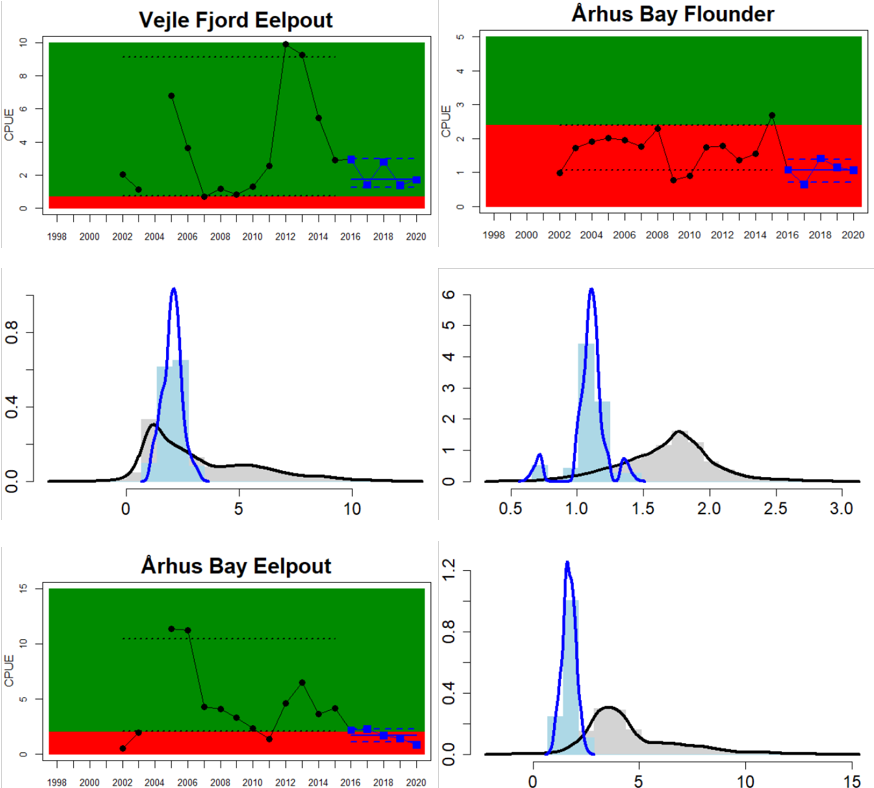
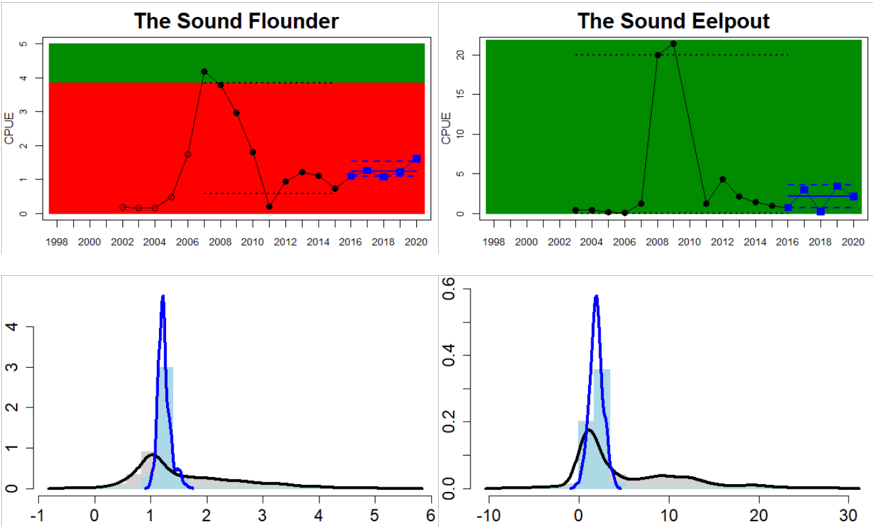
Figure 4. Status evaluation displayed per sub-basin for each monitoring location. In locations where the ASCETS approach is applied, threshold values are displayed by black dotted lines between fields in green (good status) and red (not good status), with the colour of the fields determined by the status during the reference period. The evaluation of good status/not good status is performed for the assessment period compared to the reference period by comparing the location of the median during the assessment period (full blue line) with the location of the respective threshold line. The 95th percentile intervals associated with the median during the assessment period are displayed in hatched blue lines. Below each ASCETS graph, a small graph shows the smoothed bootstrapped medians of the indicator values from the reference period (bars in grey with a black line) and the assessment period (bars in blue with a blue line). For assessment units where the available data only allowed for a trend-based evaluation, green squares denote a good status evaluation outcome during the assessment period whereas red squares denote a not good status assessment outcome. The hatched trend-line indicates a significant positive (green) and negative (red) trend at p < 0.1 during 2014-2020 for the times-series in each location.
4.2 Trends
Overall, the status of coastal fish in the Baltic Sea has deteriorated between this and the HOLAS II, conducted in 2018 including data until 2016 (Table 3). However, the decreased overall status partly reflects the inclusion of additional key species in the current evaluation, namely pike, pikeperch, whitefish, and eelpout, and applying a stricter integrating approach across monitoring locations (majority rule in HOLAS II vs One-Out-All-Out principle in the current evaluation). Pike and whitefish do not achieve good status in the majority of the monitoring locations. Thus, only 6 out of 22 HELCOM assessment units achieve good status in the current evaluation, compared to 13 out of 21 assessment units achieving good status in HOLAS II. Focussing on the comparable key species perch and flounder, differences between this and the previous evaluation are only minor. The status of perch has decreased in 2 and increased in 1 out of 23 comparable monitoring locations, and the status of flounder has decreased in 1 out of 14 comparable monitoring locations since 2018. When the status is integrated over HELCOM assessment units, the status of perch has increased in the Gulf of Riga, decreased in the Finnish Quark, while in the Swedish Northern Baltic proper, the status of both perch and flounder have decreased. The integrated status remains unchanged in the remaining 17 assessment units when considering perch and flounder only.
Table 3. Overview of trends between current and previous evaluation in year 2018 (HOLAS II, including data until 2016). For each HELCOM assessment unit, it is noted whether the integrated status using the BEAT tool achieves of fails to achieve the threshold value. The current integrated status is compared to the pervious status with regards to any distinct increasing or decreasing trend. In case of changed integrated status, the outcome is briefly described focusing on the relevant changes compared to the previous evaluation.
| HELCOM Assessment unit name (and ID) | Threshold value: achieved/failed | Distinct trend between current and previous evaluation (HOLAS II). | Comparison of outcomes |
| Archipelago Sea Coastal waters | failed | decrease | All location-species combinations besides whitefish and Kumlinge have GS. Due to inclusion of whitefish in Kumlinge the combined status decreased |
| Arkona Basin Danish Coastal waters | failed | no change | |
| Belts Danish Coastal waters | failed | no change | |
| Bornholm Basin Swedish Coastal waters | failed | NA | Not included in HOLAS II |
| Bothnian Bay Finnish Coastal waters | achieved | no change | |
| Bothnian Bay Swedish Coastal waters | achieved | no change | |
| Bothnian Sea Finnish Coastal waters | achieved | no change | |
| Bothnian Sea Swedish Coastal waters | failed | decrease | All comparable location-species combinations have GS. Due to inclusion of whitefish in Gaviksfjärden and pikeperch and whitefish in Forsmark the combined status decreased |
| Eastern Gotland Basin Latvian Coastal waters | achieved | no change | |
| Eastern Gotland Basin Lithuanian Coastal waters | failed | decrease | All comparable location-species combinations have GS. Due to inclusion of pikeperch in Curonian Lagoon the combined status has decreased |
| Gdansk Basin Polish Coastal waters | failed | NA | Not included in HOLAS II |
| Gulf of Finland Finnish Coastal waters | failed | decrease | Inclusion of 3 new monitoring locations, the status is decreased due to nGS of perch in Tvärminne |
| Gulf of Riga Estonian Coastal waters | achieved | increase | Only one evaluation. Status of perch in Hiummaa has increased |
| Gulf of Riga Latvian Coastal waters | achieved | no change | |
| Kattegat Danish Coastal waters, including Limfjorden | failed | no change | |
| Mecklenburg Bight Danish Coastal waters | failed | no change | |
| Northern Baltic Proper Swedish Coastal waters | failed | decrease | Both comparable location-species combinations have decreased. In addition, pike in Askö has nGS. |
| The Quark Finnish Coastal waters | failed | decrease | The status of perch in ICES SD rect 28 has decreased |
| The Quark Swedish Coastal waters | failed | no change | |
| The Sound Danish Coastal waters | failed | no change | |
| Western Gotland Basin Swedish Coastal waters | failed | no change | |
| Åland Sea Swedish Coastal waters | failed | decrease | Due to inclusion of pike and whitefish in Lagnö the combined status has decreased |
4.3 Discussion text
In conclusion, the overall environmental status of coastal fish in the Baltic Sea is poor, when summarising the results across the six key species and the 22 HELCOM assessment units that allows an evaluation of status against a threshold. Good status is achieved in 6 out of 22 evaluated units. There were often pronounced differences in environmental status between different key species in the same monitoring location, indicating that the inclusion of the additional key species pike, pikeperch, whitefish, and eelpout, allows a more nuanced picture of the status of coastal fish in the Baltic Sea, compared to previous evaluations. Adding up all species-monitoring location combinations, totalling 98 status evaluations, 43 achieved good status. Overall, good status was achieved in the majority of the monitoring locations for perch, pikeperch, and eelpout, while the majority of the monitoring locations showed not good status for flounder, pike, and whitefish. When comparing the two best represented key species, perch and flounder, good status is generally more often reached in areas in the northern and eastern parts of the Baltic Sea where perch is the key species. In the western and southern areas of the Baltic Sea where flounder is the key species, the status is more often not good.
5 Confidence
In general, the confidence varies across assessment units, countries and monitoring programmes since, for example, the number of years for which coastal fish monitoring has been carried out varies between locations, as does the spatial coverage of monitoring within assessment units, and thus the confidence in the actual evaluation (Table 4). Generally, the confidence of the evaluation is higher in locations where monitoring started before 1999 and where data is available for all years during the assessment period (2016-2020), where there is good spatial coverage of monitoring, and where the monitoring is fisheries independent and targeting the focal species of the evaluation.
The confidence scoring followed the principles as outlined in the HELCOM integrated biodiversity assessment. Confidence was scored using four criteria with three different levels (1= high, 0.5 = intermediate, and 0 = low). The criteria used were:
Confidence in the accuracy of the estimate (ConfA). In the ASCETS approach, confidence in the evaluation is determined by the C(S) value. C(S) varies between 0 and 1, with values <0.1 representing high confidence of changed status and values >0.9 high confidence of unchanged status (Level 1). Values of 0.1-0.3 represent medium confidence in changed status and 0.7-0.9 medium confidence in unchanged status (Level 0.5). Values of 0.3-0.5 represent low confidence of changed status and 0.5-0.7 low confidence in unchanged status (Level 0). In the trend-based approach, confidence in the evaluation is determined by the p-value of the linear regression, with p-values <0.05 representing high confidence in a trend, p<0.1 medium confidence in a trend, p 0.10-0.20 low confidence in no trend, p 0.21-0.49 medium confidence in no trend, and p 0.5-1.0 high confidence in no trend.
Confidence in the temporal coverage of evaluation (ConfT). Level 1 = data for all years during 2016-2020, 0.5 = one or two years of data missing during 2016-2020, and 0 = three or more years of data missing during 2016-2020.
Confidence in spatial representability of the evaluation (ConfS). Level = 1 full coverage/several monitoring locations per assessment unit given its size, 0.5 = two or more monitoring locations per assessment unit, and 0 = one monitoring location per assessment unit.
Methodological confidence (ConfM). For coastal fish all assessment units reach level 1 since all monitoring programs included in the evaluation are described in the coastal fish monitoring guidelines .
Table 4. Confidence in the status evaluation according to the criteria developed within HELCOM for the integrated biodiversity assessment.
The level of confidence in the evaluation differs between coastal areas and regions as a result of differences in monitoring methodology, as well as lower temporal and spatial coverage of monitoring in some countries. The methodological confidence is high in all monitoring locations and the confidence in the accuracy of the evaluation is high in only three assessment units. The confidence in the temporal coverage is high in all assessment units except for in six, where the individual monitoring locations have data missing for one or more years (in Finland, Denmark, Poland and Sweden), and the confidence in spatial representability is highest in the Finnish, Lithuanian, Polish, and Danish areas, but poorer in other countries. The integrated confidence considering all four categories varies between high and intermediate depending on assessment unit and is high in the majority of evaluated assessment units (Figure 5). Intermediate confidence of the evaluation is only found along the Swedish Bothnian Sea coast, Gulf of Riga, the Eastern Gotland Basin Latvian coast, the Bornholm Basin Swedish coast, Danish coast of the Arkona Basin, and the Danish coastal waters of The Sound. In all these assessment units, the spatial representability of monitoring is relatively low.
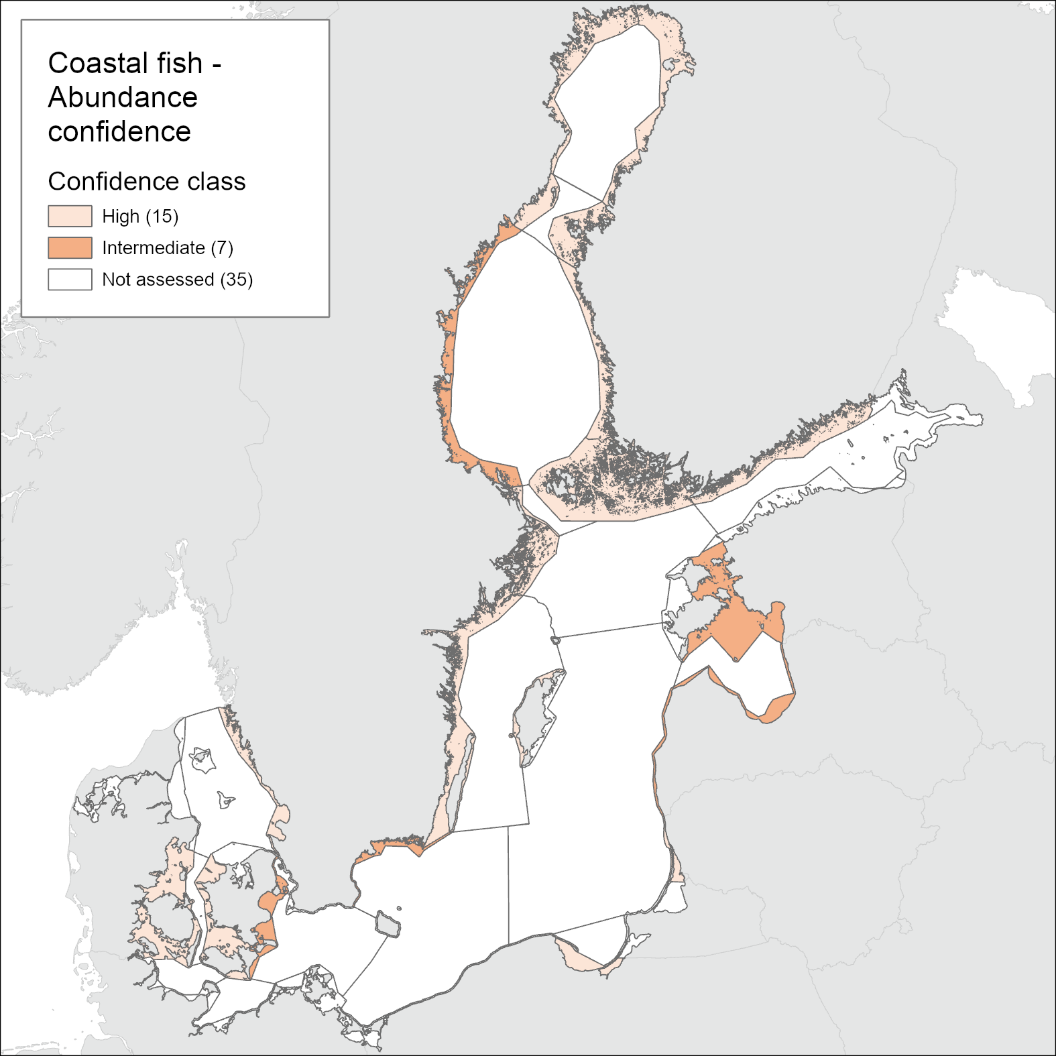
Figure 5. Maps of confidence of the current evaluation. See Table 4 for details.
The confidence concept as developed for the purposes of the integrated biodiversity assessment is not fully applicable to coastal fish as further evaluation of the precision in data and the congruence in status across monitoring locations within assessment units would provide additional needed information.
6 Drivers, Activities, and Pressures
The state of key coastal fish species in the Baltic Sea is influenced by multiple pressures, including climate, eutrophication, fishing mortality and exploitation of essential habitats, but also by natural processes such as food web interactions and predation from apex predators.
The effect of eutrophication on the state of coastal fish species is also of importance (Bergström et al. 2016b; Olsson 2019) and might increase with higher latitudes (Östman et al. 2017b).
The abundance of key species of coastal fish (such as perch, flounder, pike, pikeperch, whitefish and eelpout) is influenced by recruitment success and mortality rates, which in turn might be influenced by ecosystem changes, interactions within the coastal ecosystem and abiotic perturbations. An increased abundance of perch and pike may, for example be governed by increasing water temperatures, moderate eutrophication, availability of recruitment habitats, low fishing pressure, and low predation pressure from apex predators (Berggren et al. 2022; Böhling et al. 1991; Edgren 2005; Bergström et al. 2007, 2016b, 2019, 2022; Linlokken et al. 2008; HELCOM 2012, 2018, 2021; Olsson et al. 2012; Olsson 2019, Östman et al. 2012, 2017b; Veneranta et al. 2020). As for the majority of coastal species, exploitation of recruitment areas has a negative impact on the development of perch populations (Sundblad et al. 2014; Sundblad & Bergström 2014). Changes in the long-term development of the abundance of perch and pike could hence reflect effects of increased water temperature and eutrophication in coastal areas and/or changes in the level of exploitation or predation pressure.
The abundance of pikeperch is influenced by similar factors but is in contrast to a larger extent favoured by increased levels of eutrophication (Bergström et al. 2013) and fishing (Lappalainen et al. 2016; Bergström et al. 2019). Whitefish is a species that is disfavoured by more nutrient rich waters, deteriorating quality of nursery habitats, and elevated water temperatures with decreasing periods of ice-coverage during winter (Veneranta et al. 2013a,b). The influence of predation by seals and fishing on the abundance of whitefish is also a concern (Hansson et al. 2017; Berkström et al. 2021).
The abundance of flounder is favoured by somewhat increasing water temperatures, moderate eutrophication, and low fishing pressure (Olsson et al. 2012; Florin et al. 2013). Increased presence of ephemeral macroalgae due to eutrophication reduces the suitability of nursery habitats (Carl et al. 2008) and increases in the level of predation from avian predators negatively affect the abundance of juvenile flounder with unfavourable consequences to recruitment (Nielsen et al. 2008). Changes in the long-term abundance of flounder thus may reflect effects of eutrophication and/or changes in the level of predation pressure and fishing mortality in coastal areas. Recent studies have also suggested an impact of the invasive species round goby on the abundance of flounder (Ustups et al. 2016).
Less information on the factors driving changes in population abundance of eelpout are available, but the role of hazardous substances (Bergek et al. 2012), natural predation (Hansson et al. 2017) and increasing water temperatures (Mustamäki et al. 2020) are recognisable. Eelpout is in contrast to the other key species considered here, not a target for any form of fishing in the Baltic Sea (Hansson et al. 2017).
Natural interactions such as predation pressure from apex predators, foremost cormorants (Phalacrocorax carbo) and grey seal (Halichoerus grypus), could at least locally impact the state of coastal fish communities (Vetemaa et al. 2010; Östman et al. 2012; Mustamäki et al. 2014; Hansson et al. 2017; Veneranta et al. 2020; Bergström et al. 2022). In some areas the outtake of coastal fish by cormorants exceeds, or is of a similar magnitude, to that of the commercial and recreational fisheries (Östman et al. 2013). However, the natural mortality from other sources such as predatory fish can be higher than the mortality caused by cormorants in some areas (Heikinheimo et al. 2016). The effects of predation by apex predators might hence vary between coastal areas (see for example Heikinheimo and Lehtonen 2016; Lehikoinen et al. 2017).
Table 5. Brief summary of relevant pressures and activities with relevance to the indicator.
| | General | MSFD Annex III, Table 2a |
| Strong link | Several pressures, both natural and human, acting in concert affect the state of coastal key fish species. These include climate, eutrophication, fishing, and exploitation and loss of essential habitats. To date, no analyses on the relative importance of these variables have been conducted. | Biological – Extraction of, or mortality/injury to, wild species (e.g. selective extraction of species, including incidental non-target catches)- Disturbance of species (e.g. where they breed, rest and feed) due to human presencePhysical- Physical disturbance to seabed (temporary or reversible)- Changes to hydrological conditions Substances, litter and energy – Inputs of nutrients – diffuse sources, point sources, atmospheric deposition |
| Weak link | There might also be effects of hazardous substances and non-indigenous species on the state of key coastal fish species | Substances, litter and energy
– Input of other substances (e.g. synthetic substances, non-synthetic substances, radionuclides) Biological – Input or spread of non-indigenous species |
7 Climate change and other factors
Climate change generally has a large effect on the species considered here (Möllmann et al. 2009; Olsson et al. 2012; Östman et al. 2017b; Olsson 2019, HELCOM 2021) as have alterations in the food web (Eriksson et al. 2009; 2011; Östman et al. 2016; Bergström et al. 2022; Olin et al. 2022). Stressors related to human activities, mainly exploitation of essential habitats (Sundblad et al. 2014; Sundblad & Bergström 2014; Kraufvelin et al. 2018) and fishing (Edgren 2005; Bergström et al. 2007, 2022; Fenberg et al. 2012; Florin et al. 2013; Berkström et al. 2021) also impact the state of coastal fish species. For obligate coastal species such as perch, pike, whitefish, and pikeperch, the outtake comes from both the recreational and small-scale commercial fisheries sector, with the recreational sector dominating in some countries (HELCOM 2015), whereas cod and flounder are exploited both in the offshore and coastal commercial fishery. In some areas of the Baltic Sea, flounder and cod are also targeted by recreational fisheries.
The topic of climate change and its specific interaction with this indicator is also addressed in further detail under Chapter 6 as it is a major driver of change.
8 Conclusions
8.1 Future work or improvements needed
Due to the presence of natural environmental gradients across the Baltic Sea and the rather local appearance of coastal fish communities (and hence their different structures and responses to environmental change), the spatial coverage of monitoring should be improved in some areas in order to enhance the confidence of the evaluation outcome. When designating new potential monitoring programmes, it should be considered that the levels of direct human impact on the coastal fish communities in many of the existing monitoring locations are low, and future locations should include also more heavily affected areas.
Moreover, the current monitoring in the northern and eastern parts of the Baltic Sea is designed to target coastal fish species that prefer higher water temperatures and that dominate coastal areas during warmer parts of the year, typically those with a freshwater origin such as perch. Monitoring of species like whitefish, herring, flounder and cod that dominate coastal fish communities in more exposed parts of the coast and during colder parts of the year are, however, rather poorly represented. Increased monitoring of these species and components should be considered in the future establishment of coastal fish monitoring programmes.
In addition, as a multitude of factors with natural environmental gradients in the Baltic Sea potentially impact coastal fish communities and species, the magnitude of importance of different factors in different coastal areas should be understood. A more mechanistic understanding of how pressures impact upon coastal fish in local contexts will enable managers to take relevant measures to halt declining trends of coastal fish species in some coastal areas. More specifically, the role of fishing (both commercial and recreational) and natural predation needs further investigation.
9 Methodology
This indicator uses two different approaches for evaluating whether good status is achieved. The approach used depends on the data used for the evaluation. If certain criteria are met, the ASCTES approach is used (Östman et al. 2020). If not, then the trend-based approach is used.
The methodology and basis of the indicator evaluation is provided below.
9.1 Scale of assessment
Due to the local appearance of typical coastal fish populations, status assessments of coastal fish communities are representative for rather small geographical scales. In this evaluation the HELCOM assessment unit scale 3 ‘Open sub-basin and coastal waters’ has been applied. The indicator is not evaluated for the open sea sub-basins since the species in focus are coastal.
Evaluations were carried out for 24 of the 42 assessment units and data up to 2020 was available for all assessment units. The number of units evaluated are currently restricted by the availability of monitoring programs.
For the integration of status across species and monitoring locations within assessment units, the One-Out-All-Out principle is applied (Dierschke et al. 2021).
The assessment units are defined in the Annex 4 of the HELCOM Monitoring and Assessment Strategy.
9.2 Methodology applied
ASCETS approach
Coastal fish datasets must meet certain criteria in order to be able to apply an evaluation of good status using the ASCETS approach:
- The time period used to determine the reference period should cover a minimum number of years that is twice the generation time of the species most influential in the indicator assessment. This is to ensure that the influences of strong year classes are taken into account. For coastal fish, this is typically about ten years. In this evaluation, the time period used to determine the reference period against which good status is evaluated spans the years 1998-2015, with varying numbers of years depending on data availability for each time series.
- Before evaluating good status, it should be decided whether or not the reference period reflects good status. If a previous status evaluation exists from HOLAS II, the reference period is assigned the same status as the assessment period in HOLAS II (2011-2016). If a previous status evaluation does not exist, this can is done by using data dating back earlier than the start of the period used to determine the reference period, using additional information, or by expert judgment. For example, if data from time periods preceding the period used for determining the reference period have much higher indicator values, the reference might represent not good status (in case of an indicator where higher values are indicative of a good environmental state) or good status (in case of an indicator where higher values are indicative of an undesirable state).
The ASCETS method (Östman et al. 2020) offers a refined approach to infer structural changes in indicator values over time and establish threshold values for the state during a reference period based on the observed variation in indicator values. ASCETS also gives estimates on the confidence of an apparent change in state of indicator values between a reference period and an assessment period. Thus, by applying ASCETS to time series data, it is possible to derive threshold values for addressing structural changes in indicator values over time and a developed evaluation of the confidence of the derived current indicator state relative to previous indicator values. To determine the status of the indicator, the ASCETS method first derives a bootstrapped distribution of median values from a time series of observed indicator values during a reference period. Specific threshold values for changes in indicator state is set based on the Xth and XXth percentile values of the bootstrapped distribution. For key species, the percentiles are 5 and 98 percent, representing the confidence interval of median indicator values. In this way, the derived boundaries of the confidence interval can function as threshold values for a change in state per assessment unit of each species. Because ASCETS bootstraps median indicator values during the reference period it is possible that one or several observed indicator values during the reference period will fall outside of the 95% confidence interval, because the bootstrapping reduces the influence of what may be large sampling errors. Second, the bootstrapped median indicator value during the assessment period is evaluated in relation to the threshold values derived from the reference period depending on how much of the bootstrapped median distribution from the assessment period that falls below, within, or above the Xth and XXth percentiles. (see Figure 2 and decision tree in Figure 6):
- In situations where the reference conditions represent good status, the median of the years in the assessment period should be above the 5th percentile of the median distribution of the dataset used to determine the baseline in order to reflect good status.
- In situations where the baseline conditions represent not good status, the median of the years in the assessment period should be above the 98th percentile of the median distribution of the dataset used to determine the baseline in order to reflect good status.
Trend-based approach
If the requirements for defining quantitative baseline conditions are not met (e.g. short time series), then a trend-based evaluation should be used. All available data starting form year 2014 is included in trend analyses.
In the trend-based approach, good status is defined based on the direction of the trend of the indicator compared to the desired direction of the indicator over time (Figure 3). When the first years of the time series evaluated represent good status, the trend of the indicator over time should not be negative in order to represent good status. If the first years of the time series evaluated represent not good status, the trend in the indicator should be positive in order to represent good status. The level of significance for these trends should be p < 0.1.
Decision tree for evaluation using coastal fish community structure
The assessment protocol is found in figure 6.
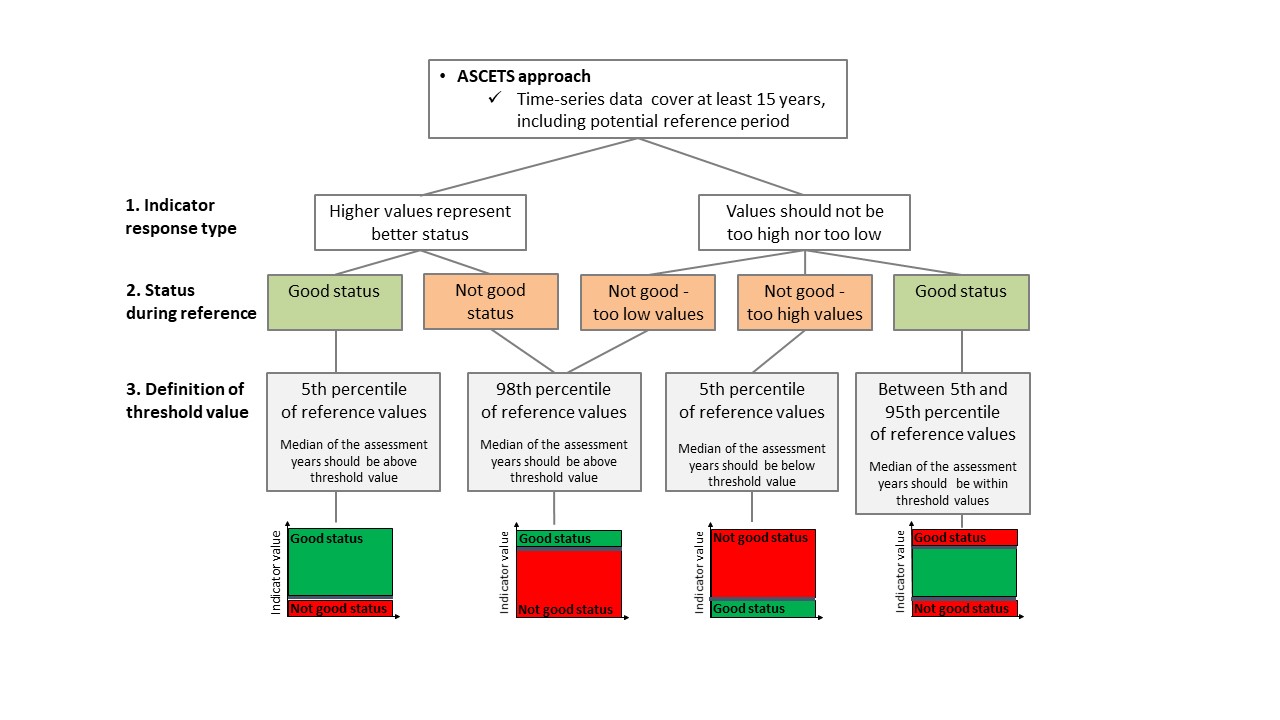
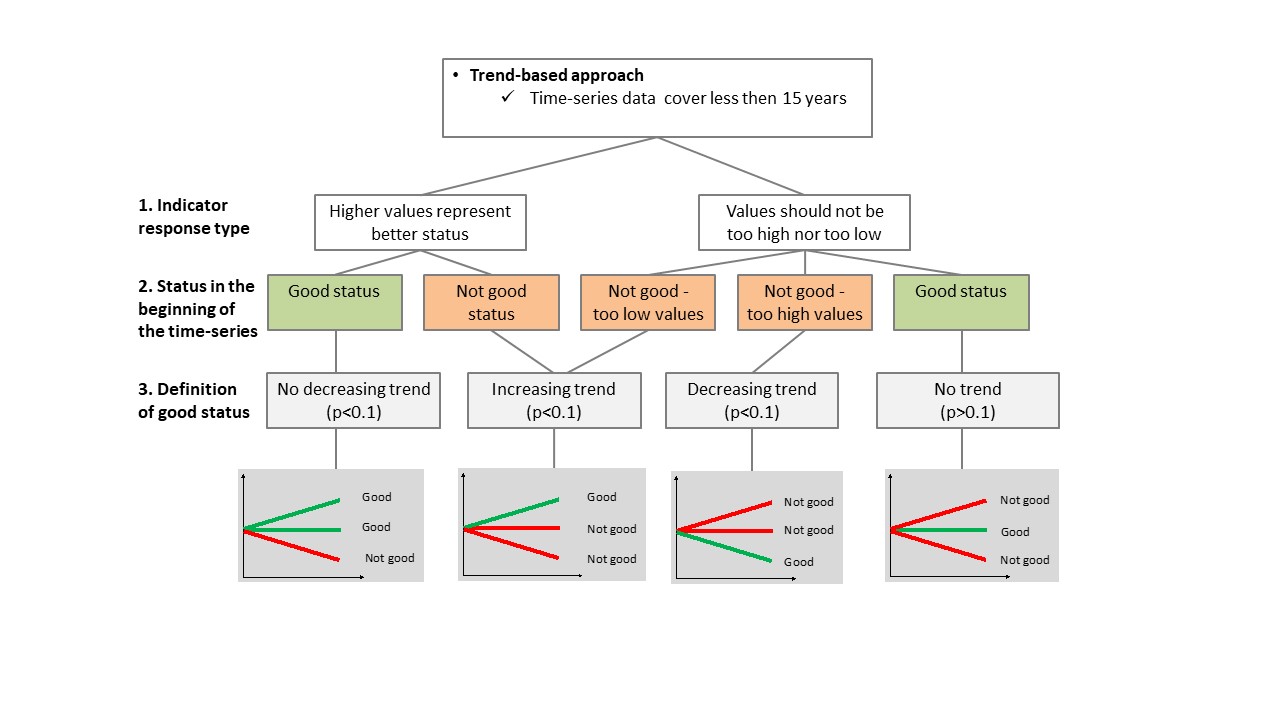
Figure 6. Decision tree for assessment using coastal fish community structure. The ASCETS approach (top figure) and trendbased approach (bottom figure) are presented.
Data analyses
The data used for the assessments are derived from fishery independent monitoring, citizen science and/or commercial catch statistics.
Fishery independent monitoring
The analyses are based on catch per unit effort (CPUE) data from annual averages of all sampling stations in each area. Individuals smaller than 12 cm (Nordic Coastal multimesh nets) or 14 cm (other net types) were excluded from the evaluation in order to only include species and size-groups suited for quantitative sampling by the method. Abundance is calculated as the number of individuals of the species included in the indicator per unit effort (CPUE).
Commercial catch data
Analyses were based on CPUE data in the form of kg/gillnet day, and each data point represents total annual CPUE per area. The gillnets used have mesh sizes between 36-60 mm (bar length) and hence target a somewhat different aspect of the fish community in the area. In addition, fishing is not performed at fixed stations nor with a constant effort across years. As a result, the estimates from the gillnet monitoring programmes and commercial catch data are not directly comparable, and only relative changes across data sources should be compared.
Citizen science
As for the other surveys, analyses were based on CPUE data (number of fish per effort) from monofilament gill nets or fyke nets. Voluntary recreational fishermen undertake fishing during the period April to November. For comparability only data from August was used in the current evaluation. The fishermen fish at fixed stations and during the first half of each month throughout the season. This mediates the comparability of the data with fisheries independent monitoring programs using gill nets or fyke nets.
9.3 Monitoring and reporting requirements
Monitoring methodology
The HELCOM common monitoring on coastal fish is described on a general level in the HELCOM Monitoring Manual in the sub-programme: Coastal fish.
The HELCOM common monitoring on coastal fish is described in guidelines that were adopted in 2014 and updated in 2019.
Current monitoring
The monitoring activities relevant to the indicator that are currently carried out by HELCOM Contracting Parties are described in the HELCOM Monitoring Manual in the Monitoring Concepts table as well as in the guidelines for coastal fish monitoring.
Sub-programme: Coastal fish
Coastal fish monitoring is rather widespread in the Baltic Sea, and at present covers 32 of the total 42 ‘scale 3 HELCOM assessment units’. Coastal areas that lack coastal fish monitoring includes Russia and Germany (in total 7 assessment units) where there is no current and official monitoring program for coastal fish, two assessment units in Finland (Åland Sea Finnish coastal waters and Northern Baltic Proper Finnish coastal waters) and one in Denmark (Kiel Bight Danish coastal waters). The current monitoring where information on Key species can be extracted to date is less extensive, covering 24 assessment units.
The current monitoring of coastal fish in the Baltic Sea represents a minimum level of effort and serves as a first step for evaluating the status of coastal fish communities.
The current monitoring likely yields insights into major and large-scale changes in coastal fish communities in the Baltic Sea, but unique and departing responses are possible in some areas.
In Estonia and Latvia, coastal fish monitoring is carried out at several locations, but the evaluation has only been made for one location in Estonia and two in Latvia. In Denmark, no data is available to support the cyprinids/mesopredators, and the Finnish commercial catch data is not applicable for assessing status of non-targeted fish species. In Germany, there is no coordinated monitoring program for coastal fish, but a project aiming to establish such a program was initiated in 2020 in the coastal areas of Schleswig-Holstein.
10 Data
The data and resulting data products (e.g. tables, figures and maps) available on the indicator web page can be used freely given that it is used appropriately and the source is cited.
Result: Abundance of key coastal fish species
Data: Abundance of key coastal fish species – point and polygon
Data are typically collected annually in August by national and regional monitoring programmes. Catch per unit effort from commercial catch statistics in Finland represent total annual catches and citizen science data from Denmark a larger selection of months. See HELCOM (2019) for details. For future updates of this evaluation, data should be collected in each location on an annual basis.
A few time series of coastal fish began in the 1970s (Olsson et al. 2012), whereas others were started in the 1980s and the mid-1990s (HELCOM 2019). In Finland and Sweden, a new coastal fish monitoring programme with a higher spatial resolution was established in the early 2000s, and in Poland and Denmark monitoring data and citizen science data is typically available from the mid 2010s. For more information, see HELCOM 2019.
The raw data on which this evaluation is based, are stored in national databases. Each country has its own routines for quality assurance of the stored data. From 2017, each country calculates indicator values for their monitoring locations from the raw data from fish monitoring. The indicator data and values are then during the first half of the year uploaded to the HELCOM database for coastal fish core indicators, COOL (http://www.helcom.fi/baltic-sea-trends/data-maps/biodiversity/) as hosted by the HELCOM secretariat. Indicator data for status evaluations are extracted from the COOL database, and the evaluation undertaken by the lead country (Sweden) according to the assessment protocol outlined in this report.
Data sources
Coastal fish monitoring is coordinated within the HELCOM FISH PRO III expert network. The network compiles data from fisheries independent monitoring in Finland, Estonia, Latvia, Lithuania, Poland, Germany, Denmark and Sweden. Coastal fish communities in the Baltic Sea areas of Russia are to some extent monitored as well. In Germany, there is no coordinated monitoring program for coastal fish, but a project aiming to establish such a program was initiated in 2020 in the coastal areas of Schleswig-Holstein. In Denmark, there is no coastal fish monitoring programme and the data provided relies on voluntary catch registration by recreational fishermen through the “key-fishermen” project, which has no long-term secured funding (initiated in 2005). Due to lack of geographical coverage, the state of coastal fish communities in Finland is monitored using estimates of catch per unit effort (CPUE) from the small-scaled coastal commercial fishery. There are some additional monitoring locations (see HELCOM 2019), which were not included in this evaluation due to lack of funding in some countries for carrying out status evaluations.
The institutes responsible for sampling are: Natural Resources Institute Finland (Luke) (Finland), Provincial Government of Åland Islands (Finland), Estonian Marine Institute (Estonia), University of Tartu (Estonia), Institute of Food Safety, Animal Health and Environment “BIOR” (Latvia), Nature Research Center (Lithuania), Klaipeda University (Lithuania), National Marine Fisheries Research Institute, Gdynia (Poland), National Institute of Aquatic Resources, Technical University of Denmark (Denmark), Department of Aquatic Resources, Swedish University of Agricultural Sciences (Sweden).
11 Contributors
The HELCOM FISH PRO III expert network on coastal fish:
Jens Olsson, Elisabeth Bolund, Lena Bergström, Örjan Östman, Noora Mustamäki and Rahmat Naddafi, Department of Aquatic Resources, Swedish University of Agricultural Sciences, Sweden
Mikko Olin and Antti Lappalainen, Natural Resources Institute Finland (Luke), Finland
Linda Sundström, Provincial Government of Åland Islands, Finland
Lauri Saks and Roland Svirgsden, Estonian Marine Institute, University of Tartu, Estonia
Laura Briekmane, Institute of Food Safety, Animal Health and Environment “BIOR”, Latvia
Tomas Zolubas and Antanas Kontautas, Klaipeda University, Lithuania
Linas Lozys and Justas Dainys, Nature Research Center, Vilnius, Lithuania
Adam Lejk and Łukasz Dziemian, National Marine Fisheries Research Institute, Gdynia, Poland
Elliot John Brown, National Institute of Aquatic Resources, Technical University of Denmark, Denmark
HELCOM Secretariat: Jannica Haldin, Owen Rowe
12 Archive
This version of the HELCOM core indicator report was published in April 2023:
The current version of this indicator (including as a PDF) can be found on the HELCOM indicator web page.
Earlier versions of the core indicator report include:
Abundance of key coastal fish species HELCOM core indicator 2018 (pdf)
HOLAS II component – Core indicator report – web-based version July 2017 (pdf)
Core indicator report – web-based version October 2015 (pdf)
Extended core indicator report – outcome of CORESET II project (2015) (pdf)
13 References
Baden, S. et al. (2012) Shift in seagrass food web structure over decades is linked to overfishing. Mar Ecol Prog Ser 451: 61–73.
Bergek, S. et al. (2012) From individuals to populations: Impacts of environmental pollution on natural eelpout populations. Ecotoxicology and Environmental Safety 79: 1-12.
Berggren, T. et al. (2022) Warmer water increases early body growth of northern pike (Esox lucius), but mortality has larger impact on decreasing body sizes. Can. J. Fish. Aquat. Sci. 1–11.
Bergström, L. et al. (2016a) Long term changes in the status of coastal fish in the Baltic Sea. Estuarine, Coastal and Shelf Science, 169: 74–84.
Bergström, L. et al. (2016b) Coastal fish indicators response to natural and anthropogenic drivers – variability at temporal and different spatial scales Long term changes in the status of coastal fish in the Baltic Sea. Estuarine, Coastal and Shelf Science 183: 62–72.
Bergström, L. et al. (2019) Relative impacts of fishing and eutrophication on coastal fish assessed by comparing a no-take area with an environmental gradient. Ambio 48: 565–579.
Bergström, U. et al. (2007) Effekter av fredningsområden på fisk och kräftdjur i svenska vatten. (In Swedish). Finfo 2007:2.
Bergström, U. et al. (2013) Evaluating eutrophication management scenarios in the Baltic Sea using species distribution modelling. J. Appl. Ecol. 50: 680–69.
Bergström, U. et al. (2022) Long-term decline in northern pike (Esox lucius L.) populations in the Baltic Sea revealed by recreational angling data. Fisheries Research 251: 106307.
Berkström, C. et al. (2021). Rapid effects of a fishing closure on whitefish (Coregonus maraena) in the northern Baltic Sea. Boreal Environment Research. 26, 89-104.
Böhling, P. et al. (1991) Variations in year-class strength of different perch (Perca fluviatilis) populations in the Baltic Sea with special reference to temperature and pollution. Canadian Journal of Fisheries and Aquatic Sciences 48: 1181-1187.
Carl, J. et al. (2008) Substratum selection by juvenile flounder Platichthys flesus (L.): effect of ephemeral filamentous macroalgae. J. Fish Biology 72: 2570-2578.
Dierschke V. et al. (2021) Integration methods for Marine Strategy Framework Directive’s biodiversity assessments, EUR 30656 EN, Publications Office of the European Union, Luxembourg.
Edgren, J. (2005) Effects of a no-take reserve in the Baltic Sea on the top predator, northern pike (Esox lucius). Master thesis, Stockholm University.
Eklöf, J.S. (2020) A spatial regime shift from predator to prey dominance in a large coastal ecosystem. Communications Biology 3:459.
European Commission (2008) Directive 2008/56/EC of the European Parliament and of the Council of 17 June 2008 establishing a framework for community action in the field of marine environmental policy. Official Journal of the European Union L164: 19–40.
Eriksson, B.K. et al. (2009) Declines in predatory fish promote bloom-forming macroalgae. Ecological Applications 19: 1975-1988.
Eriksson, B.K. et al. (2011) Effects of altered offshore food webs on coastal ecosystems emphasizes the need for cross-ecosystem management. Ambio 40: 786-797.
Fenberg, P.B. et al. (2012) The science of European marine reserves: Status, efficacy, and future needs. Marine Policy 36(5): 1012-1021.
Florin, A.B. et al. (2013) Effects of a large northern European no‐take zone on flatfish populations. Journal of fish biology 83(4): 939-962.
Hansson, S. et al. (2017) Competition for the fish – fish extraction from the Baltic Sea by humans, aquatic mammals, and birds. ICES Journal of Marine Science 75: 999-1008.
Heikinheimo, O. et al. (2016) Overestimated effect of cormorant predation on fisheries catches. Comment to article by Salmi, J.A. et al., 2015: Perch (Perca fluviatilis) and pikeperch (Sander lucioperca) in the diet of the great cormorant (Phalacrocorax carbo) and effects on catches in the Archipelago Sea, Southwest coast of Finland. Fish. Res. 179: 354–357.
HELCOM (2012) Indicator-based assessment of coastal fish community status in the Baltic Sea 2005-2009. Baltic Sea Environment Proceedings No. 131.
HELCOM (2015) Recreational fisheries in the Baltic Sea and availability of data.
HELCOM (2018) Abundance of coastal fish key species. HELCOM core indicator report. Online.
HELCOM (2019) Guidelines for coastal fish monitoring sampling methods of HELCOM. Online.
HELCOM (2021) Climate Change in the Baltic Sea. 2021 Fact Sheet. Baltic Sea Environment Proceedings n°180. HELCOM/Baltic Earth.
Kraufvelin, P. et al. (2018) Essential coastal habitats for fish in the Baltic Sea. Estuarine, Coastal and Shelf Science 204: 14-30.
Laikre, L. et al. (2005) Spatial genetic structure of northern pike (Esox lucius) in the Baltic Sea. Mol Ecol 14: 1955–1964.
Lappalainen, A. et al. Length at maturity as a potential indicator of fishing pressure effects on coastal pikeperch (Sander lucioperca) stocks in the northern Baltic Sea. Fish. Res. 174: 47–57.
Lehikoinen, A. et al. 2017. The role of cormorants, fishing effort and temperature on the catches per unit effort of fisheries in Finnish coastal waters. Fisheries Research 190: 175-192.
Linlokken, A. et al. (2008) Environmental correlates of population variables of perch (Perca fluviatilis) in boreal lakes. Environmental Biology of Fishes 82(4): 401-408.
Mustamäki, N. et al. (2014) Pikeperch (Sander lucioperca (L.)) in decline: High mortality of three populations in the Northern Baltic Sea. Ambio 43: 325–336.
Mustamäki, N. et al. (2020). Fjällbacka, Västerhavet, 1989–2019; Torhamn, södra Egentliga Östersjön, 2002–2019; Kvädöfjärden, Egentliga Östersjön, 1981–2019; Holmöarna, Bottniska viken, 1989–2019. (in Swedish). Institutionen för akvatiska resurser , Sveriges lantbruksuniversitet. Faktablad från integrerad kustfiskövervakning. 2020:1.
Möllman, C. et al. (2009) Reorganization of a large marine ecosystem due to atmospheric and anthropogenic pressure: a discontinuous regime shift in the Central Baltic Sea. Global Change Biology 15: 1377–1393.
Nielsen, E. et al. (2008) Undersøgelse af sammenhængen mellem udviklingen af skarvkolonien ved Toftesø og forekomsten af fladfiskeyngel i Ålborg Bugt. (In Danish) DTU Aqua-report 179-08. 82 pp.
Olin, A. B. et al. (2022) Increases of opportunistic species in response to ecosystem change: the case of the Baltic Sea three-spined stickleback. ICES Journal of Marine Science 79: 1419–1434.
Olsson, J. et al. (2011) Genetic population structure of perch, Perca fluviatilis L, along the Swedish coast of the Baltic Sea. Journal of Fish Biology 79: 122–137.
Olsson, J. et al. (2012) Abiotic drivers of coastal fish community change during four decades in the Baltic Sea. ICES Journal of Marine Science 69: 961-970.
Olsson, J. (2019) Past and Current Trends of Coastal Predatory Fish in the Baltic Sea with a Focus on Perch, Pike, and Pikeperch. Fishes 4: 7.
Östman, Ö. et al. (2012) Do cormorant colonies affect local fish communities in the Baltic Sea? Canadian Journal of Fisheries and Aquatic Sciences 69: 1047-1055.
Östman, Ö. et al. (2013) Estimating competition between wildlife and humans–a case of cormorants and coastal fisheries in the Baltic Sea. Plos One 8: e83763.
Östman, Ö. et al. (2016) Top‐down control as important as nutrient enrichment for eutrophication effects in North Atlantic coastal ecosystems. Journal of Applied Ecology. 53: 1138-1147.
Östman, Ö. et al. (2017a) Inferring spatial structure from population genetics and spatial synchrony in population growth of Baltic Sea fishes: implications for management. Fish and Fisheries. 18: 324-339.
Östman, Ö. et al. (2017b) Temporal development and spatial scale of coastal fish indicators in reference sites in coastal ecosystems: hydroclimate and anthropogenic drivers. Journal of Applied Ecology. 54: 557-566.
Östman, Ö. et al. (2020) Analyses of structural changes in ecological time series (ASCETS). Ecological Indicators 116: 106469.
Saulamo, K. et al. (2002) Local management of Baltic fish stocks – significance of migrations. Finfo 2002, No. 9.
Sundblad, G. et al. (2014) Nursery habitat availability limits adult stock sizes. ICES Journal of Marine Science 71: 672-680.
Sundblad, G. et al. (2014) Shoreline development and degradation of coastal fish reproduction habitats. Ambio 43: 1020-1028.
Ustup, D. et al. (2016). Diet overlap between juvenile flatfish and the invasive round goby in the central Baltic Sea. Journal of Sea Research 107: 121-129.
Veneranta, L. et al. (2013a). Reproduction areas of sea-spawning coregonids reflect the environment in shallow coastal waters. Marine Ecology. Progress Series, 477: 231-250.
Veneranta, L. et al. (2013b). Spawning and hatching temperatures of whitefish (Coregonus lavaretus (L.)) in the Northern Baltic Sea. Advances in Limnology, 64: 39 – 55.
Veneranta, L. et al (2020) Cormorant (Phalacrocorax carbo) predation on a coastal perch (Perca fluviatilis) population: estimated effects based on PIT tag mark-recapture experiment. ICES Journal of Marine Science 77: 2611-2622.
Vetemaa, M. et al. (2010) Changes in fish stocks in an Estonian estuary: overfishing by cormorants? ICES Journal of Marine Science 67: 1972–1979.
14 Other relevant resources
Heikinheimo, O. et al. (2014) Spawning stock – recruitment relationship in pikeperch, Sander lucioperca, in the Baltic Sea, with temperature as environmental effect. Fisheries Research 155: 1–9.
Heikinheimo, O. et al. (2016) Estimating the mortality caused by great cormorant predation on fish stocks: pikeperch in the Archipelago Sea, northern Baltic Sea, as an example. Can. J. Fish. Aquat. Sci. 73: 84–93.
Kokkonen, E. et al. (2015) Probabilistic maturation reaction norm trends reveal decreased size and age at maturation in an intensively harvested stock of pikeperch Sander lucioperca. Fisheries Research 167: 1–12.
Lappalainen, A., et al. (2016) Length at maturity as a potential indicator of fishing pressure effects on coastal pikeperch (Sander lucioperca) stocks in the northern Baltic Sea. Fisheries Research 174: 47–57.
Lehikoinen, A. et al. (2011) Temporal changes in the diet of great cormorant (Phalacrocorax carbo sinensis) on the southern coast of Finland – comparison with available fish data. Boreal Environment Research 16 (suppl. B): 61-70.
Lehikoinen, A., et al. (2017) The role of cormorants, fishing effort and temperature on the catches per unit effort of fisheries in Finnish coastal areas. Fisheries Research 190: 175–182.
Neuman, E. (1974) Temperaturens inverkan på rörelseaktivteter hos fisk i en Östersjövik. (In Swedish) Statens naturvårdsverk, PM 477. 84 pp.
Olsson, J., et al. (2015) Using catch statistics from the small scale coastal Baltic fishery for status assessment of coastal fish. Aqua reports 2015:13. Sveriges lantbruksuniversitet, Öregrund. 65 pp.
Smoliński, S., Całkiewicz, J. (2015) A fish-based index for assessing the ecological status of Polish transitional and coastal waters. Marine Pollution Bulletin, 101: 497–506.
Thoresson, G. (1996) Guidelines for coastal fish monitoring. Swedish Board of Fisheries, Kustrapport 1996:2.
Voipio, A. (1981) The Baltic Sea. Elsevier, Helsinki.