 Waterbirds wintering season
2 Relevance of the indicator
The indicator follows temporal changes in the abundance of waterbird species, which have functional significance in the marine ecosystem and respond to numerous pressures, many of them caused by human activities. Thus, the indicator gives an overall view of the state of marine birds in the Baltic Sea and reflects the cumulative impact of pressures.
2.1 Ecological relevance
Waterbirds are an integral part of the Baltic marine ecosystem. They are predators of fish and macroinvertebrates, scavengers of carcasses and fishery discards and herbivores of littoral vegetation and coastal grasslands. Many species are specialized on certain species and/or size classes of prey, whereas other species are opportunistic. Regardless of degree of specialization, their abundance is affected by the availability of prey. Changes in the number of waterbirds reflect conditions in the food web of the Baltic Sea.
As predators at, or close to, the top of the food web, waterbirds accumulate contaminants, and their abundance may reflect the degree of contamination. Contaminants ingested in winter may have carry-over effects on breeding success. Moreover, several waterbird species are prey for other species, e.g. white-tailed eagles, transferring the loads of contaminants to a higher level in the food web.
Some of the birds included in this indicator not only winter in the Baltic Sea, but also breed there. As the wintering and breeding areas usually differ, breeding birds and winter visitors are evaluated separately in two indicators. The reason for this is not least that the indicators are primarily intended to provide information on the state of biodiversity in the Baltic Sea. Just as many birds winter outside the Baltic Sea under the breeding bird indicator, many birds covered by the winter abundance indicator do not breed in the Baltic Sea region. In general, the explanatory power of the indicator is constrained by factors acting on the waterbirds in the breeding season, either in the Baltic Sea or in other breeding areas in northern Eurasia or as far east as the Siberian Taimyr Peninsula.
Waterbirds use all ice-free areas of the Baltic Sea as a wintering areas and therefore the distribution varies between years depending on ice conditions. The HELCOM supporting parameter ‘Ice season’ provides insight into the highly variable coverage of ice in the Baltic Sea during the past few centuries.
2.2 Policy relevance
The indicator on abundance of waterbirds in the breeding season addresses the Baltic Sea Action Plan (BSAP) biodiversity segment’s ecological objectives ‘Viable populations of all native species’, ‘Natural distribution, occurrence and quality of habitats and associated communities’, ‘Functional, healthy and resilient food webs ‘ as well as the eutrophication segment’s ecological objective ‘Natural distribution and occurrence of plants and animals’. It is of direct relevance for the 2021 BSAP Actions:
- B11: Maintain an updated map of the sensitivity of birds to threats such as wind energy facilities, wave energy installations, shipping and fisheries. Complete, as a first step, the mapping of migration routes, staging, moulting and breeding areas based on existing data by 2022. By 2025 further develop these maps by incorporating new data, post-production investigation information and addressing the subject of cumulative effects from these activities in space and time.
- B12 By 2023 and onwards with new findings use the maps on sensitivity of migratory birds to threats in environmental impact assessment (EIA) procedures with the aim to protect migratory birds against potential threats arising from new offshore wind farms and other installations with barrier effect.
- B13 By the next update cycle of the maritime spatial plans seek to incorporate the maps on sensitivity of migratory birds to threats in the work concerning maritime spatial planning to avoid that maritime activities impair birds and their habitats. Cross-reference to actions in other segments HT13 HT14
- B14 By 2027 assess the effectiveness of conservation efforts to protect waterbirds against threats and pressures
- B33: By 2024 develop a roadmap to fill gaps to enable a holistic assessment for all relevant ecosystem components and pressures and, by 2030 at the latest, develop and fully operationalise a set of indicators fulfilling HELCOM’s needs, including the need to provide a regional platform for the Marine Strategy Framework Directive (MSFD).
The core indicator is relevant to the following action of the 2013 HELCOM Ministerial Declaration:
- 4 (B). WE DECIDE to protect seabirds in the Baltic Sea, taking into consideration migratory species and need for co-operation with other regions through conventions and institutions such as the Agreement on Conservation of African Eurasian Migratory Waterbirds (AEWA) under the Convention on Migratory Species (CMS), and particularly in the North Sea (OSPAR) and Arctic (Arctic Council) areas.
And the following action from the 2018 HELCOM Ministerial Declaration:
- 43. WE COMMIT to increasing the protection and restoration of biodiversity, to intensifying regional, subregional and cross-sectoral cooperation, and to preserving and promoting the ecological balance of the Baltic Sea area with strengthened resilience, also as streamlined response to adaptation needs stemming from human-induced climate change;
- 59. WE AGREE to strengthen the fruitful cooperation with OSPAR on transboundary issues and common challenges to gain efficiency and effectiveness in the implementation of SDGs such as ballast water management and introduction of invasive alien species, the issue of underwater noise, micro-plastic, migratory birds, MPA network and management, and threatened and endangered species
The core indicator also addresses the following qualitative descriptors of the MSFD for determining good environmental status (European Commission 2008):
Descriptor 1: ‘Biological diversity is maintained. The quality and occurrence of habitats and the distribution and abundance of species are in line with prevailing physiographic, geographic and climatic conditions’;
Descriptor 4: ‘All elements of the marine food webs, to the extent that they are known, occur at normal abundance and diversity and levels capable of ensuring the long-term abundance of the species and the retention of their full reproductive capacity’.
and the following criteria of the Commission Decision (European Commission 2017):
- Criterion D1C1 (mortality rate from incidental by-catch).
- Criterion D1C2 (population abundance)
- Criterion D1C3 (population demographic characteristics)
- Criterion D1C4 (species distribution)
- Criterion D1C5 (habitat for the species)
- Criterion D4C1 (diversity of trophic guild)
- Criterion D4C4 (productivity of trophic guild)
The EU Birds Directive (a) lists in Annex 1 red-throated diver, black-throated diver, Slavonian grebe, Bewick’s swan, whooper swan, Steller’s eider, smew and little gull (the last species currently not evaluated) as subject of special conservation measures and (b) generally covers all migratory species and they have to be reported (European Commission 2010). Thus, all species included in the concept of the indicator are also covered by the EU Birds Directive, which requires conservation of habitats in a way that allows birds to breed, moult, stage during migration and spend the winter.
Furthermore, the Baltic Sea is located in the agreement area of the Agreement on the Conservation of African-Eurasian Migratory Waterbirds (AEWA). Contracting Parties (all HELCOM member countries except Poland and Russia) are obliged to undertake measures warranting the conservation of migratory waterbirds and their habitats.
The goals of the BSAP, EU MSFD, AEWA and EU Birds Directive are largely overlapping and the data needed for the indicator are roughly the same as needed for reporting within the framework of the EU Birds Directive.
In order to protect migrating birds in the Baltic Sea region, HELCOM has adopted the Recommendation 34/E-1 ‘Safeguarding important bird habitats and migration routes in the Baltic Sea from negative effects of wind and wave energy production at sea’. Since some species included in the concept of the indicator are vulnerable to habitat loss caused by wind farms and access to feeding areas of wintering birds may be blocked by wind farms, while others are prone to collisions (e.g., Dierschke et al. 2016, Fox & Petersen 2019, King 2019), the indicator is linked to the intentions of the recommendation.
The indicator supports the UN Sustainable Development Goal 14: Conserve and sustainably use the oceans, sea and marine resources for sustainable development.
An overview is provided in Table 1.
Table 1. Policy relevance of the HELCOM core indicator ‘Abundance of waterbirds in the wintering season’.
| Baltic Sea Action Plan (BSAP) | Marine Strategy Framework Directive (MSFD) | |
| Fundamental link | Segment: Biodiversity
Goal: “Baltic Sea ecosystem is healthy and resilient”
|
Descriptor 1 species groups of birds, mammals, reptiles, fish and cephalopods
|
| Complementary link |
Goal: “Baltic Sea unaffected by eutrophication”
|
Descriptor 1 Species groups of birds, mammals, reptiles, fish and cephalopods
Descriptor 4 Ecosystems, including food webs
Element of the feature assessed – Apex predators, sub-apex predators. |
| Other relevant legislation: | In some countries also EU Birds Directive (migrating species Article 4 (2); red-throated diver, black-throated diver, Slavonian grebe, Bewick’s swan, whooper swan, Steller’s eider, smew, little gull listed in Annex I); Birds Directive Article 12 report, parameter “Population trend”; EU Habitats Directive and Agreement on the Conservation of African-Eurasian Migratory Waterbirds (AEWA); UN Sustainable Development Goal 14. | |
2.3 Relevance for other assessments
The results of this indicator are well suited to feed into the thematic assessment for birds and into HOLAS 3 (via the BEAT tool).
Further, the results can be used for integrated assessments conducted by EU Member States for their reporting under Article 8 MSFD. According to the relevant guidance for waterbirds (European Commission 2022), this abundance indicator is weighted equally to the criterion by-catch.
3 Threshold values
3.1 Setting the threshold value(s)
The status of a wintering waterbird species counted from the coastline is evaluated by comparing geometric mean of index values from the six years of the assessment period, 2016-2021, to the baseline. The baseline is defined by a reference period, i.e. the mean of the ten year period 1991-2000, which is scaled to 1 (schematic representation in Figure 2). A species does not achieve good status if the abundance deviates more than 30% (20% in species laying only one egg per year) downwards from the abundance in the baseline period. A very similar approach to threshold setting was used for birds wintering off the coast. The mean winter abundance in the evaluation period (2016-2021) was compared to the baseline value (in this case the mean winter abundance in the period 1986-1997), and less than downward 30% deviation were allowed to remain in good status. If a species was evaluated based on both land-based and at-sea surveys, the deviations from the baselines were combined, weighted for the estimated proportions of the respective population wintering close to the coast and offshore, respectively (see ICES 2017 and Mercker et al. 2021a for details).
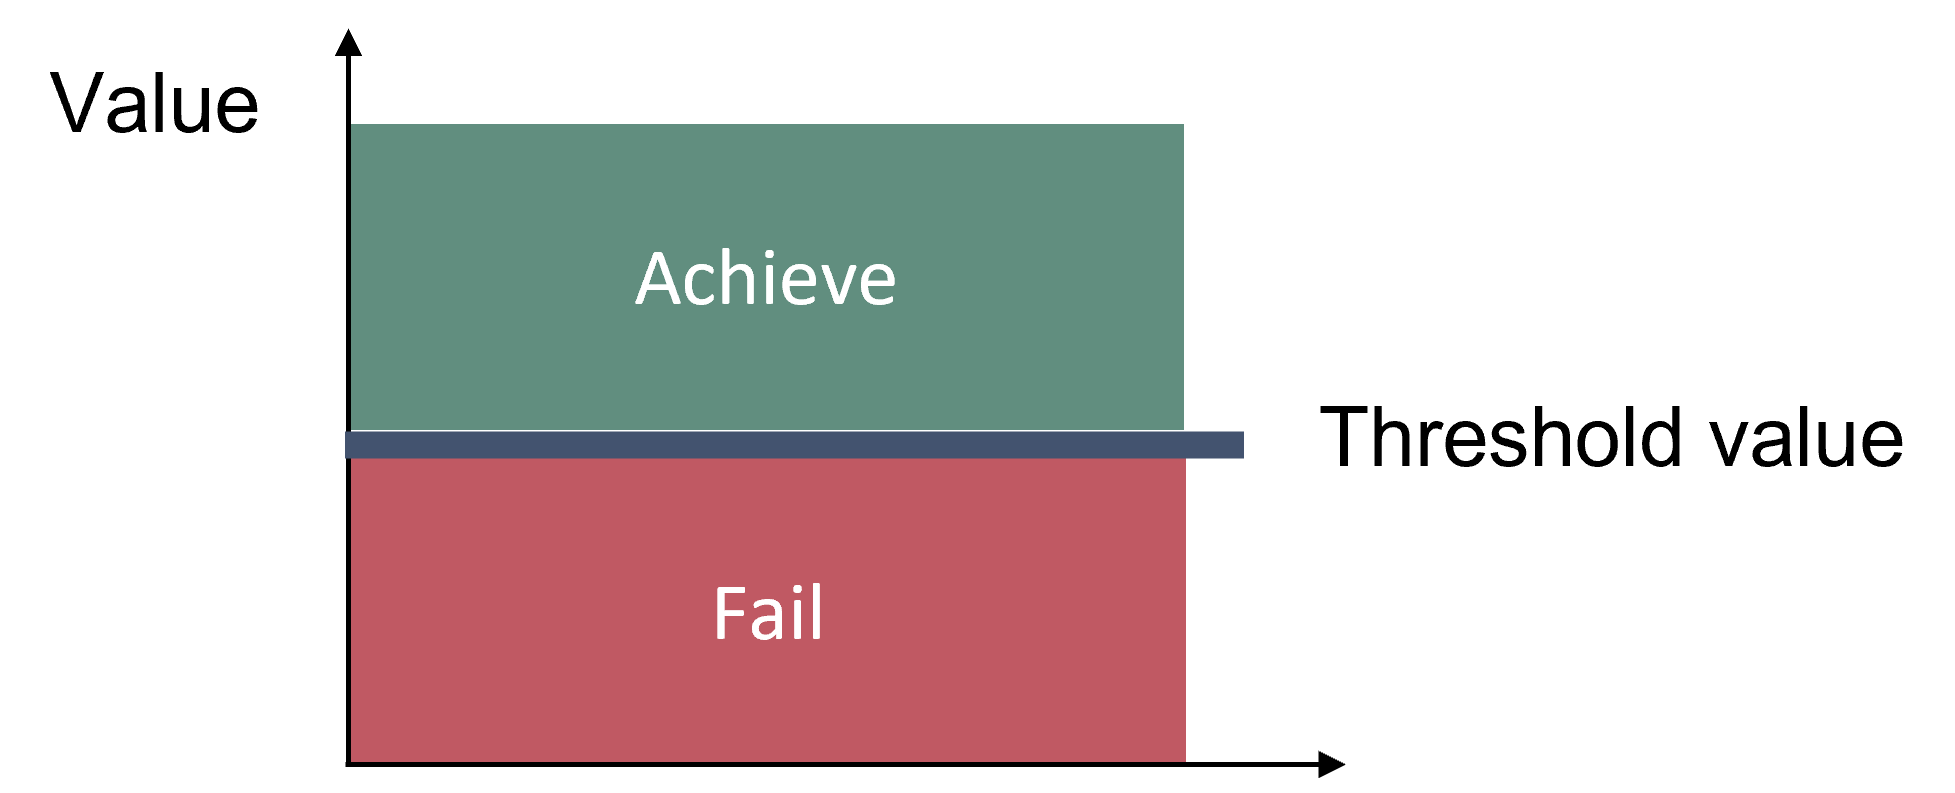
Figure 2. Schematic representation of the threshold value applied in the ‘Abundance of waterbirds in the wintering season’ core indicator.
The status of a species group (for definitions see below) is evaluated by examining the proportion of wintering waterbird species evaluated as being in good status. The threshold value is achieved if 75% of the species deviate less than 30%/20% downwards from the baseline.
The threshold concept follows the concept of the OSPAR Indicator ‘Marine bird abundance’ (ICES 2013, OSPAR 2017). Upward deviations (>30% above abundance at the baseline) are not considered to reflect a failure to achieve the threshold value indicating good status, however they are reported as possible indications of imbalance in the ecosystem. The applicability of this method in the Baltic Sea has been shown in the preceding version of this indicator (HELCOM 2018b). Good status is possible to achieve also for species identified as being threatened in the Baltic Sea (HELCOM 2013), when the species maintained its population size on a low level or even increased while still being under pressure from anthropogenic influence.
The multi-species evaluation can be conducted using all species without any weighting, but then the results are biased with regard to the numbers of species in the species groups. More meaningful results are obtained when species groups form the basis of the evaluation. ICES (2015) has defined terminology and composition of functional species groups, which are defined mainly by the way of foraging (see Table 2). OSPAR/HELCOM/ICES Joint Working Group on Marine Birds (JWGBIRD) has identified bird species suitable for supporting the wintering waterbird abundance indicator (ICES 2016). Thus, this indicator provides five evaluations when applied to
- surface feeders (three species: common gull, great black-backed gull, herring gull; black-headed gull in one subdivision only),
- pelagic feeders (nine species: smew, goosander, red-breasted merganser, great crested grebe, red-necked grebe, Slavonian grebe, red-throated diver, black-throated diver, great cormorant),
- benthic feeders (nine species: common pochard, tufted duck, greater scaup, common eider, Steller’s eider, long-tailed duck, common scoter, velvet scoter, common goldeneye),
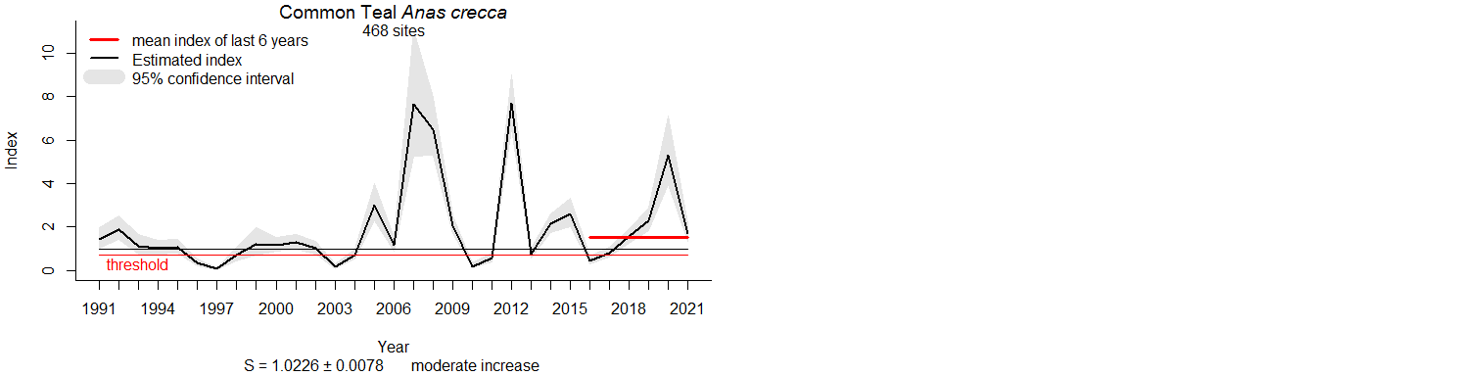
- wading feeders (one species: Eurasian teal) and
- grazing feeders (seven species: mute swan, whooper swan, Bewick’s swan, Eurasian teal, mallard, northern pintail, Eurasian coot).
It has to be noted that some species apply more than one foraging mode (ICES 2016). Of the species selected for this indicator, this holds true for some gulls (which are also wading feeders) and great cormorant and Eurasian coot (which are also benthic feeders), but also other species can feed on resources not belonging to their foraging group. The placement of a species in a given group reflects its main feeding behaviour, it does not capture its entire feeding niche.
Given the composition of the species groups, the five evaluations are based on a different number of species per group. For example, in benthic feeders, seven out of nine species (78%) would need to be above the threshold, while in surface feeders all three species would have to be above the threshold level, because two out of three species would mean that only 67% of the species do not deviate from the baseline too much (but 75% is required).
The selection of species evaluated in the indicator was related to occurrence in Baltic marine habitats in winter and data availability, but independent of threat status. In the case of species predominantly living offshore the spatial coverage is poor, because the majority of the respective populations is not accessible by the land-based counts. Therefore, the confidence for evaluations for most seaducks and grebes as well as for all divers is considered as being low, which is indicated for the use in the integrated assessment in the BEAT tool (HELCOM 2018a). Higher confidence will be achieved as soon as offshore surveys can be integrated into the assessments. For HOLAS 3 this was possible only for a small number of species in one Baltic Sea subdivision (Bornholm Group).
Table 2: Species groups of waterbirds as defined by ICES (2015).
| Species group | Typical feeding behaviour | Typical food types | Additional guidance |
|---|---|---|---|
| Wading feeders | Walk/wade in shallow waters | Invertebrates (molluscs, polychaetes, etc.) | |
| Surface feeders | Feed within the surface layer (within 1–2 m of the surface) | Small fish, zooplankton and other invertebrates | “Surface layer” defined in relation to normal diving depth of plunge-divers (except gannets) |
| Pelagic feeders | Feed at a broad depth range in the water column | Pelagic and demersal fish and invertebrates (e.g. squid, zooplankton) | Include only spp. that usually dive by actively swimming underwater; but including gannets. Includes species feeding on benthic fish (e.g. flatfish). |
| Benthic feeders | Feed on the seafloor | Invertebrates (e.g. molluscs, echinoderms) | |
| Grazing feeders | Grazing in intertidal areas and in shallow waters | Plants (e.g. eelgrass, saltmarsh plants), algae | Geese, swans and dabbling ducks, coot |
4 Results and discussion
4.1 Status evaluation
Abundance – whole Baltic Sea scale
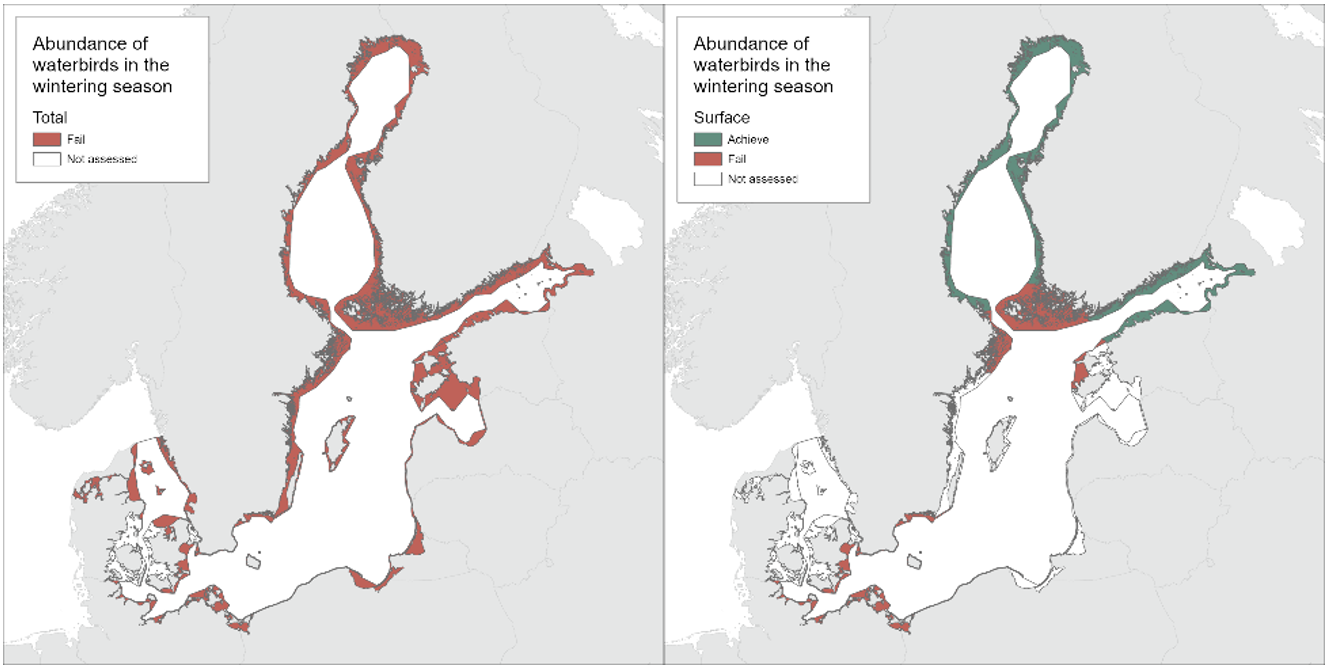
The abundance of wintering waterbirds in the entire Baltic Sea did not achieve good status in the assessment period 2016-2021, because the result shows that only 69% of the species’ abundance deviated less than 30% from the baseline, the threshold value for good status is 75% of species.
The evaluation is based on monitoring data of 29 species, which are collected in the frame of the International Waterbird Census (IWC) as well as boat surveys in parts of Polish and Finnish waters (Table 3).
Nine out of the 29 species assessed (31%) did not meet the threshold value in the assessment period 2016-2021, of which six are benthic feeding ducks. These nine species’ index values deviated more than 30% downwards from the baseline value, i.e. from the average index value in the ten-year reference period 1991-2000 (Table 3). The other 20 species that were assessed (i.e. 69%) indicate good status, as the species’ index values deviated less than 30% from the baseline value.
In some species, the average index value for the assessment period exceeded the reference value by more than 30%. While still representing good status, the very high results for common gull, smew, great crested grebe, Slavonian grebe, the two diver species, great cormorant, the two scoter species, Eurasian teal and northern pintail can indicate imbalance in the environment (including climate change).
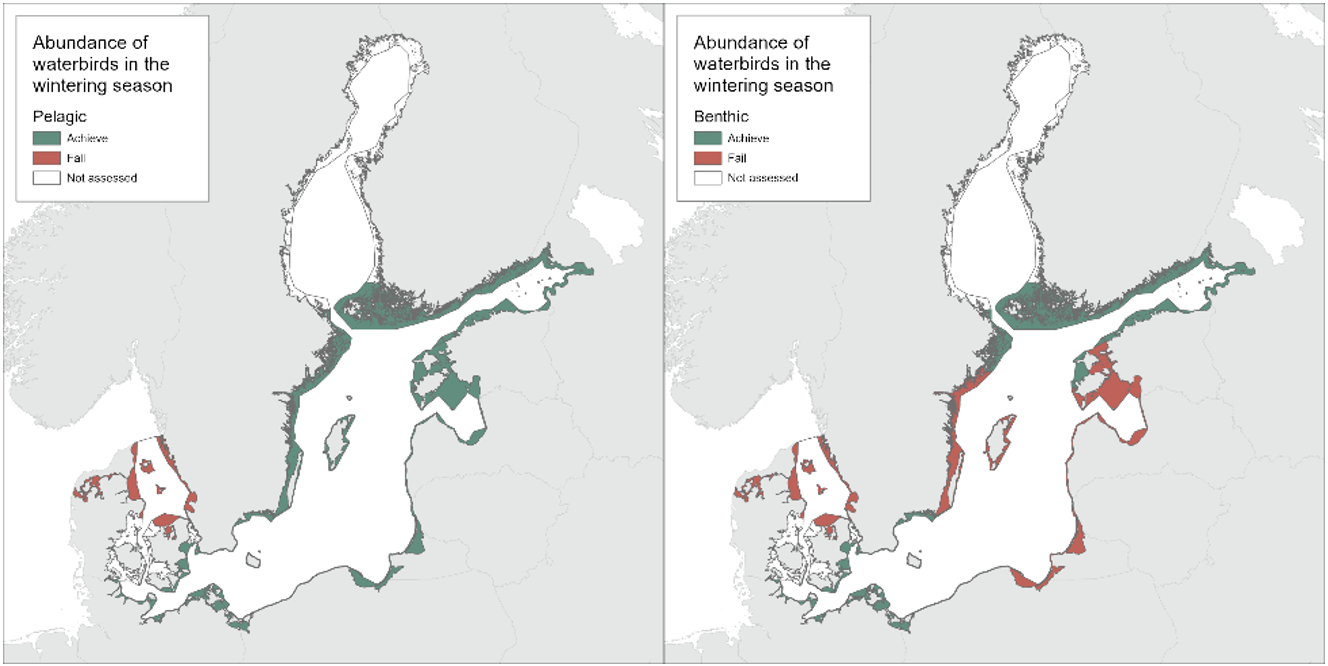
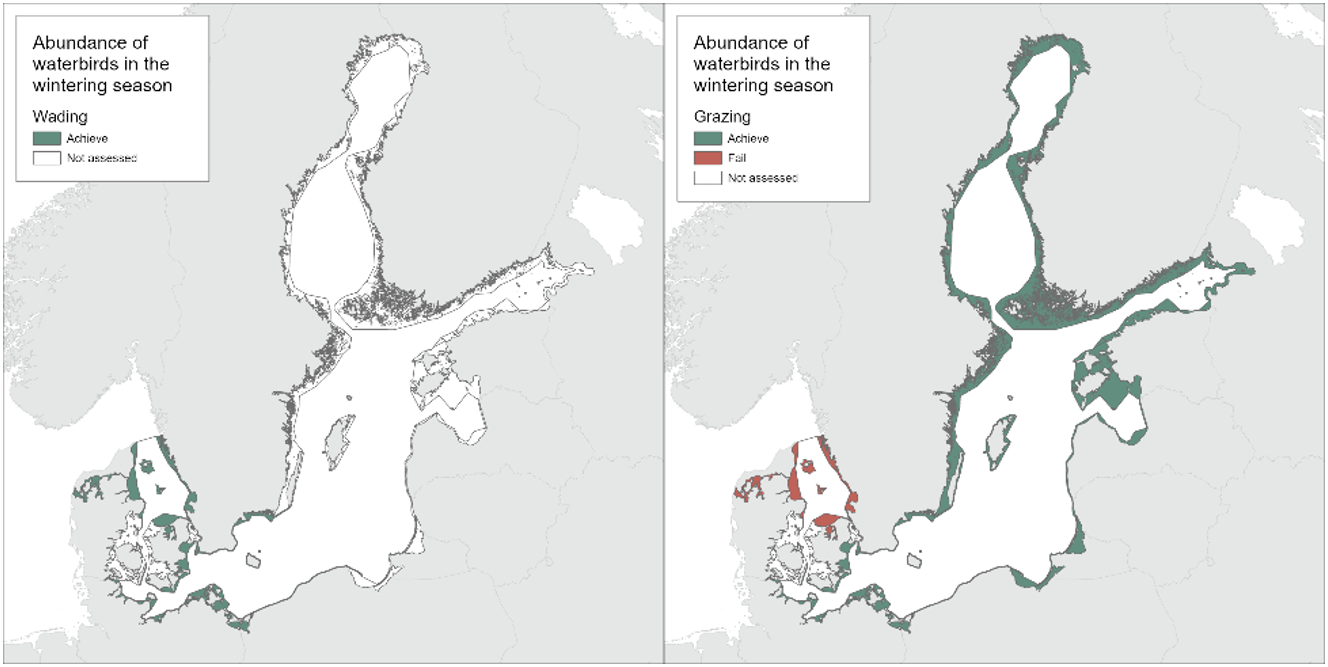
Regarding species groups, the evaluation results are not consistent. Species groups indicating good status, i.e. at least 75% of species deviate less than 30% from the baseline are:
- pelagic feeders: 9 out of 9 species (100%) indicate good status,
- wading feeders: 1 out of 1 species (100%) indicates good status.
Species groups that did not achieve the threshold value:
- surface feeders: 2 out of 3 species (67%) indicate good status,
- benthic feeders: 3 out of 9 species (33%) indicate good status,
- grazing feeders: 5 out of 7 species (71%) indicate good status.
Detailed results per species are provided (Table 3).
In addition to index values, Tables 3 and 4 show trends calculated for the entire period 1991-2021 as supporting information to interpret the status evaluation results for the assessment period 2016-2021. Despite being in good status, five species showed significant declines over the 30-year period. Out of the nine species in poor status, only two species have a stable population size (herring gull, Bewick’s swan) and some others the trend is uncertain (long-tailed duck, slope suggests decline), with all the others declining, most strongly the Steller’s eider. Altogether, in the 29 species assessed there are seven with positive trend and 11 with negative trend, the other are stable or uncertain.
Out of the 29 species assessed, nine are classified as vulnerable, endangered or critically endangered on the HELCOM Red List (HELCOM 2013). Only three of them are currently in poor status (and two of them declining), while six are in good status (two declining, two stable, two increasing; see Table 5). Apart from red-breasted merganser and Steller’s eider, all red-listed species are predominantly wintering offshore, therefore their trends need to be dealt with cautiously, for example when discussing their red list status.
It is important to consider that the results are biased towards the status of waterbirds along the coastlines (except for some Polish and Finish offshore counts included). Some species are included with a minor part of their population, because the majority is wintering offshore, too far off the coast to be reached by land-based surveys. Three species of alcids (razorbill, common guillemot, black guillemot) could not be assessed at all. In addition, from land-based survey data no models could be estimated for black-headed gull (except for the subdivision Åland Group), lesser black-backed gull and little gull.
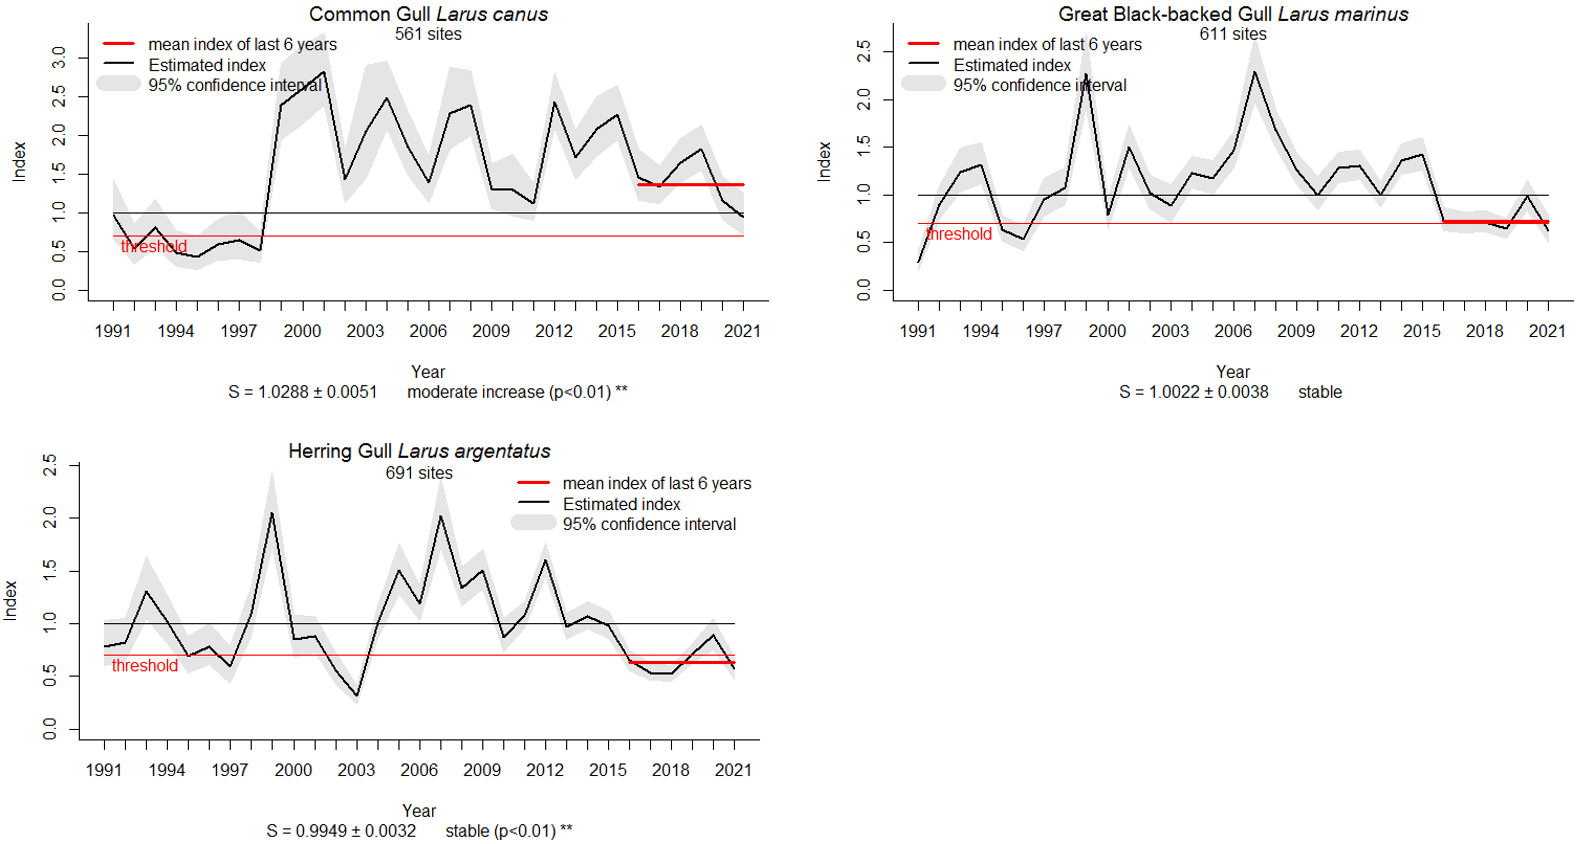
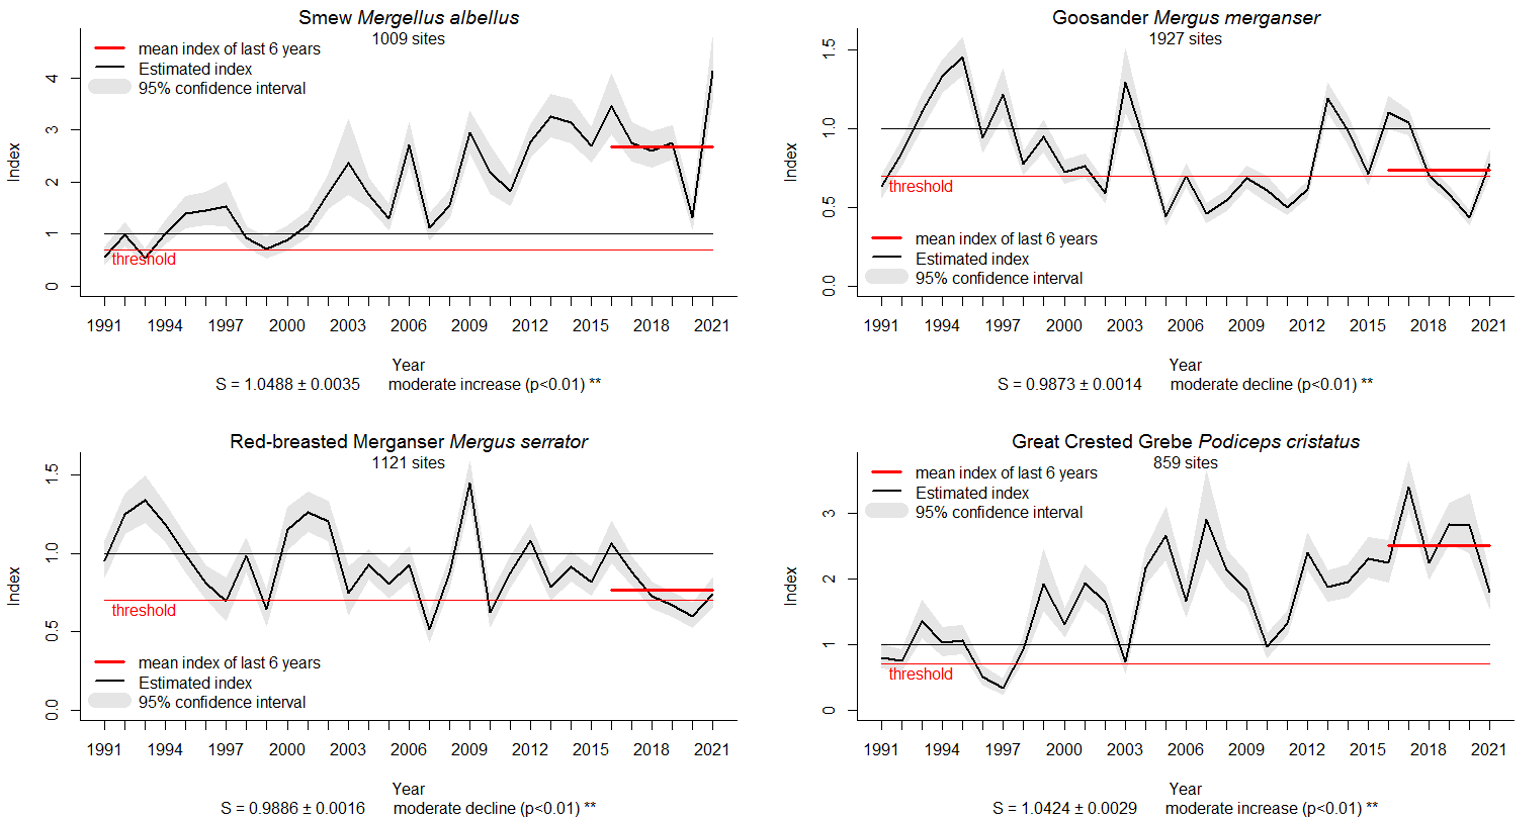
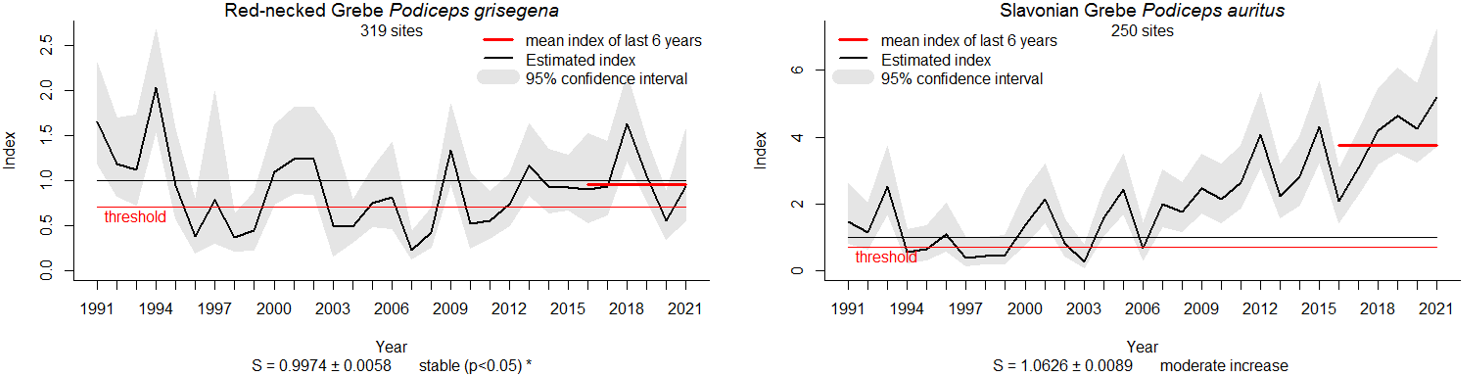
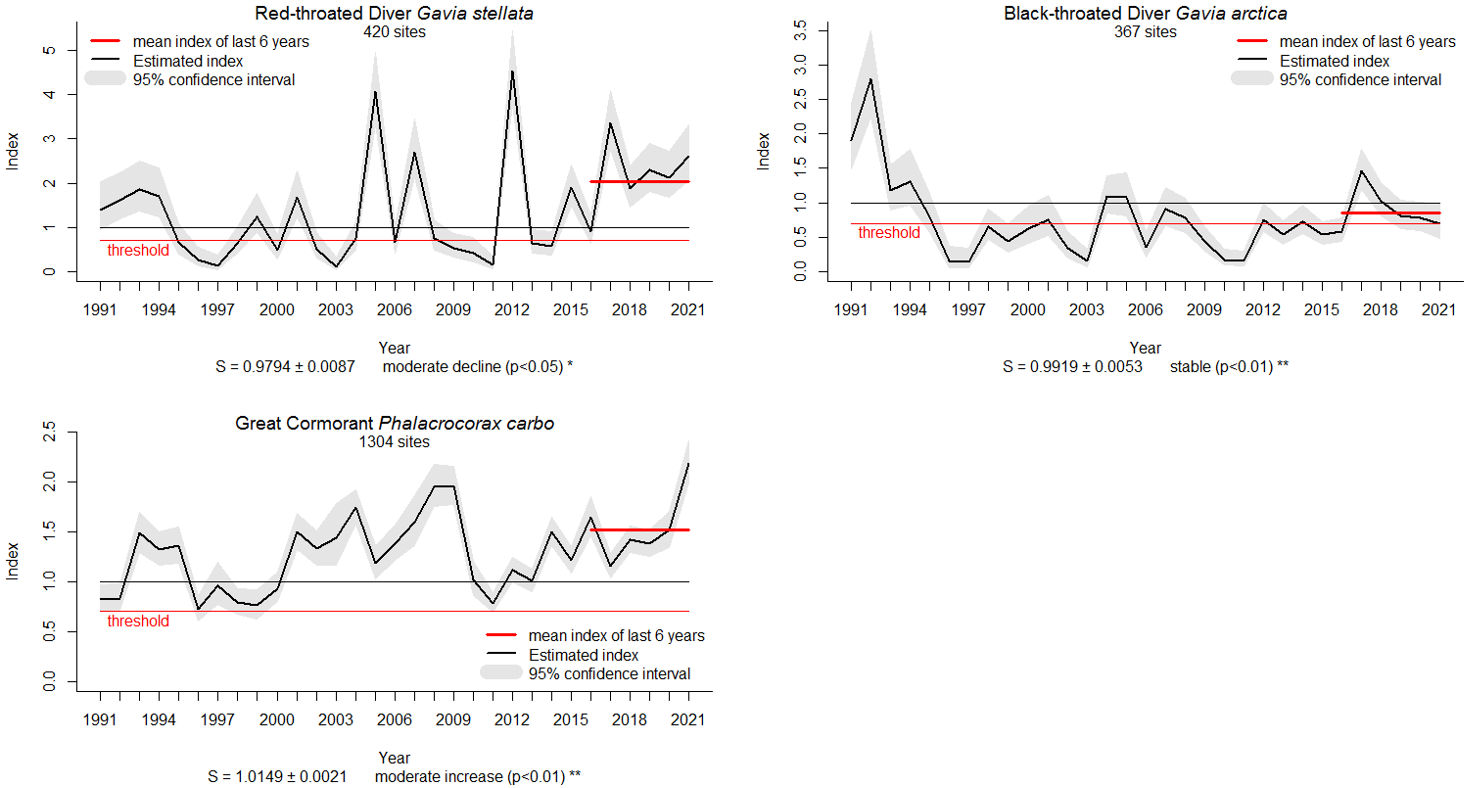
Graphs showing index values and trends are provided in Figure 3.
Table 3. Evaluation of the status of wintering waterbirds in the entire Baltic Sea for the period 2016-2021. Index values (single years and mean) are scaled to the average of the reference period (1991-2000, index value set to 1). Good status is shown by green colour, if the threshold level of 0.7 (0.8 in species laying only one egg per year) is met by the geometric mean 2016-2021. If the index value exceeds 1.3 indicating a large abundance increase the status is still considered good but indicated in orange. Red colour means that the species is not in good status. Significant trends for the period 1991-2021 are shown as ↑↑ (strong increase), ↑ (moderate increase), → (stable), ↓ (moderate decline) and ↓↓ (strong decline) (for details see Table 4). In species marked (wt) the GAM was calculated without temperature as a covariate.
| index values | |||||||||||
| group | species | number of sites | 2016 | 2017 | 2018 | 2019 | 2020 | 2021 | mean 2016-2021 | good status? | trend 1991-2021 |
| surface feeders | common gull | 561 | 1.458 | 1.344 | 1.655 | 1.826 | 1.163 | 0.950 | 1.368 | yes | ↑ |
| great black-backed gull | 611 | 0.735 | 0.700 | 0.715 | 0.640 | 0.982 | 0.627 | 0.725 | yes | → | |
| herring gull | 691 | 0.650 | 0.538 | 0.523 | 0.711 | 0.893 | 0.571 | 0.636 | no | → | |
| pelagic feeders | smew | 1009 | 3.453 | 2.752 | 2.604 | 2.745 | 1.321 | 4.139 | 2.681 | yes | ↑ |
| goosander | 1927 | 1.101 | 1.037 | 0.703 | 0.584 | 0.433 | 0.776 | 0.735 | yes | ↓ | |
| red-breasted merganser | 1121 | 1.063 | 0.884 | 0.728 | 0.672 | 0.599 | 0.742 | 0.768 | yes | ↓ | |
| great crested grebe | 859 | 2.252 | 3.411 | 2.249 | 2.831 | 2.821 | 1.806 | 2.509 | yes | ↑ | |
| red-necked grebe | 319 | 0.895 | 0.935 | 1.632 | 1.057 | 0.549 | 0.931 | 0.951 | yes | → | |
| Slavonian grebe (wt) | 250 | 2.079 | 3.083 | 4.181 | 4.643 | 4.264 | 5.178 | 3.742 | yes | ? | |
| red-throated diver (wt) | 420 | 0.901 | 3.371 | 1.872 | 2.292 | 2.133 | 2.616 | 2.043 | yes | ↓ | |
| black-throated diver (wt) | 367 | 0.581 | 1.459 | 1.020 | 0.809 | 0.776 | 0.692 | 0.849 | yes | → | |
| great cormorant | 1304 | 1.644 | 1.155 | 1.421 | 1.383 | 1.517 | 2.189 | 1.521 | yes | ↑ | |
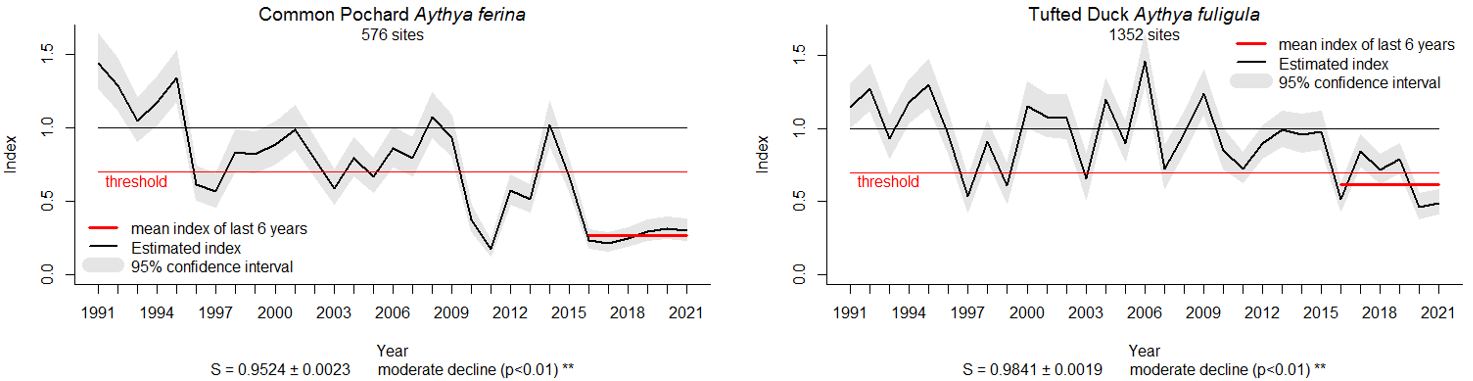
| benthic feeders | common pochard (wt) | 576 | 0.235 | 0.213 | 0.247 | 0.293 | 0.311 | 0.297 | 0.263 | no | ↓ |
| tufted duck | 1352 | 0.518 | 0.844 | 0.718 | 0.789 | 0.461 | 0.491 | 0.619 | no | ↓ | |
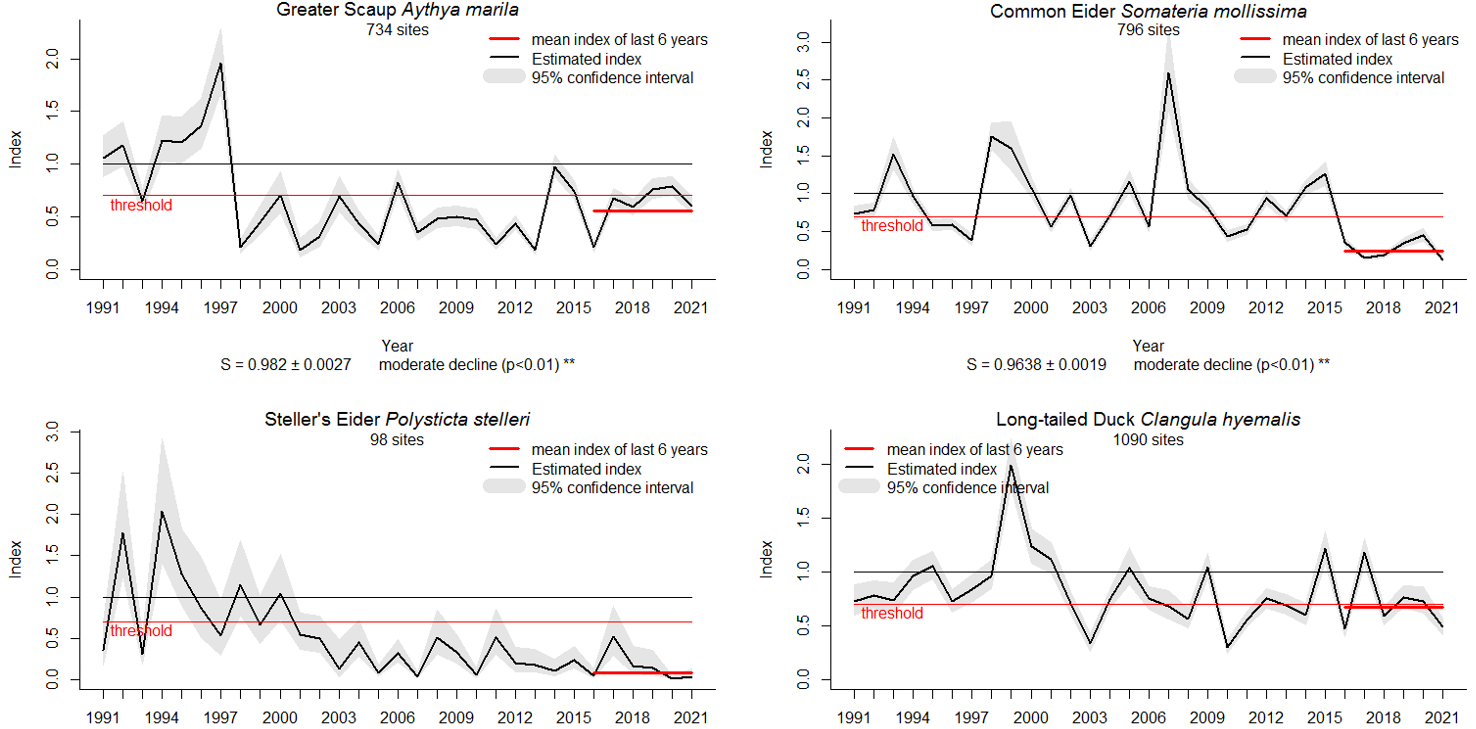
| greater scaup (wt) | 734 | 0.209 | 0.681 | 0.590 | 0.764 | 0.786 | 0.604 | 0.559 | no | ↓ | |
| common eider | 796 | 0.361 | 0.150 | 0.186 | 0.349 | 0.448 | 0.131 | 0.243 | no | ↓ | |
| Steller’s eider | 98 | 0.046 | 0.514 | 0.167 | 0.145 | 0.015 | 0.031 | 0.080 | no | ↓↓ | |
| long-tailed duck | 1090 | 0.470 | 1.176 | 0.586 | 0.766 | 0.728 | 0.485 | 0.666 | no | ? | |
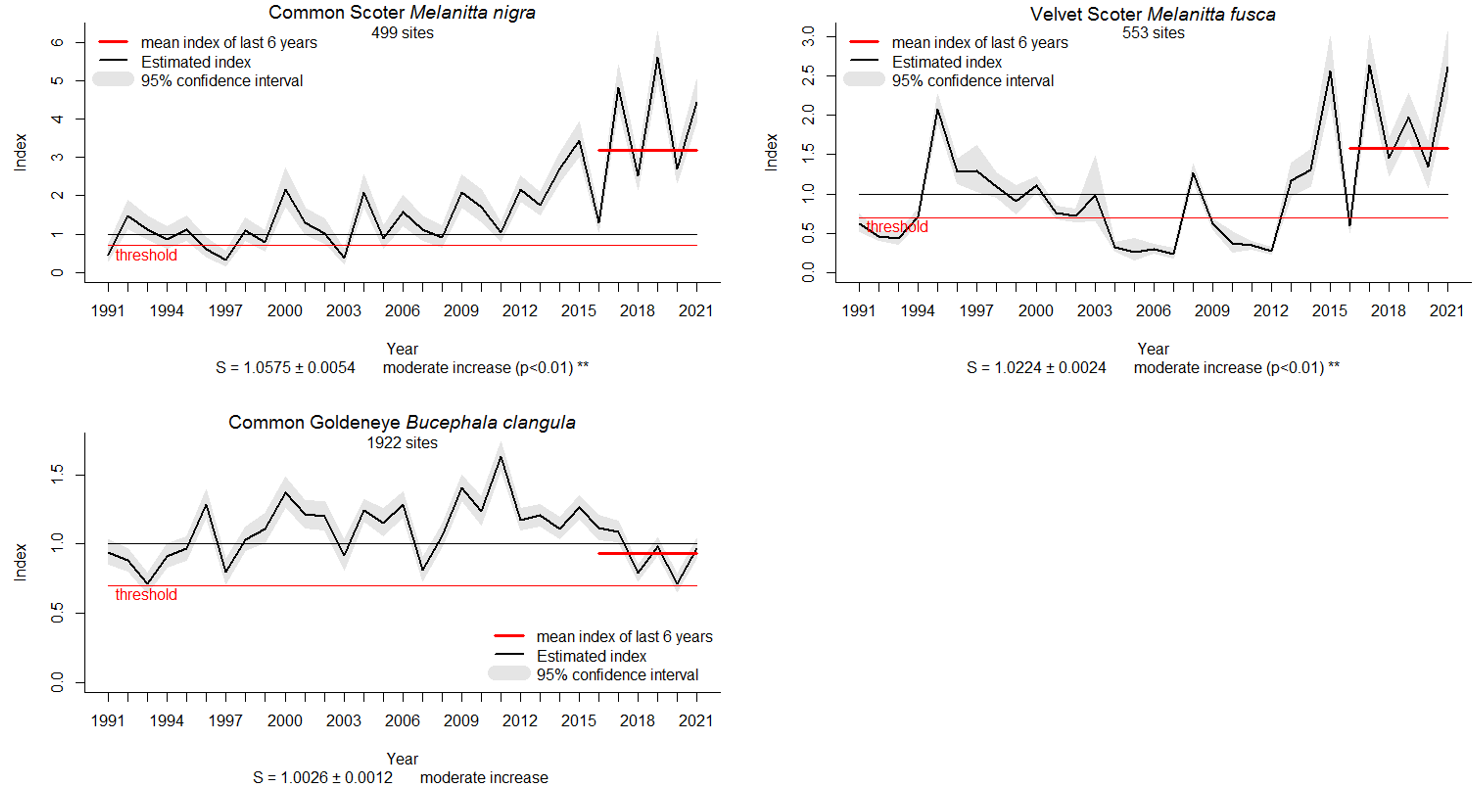
| common scoter (wt) | 499 | 1.291 | 4.818 | 2.513 | 5.620 | 2.712 | 4.441 | 3.192 | yes | ↑ | |
| velvet scoter | 553 | 0.595 | 2.641 | 1.451 | 1.983 | 1.338 | 2.614 | 1.584 | yes | ↑ | |
| common goldeneye | 1922 | 1.117 | 1.088 | 0.787 | 0.979 | 0.713 | 0.964 | 0.929 | yes | ? | |
| wading f. | Eurasian teal | 468 | 0.453 | 0.813 | 1.564 | 2.294 | 5.295 | 1.710 | 1.513 | yes | ? |
| grazing feeders | mute swan | 1960 | 0.901 | 0.807 | 0.608 | 0.846 | 0.596 | 0.803 | 0.751 | yes | ↓ |
| whooper swan | 1115 | 1.031 | 0.570 | 1.028 | 0.756 | 0.964 | 0.878 | 0.853 | yes | → | |
| Bewick’s swan (wt) | 111 | 0.814 | 0.702 | 0.609 | 0.358 | 0.618 | 0.477 | 0.577 | no | → | |
| Eurasian wigeon | 512 | 0.692 | 0.738 | 1.131 | 1.594 | 1.767 | 1.779 | 1.194 | yes | ↑ | |
| mallard | 1793 | 0.765 | 0.744 | 0.845 | 0.888 | 0.755 | 0.897 | 0.813 | yes | ↓ | |
| northern pintail | 249 | 0.426 | 1.329 | 1.133 | 1.747 | 3.125 | 2.455 | 1.431 | yes | → | |
| Eurasian coot (wt) | 805 | 0.437 | 0.231 | 0.232 | 0.353 | 0.413 | 0.402 | 0.333 | no | ↓ | |
Table 4. Trends observed in wintering waterbirds in the Baltic 1991-2021. Trend slopes and standard errors result from GAM analyses. In species marked (wt) the GAM was calculated without temperature as a covariate.
| group | species | number of sites | trend slope | S.E. | status |
| surface feeders | common gull | 561 | 1.0288 | 0.0051 | moderate increase |
| great black-backed gull | 611 | 1.0022 | 0.0038 | stable | |
| herring gull | 691 | 0.9949 | 0.0032 | stable | |
| pelagic feeders | smew | 1009 | 1.0488 | 0.0035 | moderate increase |
| goosander | 1927 | 0.9873 | 0.0014 | moderate decline | |
| red-breasted merganser | 1121 | 0.9886 | 0.0016 | moderate decline | |
| great crested grebe | 859 | 1.0424 | 0.0029 | moderate increase | |
| red-necked grebe | 319 | 0.9974 | 0.0058 | stable | |
| Slavonian grebe (wt) | 250 | 1.0626 | 0.0089 | uncertain | |
| red-throated diver (wt) | 420 | 0.9794 | 0.0087 | moderate decline | |
| black-throated diver (wt) | 367 | 0.9919 | 0.0053 | stable | |
| great cormorant | 1304 | 1.0149 | 0.0021 | moderate increase | |
| benthic feeders | common pochard (wt) | 576 | 0.9524 | 0.0023 | moderate decline |
| tufted duck | 1352 | 0.9841 | 0.0019 | moderate decline | |
| greater scaup (wt) | 734 | 0.9820 | 0.0027 | moderate decline | |
| common eider | 796 | 0.9638 | 0.0019 | moderate decline | |
| Steller’s eider | 98 | 0.8909 | 0.0107 | steep decline | |
| long-tailed duck | 1090 | 0.9877 | 0.0023 | uncertain | |
| common scoter (wt) | 499 | 1.0575 | 0.0054 | moderate increase | |
| velvet scoter | 553 | 1.0224 | 0.0024 | moderate increase | |
| common goldeneye | 1922 | 1.0026 | 0.0012 | uncertain | |
| wading f. | Eurasian teal | 468 | 1.0226 | 0.0078 | uncertain |
| grazing feeders | mute swan | 1960 | 0.9896 | 0.0010 | moderate decline |
| whooper swan | 1115 | 1.0021 | 0.0021 | stable | |
| Bewick’s swan (wt) | 111 | 0.9906 | 0.0169 | stable | |
| Eurasian wigeon | 512 | 1.0201 | 0.0033 | moderate increase | |
| mallard | 1793 | 0.9933 | 0.0011 | moderate decline | |
| northern pintail | 249 | 1.0045 | 0.0079 | stable | |
| Eurasian coot (wt) | 805 | 0.9582 | 0.0015 | moderate decline |
Table 5. Summary results for waterbirds included as vulnerable (VU), endangered (EN) or critically endangered (CR) on the HELCOM Red List for wintering birds (HELCOM 2013). Index values, status, trend slopes and trends as in Tables 3 and 4. GES: Good Environmental Status achieved; sub-GES: Good Environmental Status not achieved.
| Species | Red List status | Index 2016-2021 | Status | Trend slope | Trend |
| red-breasted merganser | VU | 0.768 | GES | 0.9886 | moderate decline |
| red-necked grebe | EN | 0.951 | GES | 0.9974 | stable |
| red-throated diver | CR | 2.043 | GES | 0.9794 | moderate decline |
| black-throated diver | CR | 0.849 | GES | 0.9919 | stable |
| common eider | EN | 0.243 | sub-GES | 0.9638 | moderate decline |
| Steller’s eider | EN | 0.080 | sub-GES | 0.8909 | steep decline |
| long-tailed duck | EN | 0.666 | sub-GES | 0.9877 | uncertain |
| common scoter | EN | 3.192 | GES | 1.0575 | moderate increase |
| velvet scoter | EN | 1.584 | GES | 1.0224 | moderate increase |
Surface feeders
Pelagic feeders
Benthic feeders
Wading feeders
Grazing feeders
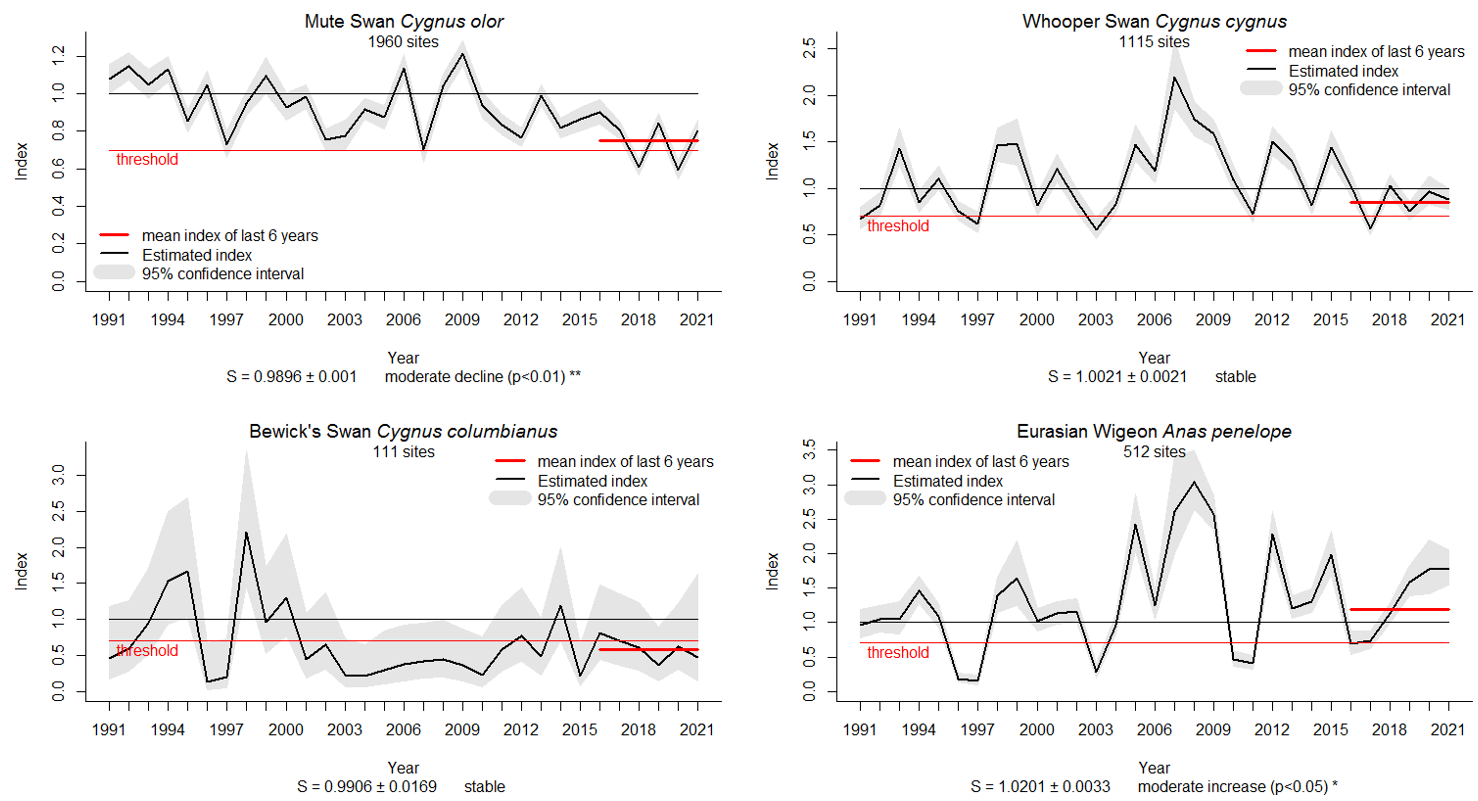
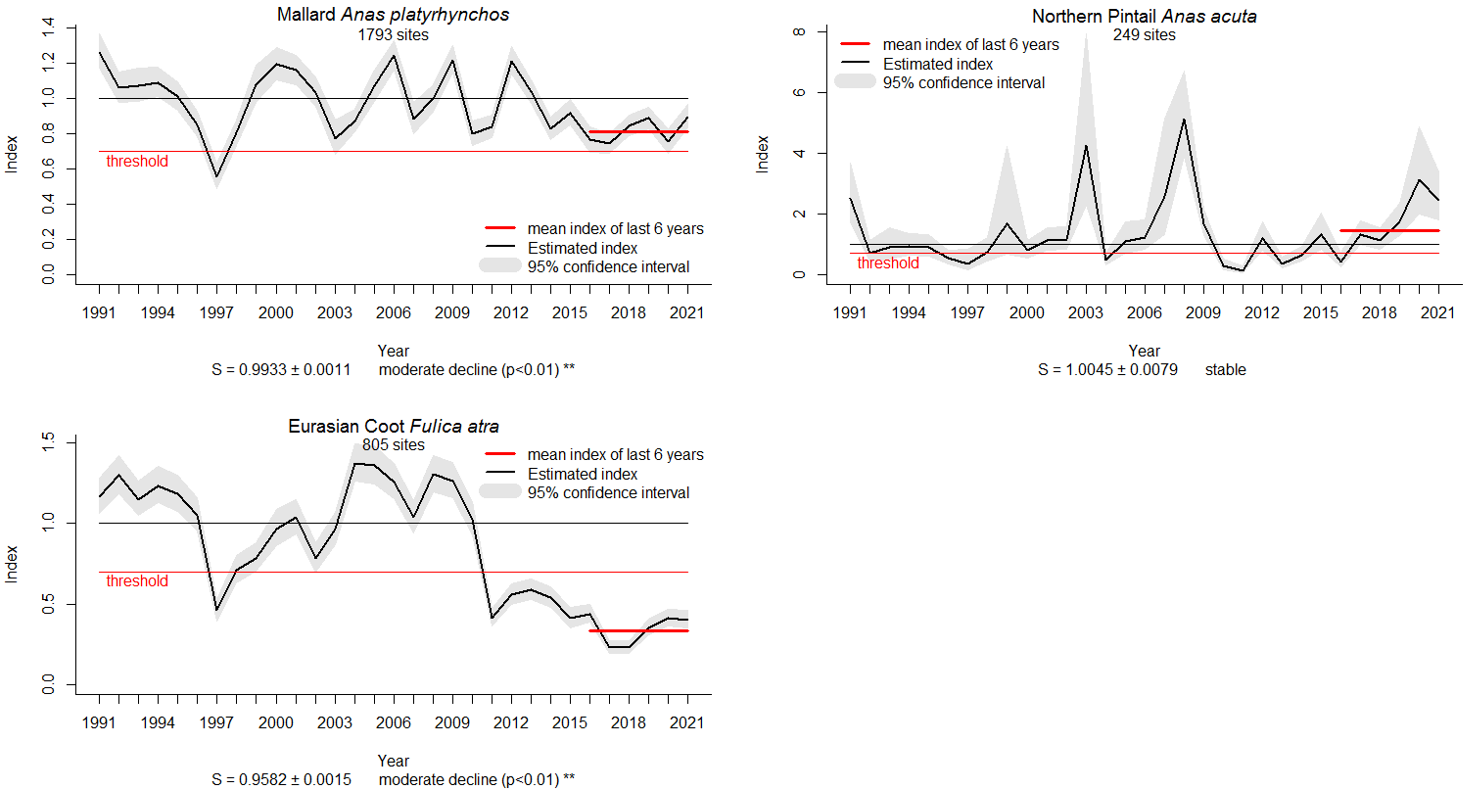
Figure 3. Index graphs showing annual index values for wintering waterbirds in the entire Baltic Sea (black line) and 95% confidence intervals (grey shading) resulting from GAM analyses with reference level where average of index values 1991-2000 is 1 (thin black line). Further shown are thresholds for good status (70% of baseline, 80% of baseline in species laying only one egg per year, thin red line) and the average index values 2016-2021 (geometric mean) used for the evaluation (red line). In addition, trend slopes and s.e. as well as the status of the species are given below the graphs. Models for Slavonian grebe, red-throated diver, black-throated diver, common pochard, greater scaup, common scoter, Bewick’s swan and Eurasian coot do not include temperature as a covariate.
Abundance – Baltic Sea sub-divisions
The status evaluation for wintering waterbirds was also applied at the scale of subdivisions of the Baltic Sea. The subdivisions are based on aggregations of subbasins (HELCOM assessment unit level 2, see Chapter 9.1). Owing to the distribution pattern of the individual waterbird species, the number of species assessed per subdivision is smaller than for the entire Baltic Sea. The analyses followed the same protocol as for the entire Baltic Sea. No evaluation was possible for the subdivision Belt Group, because no data were available from Denmark, which constitutes most of this subdivision.
Kattegat
In the period 2016-2021, only 3 out of 11 (27%) wintering waterbird species assessed in the Kattegat represented a good status, thus the indicator overall failed to achieve the threshold value (Table 6). This result also applies to most functional groups. While surface feeders were not assessed due to lacking data and wading feeders with the Eurasian teal as the only species achieved a good status, the threshold of 75% of species in good status was not reached by pelagic feeders (50%, 2 species), benthic feeders (25%, 4 species) and grazing feeders (0%, 4 species). These results have low confidence, because data for HOLAS 3 were only supplied by Sweden, which accounts for about half of the Kattegat coastline.
Table 6. Evaluation of the status of wintering waterbirds in the Kattegat for the period 2016-2021. Index values (single years and mean) are scaled to the average of the reference period (1991-2000, index value set to 1). For explanation see Table 3.
| index values | |||||||||||
| group | species | number of sites | 2016 | 2017 | 2018 | 2019 | 2020 | 2021 | mean 2016-2021 | good status? | trend 1991-2021 |
| pel. feeders | red-breasted merganser | 150 | 4.330 | 0.938 | 1.107 | 0.371 | 0.429 | 1.775 | 1.041 | yes | → |
| great cormorant (wt) | 169 | 0.753 | 0.711 | 0.733 | 0.462 | 0.548 | 1.124 | 0.694 | no | ↓ | |
| benthic feeders | tufted duck | 68 | 0.121 | 0.009 | 0.005 | 0.022 | 0.034 | 0.010 | 0.019 | no | ↓↓ |
| common eider (wt) | 169 | 1.234 | 0.455 | 0.725 | 0.936 | 0.673 | 0.575 | 0.727 | yes | → | |
| long-tailed duck (wt) | 51 | 0.380 | 4.123 | 1.006 | 0.381 | 0.144 | 1.108 | 0.676 | no | ↓ | |
| common goldeneye | 157 | 0.812 | 0.483 | 0.421 | 0.236 | 0.274 | 0.391 | 0.401 | no | ↓ | |
| wading f. | Eurasian teal (wt) | 45 | 2.393 | 1.263 | 2.316 | 1.479 | 1.358 | 1.471 | 1.657 | yes | ? |
| grazing feeders | mute swan | 163 | 1.309 | 0.217 | 0.165 | 0.230 | 0.107 | 0.266 | 0.260 | no | ↓ |
| whooper swan | 75 | 0.371 | 0.129 | 0.103 | 0.162 | 0.086 | 0.098 | 0.137 | no | ↓ | |
| Eurasian wigeon | 52 | 0.087 | 0.256 | 0.164 | 0.481 | 1.988 | 0.067 | 0.248 | no | ↓ | |
| mallard | 155 | 0.650 | 0.393 | 0.249 | 0.295 | 0.431 | 0.257 | 0.357 | no | ↓ | |
All species not in good status showed a negative trend, most strongly so the tufted duck. Seven species from three functional groups declined, with the tufted duck declining steeply. Two species in good status (red-breasted merganser, common eider) showed stable population sizes, while the trend is unclear in the Eurasian teal (see details in Table 7). The trends of individual species are depicted in Figure 4 (see Annex 1).
Table 7. Trends observed in wintering waterbirds in the Kattegat 1991-2021. Trend slopes and standard errors result from GAM analyses. In species marked (wt) the GAM was calculated without temperature as a covariate.
| group | species | number of sites | trend slope | S.E. | trend |
| pel. feeders | red-breasted merganser | 150 | 1.0091 | 0.0051 | stable |
| great cormorant (wt) | 169 | 0.9863 | 0.0040 | moderate decline | |
| benthic feeders | tufted duck | 68 | 0.8774 | 0.0093 | steep decline |
| common eider (wt) | 169 | 0.9972 | 0.0057 | stable | |
| long-tailed duck (wt) | 51 | 0.9603 | 0.0128 | moderate decline | |
| common goldeneye | 157 | 0.9789 | 0.0038 | moderate decline | |
| wading f. | Eurasian teal (wt) | 45 | 1.0543 | 0.0297 | uncertain |
| grazing feeders | mute swan | 163 | 0.9567 | 0.0033 | moderate decline |
| whooper swan | 75 | 0.9399 | 0.0151 | moderate decline | |
| Eurasian wigeon | 52 | 0.9437 | 0.0186 | moderate decline | |
| mallard | 155 | 0.9714 | 0.0035 | moderate decline |
Bornholm Group
In the Bornholm Group (Kiel Bay, Bay of Mecklenburg, Arkona Basin, Bornholm Basin), waterbirds were assessed for two components: coastal waterbirds by the help of land-based IWC surveys and waterbirds from the offshore areas surveyed from ships and low flying aircrafts.
Along the coastlines, the waterbirds in total (20 out of 26 species, 77%) achieved good status. Surface feeders (poor status in the great-black-backed gull as the only species assessed) did not achieve the threshold, whereas the other species groups were in good status (Table 8). Ten species from four species groups deviated upwards from the baseline by more than 30%. The confidence in these results is somewhat limited because data are lacking from Denmark at the northern edge of this subdivision.
Table 8. Evaluation of the status of wintering waterbirds in the Bornholm Group for the period 2016-2021. Index values (single years and mean) are scaled to the average of the reference period (1991-2000, index value set to 1). For explanation see Table 3. An * indicates species where the status in this subdivision is assessed in combination with offshore survey data in Table 11.
| index values | |||||||||||
| group | species | number of sites | 2016 | 2017 | 2018 | 2019 | 2020 | 2021 | mean 2016-2021 | good status? | trend 1991-2021 |
| surf. f. | great black-backed gull | 177 | 0.437 | 0.391 | 0.461 | 0.545 | 1.254 | 0.456 | 0.539 | no | → |
| pelagic feeders | smew | 308 | 2.444 | 2.836 | 2.727 | 1.841 | 0.408 | 3.871 | 1.950 | yes | ↑ |
| goosander | 373 | 1.117 | 0.982 | 0.750 | 0.435 | 0.253 | 0.667 | 0.627 | no | ↓ | |
| red-breasted merganser | 298 | 1.112 | 0.909 | 0.822 | 0.869 | 0.774 | 0.986 | 0.905 | yes | ↓ | |
| great crested grebe | 345 | 1.817 | 1.931 | 2.044 | 1.266 | 1.256 | 1.747 | 1.646 | yes | ↑ | |
| red-necked grebe | 140 | 1.261 | 1.019 | 1.324 | 0.550 | 0.248 | 1.794 | 0.864 | yes | ↑ | |
| Slavonian grebe (wt) | 128 | 1.091 | 2.398 | 3.645 | 1.684 | 3.127 | 6.318 | 2.611 | yes | ↑ | |
| red-throated diver (wt) | 123 | 2.508 | 6.611 | 2.285 | 2.398 | 3.940 | 3.228 | 3.240 | yes | → | |
| black-throated diver (wt) | 113 | 0.480 | 1.423 | 0.627 | 0.380 | 0.471 | 0.336 | 0.543 | no | → | |
| great cormorant | 380 | 1.650 | 1.199 | 1.622 | 1.452 | 3.245 | 2.115 | 1.781 | yes | ↑ | |
| benthic feeders | common pochard (wt) | 286 | 0.256 | 0.424 | 0.539 | 0.442 | 0.774 | 0.849 | 0.507 | no | ↓ |
| tufted duck | 361 | 0.406 | 0.989 | 1.133 | 1.047 | 0.633 | 0.469 | 0.722 | yes | → | |
| greater scaup (wt) | 279 | 0.195 | 0.768 | 1.366 | 2.271 | 1.359 | 0.797 | 0.892 | yes | → | |
| common eider | 229 | 0.982 | 0.853 | 0.860 | 0.628 | 0.452 | 0.976 | 0.764 | yes | ↓ | |
| long-tailed duck | 250 | 0.396 | 0.676 | 0.480 | 0.795 | 0.788 | 0.710 | 0.621 | no* | ↓ | |
| common scoter | 150 | 0.629 | 2.242 | 1.310 | 3.787 | 2.326 | 1.954 | 1.780 | yes | → | |
| velvet scoter | 121 | 0.351 | 1.195 | 0.672 | 0.857 | 0.844 | 0.745 | 0.730 | yes | → | |
| common goldeneye | 387 | 1.459 | 0.981 | 0.765 | 0.826 | 0.663 | 0.920 | 0.906 | yes | → | |
| wading f. | Eurasian teal | 191 | 0.395 | 1.104 | 2.058 | 3.298 | 9.268 | 2.452 | 2.017 | yes | ↑ |
| grazing feeders | mute swan (wt) | 383 | 1.265 | 1.259 | 1.230 | 1.231 | 1.247 | 1.563 | 1.294 | yes | ↑ |
| whooper swan (wt) | 265 | 1.205 | 1.335 | 1.690 | 1.195 | 0.968 | 2.064 | 1.366 | yes | ↑ | |
| Bewick’s swan (wt) | 71 | 1.168 | 0.959 | 0.331 | 0.524 | 0.704 | 0.515 | 0.643 | no | ↓ | |
| Eurasian wigeon (wt) | 216 | 1.158 | 1.837 | 3.129 | 3.067 | 3.034 | 5.126 | 2.612 | yes | ↑ | |
| mallard | 386 | 0.947 | 0.896 | 1.010 | 1.135 | 0.751 | 1.226 | 0.982 | yes | → | |
| northern pintail | 125 | 1.730 | 5.609 | 4.254 | 2.861 | 2.750 | 13.450 | 4.043 | yes | → | |
| Eurasian coot | 333 | 1.110 | 1.127 | 0.952 | 1.288 | 1.146 | 1.626 | 1.191 | yes | → | |
The six species in poor status either declined over the period 1991-2021 or showed a stable population size. Out of the 20 species in good status, only two showed negative trends (red-breasted merganser, common eider) (Tables 8 and 9) according to the coastal surveys. The trends of individual species are depicted in Figure 5 (see Annex 1).
Table 9. Trends observed in wintering waterbirds in the Bornholm Group 1991-2021. Trend slopes and standard errors result from GAM analyses. In species marked (wt) the GAM was calculated without temperature as a covariate.
| group | species | number of sites | trend slope | S.E. | trend |
| surf. f. | great black-backed gull | 177 | 1.0064 | 0.0074 | stable |
| pelagic feeders | smew | 308 | 1.0397 | 0.0059 | moderate increase |
| goosander | 373 | 0.9840 | 0.0026 | moderate decline | |
| red-breasted merganser | 298 | 0.9927 | 0.0026 | moderate decline | |
| great crested grebe | 345 | 1.0156 | 0.0032 | moderate increase | |
| red-necked grebe | 140 | 1.0555 | 0.0206 | moderate increase | |
| Slavonian grebe (wt) | 128 | 1.0543 | 0.0104 | moderate increase | |
| red-throated diver (wt) | 123 | 1.0099 | 0.0164 | stable | |
| black-throated diver (wt) | 113 | 0.9826 | 0.0098 | stable | |
| great cormorant | 380 | 1.0235 | 0.0032 | moderate increase | |
| benthic feeders | common pochard (wt) | 286 | 0.9710 | 0.0037 | moderate decline |
| tufted duck | 361 | 0.9931 | 0.0043 | stable | |
| greater scaup (wt) | 279 | 0.9986 | 0.0047 | stable | |
| common eider | 229 | 0.9900 | 0.0032 | moderate decline | |
| long-tailed duck | 250 | 0.9708 | 0.0028 | moderate decline | |
| common scoter | 150 | 1.0178 | 0.0091 | stable | |
| velvet scoter | 121 | 0.9957 | 0.0165 | stable | |
| common goldeneye | 387 | 1.0001 | 0.0020 | stable | |
| wading f. | Eurasian teal | 191 | 1.0316 | 0.0119 | moderate increase |
| grazing feeders | mute swan (wt) | 383 | 1.0100 | 0.0018 | moderate increase |
| whooper swan (wt) | 265 | 1.0120 | 0.0031 | moderate increase | |
| Bewick’s swan (wt) | 71 | 0.9490 | 0.0246 | moderate decline | |
| Eurasian wigeon (wt) | 216 | 1.0460 | 0.0045 | moderate increase | |
| mallard | 386 | 1.0003 | 0.0024 | stable | |
| northern pintail | 125 | 1.0250 | 0.0146 | stable | |
| Eurasian coot | 333 | 1.0070 | 0.0038 | stable |
In the offshore parts of Bornholm Group, namely in the German section of the Baltic Sea, only one species, the long-tailed duck, was evaluated. Compared to the baseline abundance (1986-1997), the abundance in the assessment period (2016-2021) was only 32.1%, indicating poor status (Table 10; see Figure 6 for abundance values of individual years). In other species, the confidence was too low to integrate the results into this indicator evaluation (see Chapter 8.1).
Table 10. Waterbird numbers in the offshore parts of the German section of the Baltic Sea during the baseline period (1986-1997) and in the assessment period (2016-2021) in winter (December to February). As in the results from coastal surveys, the index value reflects the proportion of birds in the assessment period compared to the baseline period.
| Species | 1986-1997 | 2016-2021 | Index | Status | ||
| number of birds | 95% C.I. | number of birds | 95% C.I. | |||
| long-tailed duck | 1,532,179 | 1,207,534 – 1,854,830 | 491,957 | 432,428 – 560,449 | 0.321 | sub-GES |
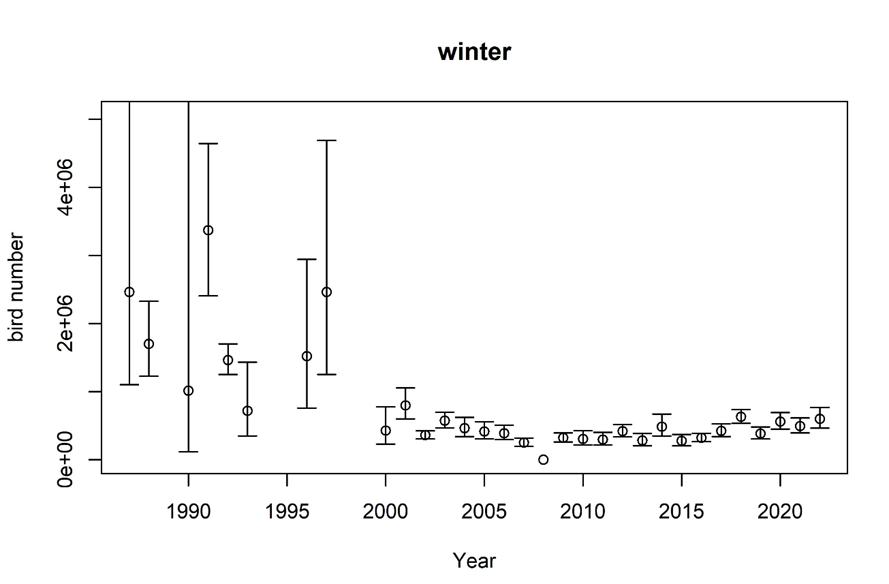
Figure 6. Annual abundance estimates and 95% confidence intervals for the long-tailed duck in the German section of the Baltic Sea (Bornholm Group).
If a species was assessed both for coastal and offshore parts of the subdivision, the results were combined applying a weighted average, based on estimated parts of the species living in the coastal and offshore areas. The long-tailed duck did not achieve the threshold for good status in both coastal and offshore areas (for details see Table 11). The result that benthic feeders achieved good status was not changed by the inclusion of the offshore evaluation of the long-tailed duck.
Table 11. Status assessment of waterbirds assessed for both coastal and offshore parts of the Bornholm Group subdivision. The respective index values are combined by a weighted average (weighting factors given as estimated proportions of the populations living at the coast and offshore, N. Markones unpubl., see also Chapter 9.2).
| Species | Proportion of population at | Index coast | Index offshore | Index (weighted average) | Status | |
| coast | offshore | |||||
| long-tailed duck | 0.10 | 0.90 | 0.621 | 0.321 | 0.351 | sub-GES |
Gotland Group
In the Gotland Group (Gdansk Basin, Eastern Gotland Basin, Western Gotland Basin, Gulf of Riga), 15 out of 18 species (83%) were in good status in the period 2016-2021, meaning that the indicator passed. The same holds true for two of the three functional groups assessed, as all surface feeders (7 species) and all grazing feeders (4 species) met the threshold level (Table 12). In contrast, benthic feeders missed the threshold with only four out of seven species (57%) in good status.
Table 12. Evaluation of the status of wintering waterbirds in the Gotland Group for the period 2016-2021. Index values (single years and mean) are scaled to the average of the reference period (1991-2000, index value set to 1). For explanation see Table 3.
| index values | |||||||||||
| group | species | number of sites | 2016 | 2017 | 2018 | 2019 | 2020 | 2021 | mean 2016-2021 | good status? | trend 1991-2021 |
| pelagic feeders | smew | 407 | 6.011 | 3.829 | 3.324 | 4.098 | 1.727 | 6.650 | 3.915 | yes | ↑↑ |
| goosander | 739 | 1.456 | 1.464 | 0.738 | 0.680 | 0.309 | 1.042 | 0.837 | yes | ↓ | |
| red-breasted merganser (wt) | 432 | 0.637 | 1.275 | 0.954 | 1.057 | 1.142 | 1.174 | 1.015 | yes | → | |
| great crested grebe | 274 | 0.544 | 1.093 | 0.813 | 1.977 | 3.226 | 0.773 | 1.156 | yes | ↑ | |
| red-necked grebe | 102 | 0.113 | 0.522 | 2.219 | 2.337 | 2.367 | 0.562 | 0.861 | yes | ↑ | |
| red-throated diver | 153 | 0.694 | 2.664 | 1.076 | 1.745 | 4.872 | 3.980 | 2.017 | yes | → | |
| great cormorant | 474 | 3.366 | 2.257 | 2.440 | 3.295 | 2.423 | 5.185 | 3.026 | yes | ↑ | |
| benthic feeders | common pochard (wt) | 176 | 0.463 | 1.309 | 1.200 | 2.493 | 0.910 | 0.853 | 1.059 | yes | → |
| tufted duck (wt) | 517 | 0.993 | 1.693 | 1.234 | 1.754 | 1.062 | 0.990 | 1.251 | yes | ↑ | |
| greater scaup | 261 | 0.206 | 0.996 | 0.591 | 0.646 | 1.932 | 0.758 | 0.697 | no | → | |
| common eider | 241 | 0.147 | 0.202 | 0.100 | 0.046 | 0.067 | 0.201 | 0.111 | no | ↓↓ | |
| long-tailed duck | 497 | 0.136 | 0.493 | 0.155 | 0.383 | 0.427 | 0.192 | 0.263 | no | ↓ | |
| common scoter | 142 | 1.105 | 3.579 | 0.623 | 0.826 | 0.240 | 3.117 | 1.072 | yes | ↑↑ | |
| common goldeneye (wt) | 720 | 1.543 | 1.658 | 1.182 | 1.740 | 1.222 | 1.542 | 1.466 | yes | ↑ | |
| grazing feeders | mute swan | 768 | 1.807 | 1.883 | 1.312 | 1.824 | 1.255 | 1.936 | 1.645 | yes | ↑ |
| whooper swan | 344 | 1.014 | 1.492 | 4.228 | 1.899 | 4.956 | 3.510 | 2.441 | yes | ↑ | |
| mallard (wt) | 660 | 1.044 | 1.618 | 2.105 | 2.021 | 1.709 | 2.153 | 1.726 | yes | ↑ | |
| Eurasian coot (wt) | 253 | 0.674 | 0.759 | 0.920 | 1.389 | 1.727 | 1.816 | 1.127 | yes | ↑ | |
With the exception of goosander, all species in good status showed increasing or stable trends (Table 13). Strong increases were observed in smew and common scoter, although the latter result refers to only a small fraction of the population (as most are ranging offshore). Among the three species in poor status the common eider declined strongly. Trends for all species are depicted in Figure 7 (see Annex 1).
Table 13. Trends observed in wintering waterbirds in the Gotland Group 1991-2021. Trend slopes and standard errors result from GAM analyses. In species marked (wt) the GAM was calculated without temperature as a covariate.
| group | species | number of sites | trend slope | S.E. | trend |
| pelagic feeders | smew | 407 | 1.0684 | 0.0074 | strong increase |
| goosander | 739 | 0.9904 | 0.0027 | moderate decline | |
| red-breasted merganser (wt) | 432 | 1.0050 | 0.0043 | stable | |
| great crested grebe | 274 | 1.0167 | 0.0055 | moderate increase | |
| red-necked grebe | 102 | 1.0825 | 0.0334 | moderate increase | |
| red-throated diver | 153 | 1.0253 | 0.0220 | stable | |
| great cormorant | 474 | 1.0528 | 0.0070 | moderate increase | |
| benthic feeders | common pochard (wt) | 176 | 0.9944 | 0.0076 | stable |
| tufted duck (wt) | 517 | 1.0091 | 0.0039 | moderate increase | |
| greater scaup | 261 | 1.0192 | 0.0126 | stable | |
| common eider | 241 | 0.9213 | 0.0079 | steep decline | |
| long-tailed duck | 497 | 0.9487 | 0.0037 | moderate decline | |
| common scoter | 142 | 1.1163 | 0.0307 | strong increase | |
| common goldeneye (wt) | 720 | 1.0197 | 0.0030 | moderate increase | |
| grazing feeders | mute swan | 768 | 1.0175 | 0.0029 | moderate increase |
| whooper swan | 344 | 1.0414 | 0.0069 | moderate increase | |
| mallard (wt) | 660 | 1.0225 | 0.0029 | moderate increase | |
| Eurasian coot (wt) | 253 | 1.0227 | 0.0073 | moderate increase |
Åland Group
In the Aland Group (Northern Baltic Proper, Aland Sea), wintering waterbirds did not achieve good status, because with 14 out of 19 species (74%) the threshold was narrowly missed (Table 14). However, the surface feeders were the only species group not in good status (2 out of 4 species in poor status, 50%). The indicator threshold value was achieved by pelagic feeders (100%, 3 species), benthic feeders (75%, 8 species) and grazing feeders (75%, 4 species).
Table 14. Evaluation of the status of wintering waterbirds in the Åland Group for the period 2016-2021. Index values (single years and mean) are scaled to the average of the reference period (1991-2000, index value set to 1). For explanation see Table 3.
| index values | |||||||||||
| group | species | number of sites | 2016 | 2017 | 2018 | 2019 | 2020 | 2021 | mean 2016-2021 | good status? | trend 1991-2021 |
| surface feeders | black-headed gull (wt) | 57 | 2.381 | 2.089 | 1.962 | 2.826 | 2.413 | 1.079 | 2.039 | yes | ↑ |
| common gull | 113 | 0.255 | 1.489 | 2.244 | 3.014 | 2.189 | 0.070 | 0.857 | yes | → | |
| great black-backed gull | 124 | 0.171 | 0.634 | 0.586 | 0.552 | 1.297 | 0.243 | 0.472 | no | → | |
| herring gull | 138 | 0.055 | 0.279 | 0.339 | 0.477 | 0.351 | 0.033 | 0.175 | no | ↓↓ | |
| pelagic feeders | goosander | 325 | 1.054 | 1.562 | 1.417 | 1.360 | 0.894 | 1.894 | 1.324 | yes | ↑ |
| red-breasted merganser | 84 | 0.218 | 2.497 | 1.763 | 1.409 | 4.427 | 0.146 | 0.977 | yes | → | |
| great cormorant (wt) | 136 | 0.827 | 1.198 | 1.066 | 0.668 | 1.217 | 2.096 | 1.103 | yes | ? | |
| benthic feeders | tufted duck | 230 | 14.03 | 6.147 | 4.750 | 2.897 | 2.836 | 14.324 | 6.033 | yes | ↑↑ |
| greater scaup (wt) | 64 | 1.645 | 28.378 | 3.842 | 2.735 | 15.87 | 2.297 | 5.114 | yes | ? | |
| common eider (wt) | 74 | 0.074 | 0.018 | 0.057 | 0.012 | 0.021 | 0.040 | 0.030 | no | ↓↓ | |
| Steller’s eider | 33 | 0.011 | 0.230 | 0.058 | 0.096 | 0.443 | 0.007 | 0.059 | no | ? | |
| long-tailed duck | 171 | 0.832 | 2.608 | 1.268 | 1.049 | 1.758 | 0.358 | 1.104 | yes | → | |
| common scoter (wt) | 59 | 1.761 | 6.401 | 5.251 | 3.798 | 5.574 | 4.635 | 4.240 | yes | ↑ | |
| velvet scoter (wt) | 75 | 0.966 | 2.898 | 1.031 | 0.557 | 0.839 | 2.143 | 1.194 | yes | ? | |
| common goldeneye (wt) | 294 | 4.009 | 3.404 | 2.488 | 2.041 | 1.597 | 2.905 | 2.618 | yes | ↑ | |
| grazing feeders | mute swan | 324 | 1.069 | 1.664 | 0.890 | 1.729 | 1.640 | 1.211 | 1.326 | yes | ↑ |
| whooper swan (wt) | 177 | 6.523 | 2.693 | 6.480 | 4.047 | 5.588 | 10.027 | 5.436 | yes | ↑↑ | |
| mallard | 276 | 2.876 | 1.260 | 1.596 | 1.738 | 0.920 | 2.545 | 1.693 | yes | ↑ | |
| Eurasian coot | 76 | 4.364 | 0.471 | 1.037 | 0.463 | 0.001 | 5.120 | 0.433 | no | ↑ | |
Out of the five species in poor status, one increased (Eurasian coot), but two declined strongly (herring gull, common eider). In contrast, strong increases were observed in tufted duck and whooper swan (Table 15). None of the species in good status showed a decline. The trends of individual species are depicted in Figure 8 (see Annex 1).
Table 15. Trends observed in wintering waterbirds in the Aland Group 1991-2021. Trend slopes and standard errors result from GAM analyses. In species marked (wt) the GAM was calculated without temperature as a covariate.
| group | species | number of sites | trend slope | S.E. | trend |
| surface feeders | black-headed gull (wt) | 57 | 1.0846 | 0.0349 | moderate increase |
| common gull | 113 | 1.0040 | 0.0147 | stable | |
| great black-backed gull | 124 | 0.9922 | 0.0085 | stable | |
| herring gull | 138 | 0.9241 | 0.0077 | steep decline | |
| pelagic feeders | goosander | 325 | 1.0123 | 0.0039 | moderate increase |
| red-breasted merganser | 84 | 1.0174 | 0.0111 | stable | |
| great cormorant (wt) | 136 | 1.0569 | 0.0303 | uncertain | |
| benthic feeders | tufted duck | 230 | 1.1154 | 0.0178 | strong increase |
| greater scaup (wt) | 64 | 1.0116 | 0.0417 | uncertain | |
| common eider (wt) | 74 | 0.8642 | 0.0159 | steep decline | |
| Steller’s eider | 33 | 0.9733 | 0.0457 | uncertain | |
| long-tailed duck | 171 | 1.0027 | 0.0077 | stable | |
| common scoter (wt) | 59 | 1.0983 | 0.0423 | moderate increase | |
| velvet scoter (wt) | 75 | 1.0210 | 0.0338 | uncertain | |
| common goldeneye (wt) | 294 | 1.0627 | 0.0100 | moderate increase | |
| grazing feeders | mute swan | 324 | 1.0133 | 0.0042 | moderate increase |
| whooper swan (wt) | 177 | 1.0808 | 0.0081 | strong increase | |
| mallard | 276 | 1.0238 | 0.0044 | moderate increase | |
| Eurasian coot | 76 | 1.0748 | 0.0282 | moderate increase |
Gulf of Finland
All the 10 species assessed were in good status, therefore good status also applies to wintering waterbirds in general as well as for the four functional groups involved (Table 16). It should be noted that no less than nine species had index values above 1.3. No species showed a decreasing trend, and the strongest increase happened in the great cormorant (Table 17). For trends of all individual species see Figure 9 (see Annex 1).
Table 16. Evaluation of the status of wintering waterbirds in the Gulf of Finland for the period 2016-2021. Index values (single years and mean) are scaled to the average of the reference period (1991-2000, index value set to 1). For explanation see Table 3.
| index values | |||||||||||
| group | species | number of sites | 2016 | 2017 | 2018 | 2019 | 2020 | 2021 | mean 2016-2021 | good status? | trend 1991-2021 |
| surf. f. | common gull (wt) | 118 | 1.155 | 1.669 | 1.537 | 1.416 | 0.917 | 2.168 | 1.424 | yes | → |
| great black-backed gull | 121 | 0.245 | 1.359 | 0.809 | 0.522 | 1.546 | 0.655 | 0.723 | yes | → | |
| herring gull (wt) | 147 | 1.605 | 1.220 | 1.511 | 1.804 | 1.357 | 3.130 | 1.682 | yes | ↑ | |
| pel. f. | goosander (wt) | 129 | 3.055 | 4.300 | 2.013 | 1.476 | 2.284 | 2.554 | 2.471 | yes | ↑ |
| red-breasted merganser (wt) | 62 | 0.712 | 6.771 | 2.228 | 1.391 | 1.918 | 3.929 | 2.197 | yes | → | |
| great cormorant | 65 | 0.114 | 7.476 | 3.443 | 3.295 | 11.243 | 0.755 | 2.083 | yes | ↑↑ | |
| benth. f. | long-tailed duck (wt) | 78 | 2.117 | 1.558 | 1.245 | 1.746 | 1.622 | 2.562 | 1.761 | yes | → |
| common goldeneye (wt) | 114 | 2.110 | 1.655 | 0.906 | 0.933 | 1.256 | 2.917 | 1.487 | yes | ↑ | |
| graz. f. | mute swan (wt) | 113 | 2.117 | 1.558 | 1.245 | 1.746 | 1.622 | 2.562 | 1.761 | yes | ↑ |
| whooper swan (wt) | 99 | 4.189 | 1.046 | 2.469 | 1.226 | 2.369 | 2.897 | 2.121 | yes | ↑ | |
Table 17. Trends observed in wintering waterbirds in the Gulf of Finland 1991-2021. Trend slopes and standard errors result from GAM analyses. In species marked (wt) the GAM was calculated without temperature as a covariate.
| group | species | number of sites | trend slope | S.E. | trend |
| surf. f. | common gull (wt) | 118 | 1,0105 | 0,0110 | stable |
| great black-backed gull | 121 | 0,9931 | 0,0072 | stable | |
| herring gull (wt) | 147 | 1,0284 | 0,0092 | moderate increase | |
| pel. f. | goosander (wt) | 129 | 1,0334 | 0,0062 | moderate increase |
| red-breasted merganser (wt) | 62 | 1,0339 | 0,0255 | stable | |
| great cormorant | 65 | 1,1301 | 0,0333 | strong increase | |
| benth. f. | long-tailed duck (wt) | 78 | 1,0322 | 0,0209 | stable |
| common goldeneye (wt) | 114 | 1,0287 | 0,0115 | moderate increase | |
| graz. f. | mute swan (wt) | 113 | 1,0242 | 0,0052 | moderate increase |
| whooper swan (wt) | 99 | 1,0399 | 0,0173 | moderate increase |
Bothnian Group
In the Bothnian Group, which includes the Bothnian Sea, The Quark and the Bothnian Bay, only four wintering waterbird species belonging to two functional groups could be assessed (Table 18). All species were in good status, and both functional groups (surface and grazing feeders) gave the same result (100% of species in good status, two species each). A positive trend was observed in mute swan, stability was seen in great black-backed gull and mallard (trend of herring gull uncertain, Table 19). The trends of individual species are depicted in Figure 10 (see Annex 1).
Table 18. Evaluation of the status of wintering waterbirds in the Bothnian Group for the period 2016-2021. Index values (single years and mean) are scaled to the average of the reference period (1991-2000, index value set to 1). For explanation see Table 3.
| index values | |||||||||||
| group | species | number of sites | 2016 | 2017 | 2018 | 2019 | 2020 | 2021 | mean 2016-2021 | good status? | trend 1991-2021 |
| surf. f. | great black-backed gull (wt) | 54 | 0.879 | 0.754 | 1.078 | 0.770 | 0.577 | NA | 0.849 | yes | → |
| herring gull | 82 | 7.719 | 0.774 | 0.691 | 0.932 | 0.448 | NA | 1.172 | yes | ? | |
| graz. f. | mute swan (wt) | 157 | 2.501 | 2.120 | 3.178 | 4.152 | 6.024 | 7.597 | 3.839 | yes | ↑ |
| mallard | 125 | 0.855 | 1.051 | 0.751 | 0.808 | 1.870 | 2.083 | 1.134 | yes | → | |
Table 19. Trends observed in wintering waterbirds in the Bothnian Group 1991-2021. Trend slopes and standard errors result from GAM analyses. In species marked (wt) the GAM was calculated without temperature as a covariate.
| group | species | number of sites | trend slope | S.E. | trend |
| surf. f. | great black-backed gull (wt) | 54 | 1.0037 | 0.0115 | stable |
| herring gull | 82 | 0.9966 | 0.0246 | uncertain | |
| graz. f. | mute swan (wt) | 157 | 1.0866 | 0.0321 | moderate increase |
| mallard | 125 | 1.0051 | 0.0095 | stable |
4.2 Trends
The abundance of wintering waterbirds was assessed using the same methods and assessment units in HOLAS II and HOLAS 3, but the composition of the species groups slightly changed. For one or the other species assessed for HOLAS II no model could be calculated. Further, in contrast to HOLAS II, also species ranging mostly offshore and present close to the coast (where captured by land-based surveys) were included, and their low representativeness was acknowledged for by allocating low confidence levels to the respective evaluations. Nevertheless, it appears appropriate to compare the status assessments from the periods 2011-2016 (HOLAS II) and 2016-2021 (HOLAS 3).
On the level of the entire Baltic Sea, the percentage of species in good status decreased from 82% (22 species) to 69% (29 species) from HOLAS II to HOLAS 3, so the overall status changed from good to poor. However, there were a few changes of species’ status: From 21 species assessed in both periods 14 remained in good status and four kept their poor status (common pochard, Steller’s eider, Bewick’s swan, Eurasian coot). For three species the status was deteriorated (herring gull, tufted duck, greater scaup), but no species was observed to improve its status.
At the level of the entire Baltic Sea, four species groups remained in the same status, which was good for pelagic feeders and wading feeders, but poor for benthic feeders and grazing feeders – surface feeders switched from good to poor status (Table 20). At the level of subdivisions, 17 out of 22 subdivision/species group combinations with evaluations in both periods retained the same status (4 remained poor, 13 remained good). In two cases, the status deteriorated from good to poor: surface feeders in the Bornholm Group and benthic feeders in the Gotland Group. Improvement from poor to good status was observed three times: grazing feeders and benthic feeders in the Gulf of Finland as well as pelagic feeders in the Åland Group. Further details are available in Table 21 (see Annex 2).
Table 20. Status evaluations for abundance of waterbirds wintering in the Baltic Sea and its seven subdivisions in 2011-2016 (HOLAS II) and 2016-2021 (HOLAS 3): proportion of species in good status (number of species in brackets). Good status is shown by green colour, if at least 75% of the species are in good status. Red colour means that the species groups is not in good status. Note that no evaluation was available for the Belt Group in HOLAS 3.
| Surface feeders | Pelagic feeders | Benthic feeders | Wading feeders | Grazing feeders | ||||||
| Assessment unit | 2011-16 | 2016-21 | 2011-16 | 2016-21 | 2011-16 | 2016-21 | 2011-16 | 2016-21 | 2011-16 | 2016-21 |
| Baltic Sea | 100% (4) | 67% (3) | 100% (5) | 100% (9) | 60% (5) | 33% (9) | 100% (1) | 100% (1) | 71% (7) | 71% (7) |
| subdivisions | ||||||||||
| Kattegat | 60% (5) | 50% (2) | 25% (4) | 25% (4) | 100% (1) | 100% (1) | 33% (6) | 0% (4) | ||
| Belt Group | 60% (5) | 25% (4) | 0% (1) | 80% (5) | ||||||
| Bornholm Group | 100% (1) | 0% (1) | 100% (5) | 78% (9) | 75% (4) | 75% (8) | 100% (1) | 100% (1) | 86% (7) | 86% 87) |
| Gotland Group | 75% (4) | 100% (5) | 100% (7) | 75% (4) | 57% (7) | 75% (4) | 100% (4) | |||
| Åland Group | 33% (3) | 50% (4) | 50% (4) | 100% (3) | 75% (4) | 75% (8) | 100% (4) | 75% (4) | ||
| Gulf of Finland | 100% (3) | 100% (3) | 100% (2) | 100% (3) | 50% (2) | 100% (2) | 67% (3) | 100% (2) | ||
| Bothnian Group | 100% (2) | 100% (2) | 100% (1) | 100% (1) | 100% (1) | 100% (2) | ||||
4.3 Discussion text
Owing to the number of species and the six subdivisions considered, the results of the many species group evaluations are variable. Except for the wading feeders, which are represented by only one species in only two subdivisions, no species group showed a consistent result across all subdivisions, highlighting the importance of the assessment scale used: The conditions for wintering waterbirds are certainly not uniform all over the Baltic Sea. Relatively many species groups (and species) failed to achieve good status in the westernmost part of the Baltic (Kattegat, Bornholm Group), whereas in the central and eastern part an increased number achieving the threshold were observed. Though winter temperature was included in the majority of models in this analysis, effects of climate change with warmer winters were probably not completely removed and the results of this indicator appear to reflect the results of other studies that wintering of waterbirds in the Baltic Sea has partly shifted from the southwest to the northeast (Lehikoinen et al. 2013, Pavón-Jordán et al. 2019) for three duck species and underlines that the Baltic Sea (and especially its northeastern parts) are increasingly important for wintering waterbirds (Pavón-Jordán et al. 2020).
Even when looking at individual species, there is inconsistency in the results, indicating that conditions for given wintering waterbirds vary spatially. Finding reasons for the trends needs careful analysis, because waterbirds are affected by a number of pressures in their marine wintering habitats. Scoping possible threats for waterbirds, JWGBIRD experts identified mostly human activities having impact, as opposed to natural drivers. Most impact is thought to stem from direct and indirect effects of fishery activities (including bycatch in fishing gear), but a number of species are exposed to the extraction of minerals, offshore wind farms, shipping and hunting (see also Chapter 6). Prey availability is thought to be the main natural driver for the development of population sizes (ICES 2018). Given those many impact factors, the results of this indicator have to be interpreted carefully with respect to conclusions.
This also refers to the observation that a high number of wintering waterbirds does not automatically indicate a good status. For instance, piscivorous waterbird species benefit from a high availability of small fish (Olsson et al. 2019, Olin et al. 2022), which in turn may point to an imbalance in the food web due to overfishing of large fish species that results in high abundance of small fish. These competitive interactions between fish-feeding birds and large predatory fish affect the setting of a baseline and defining good status for instance with respect to the current long-term management plan of cod, since increased cod stocks would likely affect (negatively) the food availability for birds.
5 Confidence
The overall confidence of the wintering waterbirds abundance evaluation is estimated to be high, because an established methodology with an established threshold was used (earlier and current evaluations in HELCOM and OSPAR Regions). Further, the monitoring methods are in place for decades under the umbrella of the International Waterbird Census, and also offshore survey methods are well established for more than 40 years. The coverage includes the whole HOLAS 3 assessment period (2016-2021), most of the Baltic Sea coastal area and a large number of species. However, no IWC data were supplied for the years 2017-2021 from Denmark, Lithuania and Russia, these parts of the assessment units were set as missing in the analyses (data up to 2016 were used from the HOLAS II datacall).
The accuracy of the evaluation is high, because the results clearly show whether the threshold values for good status are met for species, species groups or all birds. Evaluations of individual species in the entire Baltic Sea and in the seven subdivisions vary regarding their confidence. Standard errors are given for the geometric mean of index values in the assessment period as well as for trend slopes.
On the level of species, confidence varies, because not all could be covered by monitoring in terms of their entire population. Especially waterbirds wintering offshore could not by surveyed well from the coastline (low spatial representability). Further, evaluations for species groups in subdivisions are often based on very few species, again reducing the level of confidence.
6 Drivers, Activities, and Pressures
The abundance of wintering waterbirds in the Baltic Sea is strongly influenced by a variety of human activities, with much impact generated by fishing, shipping and the use of wind energy at sea. Pressures include mortality caused by oil spills, incidental bycatch in fisheries, hunting as well as human-induced eutrophication affecting the food web structure and function. Functional groups of species can potentially reflect – in a more specific manner – which pressures are affecting the status.
Table 22. Brief summary of relevant pressures with relevance to the indicator.
| General | MSFD Annex III, Table 2a | |
| Strong link | The most important human threats to wintering waterbirds are by-catch in fishing gear contamination by hazardous substances, prey depletion and habitat loss. | Biological pressures:
Physical pressures:
Pressures by substances, litter and energy
|
| Weak link | Numbers of wintering waterbirds are additionally influenced by pressures acting primarily in the breeding season, e.g. predation by indigenous and non-indigenous mammals. | in addition to those mentioned above:
Biological pressures:
|
In general, waterbirds strongly respond to food availability. Therefore, human activities influencing the food supply of waterbirds are reflected in bird numbers. For fish-eating birds, direct human pressure is posed by the extraction of fish, while physical damage of the seafloor affects primarily benthic feeders. Indirect pressure is caused by eutrophication; in the oligotrophic end of the eutrophication status bird populations are limited by the availability of food sources, whereas towards eutrophic conditions plant and zoobenthos biomass increases, which first benefits seabird populations, but in the extreme end causes decreased food availability.
Among human pressures causing losses of individual waterbirds, drowning in fishing gear (mainly gill nets) is a serious problem. Estimates of the number of birds incidentally caught in fisheries are uncertain, but probably amount to 100,000-200,000 birds annually in the Baltic Sea and North Sea combined (Žydelis et al. 2009). In addition, high numbers of seaducks are hunted, with large quotas in particular for common eider and common goldeneye (Mooij 2005, Skov et al. 2011). Though the number of oil spills has decreased, oil pollution causing oiled plumage, hypothermia and finally death still affects waterbirds in the Baltic Sea (Larsson & Tydén 2005; Žydelis et al. 2006). Bird health is constrained also by the intake of contaminants (Broman et al. 1990; Rubarth et al. 2011; Pilarczyk et al. 2012).
Some waterbird species are prone to habitat loss caused by human activities, which perhaps reduce the carrying capacity of certain wintering sites. Avoidance of offshore wind farms has been observed to affect the spatial distribution of divers and long-tailed ducks (Petersen et al. 2011; Dierschke et al. 2016). These species, as well as other seaducks, also avoid shipping lanes (Bellebaum et al. 2006; Schwemmer et al. 2011, Fliessbach et al. 2019). For benthic feeders, additional habitat loss is caused by physical damage of the seafloor caused by both fisheries and aggregate extraction (Cook & Burton 2010).
It is important to note that all the above-mentioned human activities have a cumulative impact on waterbird populations, not only in the wintering season, but also carry over to the breeding season (e.g. affecting breeding success). On the other hand, waterbirds wintering in the Baltic can be influenced by pressures in the breeding areas and during migration (ICES 2017). The cumulative impact on waterbirds has been reviewed by the example of red-throated diver and black-throated diver (Dierschke et al. 2012) and was addressed in the frame of the proposed indicator which assesses waterbird habitat quality with regard to disturbance from activities (Mercker et al. 2021b). The results of this indicator also reflect the effects of different pressures on the abundance of wintering waterbirds.
7 Climate change and other factors
Climate change affects the environment in the Baltic Sea region in many ways (HELCOM & Baltic Earth 2021, Meier et al. 2022). Effects on waterbirds in the Baltic Sea are mainly seen in wintering birds. Part of the population of some species (mainly diving ducks) that formerly wintered further to the southwest now remain in the Baltic (Skov et al. 2011, Nilsson & Haas 2016, Pavón-Jordán et al. 2019). Consequently, the distance of migration is shorter and therefore less energy demanding (Lehikoinen et al., 2006, Gunnarsson et al. 2012). Climate change scenarios predict a strong temperature increase in the Arctic and sub-Arctic regions, which will likely increase the northward extension of species ranges, including colonization by new breeding and wintering species, as well as local species decline following redistribution of the population into northern ice-free waters the White, Barents and Kara seas (Pavón-Jordán et al., 2019; Fox et al., 2019).
In many waterbird species the phenology of spring migration has shifted forward, mainly owing to milder spring temperatures and related effects on vegetation and prey (Rainio et al., 2006), and hence arrive earlier in the breeding area (Vähätalo et al., 2004). This has also consequences for the timing of presence in the Baltic marine habitats.
Climate change also affects the prey of Baltic waterbirds. It is expected that salinity will decrease in the Baltic Sea (Meier et al. 2022), meaning that prey species (e.g., blue mussels for common eiders) would change distribution, body size and quality, with consequences for the distribution, reproduction and survival of the respective predatory waterbirds (Fox et al., 2015). Warmer seawater in winter increases the energy expenditure of mussels, thus directly reducing their quality as prey for eiders (Waldeck and Larsson, 2013).
Since effects of climate change are not uniform among Baltic Sea fish species, the consequences for piscivorous seabirds are complex. For example, expected increase of recruitment and abundance in an important prey species (sprat; (MacKenzie et al., 2012; Lindegren et al., 2012) as well as declining numbers of large predatory fish (cod) may provide support for fish-eating birds, although management efforts to improve cod stocks may counteract the expected increase in sprat and lead to population declines of their main bird predator, the common guillemot (Kadin et al., 2019). On the other hand, from the bird’s perspective another important prey species (herring) is negatively affected by decreasing salinity (declining energy content; Rajasilta et al., 2018).
For herbivorous waterbirds, a rising sea level would reduce the area of saltmarshes available for grazing (Clausen et al., 2013).
It is expected that climate change induced changes in the pattern of occurrence of diseases and parasites will affect waterbirds in the Baltic (Fox et al., 2015).
8 Conclusions
Compared to the assessment period of HOLAS II (2011-2016), the overall status of wintering waterbirds in the entire Baltic switched from good to poor, but relatively few changes in status were observed in the HOLAS 3 assessment (2016-2021) for both a total of 29 species and the five species groups, though one species group (surface feeders) fell from good into poor status. Confidence is generally high, but could be improved by better coverage of species wintering off the shore. Given the large number of species with very different ecological traits it is not straightforward to identify relevant pressures acting in the same way on all species in all parts of the Baltic Sea (see also Chapter 6). A major role is played by climate change, which is accounted for by using winter air temperature as a variable in the modelling of species trends.
8.1 Future work or improvements needed.
The indicator is in a state allowing evaluation of the status of wintering waterbirds in the entire Baltic based on population sizes. The evaluation of population sizes would gain from the establishment of species-specific reference periods, which would allow to compare recent population sizes with relevant baseline populations.
Optimal monitoring
Concerning coastal waterbirds, the land-based IWC already serves as a geographically wide spread monitoring system. It can continue as it is, but future surveys should take into account that the importance of Bothnian Bay and eastern Gulf of Finland may increase due to the predicted milder winters as a consequence of climate change.
It would be desirable to include offshore parts of the Baltic in the evaluation of wintering waterbird numbers, as has been shown for this indicator evaluation by the example of German waters in the subdivision Bornholm Group. Important components of the avian community concentrate in marine areas not covered by land-based surveys, i.e. divers, grebes, seaducks, gulls and alcids. Monitoring of offshore areas requires the use of ships and/or aircrafts as observation platforms for manned transect counts or the use of digital imagery. Currently, offshore monitoring has only been implemented in a few parts of the Baltic Sea, but the Joint OSPAR/HELCOM/ICES Working Group on Marine Birds has outlined a strategy for offshore monitoring in northern Europe including the whole HELCOM area and addressing questions of coordination, periods of surveys and methods applied (ICES 2017). This was brought forward in the guidelines for waterbird monitoring at sea.
International coordination is necessary in order to integrate national monitoring schemes into Baltic-wide surveys. Where reasonable, special programmes such as the visual observation of waterbird migration at exposed sites (Hario et al. 2009, Ellermaa & Lindén 2015) would add valuable information to support the explanatory power of the monitoring results. It has to be noted that so far only two data points for total numbers of waterbirds wintering in the Baltic are available (Durinck et al. 1994; Skov et al. 2011), with another one (based on a coordinated survey in early 2016) awaiting analysis.
Depending on weather conditions and other (e.g. dietary) reasons, the distribution of some species show variability between years, creating a need for simultaneous surveys in all parts of the Baltic Sea. Simultaneous surveys are possible and already carried out in the land-based IWC. Owing to high costs, there is no capacity for full-coverage surveys in the offshore parts of the Baltic Sea on a yearly basis. Instead, monitoring programmes should aim at carrying out these surveys at a lower frequency, e.g. once or twice within a six-year reporting cycle of the EU MSFD or Birds Directive. It is recommended to conduct coordinated surveys in the entire Baltic Sea at least every three years with additional surveys of sub-areas at a higher frequency to increase accuracy of indicator results. It is further proposed that digital methods for aerial surveys are further developed (ICES 2017). It is desirable that all Contracting Parties that collect offshore data make it available for the indicator.
In this evaluation, the short time available for processing made it impossible to try out the methods for assessing birds offshore in more than a few species in the German part of the Baltic Sea. Especially the elaboration of baseline values based on relatively old data was a challenge. Further work is needed to solve the problems encountered (especially the very wide confidence intervals in the baseline period).
9 Methodology
9.1 Scale of assessment
The assessment units are defined in the HELCOM Monitoring and Assessment Strategy Annex 4.
The evaluation was conducted at two spatial scales, the entire Baltic Sea (HELCOM assessment unit scale 1) and seven subdivisions of the Baltic Sea, which were defined as aggregations of up to four of the 17 sub-basins (HELCOM assessment unit scale 2) following recommendation by JWGBIRD (ICES 2017, 2018) (Figure 11). The use of an even finer scale does not make sense in view of the high mobility of waterbirds, i.e. movements during a given winter and distributional changes between winters, which may go across the borders of individual sub-basins. The use of the seven subdivisions will make it easier to localize problems and to implement necessary regional or local measures to improve the status. These smaller scale evaluations are better suited to reflect the conditions of a given part of the Baltic Sea rather than downscaling the results from the entire Baltic Sea to everywhere. Further, subdivision evaluations better serve the national reporting according to Article 8 of MSFD, because there is much less influence from other parts of the Baltic on the national evaluations. The seven subdivisions are preliminarily named as follows:
- A: Kattegat (Kattegat),
- B: Belt Group (Great Belt, The Sound),
- C: Bornholm Group (Kiel Bay, Bay of Mecklenburg, Arkona Basin, Bornholm Basin),
- D: Gotland Group (Gdansk Basin, Eastern Gotland Basin, Western Gotland Basin, Gulf of Riga),
- E: Åland Group (Northern Baltic Proper, Åland Sea),
- F: Gulf of Finland (Gulf of Finland),
- G: Bothnian Group (Bothnian Sea, The Quark, Bothnian Bay).
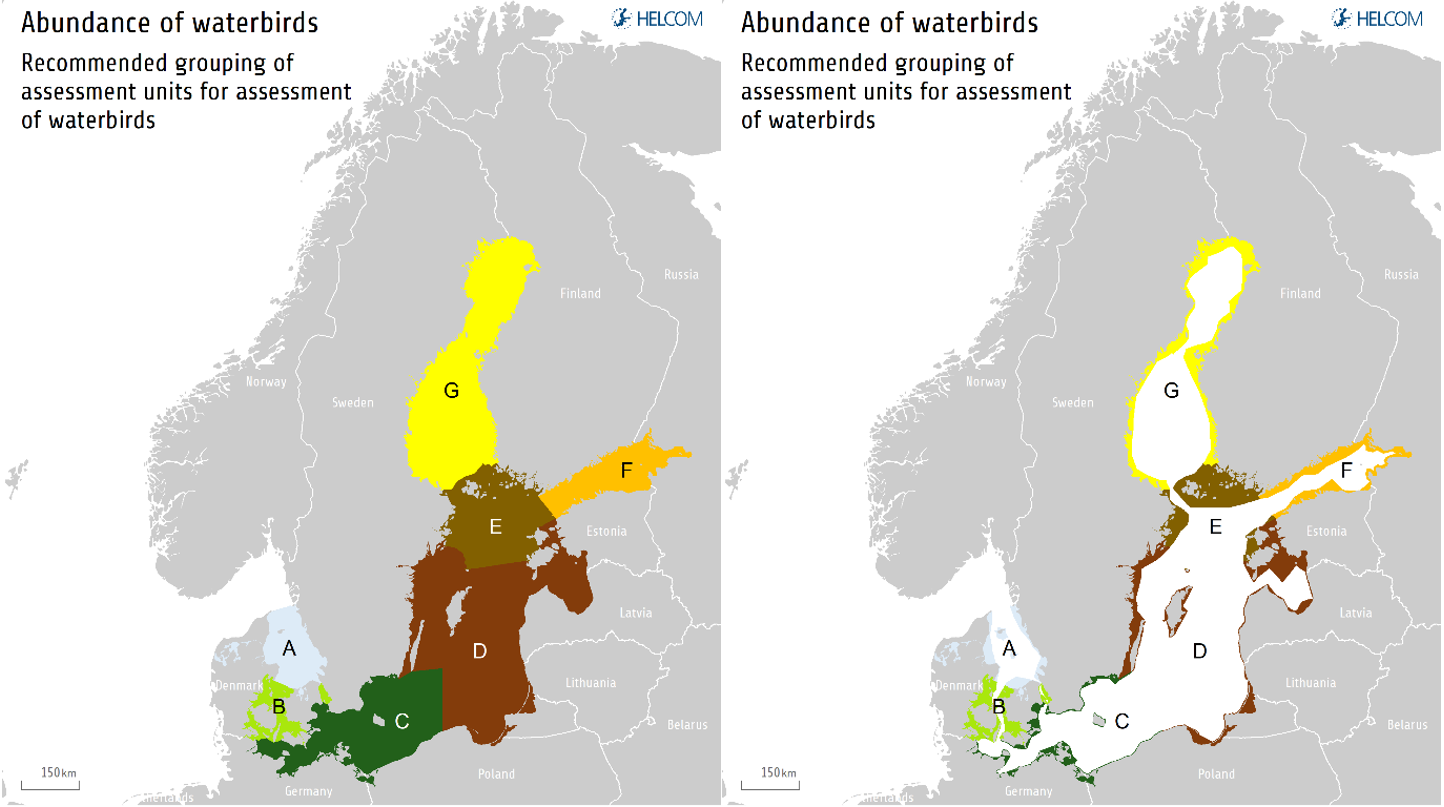
Figure 11. Grouping of 17 sub-basins (HELCOM assessment unit scale 2) to seven subdivisions as spatial units for breeding waterbird abundance evaluations as recommended by JWGBIRD (ICES 2018). The left figure shows the entire subdivision coloured, and the right figure shows the coastal areas, as used in the current evaluation, coloured by the seven subdivisions.
9.2 Methodology applied
The indicator includes several waterbird species, and the evaluation approach is sensitive to the number of species represented. In order to evaluate if good status is achieved in the Baltic Sea, all species occurring in the area should be considered. Therefore, the aim is to include as many representative species for the Baltic Sea environment as possible. However, the species selection process must take into account that some species (e.g. mallard, Eurasian coot, some gull species) exhibit strong connections to other (non-marine) habitats and may therefore not be appropriate to include in an indicator addressing the status of the Baltic Sea. So far, mostly waterbird species wintering close to the shore have been considered in the indicator as the majority of site level data come from land-based counts. Only relatively small number of sites currently available come from boat surveys in Polish offshore and Finnish Archipelago. Species with low proportions of the wintering populations of the Baltic Sea covered by land-based counts (all divers and alcids, most seaducks and grebes) are included in the analyses, although coastal data may be less representative and therefore of low confidence. An example from the Bornholm Group subdivision shows how more confident evaluations for species wintering offshore can enter the indicator. Expanded monitoring efforts at sea would allow for inclusion of more such species in future evaluations. Further, the aim is that all existing offshore data can be used for the indicator.
The approach used for defining good status has been developed by the OSPAR/HELCOM/ICES Joint Working Group on Marine Birds and their predecessors and was already used for the evaluation of wintering waterbirds in HOLAS 2 (ICES 2013, HELCOM 2018b).
This HELCOM core indicator incorporates further developed aspects of the evaluation method that have been carried out within the EU LIFE project ‘Innovative approaches for marine biodiversity monitoring and assessment of conservation status of nature values in the Baltic Sea’ (MARMONI; LIFE09 NAT/LV/000238), by correcting the numbers of birds counted for effects of climate change, i.e. winter temperature (Aunins et al. 2013). The main progress has been to replace the classical TRIM analyses (van Strien et al. 2004) by generalized additive modelling (GAM) which includes winter air temperature as a covariate (Aunins et al. 2013). This procedure gives yearly single species indices corrected for the temperature and thus – in a long view – for effects of climate change.
Site level raw data was used for each species to calculate the annual indices and trends. The national IWC coordinators of the HELCOM countries provided data for the monitoring sites that were located at the coast, bays and lagoons, and in the case of Poland and Finland also part of offshore habitats. The data was collected according to the Wetlands International field protocol (Wetlands International 2010). Each site level data for each species consisted of site code, coordinates of the site, year of survey and recorded abundance. There was a separate entry for each year the site was visited. Each site was assigned a code indicating to which country and assessment unit it belongs.
Temperature data was obtained from the E-OBS gridded dataset (Haylock et al. 2008), version 25.0e which included data from 1950 to 2021. The data was used to calculate the mean temperature for the week prior to the central IWC counting dates of each year (1991-2021). The temperature values were extracted for each site where birds had been counted. The inclusion of temperature data is an important progress, especially with respect to the predicted milder winters (due to the effects of climate change) and subsequent redistributions of sea ice and waterbirds.
To calculate the yearly indices and trends, a Generalised Additive Modelling framework (Hastie & Tibshirani 1990, Wood 2006) was used. Models explaining the observed abundance in each site by site, year and mean temperature a week before the counts was created for each species using approach similar to the one suggested by Fewster et al. (2000), but accounting for serial correlation in the data. Inclusion of the temperature data allowed to reduce the variation in observed abundance due to observation conditions. If temperature effects were not significant, the model without temperature in the model formula was calculated.
The mean predicted abundance in the period 1991-2000 was used as the point of reference (when the index is 1). To obtain the index, predicted abundances in each separate year were divided by this reference value. Thus, an index above 1 (or 100%) means population increase compared to the reference and an index below 1 represents a decline. The confidence intervals for each index value were obtained analytically. The geometric mean of index values from 2016-2021 was used to assess the status of a species compared to the reference level. MSI tool (Soldaat et al. 2017) was used to calculate and classify the linear trends from the GAM-based indices.
The multiplicative overall slope estimate calculated by the MSI-tool is converted into one of the following categories, depending on the overall slope as well as its 95% confidence interval (= slope +/- 1.96 times the standard error of the slope) (Pannekoek & van Strien 2001):
- Strong increase – increase significantly more than 5% per year (5% meaning a doubling in abundance within 15 years). Criterion: lower limit of confidence interval >1.05.
- Moderate increase – significant increase, but not significantly more than 5% per year. Criterion: 1.00< lower limit of confidence interval <1.05.
- Stable – no significant increase or decline, and it is certain that trends are less than 5% per year. Criterion: confidence interval encloses 1.00 but lower limit >0.95 and upper limit <1.05.
- Moderate decline – significant decline, but not significantly more than 5% per year. Criterion: 0.95< upper limit of confidence interval <1.00.
- Steep decline – decline significantly more than 5% per year (5% meaning a halving in abundance within 15 years). Criterion: upper limit of confidence interval <0.95.
The GAM-based indices can serve to calculate the composite indices to get an overall wintering waterbird index (following Gregory et al. 2005) or to aggregate species according to their role in the food web, i.e. by species groups (surface feeders, pelagic feeders, benthic feeders, wading feeders, grazing feeders). Such multi-species indices are calculated as the geometric mean of the single species indices, with every species treated equally and standard errors used to show the variability of data. As an option for the future, such composite indices could serve as evaluation tools. It remains to be tested whether the single species approach or the aggregated indices is more robust and better suited to assess good status with respect to population sizes of wintering waterbirds.
The concept of the indicator is well developed, based on long-running monitoring through International Waterbird Census (IWC), i.e. land-based waterbird counts in January. For the first time, an evaluation based on offshore surveys is added for some species in part of the Bornholm Group subdivision (German section of the Baltic Sea).
Offshore surveys are conducted from either ships or low-flying aircrafts, and methods are standardised internationally (Camphuysen et al. 2004, HELCOM Guidelines for monitoring seabirds at sea). Survey data are converted to bird densities at sea, allowing to calculate total numbers of birds present per assessment unit. Baseline data were derived from surveys in the years 1986 to 1997 (for details on the reference dataset see Durinck et al. 1994). The mean numbers of waterbirds for the winter period (December to February) were estimated with the method described by Mercker et al. (2021a) for the reference period and the assessment period 2016–2021.
For species assessed with both approaches, the index values used for observing the distance from baseline and threshold value are combined by generating weighted averages. Weighting is done according to the estimated proportions of the respective population living near the coast (surveyed land-based) and offshore (surveyed at sea). In the only cases of such combinations in the Bornholm Group subdivision, estimates for proportions were taken from earlier work done for preparing the German reporting for the Birds Directive in 2019 (N. Markones unpublished).
9.3 Monitoring and reporting requirements
Monitoring of wintering waterbirds in the Contracting Parties of HELCOM is described on a general level in the HELCOM Monitoring Manual in the sub-programme Marine wintering birds abundance and distribution. Guidelines for monitoring methods needed for this indicator have been developed by the HELCOM BALSAM project (HELCOM 2015). They have been further elaborated ad specified for waterbird monitoring at sea. For coastal areas census methods are standardized by Wetlands International for the International Waterbird Census (IWC; Wetlands International 2010), and currently used monitoring methods for offshore censuses are described by Camphuysen et al. (2004). In future, also digital aerial surveys are expected to add to offshore surveys by observers based on ships and aircrafts.
The indicator is primarily based on mid-winter counts of waterbirds along the shoreline, carried out as national monitoring, i.e. the indicator is mostly restricted to coastal staging areas. Additionally, data from boat surveys in Polish offshore and Finnish Archipelago are included. The aim is to expand the indicator by including waterbirds wintering in offshore areas of the Baltic Sea by adding more data collected in Baltic offshore (ICES 2017), and the possible application is demonstrated using the example of some species in the Bornholm Group subdivision.
Monitoring of wintering waterbirds is running in all countries bordering the Baltic Sea and specifications are provided in the monitoring concepts table in the HELCOM Monitoring Manual, sub-programme Marine wintering birds abundance and distribution.
Monitoring of coastal wintering waterbirds (i.e. the IWC) is organized by Wetlands International (Wageningen) and has been carried out annually in mid-January for more than 50 years, with high coverage of the Baltic Sea since 1991.
There is no coordinated monitoring for offshore areas, but national programmes are implemented in several countries and efforts were started to coordinate surveys on a regional level (ICES 2020). The coverage of offshore area monitoring is far from complete, and intervals of monitoring as well as methods and platforms differ between programmes. All past and ongoing offshore surveys are included in a metadatabase developed in the BALSAM project (HELCOM 2014). More details are listed in the HELCOM Monitoring Manual.
Description of optimal monitoring
For abundance of wintering waterbirds, the currently monitoring scheme based on the International Waterbird Survey is sufficient to supply the necessary data of coastal birds for the indicator, despite smaller spatial gaps (lack of monitoring scheme in Russia). An optimal monitoring would have to close these gaps. The monitoring of waterbirds wintering offshore would gain from international collaboration and coordination, and the aim should be a better spatial coverage of the open seas. This would allow to conduct evaluations for species so far covered only insufficiently (e.g., divers, seaducks) or not at all (alcids).
10 Data
Following the HOLAS 3 data from coastal midwinter surveys in the frame of IWC were supplied by Germany, Poland, Latvia, Estonia, Finland and Sweden. Data from offshore surveys were supplied by Germany, Poland, Estonia and Sweden. Note that the extremely short period between deadline of the datacall and expected submission of results was insufficient to analyse most of the offshore data.
Result: Abundance of waterbirds in the wintering season
Data: Abundance of waterbirds in the wintering season
The data and resulting data products (tables, figures and maps) available on the indicator web page can be used freely given that the source is cited. The indicator should be cited as following:
HELCOM (2023) Abundance of waterbirds in the breeding season. HELCOM core indicator report. Online. [Date Viewed], [Web link]. ISSN 2343-2543
11 Contributors
The indicator “Abundance of waterbirds in the wintering season” is led by Germany (responsible expert: Volker Dierschke) and co-led by Finland (responsible expert: Markku Mikkola-Roos) and Sweden (responsible expert: Fredrik Haas).
Data were supplied by the national monitoring schemes from Germany, Poland, Latvia, Estonia, Finland and Sweden (IWC data), but not from Denmark, Lithuania and Russia. Offshore data were supplied by Germany, Poland, Lithuania, Estonia and Sweden, but time constraints prevented to analyse these data as well as baseline data (supplied by OrnisConsult) completely and limited the analysis to the German section of the Baltic Sea, which entirely falls into the subdivision Bornholm Group.
The IWC data were analysed by Ainārs Auniņš (University of Latvia), and analyses of offshore data were conducted by Kai Borkenhagen, Jana Kotzerka, Nele Markones and Henriette Schwemmer (Dachverband Deutscher Avifaunisten), all funded by the German Federal Agency for Nature Conservation (BfN).
HELCOM Secretariat: Jannica Haldin, Owen Rowe.
The indicator was developed by the OSPAR/HELCOM/ICES Joint Working Group on Marine Birds (JWGBIRD).
12 Archive
This version of the HELCOM core indicator report was published in April 2023:
The current version of this indicator (including as a PDF) can be found on the HELCOM indicator web page.
Earlier versions of this indicator can be found below:
Abundance of waterbirds in the wintering season HELCOM core indicator 2018 (pdf)
HOLAS II component – Core indicator report – web-based version July 2017 (pdf)
13 References
Aunins, A., Clausen, P., Dagys, M., Garthe, S., Grishanov, G., Korpinen, S., Kuresoo, A., Lehikoinen, A., Luigujoe, L., Meissner, W., Mikkola-Roos, M., Nilsson, L., Petersen, I.K., Stīpniece, A., Wahl, J. 2013. Development of wintering waterbird indicators for the Baltic Sea. In: Szabó, Z.D., Keller, V., Noble, D., Veres-Szászka (eds): Every bird counts. Book of abstracts of the 19th Conference of the European Bird Census Council. Babeş-Bolyai University, Romanian Ornithological Society / BirdLife Romania, Milvus Group – Bird and Nature Protection Association. Cluj, Romania.
Bellebaum, J., Diederichs, A., Kube, J., Schulz, A., Nehls, G. (2006) Flucht- und Meidedistanzen überwinternder Seetaucher und Meeresenten gegenüber Schiffen auf See. (In German). Ornithologischer Rundbrief Mecklenburg-Vorpommern 45 (Sonderheft 1): 86-90. https://www.bioconsult-sh.de/site/assets/files/1284/1284.pdf
Broman, D., Näf, C., Lundbergh, I., Zebühr, Y. (1990) An in situ study on the distribution, biotransformation and flux of polycyclic aromatic hydrocarbons (PAHs) in an aquatic food chain (seston-Mytilus edulis L.-Somateria mollissima L.) from the Baltic: an ecotoxicological perspective. Environmental Toxicology and Chemistry 9: 429–442. https://setac.onlinelibrary.wiley.com/doi/abs/10.1002/etc.5620090404
Camphuysen, C.J., Fox, T.J., Leopold, M.F., & Petersen, I.K., 2004. Towards standardised seabirds at sea census techniques in connection with environmental impact assessments for offshore wind farms in the U.K. NIOZ, Den Burg https://tethys.pnnl.gov/sites/default/files/publications/Camphuysen-et-al-2004-COWRIE.pdf
Clausen, K. K., Stjernholm, M., & Clausen, P. 2013. Grazing management can counteract the impacts of climate change-induced sea level rise on salt marsh-dependent waterbirds. Journal of Applied Ecology 50 : 528-537. https://doi.org/10.1111/1365-2664.12043
Cook, A.S.C.P., Burton, N.H.K. 2010. A review of the potential impacts of marine aggregate extraction on seabirds. Marine Environment Protection Fund (MEPF) Project 09/P130. https://www.bto.org/sites/default/files/shared_documents/publications/research-reports/2010/rr563.pdf
Dierschke, V., Exo, K.-M., Mendel, B., Garthe, S. 2012. Threats for Red-throated Divers Gavia stellata and Black-throated Divers G. arctica in breeding, migration and wintering areas: a review with special reference to the German marine areas. Vogelwelt 133: 163-194. (In German).
Dierschke, V., Furness, R.W. & Garthe, S. 2016. Seabirds and offshore wind farms in European waters: Avoidance and attraction. Biological Conservation 202: 59-68. https://www.sciencedirect.com/science/article/abs/pii/S0006320716303196
Durinck, J., Skov, H., Jensen, F.P., & Pihl, S., 1994. Important marine areas for wintering birds in the Baltic Sea. Ornis Consult report 1994, Copenhagen.
Ellermaa, M., Lindén, A. (2015) Autumn migration in Cape Põõsaspea in 2014. Hirundo 2015 (1): 20-49. (In Estonian). https://jukuri.luke.fi/bitstream/handle/10024/546021/Ellermaa_and_Linden_2020_Hirundo.pdf?sequence=1&isAllowed=y
European Commission 2008. Directive 2008/56/EC of the European Parliament and the Council establishing a framework for community action in the field of marine environmental policy (Marine Strategy Framework Directive). Off. J. Eur. Union L 164: 19-40.
European Commission 2010. Directive 2009/147/EC of the European Parliament and of the Council of 30 November 2009 on the conservation of wild birds. Off. J. Eur. Union L20: 7-25.
European Commission 2017. Commission Decision of (EU) 2017/848 of 17 May 2017 laying down criteria and methodological standards on good environmental status of marine waters and specifications and standardized methods for monitoring and assessment, and repealing Decision 2010/477/EU. May 2017.
European Commission 2022. MSFD CIS Guidance Document No. 19, Article 8 MSFD, May 2022. https://circabc.europa.eu/d/d/workspace/SpacesStore/d2292fb4-ec39-4123-9a02-2e39a9be37e7/GD19%20-%20MSFDguidance_2022_Art.8Assessment(1).pdf
Fewster, R.M., Buckland, S.T., Siriwardena, G.M., Baillie, S.R., Wilson, J.D., Sciences, C., Haugh, N., Andrews, S., Nunnery, T., Group, B., & Road, S.P. 2000. Analysis of population trends for farmland birds using generalized additive models. Ecology 81: 1970–1984. https://esajournals.onlinelibrary.wiley.com/doi/abs/10.1890/0012-9658(2000)081%5B1970:AOPTFF%5D2.0.CO%3B2
Fliessbach, K.L., Borkenhagen, K., Guse, N., Markones, N., Schwemmer, P. & Garthe, S. 2019. A ship traffic disturbance vulnerability index for Northwest European seabirds as a tool for marine spatial planning. Frontiers in Marine Science 6: 1-15. https://www.frontiersin.org/articles/10.3389/fmars.2019.00192/full
Fox, A.D., Jónsson, J. E., Aarvak, T., Bregnballe, T., Christensen, T. K., Clausen, K.K., Clausen, P., Dalby, L., Holm, T.E., Pavón-Jordan, D., Laursen, K., Lehikoinen, A., Lorentsen, S.-H., Møller, A.P., Nordström, M., Öst, M., Söderquist, P., & Roland Therkildsen, O. 2015. Current and potential threats to Nordic duck populations – a horizon scanning exercise. Annales Zoologici Fennici 52: 193-220. https://bioone.org/journals/annales-zoologici-fennici/volume-52/issue-4/086.052.0404/Current-and-Potential-Threats-to-Nordic-Duck-Populations–A/10.5735/086.052.0404.short
Fox, A. D., Nielsen, R. D., & Petersen, I. K. 2019. Climate-change not only threatens bird populations but also challenges our ability to monitor them. Ibis 161: 467-474. https://doi.org/10.1111/ibi.12675
Fox, A.D. & Petersen, I.K. 2019. Offshore wind farms and their effects on birds. Dansk Ornitologisk Forenings Tidsskrift 113: 86-101. https://www.researchgate.net/profile/A-Fox-2/publication/335703152_Offshore_wind_farms_and_their_effects_on_birds/links/5d769211299bf1cb8095256e/Offshore-wind-farms-and-their-effects-on-birds.pdf
Gregory, R.D., van Strien, A.J., Vorisek, P., Gmelig Meyling, A.W., Noble, D.G., Foppen, R.P.B., & Gibbons, D.W. 2005. Developing indicators for European birds. Phil. Trans. R. Soc. B 360: 269-288. https://www.ncbi.nlm.nih.gov/pmc/articles/PMC1569455/
Gunnarsson, G., Waldenström, J., & Fransson, T. 2012. Direct and indirect effects of winter harshness on the survival of Mallards Anas platyrhynchos in northwest Europe. Ibis 154: 307-317. https://doi.org/10.1111/j.1474-919X.2011.01206.x
Hario, M., Rintala, J., & Nordenswan, G. 2009. Dynamics of wintering long-tailed ducks in the Baltic Sea – the connection with lemming cycles, oil desasters, and hunting. Suomen Riista 55: 83-96.
Hastie, T., & Tibshirani, R. 1990. Generalized additive models. Chapman and Hall.
Haylock, M.R., Hofstra, N., Tank, A.M.G.K., Klok, E.J., Jones, P.D., New, M. 2008. A European daily high-resolution gridded data set of surface temperature and precipitation for 1950-2006. Journal of Geophysical Research 113: 1–12. https://agupubs.onlinelibrary.wiley.com/doi/full/10.1029/2008JD010201
HELCOM 2013. Red List of Baltic Sea species in danger of becoming extinct. Baltic Sea Environ. Proc. No. 140. https://www.helcom.fi/wp-content/uploads/2019/08/BSEP140-1.pdf
HELCOM 2014. First Interim Report of the Baltic Sea Pilot Project: Testing New Concepts for Integrated Environmental Monitoring of the Baltic Sea (BALSAM): Information Collected During Cataloguing of Environmental Monitoring in the Baltic Sea. Available at: http://portal.helcom.fi/meetings/BALSAM%202-2014-110/MeetingDocuments/BALSAM%20Interim%20report%20May%202014_final.pdf
HELCOM 2015. HELCOM guidelines for coordinated monitoring of wintering birds. https://helcom.fi/wp-content/uploads/2019/08/HELCOM-guidelines-for-coordinated-monitoring-of-wintering-birds.pdf
HELCOM 2018a. HELCOM Thematic assessment of biodiversity 2011-2016. Baltic Sea Environment Proceedings No. 158. http://stateofthebalticsea.helcom.fi/wp-content/uploads/2019/09/BSEP158-Biodiversity.pdf
HELCOM 2018b. Abundance of waterbirds in the wintering season. HELCOM core indicator report. https://helcom.fi/wp-content/uploads/2019/08/Abundance-of-waterbirds-in-the-wintering-season-HELCOM-core-indicator-2018.pdf
HELCOM & Baltic Earth 2021. Climate Change in the Baltic Sea. 2021 Fact Sheet. Baltic Sea Environment Proceedings 180. https://helcom.fi/baltic-sea-climate-change-fact-sheet-new-publication-shows-latest-scientific-knowledge-on-climate-change-in-the-baltic-sea/
ICES 2013. Report on the Joint ICES/OSPAR Expert Group on Seabirds (WGBIRD), 22-25 Oct 2013, Copenhagen, Denmark. Available at: http://www.ices.dk/sites/pub/Publication%20Reports/Expert%20Group%20Report/acom/2013/WGBIRD/wgbird_2013.pdf
ICES 2015. Report on the Joint ICES/OSPAR Working Group on Seabirds (JWGBIRD), 17-21 November 2014, Copenhagen, Denmark. Available at: http://ices.dk/sites/pub/Publication%20Reports/Expert%20Group%20Report/acom/2014/JWGBIRD/JWGBIRD_2014.pdf
ICES 2016. Report of the Joint OSPAR/HELCOM/ICES Working Group on Seabirds (JWGBIRD), 9-13 November 2015, Copenhagen, Denmark. Available at: http://www.ices.dk/sites/pub/Publication%20Reports/Expert%20Group%20Report/acom/2015/JWGBIRD/JWGBIRD_2015.pdf
ICES 2017. Report of the OSPAR/HELCOM/ICES Working Group on Marine Birds (JWGBIRD), 10-14 October 2016, Thetford, U.K. Available at: http://ices.dk/sites/pub/Publication%20Reports/Expert%20Group%20Report/acom/2016/JWGBIRD/ExSumm_JWGBIRD_2016.pdf
ICES 2018. Report of the Joint OSPAR/HELCOM/ICES Working Group on Seabirds (JWGBIRD), 6–10 November 2017, Riga, Latvia. ICES CM 2017/ACOM:49. 97 pp. Available at: http://ices.dk/sites/pub/Publication%20Reports/Expert%20Group%20Report/acom/2017/JWGBIRD/01%20JWGBIRD%20Report.pdf
ICES. 2020. Joint OSPAR/HELCOM/ICES Working Group on Seabirds (JWGBIRD; outputs from 2019 meeting). ICES Scientific Reports. 2:80. 101 pp. http://doi.org/10.17895/ices.pub.7466
Kadin, M., Frederiksen, M., Niiranen, S., & Converse, S. J. 2019. Linking demographic and food-web models to understand management trade-offs, Ecology and Evolution 9: 8587-8600. https://doi.org/10.1002/ece3.5385
King, S., 2019. Seabirds: collision. In: Perrow, M.R. (ed), Wildlife and Wind Farms, Conflicts and Solutions, Vol. 3 Offshore: Potential Effects, pp. 206-234. Pelagic Publishing, Exeter
Larsson, K., & Tydén, L. 2005. Effekter av oleutsläpp på övervintrande alfågel Clangula hyemalis vid Hoburgs bank I centrala Östersjön mellan 1996/97 och 2003/04. (In Swedish). Ornis Svecica 15: 161-171. https://www.researchgate.net/profile/Kjell-Larsson-2/publication/291779312_Effects_of_oil_spills_on_wintering_Long-tailed_Ducks_Clangula_hyemalis_at_Hoburgs_bank_in_central_Baltic_Sea_between_199697_and_200304/links/56b47ab508ae01db096e9989/Effects-of-oil-spills-on-wintering-Long-tailed-Ducks-Clangula-hyemalis-at-Hoburgs-bank-in-central-Baltic-Sea-between-1996-97-and-2003-04.pdf
Lehikoinen, A., Kilpi, M., & Öst, M. 2006. Winter climate affects subsequent breeding success of common eiders. Global Change Biology 12: 1355-1365. https://doi.org/10.1111/j.1365-2486.2006.01162.x
Lehikoinen, A., Jaatinen, K., Vähätalo, A.V., Clausen, P., Crowe, O., Deceuninck, B., Hearn, R., Holt, C.A., Hornman, M., Keller, V., Nilsson, L., Langendoen, T., Tománková, I., Wahl, J., & Fox, A.D. 2013. Rapid climate driven shifts in wintering distributions of three common waterbird species. Global Change Biology 19: 2071-2081.
Lindegren, M., Blenckner, T., & Stenseth, N. C. 2012. Nutrient reduction and climate change cause a potential shift from pelagic to benthic pathways in a eutrophic marine ecosystem, Global Change Biol., 18, 3491-3503, https://doi.org/10.1111/j.1365-2486.2012.02799.x
MacKenzie, B. R., Meier, H. E. M., Lindegren, M., Neuenfeldt, S., Eero, M., Blenckner, T., Tomczak, M. T., & Niiranen, S. 2012. Impact of Climate Change on Fish Population Dynamics in the Baltic Sea: A Dynamical Downscaling Investigation. Ambio 41: 626-636. https://doi.org/10.1007/s13280-012-0325-y
Meier, H.E.M., Kniebusch, M., Dieterich, C., Gröger, M., Zorita, E., Elmgren, R., Myrberg, K., Ahola, M.P., Bartosova, A., Bonsdorff, E., Börgel, F., Capell, R., Carlén, I., Carlund, T., Carstensen, J., Christensen, O.B., Dierschke, V., Frauen, C., Frederiksen, M., Gaget, E., Galatius, A., Haapala, J.J., Halkka, A., Hugelius, G., Hünicke, B., Jaagus, J., Jüssi, M., Käyhkö, J., Kirchner, N., Kjellström, E., Kulinski, K., Lehmann, A., Lindström, G., May, W., Miller, P.A., Mohrholz, V., Müller-Karulis, B., Pavón-Jordán, D., Quante, M., Reckermann, M., Rutgersson, A., Savchuk, O.P., Stendel, M., Tuomi, L., Viitasalo, M., Weisse R., & Zhang, W. 2022. Climate change in the Baltic Sea region: a summary. Earth System Dynamics 13: 457-593. https://esd.copernicus.org/articles/13/457/2022/
Mercker, M., Markones, N., Borkenhagen, K., Schwemmer, H., Wahl, J., & Garthe, S. 2021a. An integrated framework to estimate seabird population numbers and trends. Journal of Wildlife Management 62: 751–771. https://wildlife.onlinelibrary.wiley.com/doi/pdfdirect/10.1002/jwmg.22026
Mercker, M., Dierschke, V., Camphuysen, K., Kreutle, A., Markones, N., Vanermen, N., & Garthe, S. 2021b. An indicator for assessing the status of marine-bird habitats affected by multiple human activities: A novel statistical approach. Ecological Indicators 130: 108036. https://www.sciencedirect.com/science/article/pii/S1470160X21007019
Mooij, J.H. 2005. Protection and use of waterbirds in the European Union. Beitr. Jagd- & Wildforschung 30: 49-76.
Nilsson, L., & Haas, F. 2016. Distribution and numbers of wintering waterbirds in Sweden in 2015 and changes during the last fifty years. Ornis Svecica 26: 3–54.
Olin, A. B., Olsson, J., Eklöf, J. S., Eriksson, B. K., Kaljuste, O., Briekmane, L., & Bergström, U. 2022. Increases of opportunistic species in response to ecosystem change: the case of the Baltic Sea three-spined stickleback. ICES Journal of Marine Science 79: 1419–1434. https://academic.oup.com/icesjms/article/79/5/1419/6581452?login=false
Olsson, J., Jakubavičiūtė, E., Kaljuste, O., Larsson, N., Bergström, U., Casini, M., Cardinale, M., Hjelm, J. & Byström, P. 2019. The first large-scale assessment of three-spined stickleback (Gasterosteus aculeatus) biomass and spatial distribution in the Baltic Sea. ICES Journal of Marine Science 76: 1653-1665. https://academic.oup.com/icesjms/article/76/6/1653/5480400?login=false
OSPAR 2017. Marine bird abundance. In: Intermediate Assessment 2017. Available at: https://oap.ospar.org/en/ospar-assessments/intermediate-assessment-2017/biodiversity-status/marine-birds/bird-abundance/
Pannekoek, J., & van Strien, A.J. 2001. TRIM 3 manual (TRends and Indices for Monitoring data). Research paper no. 0102. Statistics Netherlands.
Pavón-Jordán, D., Clausen, P., Dagys, M., Devos, K., Encarnaçao, V., Fox, A. D., Frost, T., Gaudard, C., Hornman, M., Keller, V., Langendoen, T., Ławicki, Ł., Lewis, L. J., Lorentsen, S.-H., Luigujoe, L., Meissner, W., Molina, B., Musil, P., Musilova, Z., Nilsson, L., Paquet, J.-Y., Ridzon, J., Stipniece, A., Teufelbauer, N., Wahl, J., Zenatello, M., & Lehikoinen, A. 2019. Habitat- and species-mediated short- and long-term distributional changes in waterbird abundance linked to variation in European winter weather. Diversity and Distributions 25: 225-239. https://doi.org/10.1111/ddi.12855
Pavón-Jordán, D., Abdou, W., Azafzaf, H., Balaž, M., Bino, T., Borg, J.J., Božič, L., Butchart, S.H.M., Clausen, P., Sniauksta, L., Dakki, M., Devos, K., Domsa, C., Encarnaçao, V., Etayeb, K., Faragó, S., Fox, A.D., Frost, T., Gaudard, C., Georgiev, V., Goratze, I., Hornman, M., Keller, V., Kostiushyn, V., Langendoen, T., Ławicki, Ł., Ieronymidou, C., Lewis, L.J., Lorentsen, S.-H., Luigujoe, L., Meissner, W., Mikuska, T., Molinaa, B., Musil, P., Musilova, Z., Nagy, S., Natykanets, V., Nilsson, L., Paquet, J.-Y., Portolou, D., Ridzon, J., Santangeli,A., Sayoud, S., Šćiban, M., Stipniece, A., Teufelbauer, N., Topić, G., Uzunova, D., Vizi, A., Wahl, J., Yavuz, K.E., Zenatello, M., & Lehikoinen A., 2020. Positive impacts of important bird and biodiversity areas on wintering waterbirds under changing temperatures throughout Europe and North Africa. Biological Conservation 246: 108549.
Petersen, I.K., MacKenzie, M., Rexstad, E., Wisz, M.S., Fox, A.D. 2011. Comparing pre- and post-construction distributions of long-tailed ducks Clangula hyemalis in and around the Nysted offshore wind farm, Denmark: a quasi-designed experiment accounting for imperfect detection, local surface features and autocorrelation. CREEM Tech Report 2011-1. https://research-repository.st-andrews.ac.uk/bitstream/handle/10023/2008/PetersenetalCreemtechreport2011_1.pdf?sequence=1
Pilarczyk, B., Tomza-Marciniak, A., Pilarczyk, R., Kavetska, K., Rzad, I., Hendzel, D., Marciniak, A. 2012. Selenium status in sea ducks (Melanitta fusca, Melanitta nigra and Clangula hyemalis) wintering on the southern Baltic coast, Poland. Marine Biology Research 8: 1019-1025. https://www.tandfonline.com/doi/abs/10.1080/17451000.2012.706304
Rainio, K., Laaksonen, T., Ahola, M., Vähätalo, A. V., & Lehikoinen, E. 2006. Climatic responses in spring migration of boreal and arctic birds in relation to wintering area and taxonomy. Journal of Avian Biology 37: 507-515. https://doi.org/10.1111/j.0908-8857.2006.03740.x
Rajasilta, M., Hänninen, J., Laaksonen, L., Laine, P., Suomela, J.-P., Vuorinen, I., & Mäkinen, K. 2018. Influence of environmental conditions, population density, and prey type on the lipid content in Baltic herring (Clupea harengus membras) from the northern Baltic Sea, Can. J. Fish. Aquat. Sci. 76: 576-585. https://doi.org/10.1139/cjfas-2017-0504
Rubarth, J., Dreyer, A., Guse, N., Einax, J.W., Ebinghaus, R. 2011. Perfluorinated compounds in red-throated divers from the German Baltic Sea: new findings from their distribution in 10 different tissues. Environmental Chemistry 8: 419-428. https://www.publish.csiro.au/en/EN10142
Schwemmer, P., Mendel, B., Sonntag, N., Dierschke, V., & Garthe, S. 2011. Effects of ship traffic on seabirds in offshore waters: implications for marine conservation and spatial planning. Ecological Applications 21: 1851-1860. https://esajournals.onlinelibrary.wiley.com/doi/abs/10.1890/10-0615.1
Skov, H., Heinänen, S., Žydelis, R., Bellebaum, J., Bzoma, S., Dagys, M., Durinck, J., Garthe, S., Grishanov, G., Hario, N., Kieckbusch, J.J., Kube, J., Kuresoo, A., Larsson, K., Luigujoe, L., Meissner, W., Nehls, H.W., Nilsson, L., Petersen, I.K., Mikkola Roos, M., Pihl, S., Sonntag, N., Stock, A., Stipniece, A., 2011. Waterbird populations and pressures in the Baltic Sea. TemaNord 2011:550. Nordic Council of Ministers, Copenhagen. http://norden.diva-portal.org/smash/get/diva2:701707/FULLTEXT01.pdf
Soldaat, L., Pannekoek J., Verweij R.J.T., van Turnhout C.A.M., & van Strien, A. 2017. A Monte Carlo method to account for sampling error in multi-species indicators. Ecological Indicators 81: 340-347. https://pecbms.info/wp-content/uploads/2020/04/soldaat-et-al-2017.pdf
Vähätalo, A. V., Rainio, K., Lehikoinen, A., & Lehikoinen, E. 2004. Spring arrival of birds depends on the North Atlantic Oscillation. Journal of Avian Biology 35: 210-216. https://doi.org/10.1111/j.0908-8857.2004.03199.x
van Strien, A., Pannekoek, J., Hagemeijer, W., Verstrael, T. 2004. A logline Poisson regression method to analyse bird monitoring data. Bird Census News 13: 33-39.
Waldeck, P., & Larsson, K. 2013. Effects of winter water temperature on mass loss in Baltic blue mussels: Implications for foraging sea ducks. J. Exp. Mar. Biol. Ecol. 444: 24-30. https://doi.org/10.1016/j.jembe.2013.03.007
Wetlands International 2010. Guidance on waterbird monitoring methodology : Field Protocol for waterbird counting. https://europe.wetlands.org/wp-content/uploads/sites/3/2016/08/Protocol_for_waterbird_counting_En_.pdf
Wood, S.N. 2006. Generalized additive models: an introduction with R. Chapman and Hall/CRC Press, Taylor & Francis Group, Boca Raton. doi:10.1111/j.1467-985X.2006.00455_15.x
Žydelis, R., Dagys, M., Vaitkus, G. 2006. Beached bird surveys in Lithuania reflect marine oil pollution and bird mortality in fishing nets. Marine Ornithology 34: 161-166. http://www.marineornithology.org/PDF/34_2/34_2_161-166.pdf
Žydelis, R., Bellebaum, J., Österblom, H., Vetemaa, M., Schirmeister, B., Stipniece, A., Dagys, M., van Eerden, M., Garthe, S. 2009. Bycatch in gillnet fisheries – an overlooked threat to waterbird populations. Biological Conservation 142: 1269-1281. https://oceanrep.geomar.de/id/eprint/9872/1/1-s2.0-S0006320709001001-main.pdf
14 Other relevant resources
Additional information is provided in two annexes.