 Inputs of nutrients
2 Relevance of the indicator
2.1 Ecological relevance
Eutrophication in the Baltic Sea is to a large extent driven by excessive inputs of the nutrients nitrogen and phosphorus due to accelerating anthropogenic activities during the 20th century. Nutrient over-enrichment (or eutrophication) and/or changes in nutrient ratios in the aquatic environment cause elevated levels of algal and plant biomass, increased turbidity, oxygen depletion in bottom waters, changes in species composition and nuisance blooms of algae. In turn, such alterations can influence broader ecosystem functionality and structure, for example altered composition and energy flows in food webs.
The majority of nutrient inputs originate from anthropogenic activities on land and at sea. Waterborne inputs enter the sea via riverine inputs and direct discharges from coastal areas. The main sources of waterborne inputs are point sources (e.g. waste water treatment plants, industries and aquaculture), diffuse sources (agriculture, managed forestry, scattered dwellings, stormwater overflows etc.) and natural background sources. The main sectors contributing to atmospheric inputs are combustion in energy production and industry as well as transportation for oxidized nitrogen, and agriculture for reduced nitrogen. A large proportion of atmospheric inputs originate from distant sources outside the Baltic Sea region. Emissions from shipping in the Baltic and North seas also contribute significantly to atmospheric inputs of nitrogen. In addition, excess nutrients stored in bottom sediments can enter the water column and enhance primary production of plants (Relevance figure 1).
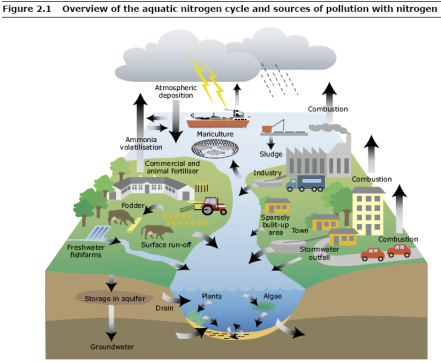
Relevance figure 1. Different sources of nutrients to the sea and examples of nitrogen and phosphorus cycles. The flow related to ammonia volatilization shown in the figure applies only to nitrogen. In this indicator, also combustion and atmospheric deposition deal only with nitrogen. Emissions of phosphorus to the atmosphere by dust from soils are not shown in the figure. (Source: Ærtebjerg et al. 2003)
Information on the quantity of nutrient inputs is of key importance in order to follow up the long-term changes in the nutrient inputs to the Baltic Sea. This information, together with information from land-based sources and retention within the catchment, is also crucial for determining the importance of different sources of nutrients for the pollution of the Baltic Sea as well as for assessing the effectiveness of measures taken to reduce the pollution inputs. Quantified input data is a prerequisite to interpret, evaluate and predict the state of the marine environment and related changes in the open sea and coastal waters.
State indicators linked to the pressure of nutrient inputs
Response in the eutrophication status from changes in nutrient inputs may be considerably slow. Model simulations indicate that it would take perhaps half a century or even more after nutrient inputs reach MAI to reach the environmental targets (Gustafsson, B.G & Mörth, C.M, document 2-43 HOD 41-2013). However, the simulations indicate that significant improvements could be expected after 1-2 decades. It should be noted that determination of these timescales is regarded as more uncertain than the ultimate long-term state because of unexpected non-linear responses of, e.g., phosphorus to improved oxygen concentrations. In coastal areas one can expect faster responses, especially when significant direct point sources are removed. This is probably also the case for the eastern part of the Gulf of Finland.
The effect of changes in nutrient inputs on the core HELCOM eutrophication status indicators DIN, DIP, chlorophyll-a, Secchi depth and oxygen debt are thoroughly evaluated in Gustafsson, B.G & Mörth, C.M, document 2-43 HOD 41-2013.
Relevant core indicators on eutrophication status can be found on the HELCOM Indicators website:
Total phosphorus Water transparency
Cyanobacterial blooms (pre-core)
Information on other relevant supporting parameters (Baltic Sea Environment Factsheets):
Cyanobacteria biomass 1990-2022
Impacts of invasive phytoplankton species on the Baltic Sea ecosystem (updated 2009)
Atmospheric nitrogen deposition to the Baltic Sea area in 2022
Nitrogen emissions to the air in the Baltic Sea area in 2022
Spatial distribution of winter nutrient pool (updated 2017)
Unusual phytoplankton event (updated 2010)
Bacterioplankton growth (updated 2024)
2.2 Policy relevance
As a follow-up to the original Baltic Sea Action Plan (2007), a revised HELCOM nutrient reduction scheme was adopted in the 2013 HELCOM Ministerial Declaration (HELCOM 2013a) in which reduction requirements for nitrogen inputs to the Baltic Proper, Gulf of Finland and Kattegat and for phosphorus inputs to the Baltic Proper, Gulf of Finland and Gulf of Riga were set. The HELCOM nutrient reduction scheme defines maximum allowable inputs (MAI) of nutrients, which indicate the maximum level of inputs of water- and airborne nitrogen and phosphorus to Baltic Sea sub-basins that can be allowed in order to obtain good status in terms of eutrophication. This core indicator presents progress in the different Baltic Sea sub-basins towards reaching these maximum annual nutrient inputs levels. The updated Baltic Sea Action Plan 2021 reconfirmed the MAIs and their achievement for all sub-basins as the key prerequisite for achieving the ecological objective of a Baltic Sea unaffected by eutrophication and contains measures to follow up and assess the progress towards maximum allowable inputs (HELCOM 2021).
The progress of countries in reaching their share of the country-wise allocation of nutrient reduction targets is assessed separately in a follow-up system based on nutrient input ceilings (NIC) country per Baltic Sea sub basins, as included in the updated BSAP 2021 (HELCOM, 2021). Relevance figure 2 illustrates how the nutrient reduction scheme fits into the HELCOM causal framework DAPSIM, providing a conceptual management framework through which key elements can be detailed and evaluated. Setting individual indicators (or components of indicators) within a causal framework support the BSAP by providing additional information that can facilitate the follow up on how actions and measures impact on other socioeconomic and state variables (HELCOM 2020).
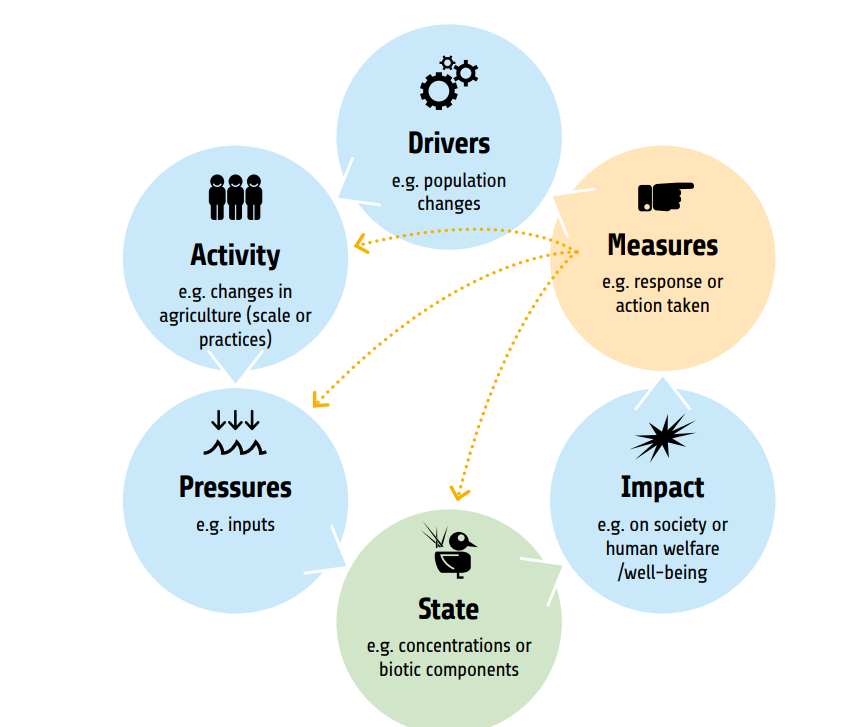
Relevance figure 2. The conceptual approach for a HELCOM causal framework – DAPSIM with drivers, activities, pressures, state, impact and measures. Here the quantitative targets of MAI and Nutrient Input Ceilings country by sub-basin are within the Pressures.
Reducing the effects of human-induced eutrophication is the stated goal of Descriptor 5 in the EU Marine Strategy Framework Directive (MSFD). The indicator is an important part in following up the effectiveness of the measures taken to achieve GES under this Descriptor. Inputs of nutrients to the Baltic Sea marine environment have an effect on the nutrient levels under Descriptor 5 Criterion 1. It is important to note that this pressure indicator on inputs of nutrients relates to HELCOM eutrophication state core indicators. More information on this is provided in the section below on Environmental Targets and progress towards GES.
The information provided in this pressure indicator also supports follow-up of the effectiveness of measures implemented under the following agreements, as each of them addresses reduction in nutrient inputs in some way or other: EU Nitrates Directive; EU Urban Waste-Water Treatment Directive; EU Industrial Emissions Directive, IED; EU Water Framework Directive, WFD; the Gothenburg Protocol to Abate Acidification, Eutrophication and Ground-level Ozone under UNECE Convention on Long-range Transboundary Air pollution (CLRTAP); EU NEC Directive; IMO designation of the Baltic Sea as a ”special area” for passenger ships under MARPOL (International Convention for the Prevention of Pollution from Ships) Annex IV (on sewage from ships); EC Directive on port reception facilities; and the Application of the Baltic Sea NOx emission control area (NECA).
An overview of key policy aspects or direct relevance is provided in Relevance Table 1.
Relevance Table 1. Overview of key policy relevance for this indicator.
| Baltic Sea Action Plan (BSAP) | Marine Strategy Framework Directive (MSFD) | |
| Fundamental link | Segment: “Eutrophication”
Goal: “Baltic Sea unaffected by eutrophication”
Segment: Sea-based activities
|
Descriptor 5 Human-induced eutrophication is minimised, especially adverse effects thereof, such as losses in biodiversity, ecosystem degradation, harmful algae blooms and oxygen deficiency in bottom waters – Macrofaunal communities of benthic habitats.
|
| Complementary link | Descriptor 5 Human-induced eutrophication is minimised, especially adverse effects thereof, such as losses in biodiversity, ecosystem degradation, harmful algae blooms and oxygen deficiency in bottom waters – Macrofaunal communities of benthic habitats.
(a) in coastal waters, the values set in accordance with Directive 2000/60/EC; (b) beyond coastal waters, values consistent with those for coastal waters under Directive 2000/60/EC. Member States shall establish those values through regional or subregional cooperation.
|
|
| Other relevant legislation: | EU Nitrates Directive; EU Urban Waste-Water Treatment Directive; Industrial Emissions Directive (IED), Water Framework Directive, WFD; the Gothenburg Protocol to Abate Acidification, Eutrophication and Ground-level Ozone under UNECE Convention on Long-range Transboundary Air pollution (CLRTAP); ); EU NEC Directive; Water Code of Russian Federation; Federal Act on the internal maritime waters, territorial sea and contiguous zone of the Russian Federation; IMO designated the Baltic Sea as a ”special area” for passenger ships under MARPOL (International Convention for the Prevention of Pollution from Ships) Annex IV (on sewage from ships); EC Directive on port reception facilities; NOx emission control areas (NECA) in the Baltic and North seas designated by IMO.
UN Sustainable Development Goal 14 (Conserve and sustainably use the oceans, seas and marine resources for sustainable development) is most clearly relevant, though SDG 12 (Ensure sustainable consumption and production patterns) and 13 (Take urgent action to combat climate change and its impacts) also have relevance. |
|
2.3 Relevance for other assessments
Human activities affecting the status of the marine environment are assessed using several indicators and spatial data on pressures. Each indicator focuses on one important aspect of the complex issue. In addition to providing an indicator-based evaluation of the nutrient inputs to the marine environment, this indicator also contributes to the holistic assessment of the Baltic Sea (the State of the Baltic Sea report, HOLAS).
3 Threshold values
Environmental Target and progress towards good status
The environmental targets for nutrient inputs are the maximum allowable inputs (MAI) of the HELCOM nutrient reduction scheme (Thresholds table 1), as confirmed in the BSAP 2021 (BSAP 2021, page 22). The MAI indicate the maximal level of annual inputs of water- and airborne nitrogen and phosphorus to Baltic Sea sub-basins that can be allowed while still achieving good status in terms of eutrophication.
A provisional nutrient reduction scheme was adopted in the HELCOM Baltic Sea Action Plan (HELCOM 2007). The presented MAI were revised based on an improved scientific basis and models and were adopted by the 2013 HELCOM Copenhagen Ministerial Meeting (HELCOM 2013a). The MAI of 2013 have been incorporated in the updated BSAP that was adopted in 2021 (HELCOM, 2021).
Thresholds table 1. Maximum allowable annual inputs (MAI) of nitrogen and phosphorus to the Baltic Sea sub-basins.
| Baltic Sea Sub-basin | Maximum allowable annual nitrogen inputs (tonnes) | Maximum allowable annual phosphorus inputs (tonnes) |
| Bothnian Bay | 57 622 | 2 675 |
| Bothnian Sea | 79 372 | 2 773 |
| Baltic Proper | 325 000 | 7 360 |
| Gulf of Finland | 101 800 | 3 600 |
| Gulf of Riga | 88 417 | 2 020 |
| Danish Straits | 65 998 | 1 601 |
| Kattegat | 74 000 | 1 687 |
| Baltic Sea | 792 209 | 21 716 |
3.1 Setting the threshold value(s) (method/reference/logic)
MAI was calculated by the Baltic Nest institute (BNI), Sweden, using the coupled physical-biogeochemical model BALTSEM. Obtaining MAI is formally an optimization problem: finding the highest possible input levels (targets) that will still satisfy given eutrophication status (e.g. threshold values for eutrophication status indicators).
The basin-wise MAI were obtained by satisfying all eutrophication targets in all basins, taking into account ecological relevance and model accuracy. More details are provided in Gustafsson, B.G & Mörth, C.M, 2013 (document 2-43 HOD 41-2013).
For basins without additional reduction requirements, the 1997-2003 averaged normalized inputs obtained within the PLC 5.5 project are used as MAI. For more information, see HELCOM 2013b.
The uncertainty in the determination of MAI can be divided into three sources: uncertainty in the eutrophication targets, uncertainties associated with model short-comings and uncertainties in the input data to the calculation. The confidence in the eutrophication targets has been classified as moderate or high, depending on the parameter (HELCOM 2013c). It is straightforward but laborious to explore how MAI varies with changes in target values from the pressure-response relationships (i.e., the model derived change in target values for a given change in nutrient inputs). The laborious aspect arises from the numerous combinations of uncertainty that can arise if many indicator values and basins are simultaneously considered. However, the impression is that the nitrogen target causes the largest uncertainty in determination of MAI for most basins. Reasons are that in most cases there are no, or only few, trustworthy measurements to indicate the pre-eutrophied situation and also because the relationship between nitrogen input and concentrations in sea waters is rather weak in basins featuring hypoxia and strong nitrogen limitations (i.e. the Baltic Proper and the Gulf of Finland) because of large internal feedback from nitrogen fixation and denitrification.
When calculating MAI, attempts have been made to take into account biases in BALTSEM by discarding indicators in basins where they are not adequately modelled, and by raising a concern of whether MAI is really trustworthy because of model deficiency/bias.
Note: both MAI and nutrient input ceilings (NIC) calculations are affected by the input data to the model. If input data are inconsistent, it may cause over- or underestimation of MAI and NIC, and thus an unfair distribution of reduction requirements between countries.
4 Results and discussion
The results of the indicator evaluation that underly the key message figure 1 and information are provided below.
4.1 Status assessment
Weather in 2022 in the Baltic Sea catchment
Particularly precipitation and temperature have an impact on the amount and distribution of flow to the Baltic Sea from different parts of the catchment, and thereby on inputs of nitrogen and phosphorus. Overall rainfall over the average will result in higher-than-average flow and higher inputs of riverine total nitrogen and total phosphorus than with low rainfall and flow. High accumulation of snow on the surface combined with high temperature and snowfall can result in high flow and nutrient loads in rivers – and surface erosion. When soils in autumn and winter are saturated, precipitation will tend to reach quickly into surface waters, while rain can be absorbed in dry soils during spring and summer. The type, intensity, amount and distribution of precipitation during the year is therefore of key importance for flow and input of nutrients to the Baltic Sea.
The annual BSEFS on waterborne nitrogen and phosphorus inputs and waterflow to the Baltic Sea 1995-2022 (Svendsen and Gustafsson, 2024) include maps from Copernicus on precipitation and deviation from normal in 2022 and details on precipitation patterns. Annual precipitation in 2022 was lower than normal (1991-2020) in most of the Baltic Sea catchment areas in Denmark, Estonia, Germany, Poland, Latvia, Lithuania and southern half of Sweden, while Finland, northern half of Sweden and Russia where close to average and in some parts a little higher than normal, while catchment to Archipelago Sea was lower than average. Particularly big parts of Poland and Lithuania and parts of Latvia had precipitation up to 20-30 % below average.
Winter (December 2021-February 2022) was 5-20 % wetter than average in the southern and eastern part of Baltic Sea catchment areas and about or a 5-20 % drier than average in the northern and northwestern parts of the catchment. Spring was overall 10-30 % drier except for northern part of Sweden and Finland where it was close to normal. Summer 2022 precipitation was close to normal or a bit higher than average in the northern half of Sweden and Finland, in the northern part of the Baltic Sea catchment area, Estonia and Latvia, while the remaining parts of the catchment had lower than average precipitation; particularly Poland and Germany with up to 20-40% lower precipitation. Autumn was overall at little bit (0-5 %) or clearly drier (5-20%) in most of the catchment to the Baltic Sea.
- Denmark had record high precipitation in February (as rain), but most of the remaining months in 2022 had lower than average precipitation.
- Estonia had a very early break of frost in February resulting in replacing the usual spring flood by couple of smaller peaks. Summer low flow lasted almost to the end of December while it usually lasts until late September/early October.
- Finland to Archipelago Sea had a flow peak in wintertime with frozen soil leading to modest nutrient concentrations (and low nutrient inputs).
- Germany had very low precipitation during summer, while February and September had higher than average precipitation. The precipitation in 2022 ended 15 % lower compared with reference period 1991-2020. There was a mass mortality of fish in the lower Oder River (Germany and Poland) in August 2022 due to a harmful algal bloom (HAB) of Prymnesium parvum linked to the very dry and warm summer conditions and mining activities that caused a significant increase in salinity concentrations in the river.
- Lithuania: Some catchments received over the average precipitation and other areas under the average precipitation, resulting in over average annual flow for some rivers and under for some others.
- In Poland precipitation was very low in 2022 besides during January-February 2022.
Actual airborne and waterborne inputs and flow in 2022
In 2022 the flow was lower than average to the Baltic Sea (7.3 % under the average of 1995-2021) (Results table 1). The flow was lower than average to Kattegat (30%), Baltic Proper (19%), Danish Straits (14%) and Gulf of Riga (11%). Flow was close to average for Bothnian Sea (-3.3%), Bothnian Bay (+2.4%) and Gulf of Finland (-1.8%).
Actual total input of nitrogen in 2022 was about 740 000 tonnes, which is the lowest yearly input together with the input in 2014 during 1995-2022. The nitrogen inputs in 2022 were the lowest to Danish Straits and to Kattegat and the second lowest to Bothnian Sea during 1995-2022. Normalized yearly total nitrogen inputs in 2022 to Bothnian Sea, Danish Straits and Kattegat was the lowest during 1995-2022. Actual total phosphorus inputs were about 19,600 tonnes and the lowest yearly inputs during 1995-2022. The phosphorus input in 2022 to Baltic Proper, Gulf of Riga, Danish Straits and Kattegat was the lowest during 1995-2022. Normalized yearly total input of phosphorus in 2022 was the lowest during 1995-2022 for all basins expect for Gulf of Finland. Input in 2022 of both actual and normalized atmospheric total nitrogen was the lowest during 1995-2022 to all Baltic Sea sub-basins.
Atmospheric deposition constituted about 24% of total nitrogen inputs in 2022, the main pathway for nitrogen inputs to the Baltic Sea was via rivers (73%). The share of direct inputs (point sources discharging directly into the sea) of nitrogen was low and on average only about 3%. The total phosphorus input to the Baltic Sea in 2022 was about 24 100 tonnes and atmospheric deposition contributed with about 11% (Results table 1 and Results figure 3). The main pathway for total phosphorus was also via rivers (84%). Direct inputs of phosphorus constituted on average 5% but had a significantly higher share to some basins, for example to Danish Straits (21%).
Results table 1. Annual average water flow (m3 s-1) as well as actual annual waterborne and airborne inputs of phosphorus and nitrogen (tonnes) to the Baltic Sea sub-basins in 2022. Average flow 1995-2021 is shown for comparison.
| Sub-basin | Average flow 1995-
2021 (m3/s) |
Flow 2022
(m3/s) |
Nitrogen 2022 (tonnes) | Phosphorus 2022 (tonnes) | ||||
| Waterborne | Airborne | Total | Waterborne | Airborne | Total | |||
| Bothnian Bay | 3,445 | 3,529 | 46,374 | 6,236 | 52,610 | 2,068 | 181 | 2,249 |
| Bothnian Sea | 2,896 | 2,799 | 39,941 | 20,231 | 60,172 | 1,458 | 394 | 1,852 |
| Baltic Proper | 3,390 | 2,744 | 224,605 | 96,761 | 321,365 | 7,321 | 1,046 | 8,368 |
| Gulf of Finland | 3,537 | 3,472 | 111,045 | 11,492 | 122,536 | 3,665 | 150 | 3,815 |
| Gulf of Riga | 1,049 | 939 | 80,061 | 7,755 | 87,816 | 1,261 | 93 | 1,354 |
| Danish Straits | 215 | 184 | 26,944 | 17,427 | 44,371 | 870 | 105 | 975 |
| Kattegat | 1,075 | 755 | 34,372 | 16,302 | 50,674 | 890 | 118 | 1,009 |
| Total | 15,606 | 14,422 | 563,341 | 176,202 | 739,543 | 17,533 | 2,088 | 19,621 |
Fulfilment of MAI in 2022 and progress since the reference period (1997-2003)
According to the revised HELCOM nutrient reduction scheme adopted in the 2013 HELCOM Ministerial Declaration (HELCOM 2013a) reduction requirements were set for nitrogen inputs to the Baltic Proper, Gulf of Finland and Kattegat and for phosphorus inputs to Baltic Proper, Gulf of Finland and Gulf of Riga.
The Kattegat is the only sub-basin out of three with set reduction targets for nitrogen inputs where the input was significantly below MAI in 2022 (Key messages figure 1 and Results table 2a). However, since the reference period (1997-2003), a statistically significant reduction of nitrogen input has been achieved to all sub-basins except the Gulf of Finland and Gulf of Riga, where no reduction has been observed (Results figure 1). The highest observed input reduction was to Kattegat (28 %), Bothnian Sea (26%), and Danish Straits (23%), the lowest to the Baltic Proper (10%) (Results figure 1). Nitrogen inputs to the entire Baltic Sea have been reduced by 10% since the reference period.
None of the 3 sub-basins for which reduction targets for phosphorus inputs were set (Baltic Proper, Gulf of Finland and Gulf of Riga), fulfilled the requirements in 2022 (Key message figure 1 and Results table 2b). However, statistically significant reductions have been achieved in all sub-basins since the reference period. The highest input reductions since the reference period (1997-2003) were achieved in the Gulf of Finland (48%), Gulf of Riga (32%) and Baltic Proper (26%) (Results figure 1). Phosphorus inputs to the entire Baltic Sea have been reduced by 32% since the reference period, and about 65% of this reduction is due to reduced phosphorus inputs to the Gulf of Finland and Baltic Proper.
Trend estimated airborne and waterborne nitrogen inputs including uncertainties are also assessed for the Baltic Sea and its sub-basins and compared with the trend estimated total nitrogen inputs including uncertainties in result table 3.
Results table 2a and b. The trend-based estimate for normalized annual inputs of (a) nitrogen and (b) phosphorus during 2022.
The table also contains data on statistical uncertainty, the remaining reduction needed to reach MAI and inputs in 2022 including statistical uncertainty in percentages of MAI. Classification of achieving MAI is given in colours: green=MAI fulfilled, yellow= fulfilment is not determined due to statistical uncertainty, and red=MAI not fulfilled. (Units in columns 2-5: tonnes per year). NOTE: For consistency with MAI no rounding (to tenth, hundreds or thousands) has been performed in the indicator.
Table 2a.
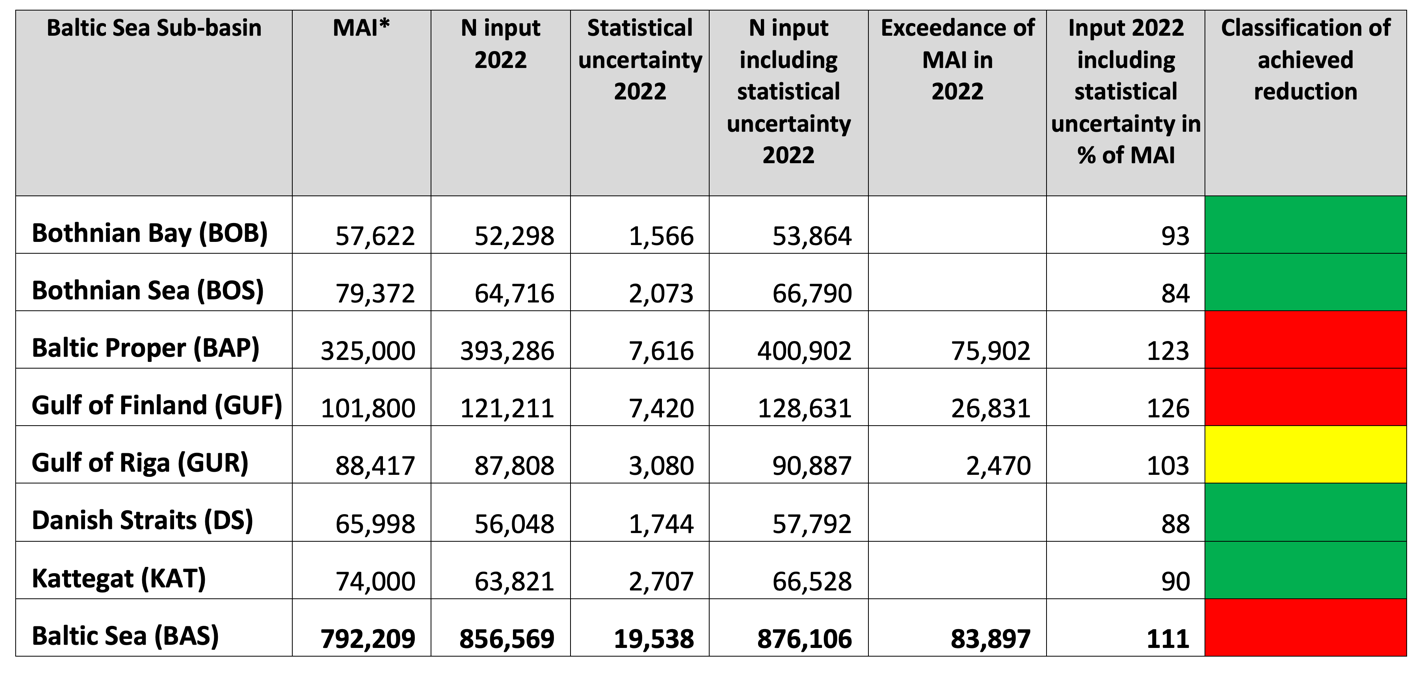
Table 2b.
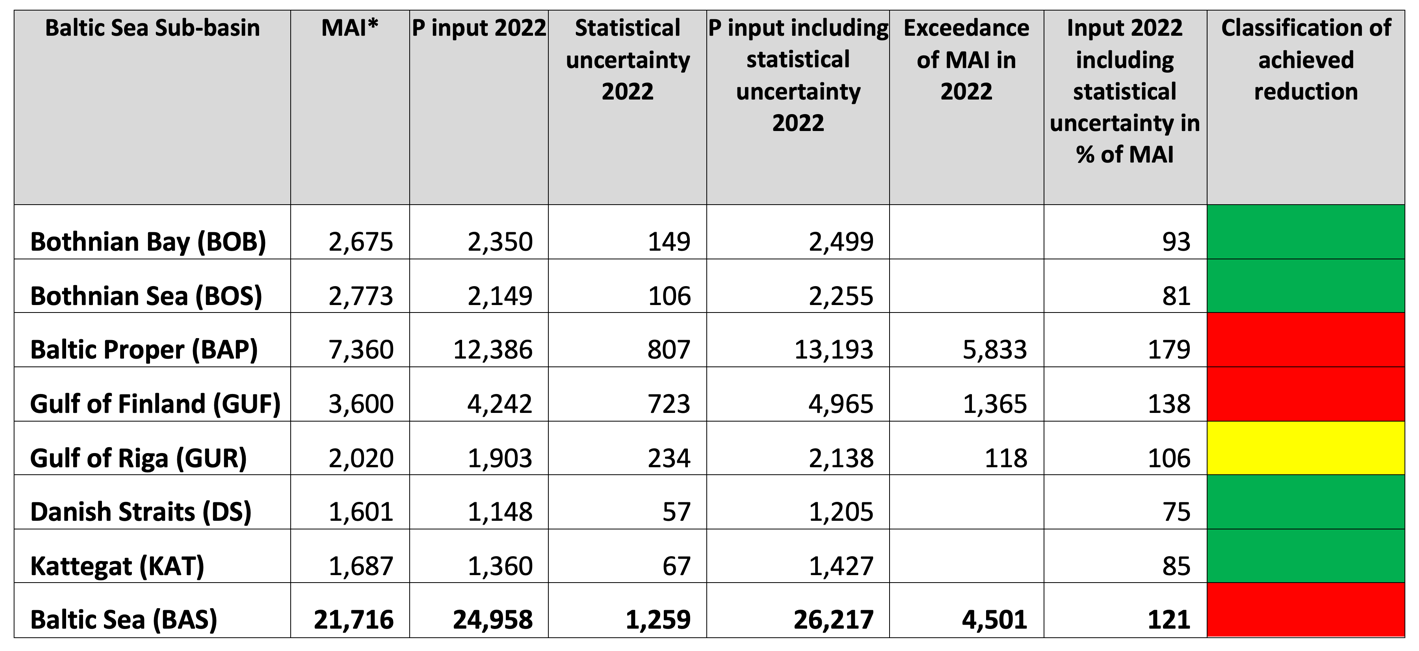
*As adopted by the 2013 HELCOM Copenhagen Ministerial Meeting (HELCOM 2013a) and in BSAP update 2021 (HELCOM, 2021)
Results table 3. Trend estimated airborne, waterborne and total nitrogen inputs to sub-basin and to the Baltic Sea and sub-basins in 2022. The estimates include uncertainty on the trend estimated inputs.
| Nitrogen inputs in 2022 (tonnes) | |||
| Airborne | Waterborne | Total | |
| Bothnian Bay | 6.565 | 47.283 | 53.864 |
| Bothnian Sea | 20.994 | 45.940 | 66.790 |
| Baltic Proper | 104.963 | 311.169 | 400.902 |
| Gulf of Finland | 12.585 | 115.367 | 128.631 |
| Gulf of Riga | 81.3.2 | 80.359 | 90.887 |
| Danish Straits | 19.563 | 35.583 | 57.792 |
| Kattegat | 17.394 | 44.744 | 66.528 |
| Baltic Sea | 190.111 | 667.776 | 876.106 |
Compared to the first evaluation of MAI fulfilment (Svendsen et al. 2015), in 2016 EMEP revised the modelled nitrogen air deposition to the Baltic Sea for 1995-2012. This resulted in an increase of the annual deposition to the Baltic Sea of 16 to 23%. The increase of annual nitrogen deposition to the individual sub-basins was between 9 and 27 %. The EMEP deposition model was updated further after the second MAI assessment (HELCOM, 2018). The update mainly concerned changing of the deposition grid resolution from 50km*50km to 0.1°*0.1° (approx. 11km*6km grid cells in the Baltic Sea). The higher resolution was applied for computation of the annual nitrogen deposition 2000-2017, and for the present MAI assessment 1995- 2022 (Gauss et al., 2024). Also, the whole time series of nitrogen emission data is updated annually, and this yearly emission data for 1990-1994 was also available. For years since 2000 the data from FMI on ship emissions have replaced former ship emission data in the deposition calculation. The update of the model, revised reported emission data and use of weather data in the normalization procedure (section “Airborne Inputs” under chapter “Data and updating”) resulted in markedly changed deposition data compared to the previous reporting. Deposition on the Baltic Sea in the reference period (1997-2003) was 294 000 tons nitrogen in the latest EMEP estimate, compared to 227 000 tons nitrogen previously estimated, or 29.5% higher than calculated for the BSAP in 2013. The nitrogen deposition in the reference period showed the highest change in the Gulf of Finland (40%) and Kattegat (39%) and the lowest in the Gulf of Riga (19%).
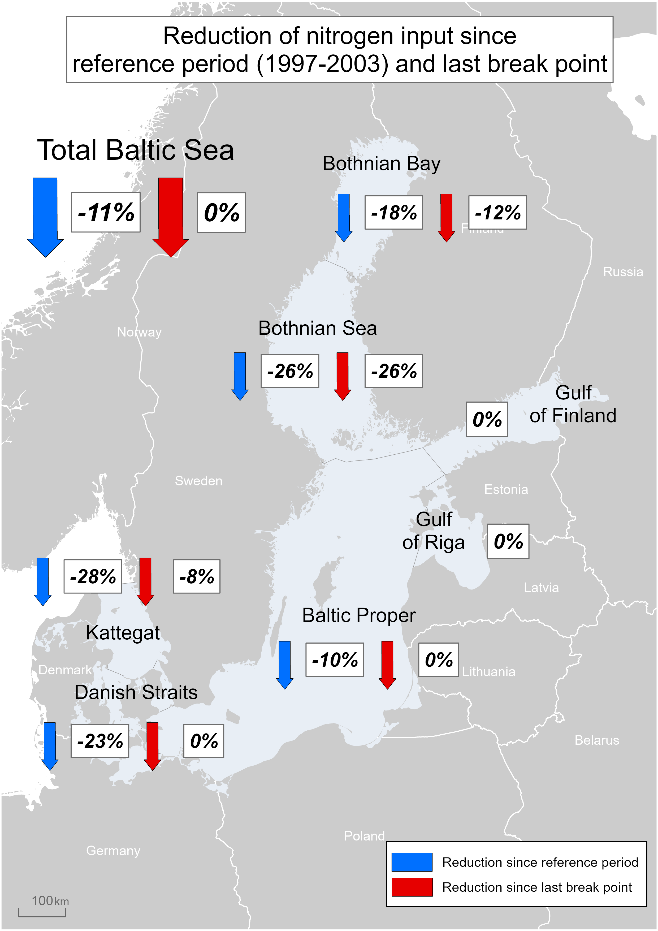
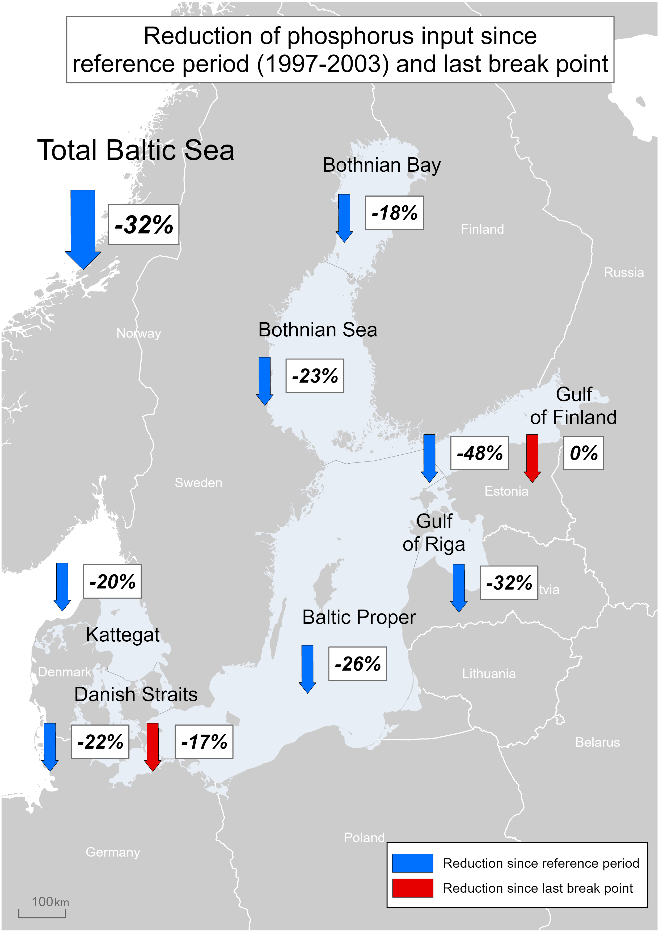
Results figure 1. Significant reductions of total annual inputs of nitrogen (left) and phosphorus (right) achieved in 2022 (in %) since the reference period 1997-2003 (blue arrow) and recent changes (red arrow), where recent changes are significant changes since last breakpoint of the timeseries. The annual inputs in 2022 and in the reference period (1997-2003) were calculated using normalized annual data. The arrows indicate decreasing (↓) inputs, and only significant changes are shown (n.r. = not relevant because there are no breakpoints in the trend line). Years with breakpoint are in results tables 6a and 6b, respectively.
Changes in total inputs of nitrogen and phosphorus since the reference period are calculated based on the average normalized inputs in the reference period and the estimated inputs in 2022, resulting from the analysis of long-term trends (1995-2022) (Larsen & Svendsen, 2021). Based on the updated modelled annual nitrogen deposition in 2022 there was a significant reduction since the reference period for all sub-basins. The overall reduction to the Baltic Sea in nitrogen deposition was 36%. For the sub-basins, the reduction was between 33 and 39%, and was highest for Kattegat and lowest for Gulf of Finland and Gulf of Riga.
Phosphorus deposition on the Baltic Sea is calculated as a fixed annual rate of 5 kg P per km2 sea surface (see section “9.3 Monitoring methodology” of this indicator) during 1995-2021.
By 2022 the reduction in atmospheric nitrogen deposition since the reference period contributes overall more than the corresponding waterborne nitrogen reductions to the reduction in total nitrogen inputs to the Baltic Sea (Results table 4). For Baltic Proper, Gulf of Finland and Gulf of Riga there were no significant reductions in the total waterborne nitrogen inputs, and for Baltic Proper there was a significant increase in these inputs (with (% since the reference period). Only for Bothnian Bay and Kattegat airborne reduction had a share that was lower than 50% of the total reductions in nitrogen inputs, with shares of 35 and 45%, respectively.
Results table 4. Significant reductions in airborne nitrogen deposition, waterborne and total nitrogen inputs (tons) in 2022, respectively, as compared with the reference period (1997-2003) for the Baltic Sea and basins of the Baltic Sea, and the airborne deposition share (%) of the reduction. “-“ = no significant trend. 100% = there was no significant reduction in waterborne nitrogen inputs or a significant increase (Baltic Proper). Remark: Significant reductions have been tested separately for airborne, waterborne, and total (airborne + waterborne) TN inputs, and therefore sums of significant reductions on airborne and waterborne inputs will not necessarily add up to the significant reduction of the total nitrogen inputs. Correspondingly, the airborne shares have been scaled according to the reduction of total nitrogen inputs.
| TN reductions | BOB | BOS | BAP | GUF | GUR | DS | KAT | BAS |
| Airborne (tonnes) | 3,898 | 11,867 | 57,680 | 6,263 | 3,943 | 11,553 | 10,953 | 106,162 |
| Waterborne (tonnes) | 7,386 | 10,606 | -21,478 | – | – | 7,942 | 17,134 | 18,755 |
| Total TN inputs (tonnes) | 11,273 | 22,278 | 45,239 | – | – | 16,078 | 24,484 | 126,706 |
| Airborne reduction in % of total TN input reduction | 35 | 53 | 100 | 100 | 100 | 72 | 45 | 84 |
4.2 Trends
Normalization is used for the annual riverine and atmospheric inputs to reduce the impact of inter-annual variations of the inputs caused by weather conditions (primarily variations in precipitation). With normalization, the comparability of the inter-annual inputs increases, facilitating trend detection and identification of effects of undertaken measures in the catchment areas (Larsen & Svendsen, 2021). Without normalization, the effects could be disguised by large natural annual variation of precipitation and river flow.
When assessing trends on timeseries of total nitrogen and total phosphorus inputs, for atmospheric nitrogen inputs and waterborne nitrogen and phosphorus inputs, breakpoints in the trend lines are also identified (Results figures 2a-e). For the Baltic Sea and the sub-basins except the Gulf of Riga, one or two break points were identified when evaluating the trends of total nitrogen inputs, dividing the time series 1995-2022 into two or three sections (see also results table 6a). The Baltic Sea and five sub-basins had significant reductions in total inputs of nitrogen since the reference period. There was significant decrease in total nitrogen inputs since last break point (also called recent changes) only for three sub-basins: Bothnian Sea (26% after breakpoint in 2003), Bothnian Bay (12%, 2008) and Kattegat (8.2%, 2012). A significant nitrogen input increase was observed to Gulf of Finland (25%, 1995-2004) and to Bothnian Bay (9%, 1995-2008).
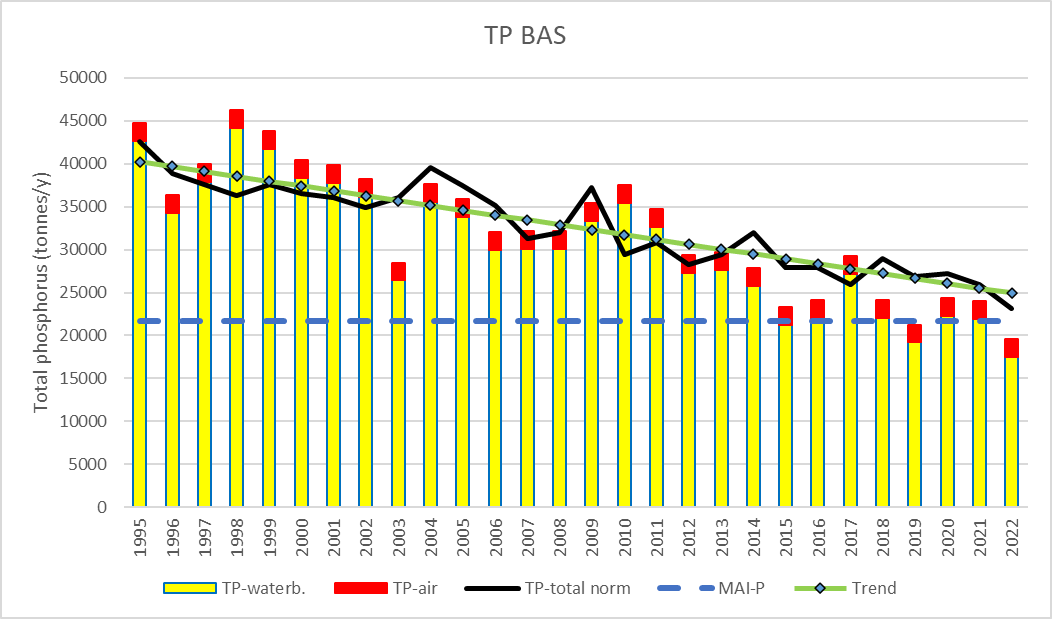
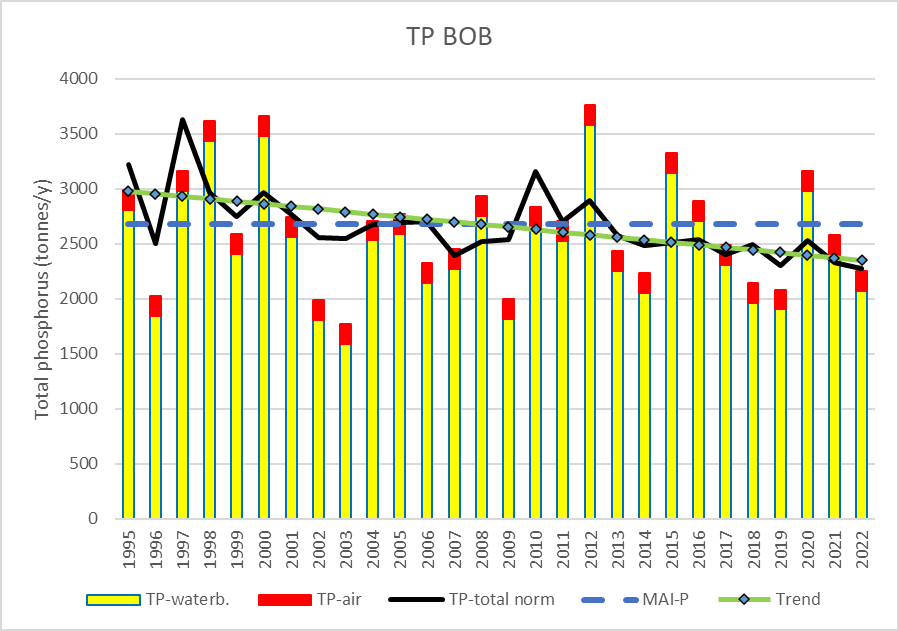
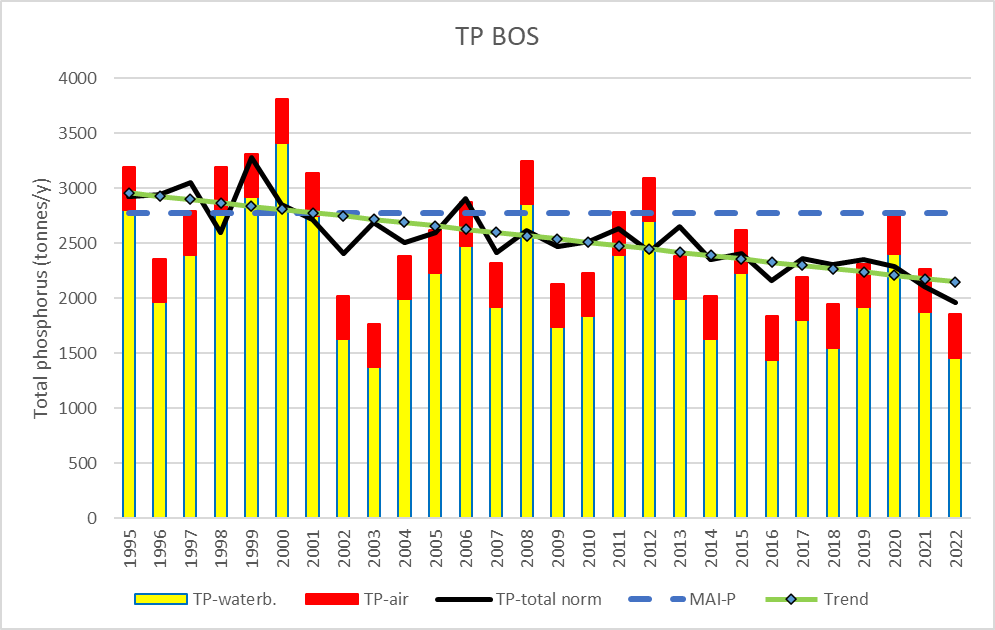
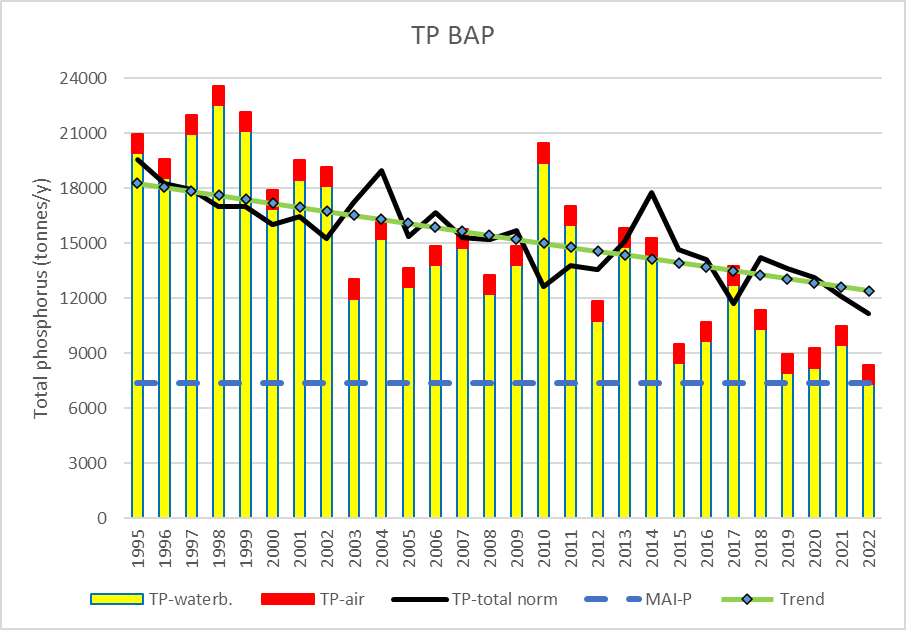
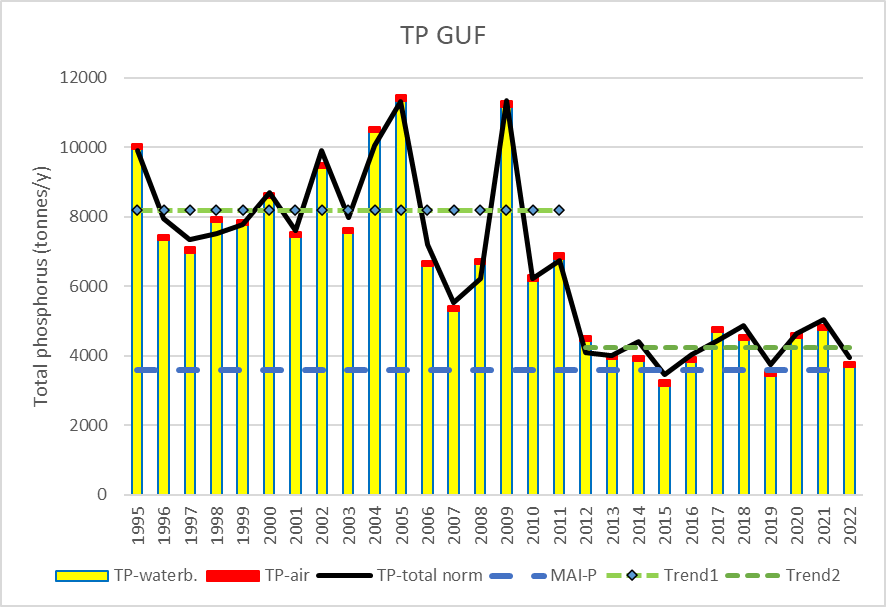
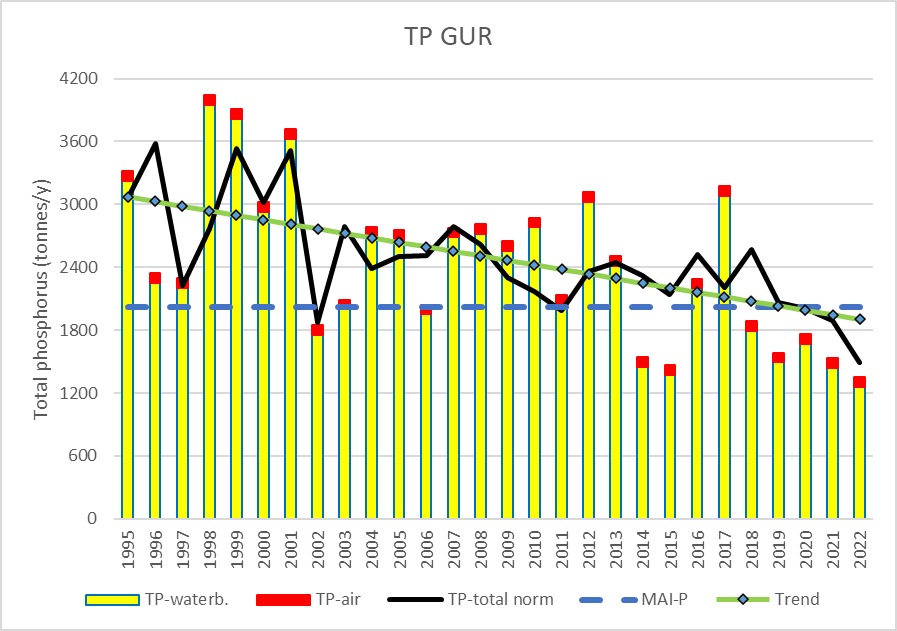
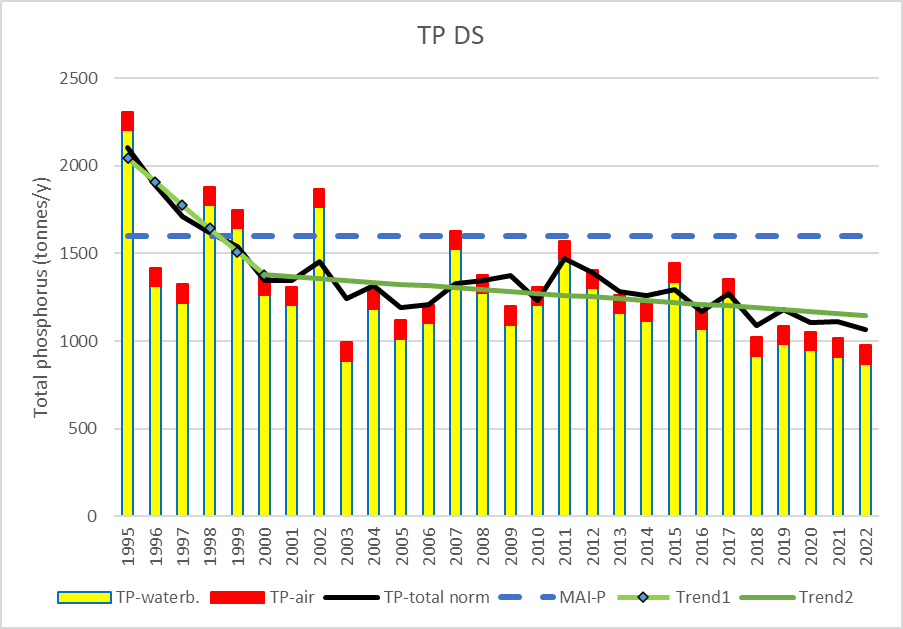
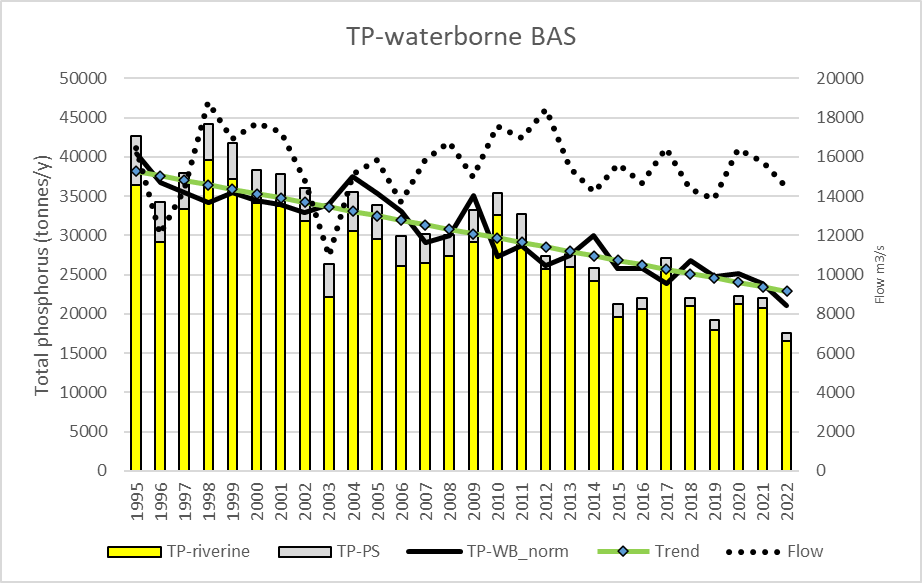
For total phosphorus inputs to the Baltic Sea the trends revealed a steady statistically significant reduction since 1995 to the Baltic Sea and all sub-basins besides Danish Straits and Gulf of Finland (Results figure 2b and results table 6b). Break points were detected for two sub-basins: Danish Straits and Gulf of Finland. For Danish Straits total phosphorus inputs decreased with 17% after the break point in 2000. For Gulf of Finland total inputs of phosphorus on average were 48 % lower after the break point in 2012, but with no trend in inputs before and after the breakpoint. The marked abrupt reduction in total phosphorus inputs after 2011 for Gulf of Finland is probably connected to rapid changes of inputs due to measures on point sources in the Russian catchment. There was a marked reduction, despite large interannual variation preventing efficient flow normalization. This resulted in a high uncertainty in the total inputs of phosphorus to the Gulf of Finland (17% according to Results table 2b). In addition, Gulf of Riga had a rather high uncertainty on estimated phosphorus inputs in 2022 (12 %) compared with the remaining five sub-basins (5-7%). For estimated total inputs of nitrogen in 2022 the uncertainty was also highest in the Gulf of Finland (6%), and the uncertainty on inputs in the remaining sub-basins was between 2 and 4% (according to Results table 2a).
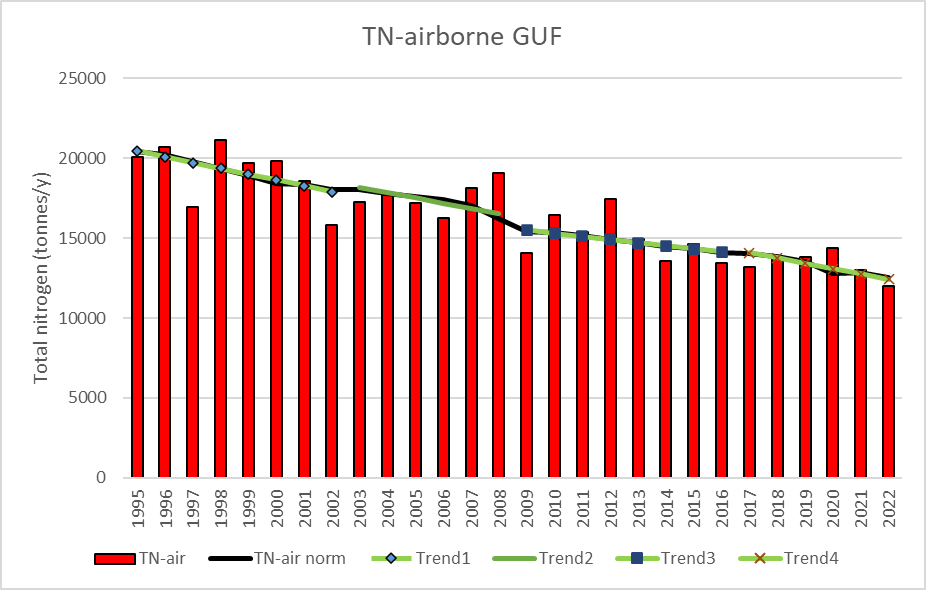
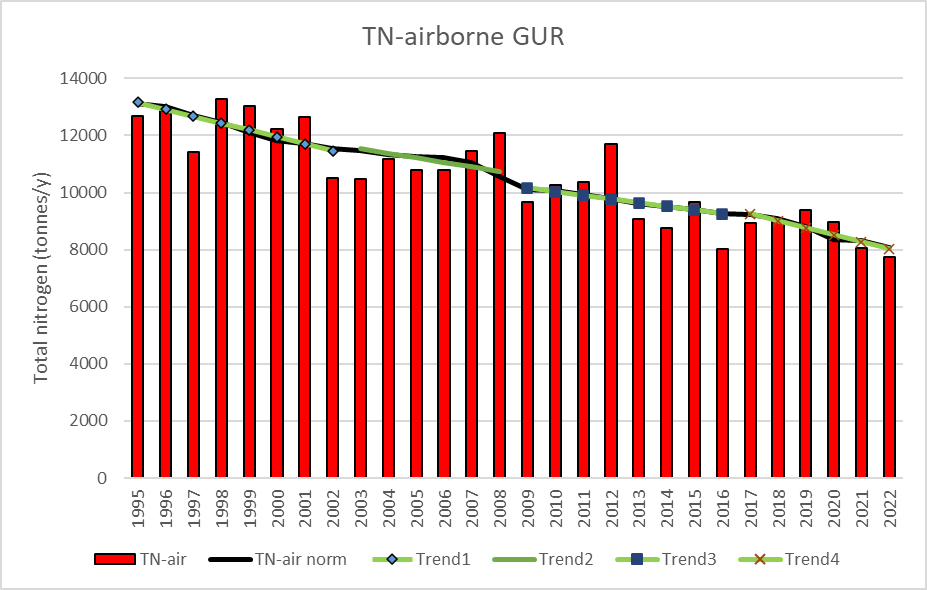
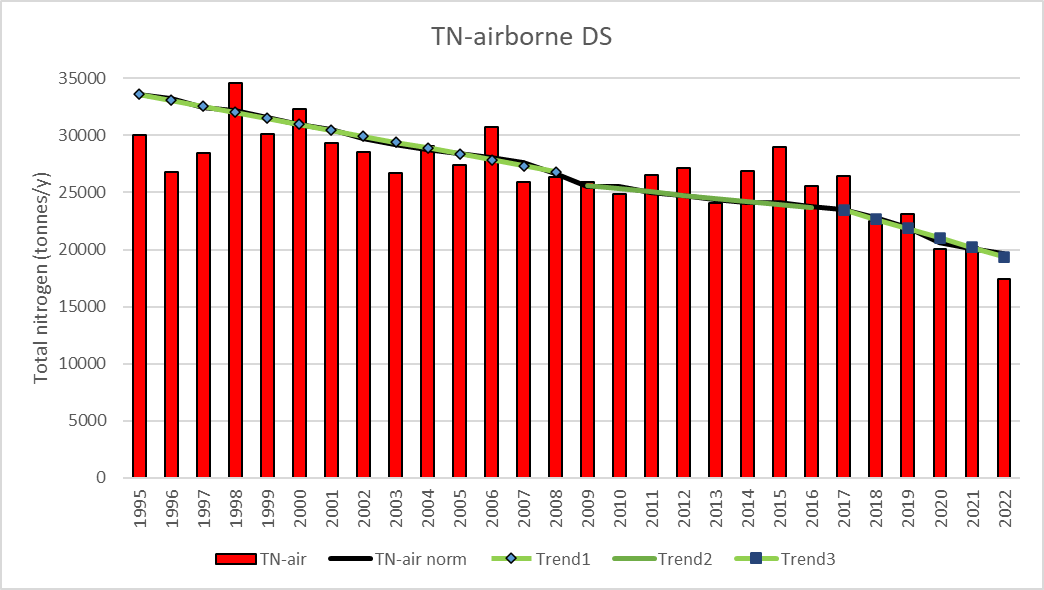
Trend analysis of the normalized timeseries of airborne inputs of nitrogen showed a significant decrease to the Baltic Sea and to the seven sub-basins since the reference period (Results table 4, Results figure 2c and Results table 6a). For the Baltic Sea and all basins except Danish Straits and Kattegat there are three break points: in 2003, 2009 and 2017; and for Danish Straits and Kattegat only two: in 2009 and 2017. For Baltic Sea and all basins there are significant decreases for all segments of the trend line. Recent decreases (after the last breakpoint in 2017) is 15% to Baltic Sea and ranges between 12% to Gulf of Finland to 18 % to Danish Straits or an annual decrease between 2.4 to 3.5%.
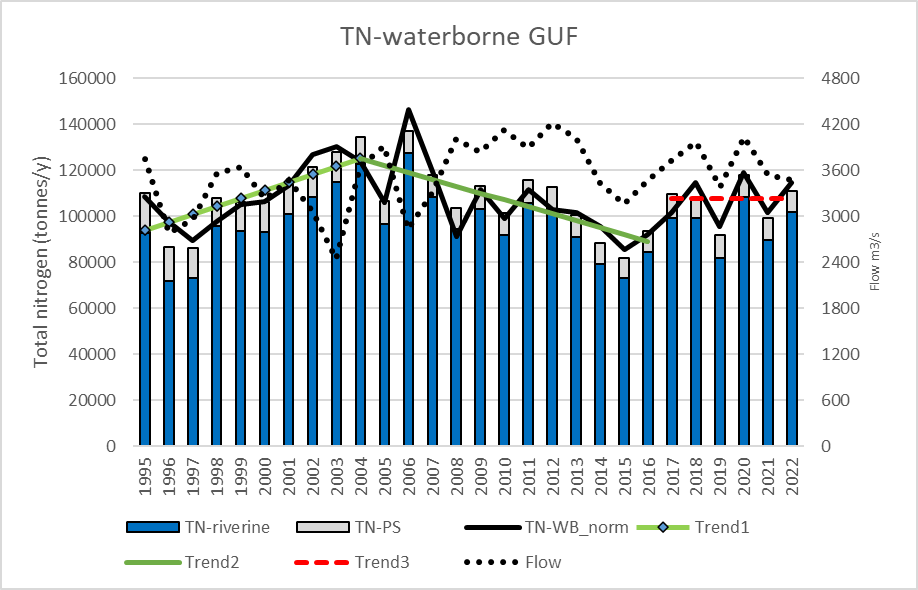
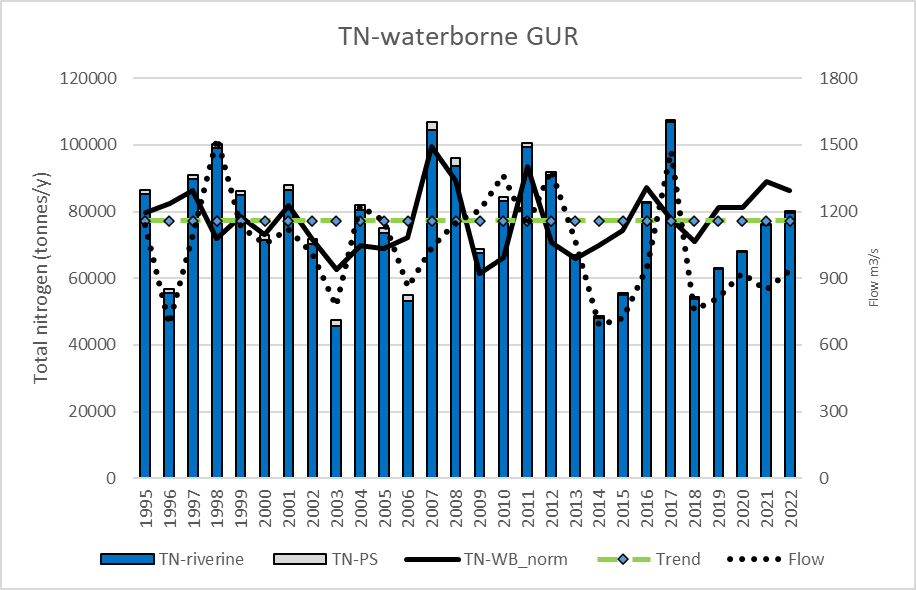
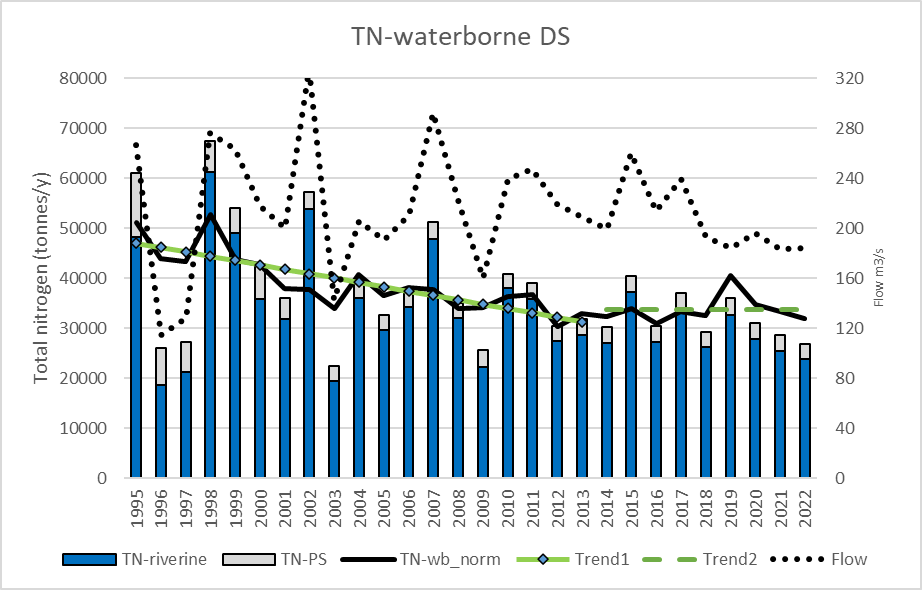
Trend analysis of the normalized waterborne nitrogen inputs showed a significant decrease since the reference period for only four sub-basins: Kattegat (29%), Baltic Proper, Danish Straits (19%) and Bothnian Sea (14%) (Results figures 2d, Results table 4 and Results table 6a). There was an increase in waterborne nitrogen inputs to Bothnian Bay (7.8%) and no trend to the Baltic Sea, Gulf of Riga and Gulf of Finland. One breakpoint is identified for Baltic Sea and four basins, and two breakpoints for Baltic Proper and Gulf of Finland. No break points have been identified for the waterborne nitrogen inputs to Gulf of Riga.
Only two sub-basins have significant recent reductions: Bothnian Sea with 22% since 2003, and Bothnian Bay 9.4% since 2008. For Baltic Proper the recent change is an increase since 2009 with 19% (an annual increase of 1.6%). Waterborne nitrogen inputs increased with 33% to Gulf of Finland from 1995 to 2004 and decrease with 29% between 2004 and 2017, and to Baltic Proper there was a decrease with 29% from 1995 to 2002 and no trend between 2002 and 2009. For Bothnian Sea waterborne nitrogen inputs an increase with 9% from 1995 to 2003 and for Baltic Sea a decrease with 16% from 1995 to 2016, and since then no trend is seen.
Testing for trends in flows indicated a significant decrease in flow to Baltic Proper (25% 1995 to 2022) and a significant increase in flow to Gulf of Finland (16% 1995-2022). These trends might have an impact on the trend evaluation in the waterborne inputs to the two sub-basins.
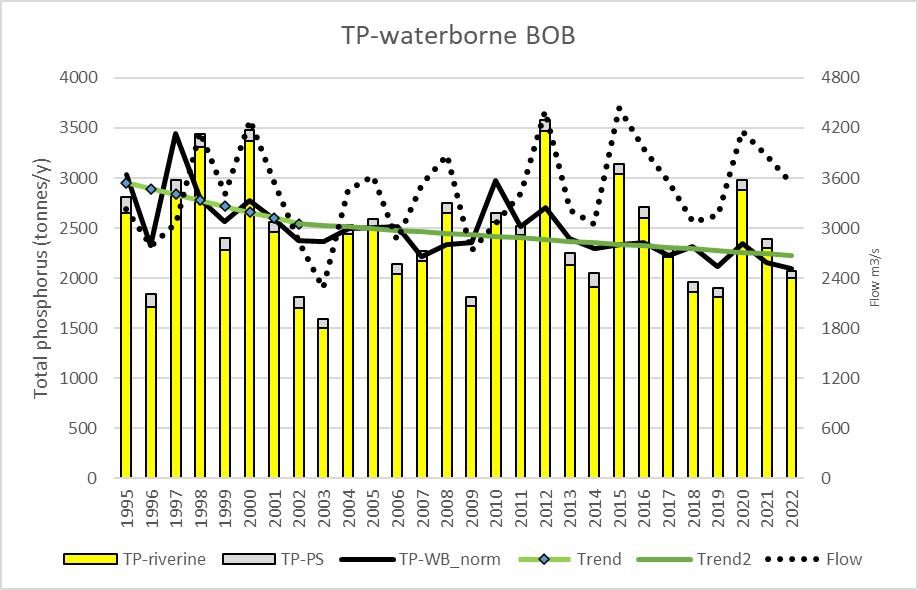
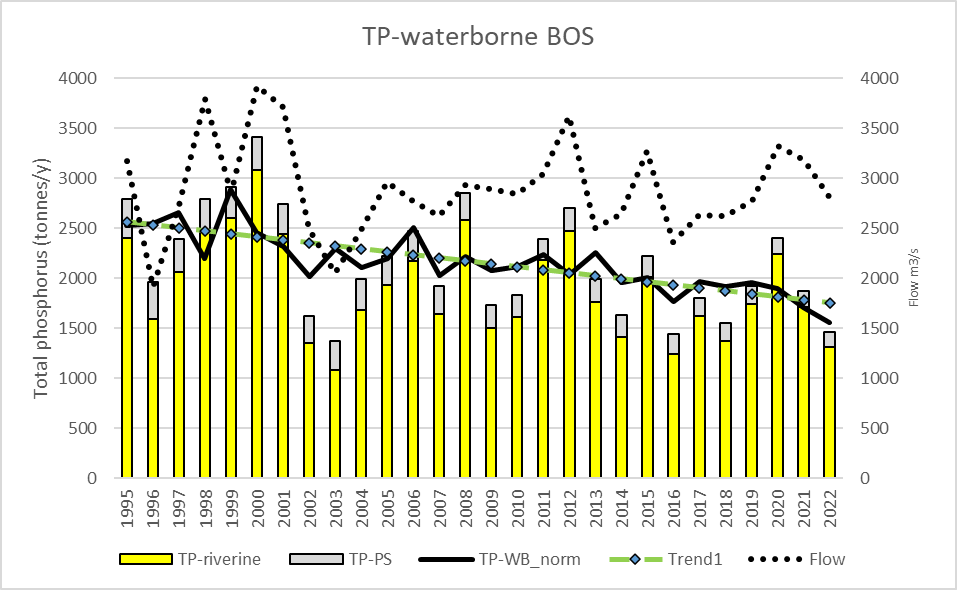
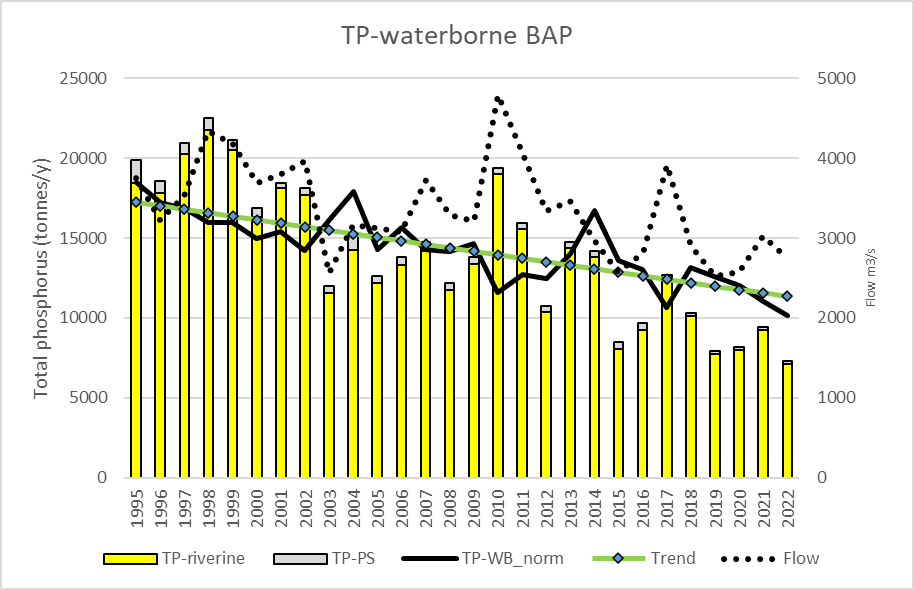
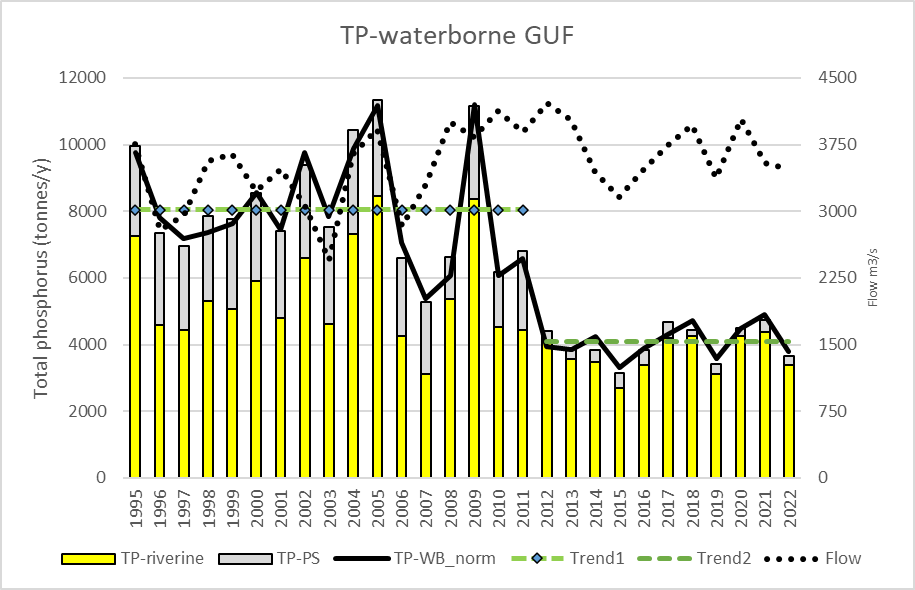
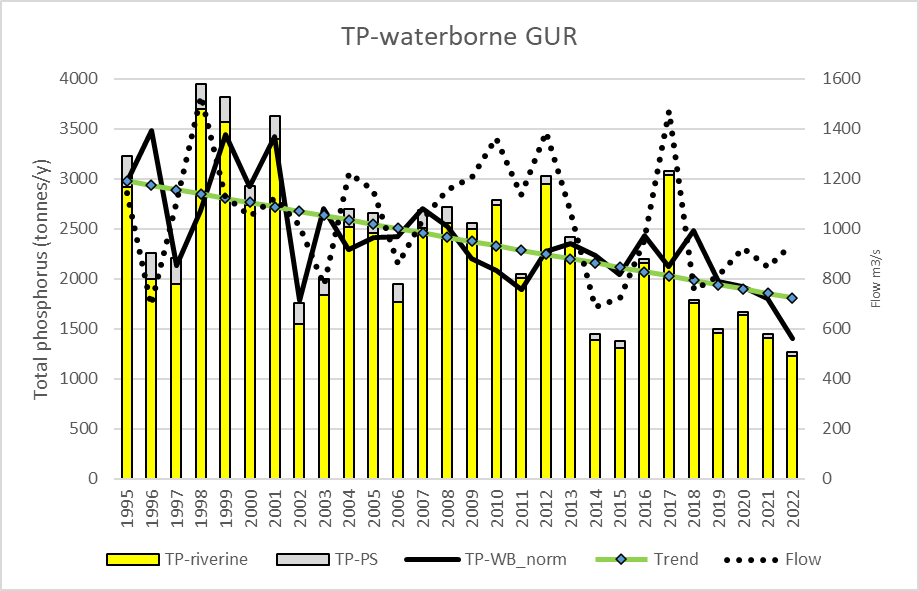
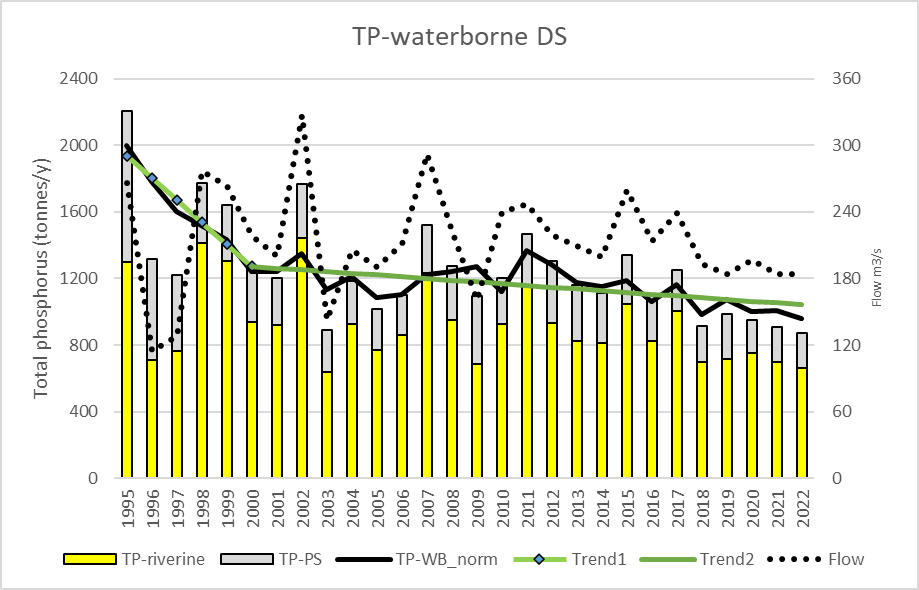
Trend analysis of the normalized waterborne phosphorus inputs showed a significant decrease since the reference period to the Baltic Sea and the seven sub-basins (Results figures 2e, Results table 4 and Results table 6b). The highest reduction was to Gulf of Finland (49%) and Gulf of Riga (34%), and the lowest reduction was found to Kattegat (21%) and Bothnian Bay (17%). The reduction to the Baltic Sea was 33%. A breakpoint in the timeseries was identified for three basins: Danish Straits (2000), Bothnian Bay (2002) and Gulf of Finland (2012). Danish Straits (34%) and Bothnian Bay (14%) had significant reduction the breakpoints, and further had significant reduction after the breakpoints, 18% and 12%, respectively. For Gulf of Finland there is an abrupt breakpoint, resulting in markedly lower waterborne phosphorus inputs after the breakpoint (49% for Gulf of Finland). Abrupt jumps are often related to markedly improved wastewater treatment as occurred to Gulf of Finland around 2012, which is seen in Result Figure 3e as a marked reduction in direct point source inputs.
 |
 |
 |
 |
 |
 |
 |
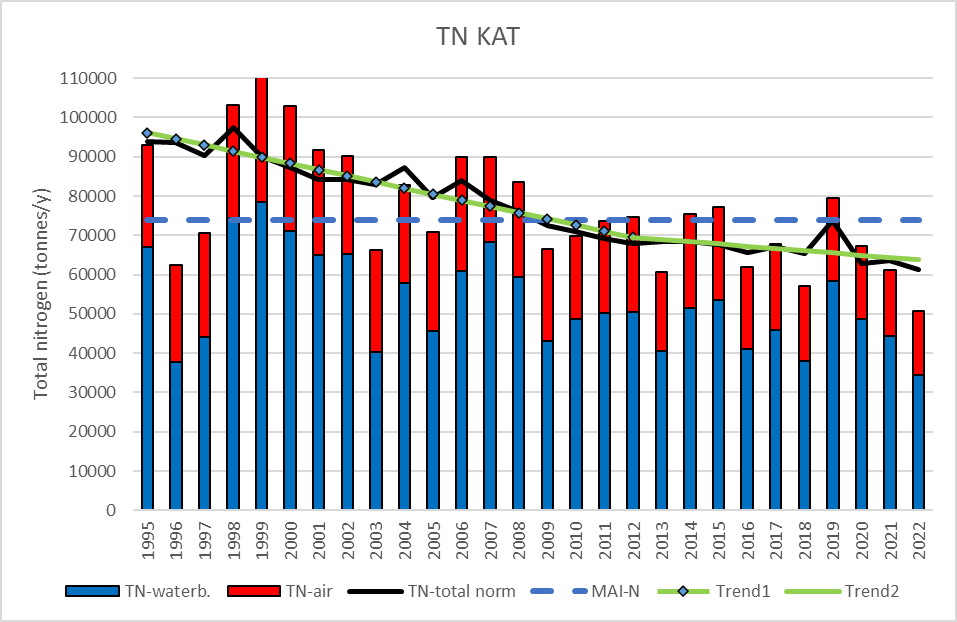 |
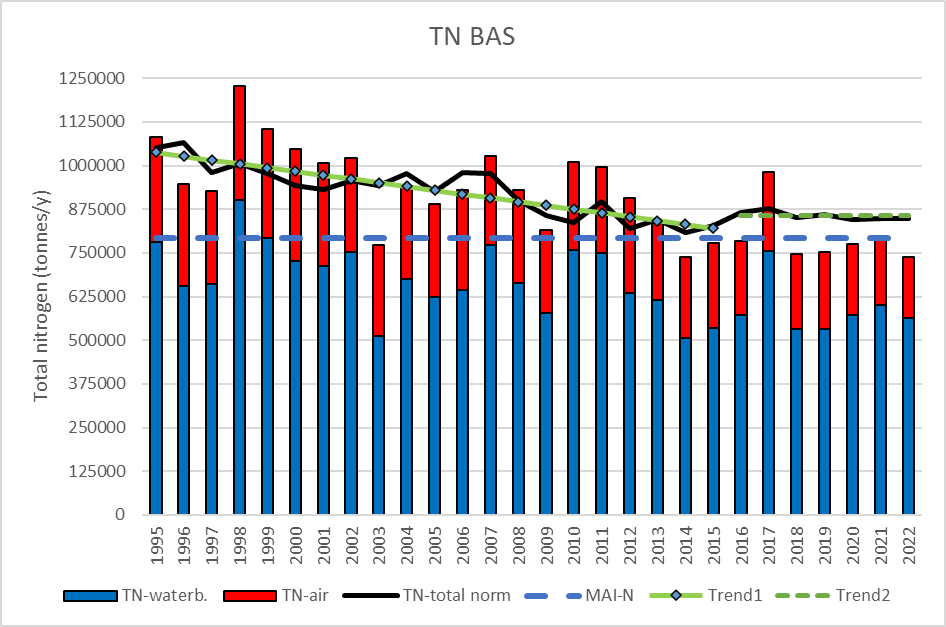
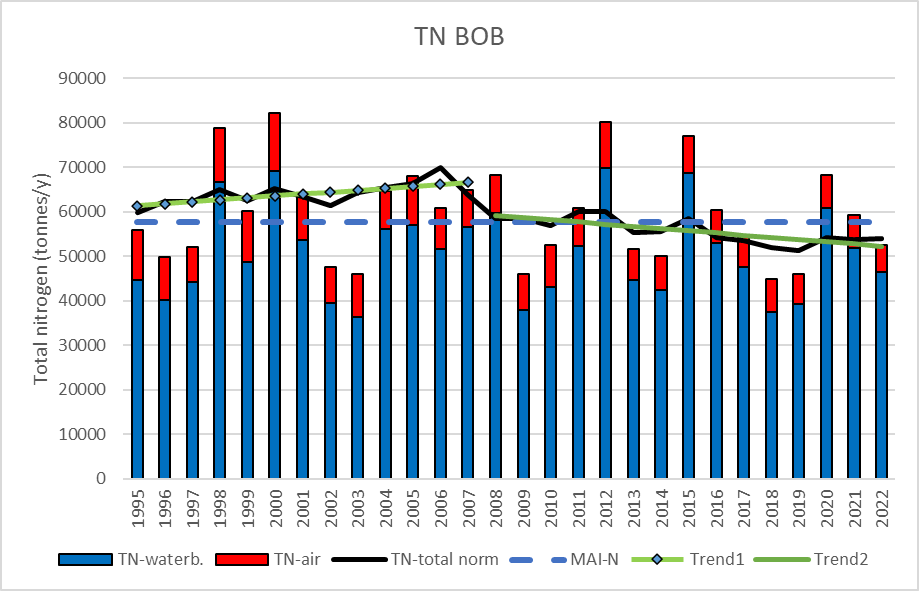
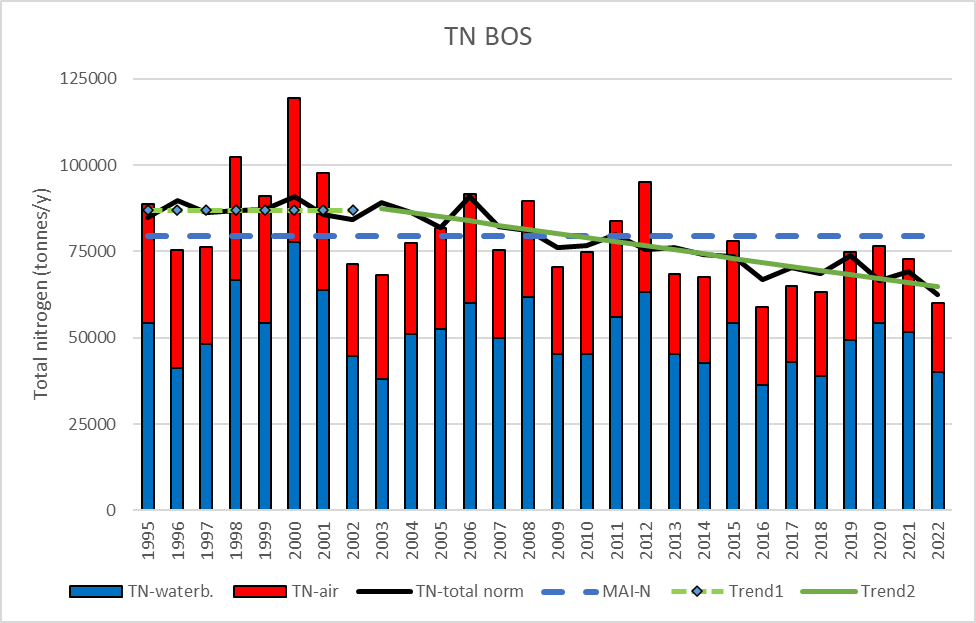
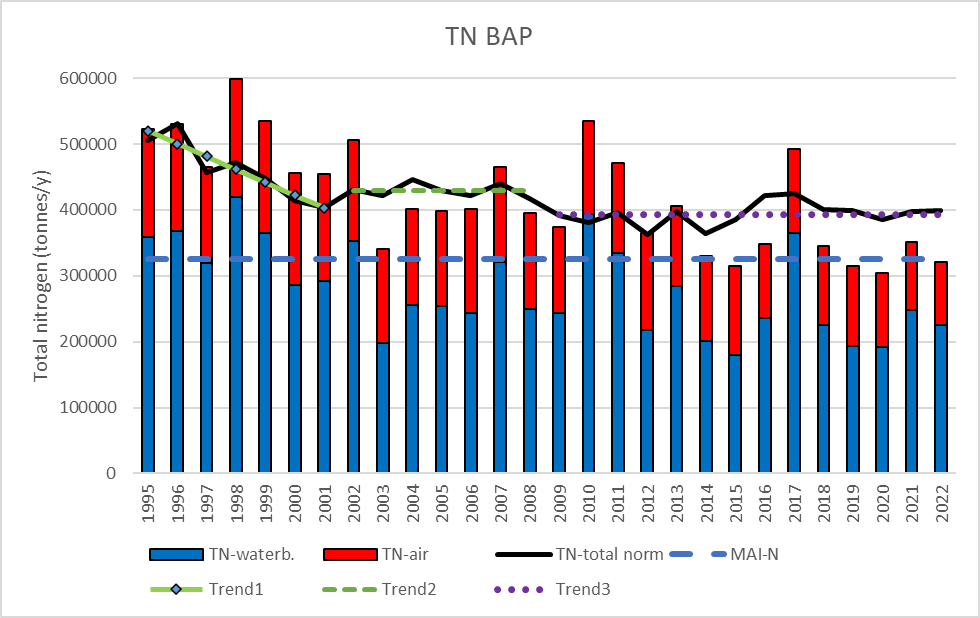
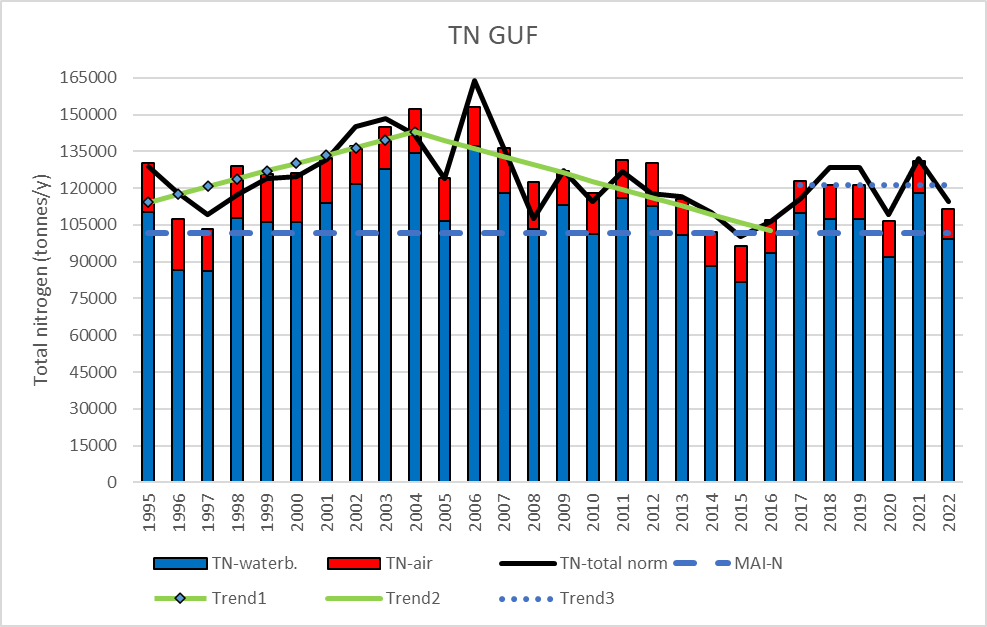
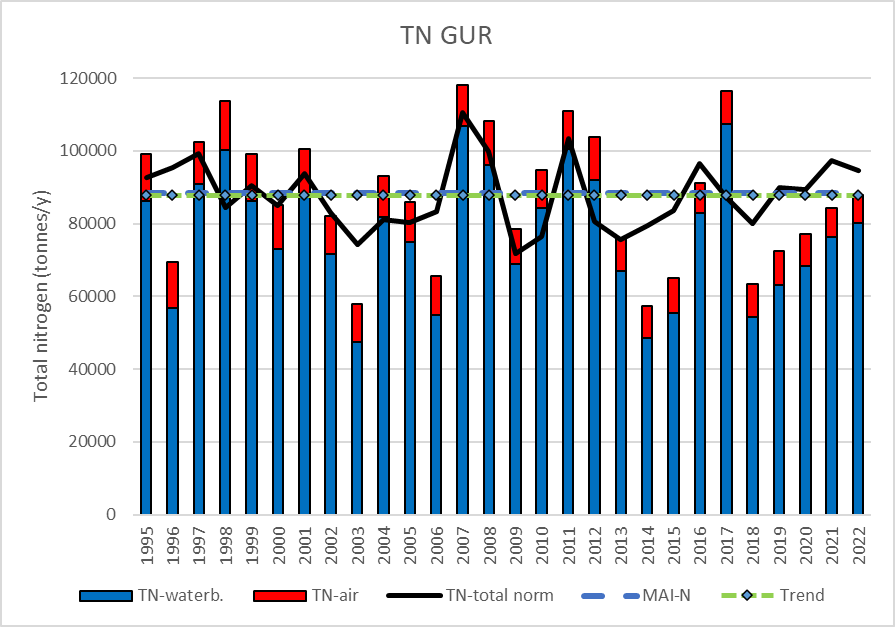
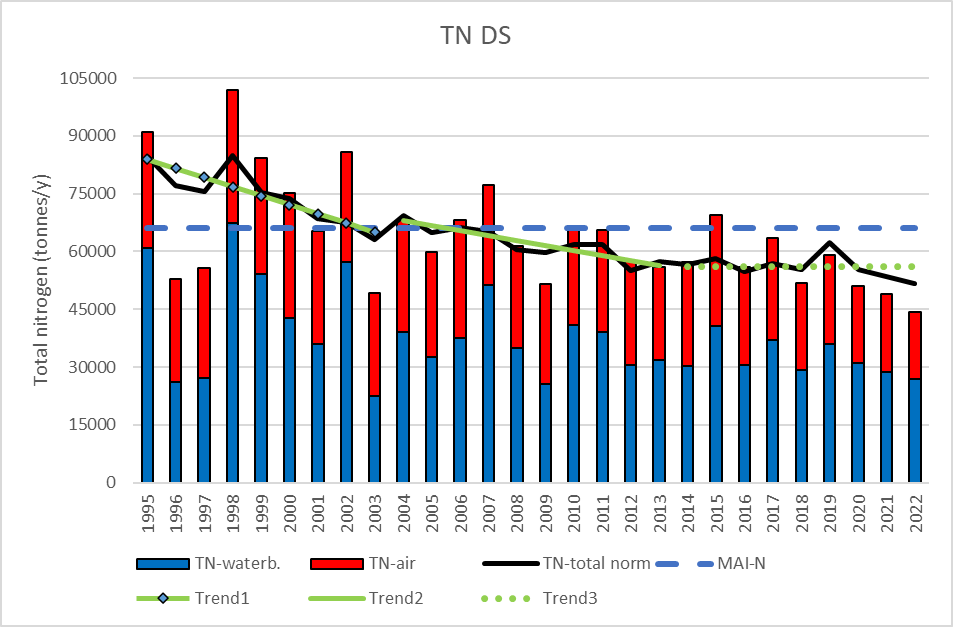
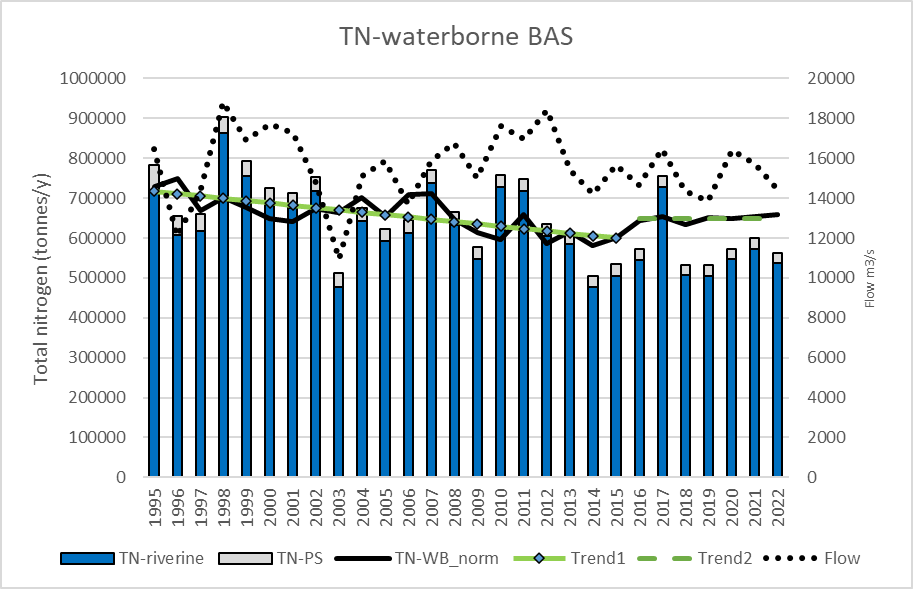
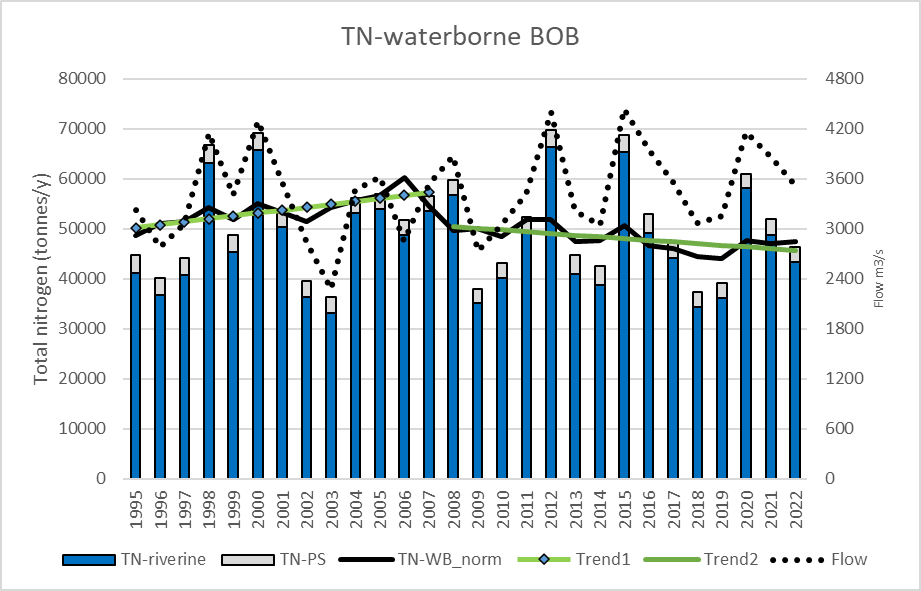
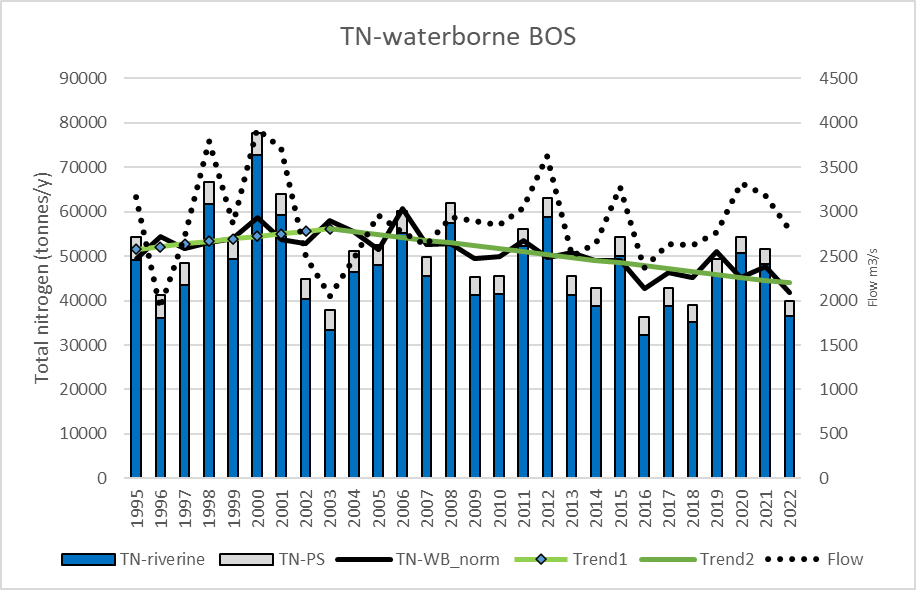
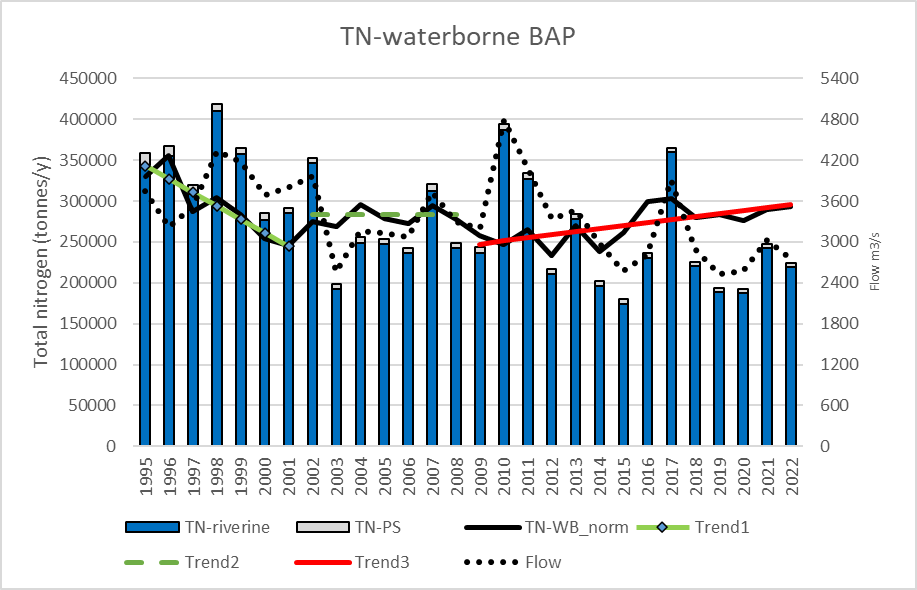
Results figure 2a. Actual total air- and waterborne annual input of nitrogen (TN) to the Baltic Sea and sub-basins from 1995 to 2022 (tonnes/y). The normalized total annual inputs of nitrogen are given as a black line. The trend line for normalized total nitrogen is given as a green line with markers. In cases when a break point divides the trend into two parts, the second part (called trend 2) is shown by a green line without marker. In cases with two breaks points the third part (called trend 3) is indicated as a purpleline. (Solid trend line shows statistically significant trend and dotted line no statistically significant trend). The MAI as adopted by the 2013 HELCOM Copenhagen Ministerial Meeting (HELCOM 2013a) is shown as the bold dotted blue line.
 |
 |
 |
 |
 |
 |
 |
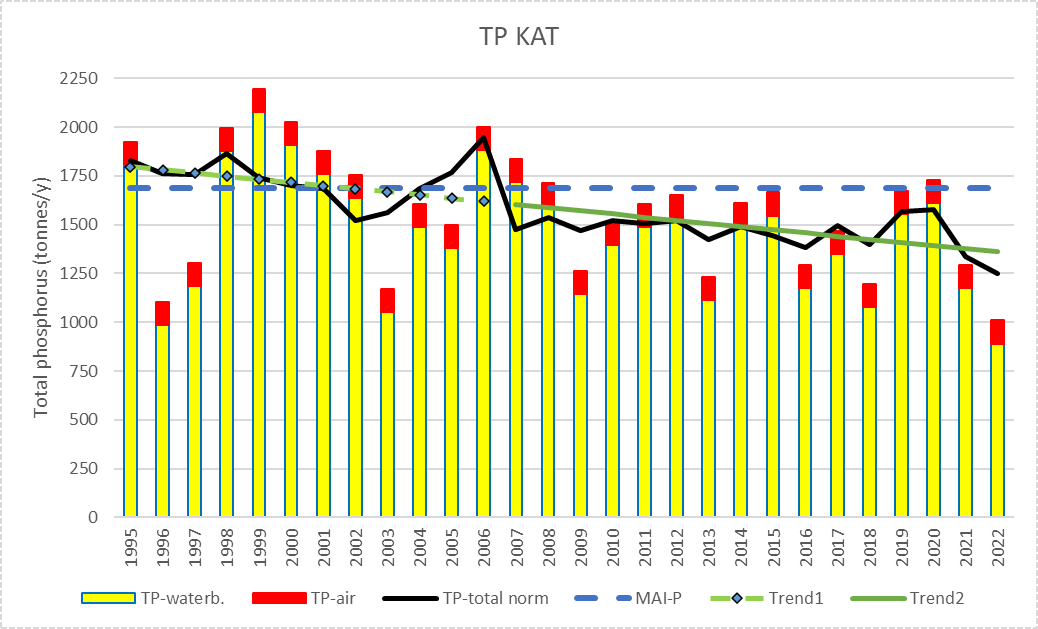 |
Results figure 2b. As figure Result 2a but for phosphorus (TP).
 |
 |
 |
 |
 |
 |
 |
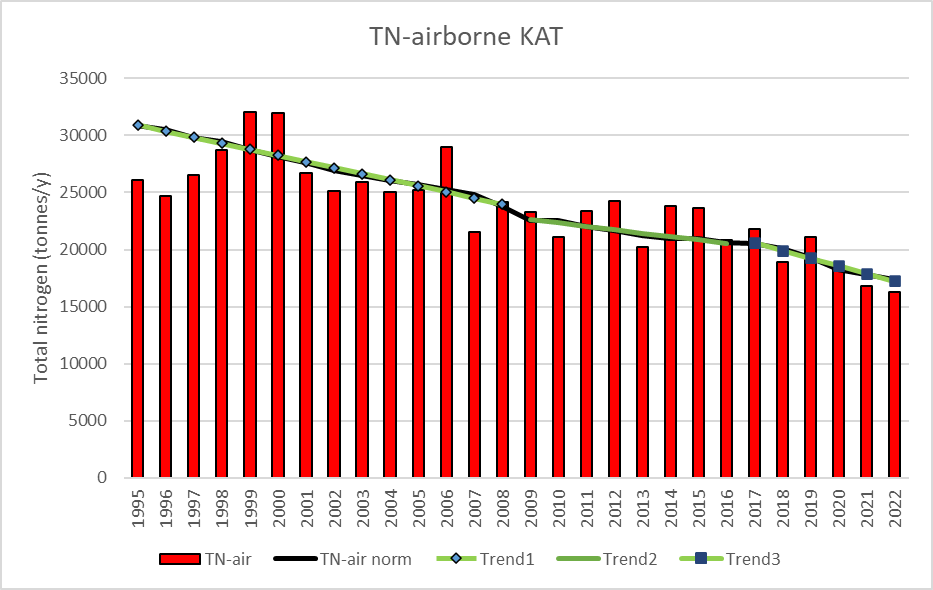 |
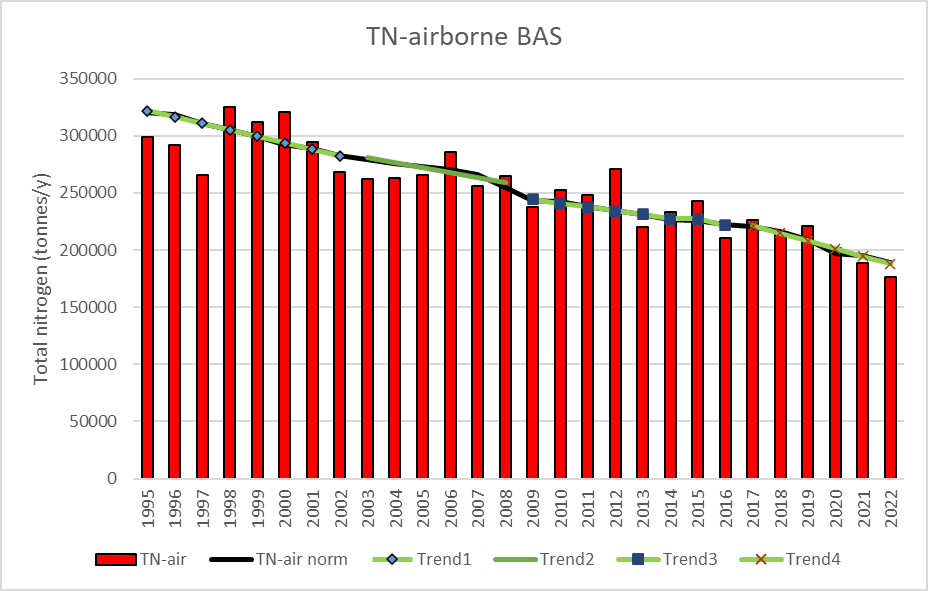
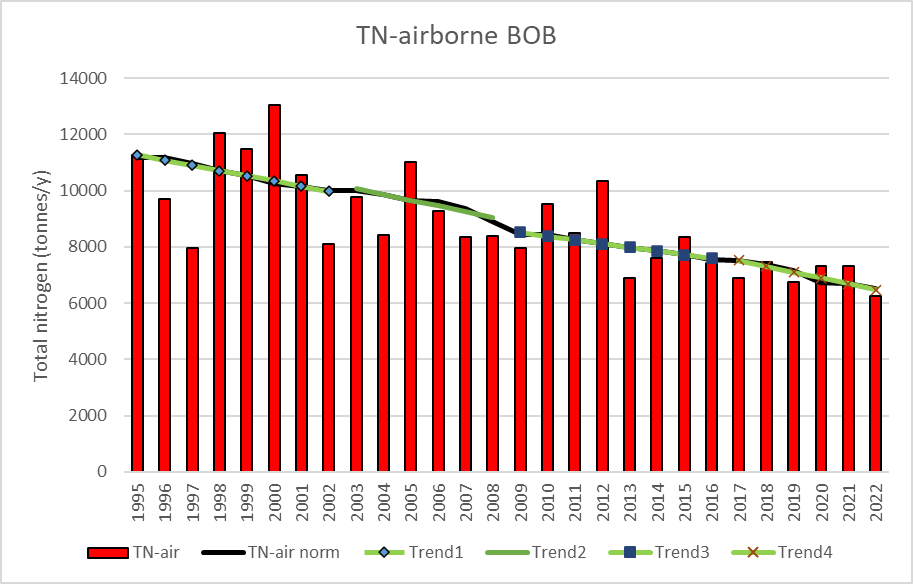
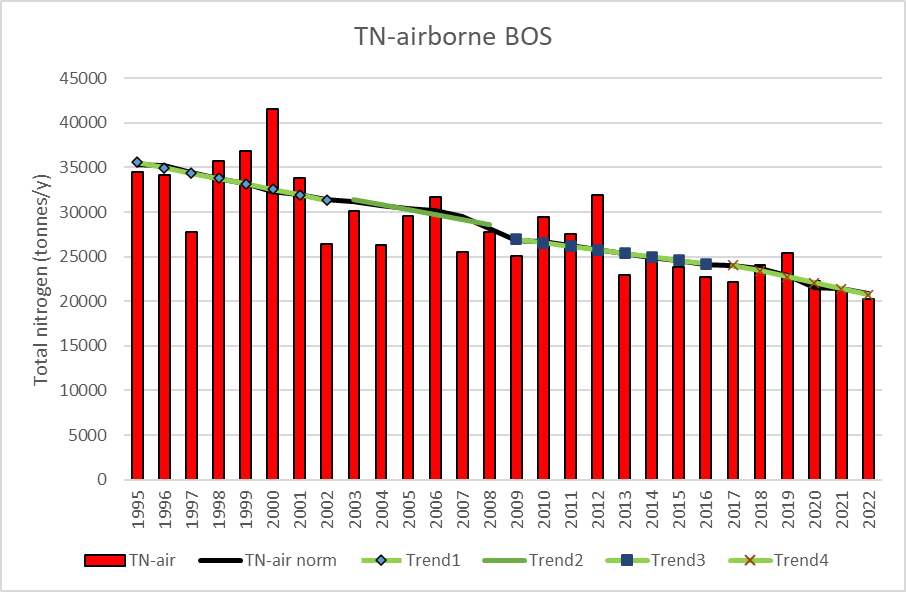
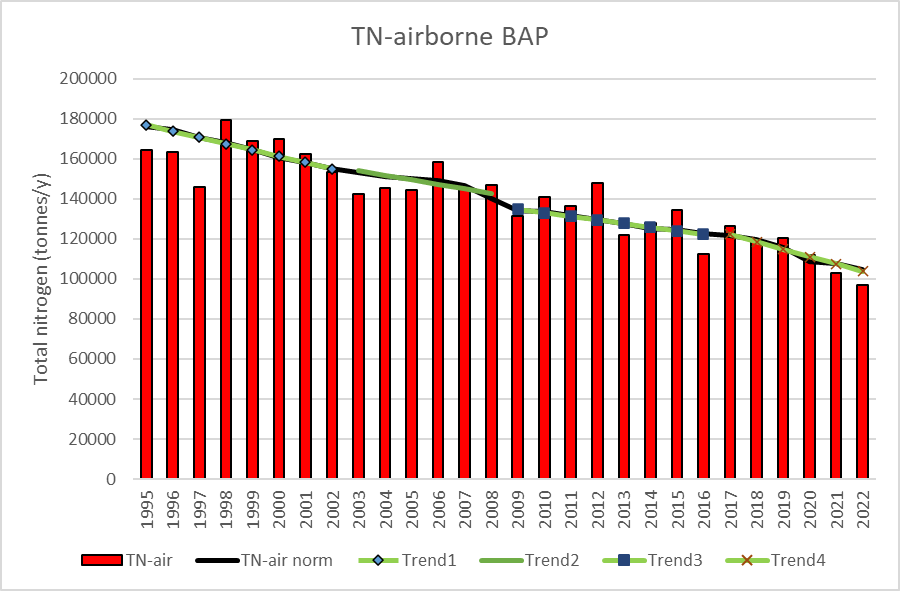
Results figure 2c. Actual annual airborne deposition of nitrogen (TN) to the Baltic Sea and sub-basins from 1995 to 2022 (tonnes/y). The normalized annual airborne deposition inputs of nitrogen are given as a black line. The trend line for normalized total nitrogen deposition is given as a green line with markers. In cases when a break point divides the trend into two parts, the second part (called trend 2) is shown by a green line without marker. In case with two or three break points divide the trend into three or four parts, respectively, the third and fourth part is shown as a green line with (different) markers. Solid trend line shows statistically significant trend and dotted line no statistically significant trend.
 |
 |
 |
 |
 |
 |
 |
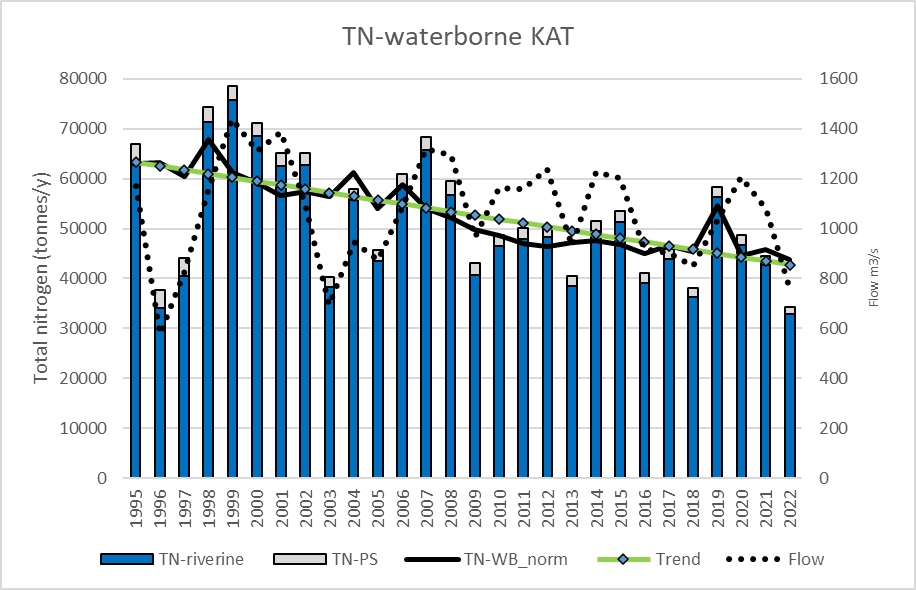 |
Results figure 2d. Actual annual riverine and direct point source inputs (the sum is the waterborne inputs) of nitrogen (TN) (tonnes/y) and total waterborne flow (m3/s-1) to the Baltic Sea and sub-basins from 1995 to 2022. The normalized annual waterborne inputs of nitrogen are given as a black line. The trend line for normalized total nitrogen waterborne input is given as a green line with markers. In cases when a break point divides the trend into two parts, the second part (called trend 2) is shown by a green line without marker. In cases with two breaks points the third part (called trend 3) is indicated as a red line without marker. Solid trend line shows statistically significant trend and dotted line no statistically significant trend.
 |
 |
 |
 |
 |
 |
 |
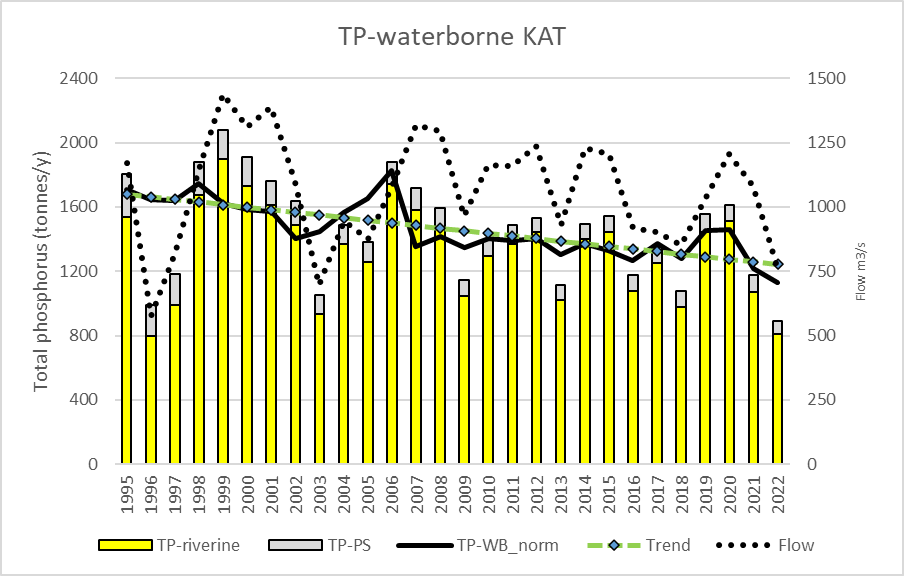 |
Results figure 2e. As figure Result 2d but for phosphorus (TP).
Tables 6a and 6b include an overview of the identified breakpoints in the 1995-2022 timeseries of airborne nitrogen deposition, and waterborne and total nitrogen and phosphorus inputs, respectively. Further, the tables include statistically significant changes since the reference period (1997-2003) and after the last breakpoint (if break points are identified) which is an indication of recent changes. As atmospheric deposition of phosphorus was set as an annual fixed rate of 5 kg per km-2 the waterborne inputs determine changes in total phosphorus inputs to the Baltic Sea. Main results of the tables are described in the paragraphs before the Results figures 2a-e.
Result table 6a. Years with statistically identified breakpoints in trend lines of airborne, waterborne and total nitrogen inputs to the Baltic Sea and its sub-basins during 1995-2022. Changes in in these inputs since the reference period (1997-2003) and the last breakpoint (if any) is given in percentages. “-“ = no significant trend.
| TN-airborne | TN waterborne | Total TN input | |||||||
| Breakpoints | Change (%) since | Change (%) after | Breakpoints | Change (%) since | Change (%) after | Breakpoints | Change (%) since | Change (%) after | |
| reference period | last breakpoint | reference period | last breakpoint | reference period | last breakpoint | ||||
| Bothnian Bay | 2003, 2009, 2017 | -38 | -14 | 2008 | 7.8 | -9.4 | 2008 | -18 | -12 |
| Bothnian Sea | 2003, 2009, 2017 | -38 | -14 | 2003 | -14 | -22 | 2003 | -26 | -26 |
| Baltic Proper | 2003, 2009, 2017 | -36 | -15 | 2002, 2009 | -19 | 19 | 2002, 2009 | -9,7 | – |
| Gulf of Finland | 2003, 2009, 2017 | -34 | -12 | 2004, 2017 | – | – | 2004, 2017 | – | – |
| Gulf of Riga | 2003, 2009, 2017 | -34 | -13 | – | – | – | – | ||
| Danish Straits | 2009, 2017 | -37 | -18 | 2014 | -19 | – | 2004, 2014 | -23 | – |
| Kattegat | 2003, 2009, 2017 | -39 | -16 | 2011 | -29 | – | 2012 | -28 | -8,2 |
| Baltic Sea | 2009, 2017 | -36 | -15 | 2016 | – | – | 2016 | -11 | – |
| ARC | 2003, 2009, 2017 | -36 | -14 | -20 | -23 | -28 | -26,9 | ||
| BOP | 2003, 2009, 2017 | -37 | -14 | 2003 | -19 | -21 | 2003 | -25 | -25 |
Result table 6b. Years with statistically identified breakpoints in trend lines of waterborne and total phosphorus inputs to the Baltic Sea and its sub-basins during 1995-2022. Changes in in these inputs since the reference period (1997-2003) and the last breakpoint (if any) is given in percentages. “-“ = no significant trend. n.r. =not relevant as there is no breakpoint.
| TP waterborne | Total TP input | |||||
| Breakpoints | Change (%) since | Change (%) after | Breakpoints | Change (%) since | Change (%) after | |
| reference period | last breakpoint | reference period | last breakpoint | |||
| Bothnian Bay | 2002 | -17 | -12 | -18 | n.r. | |
| Bothnian Sea | -27 | n.r. | -23 | n.r. | ||
| Baltic Proper | -28 | n.r. | -26 | n.r. | ||
| Gulf of Finland | 2012 | -49 | – | 2012 | -48 | – |
| Gulf of Riga | -34 | n.r. | -32 | n.r. | ||
| Danish Straits | 2000 | -23 | -18 | 2000 | -22 | -17 |
| Kattegat | -21 | n.r. | -20 | n.r. | ||
| Baltic Sea | -33 | n.r. | -32 | n.r. | ||
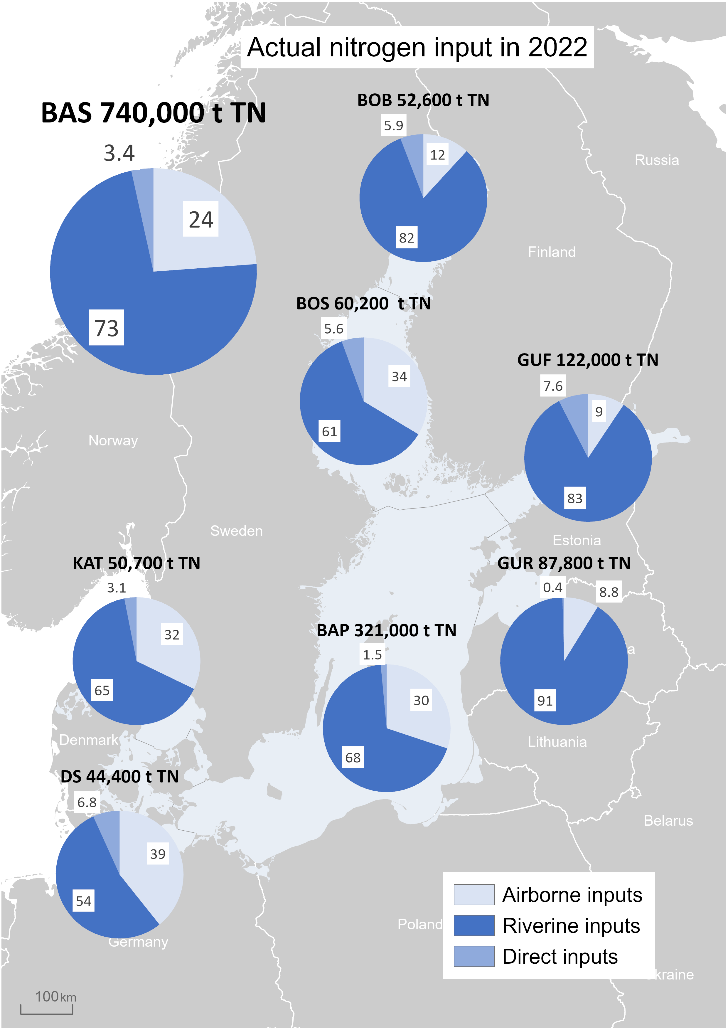
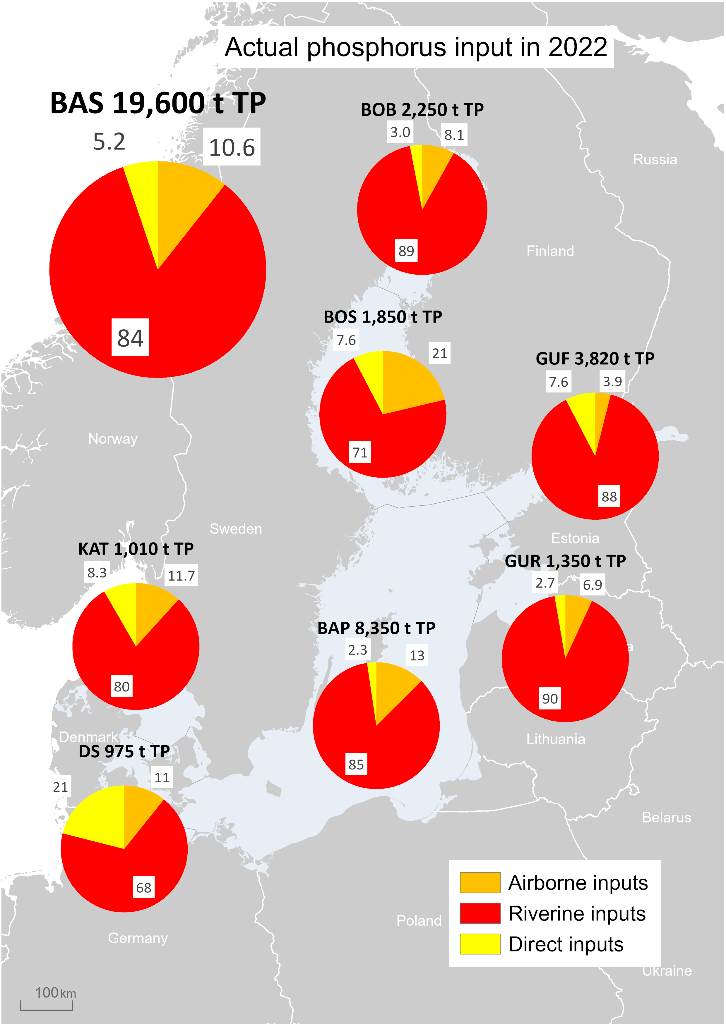
Results figure 3. The actual inputs of riverine, direct (point sources discharging directly into the sea) and airborne nitrogen (left) and phosphorus (right) to the Baltic Sea in 2022.
Comparing MAI assessments 2015-2022
The classification of achieved reductions in the MAI assessment 2015-2022 are very consistent for both nitrogen and phosphorus (Results table 7a and 7b).
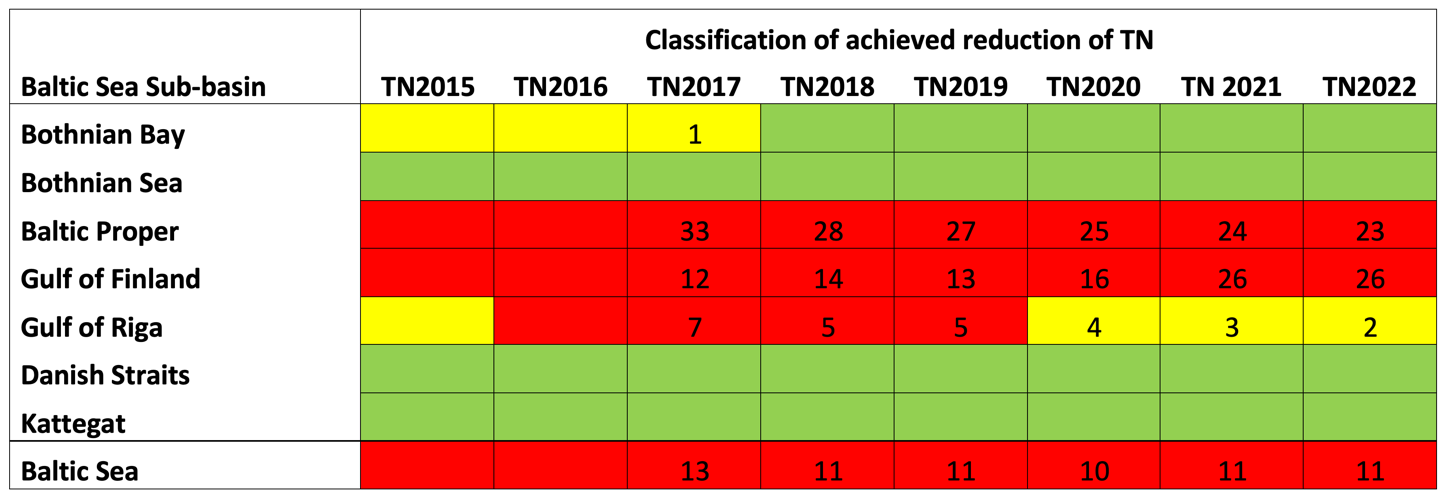
Maximum allowable nitrogen inputs were fulfilled in three basins (Bothnian Sea, Danish Straits and Kattegat) in the eighth annual assessment (2015-2022). MAI was not fulfilled for Baltic Proper, Gulf of Finland and for the Baltic Sea in any assessment. MAI was not fulfilled in the Gulf of Riga in 2016-2029. For Bothnian Bay (2015-2017) and Gulf of Riga (2015, 2020-2022), due to statistical uncertainty on inputs, MAI fulfilment could not be judged. MAI has been fulfilled for Bothnian Bay since 2018. Bothnian Bay has improved its classification since 2015. Remaining reduction (expressed in percentages of MAI) have been reduced for Baltic Proper and Gulf of Riga. Remaining reduction has increased to Gulf of Finland.
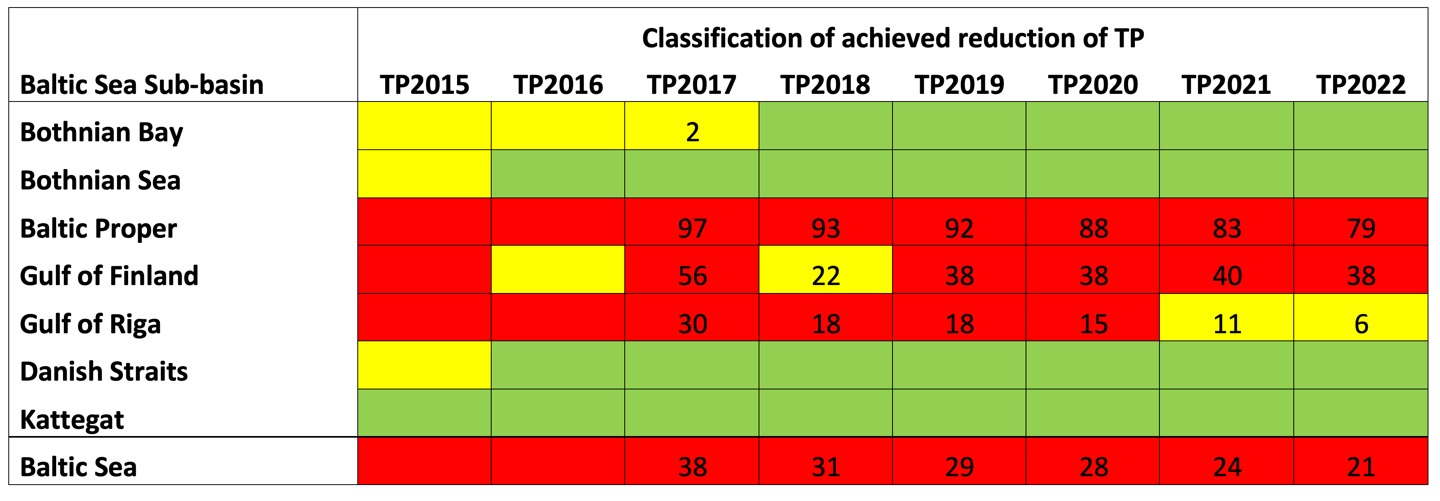
Maximum allowable phosphorus inputs were only fulfilled in Kattegat for all the eight assessments (2015-2022). For Bothnian Sea and Danish Straits MAI has been fulfilled since 2016, but in 2015 fulfilment could not be judged due to statistical uncertainty on inputs. MAI was not fulfilled in Baltic Proper and for the Baltic Sea in any assessment. MAI was not fulfilled in Gulf of Finland in 2015, 2017, 2019-2022. MAI was not fulfilled in Gulf of Riga 2015-2020 but in 2021 and 2022 fulfilment could not be judged due to statistical uncertainty on inputs. For Bothnian Bay (2015-2017) and Gulf of Finland (2016 and 2018) MAI fulfilment could not be judged due to statistical uncertainty on inputs. High uncertainty on the inputs to Gulf of Finland is one reason for the changing status of fulfilment of MAI. In 2018 -2022 MAI was fulfilled for Bothnian Bay. Bothnian Bay, Bothnian Sea and Danish Straits have improved their classification since 2015. Remaining reduction to fulfill MAI have decreased to all sub-basins not fulfilling MAI including Gulf of Riga where fulfilment can not be judged due to uncertainty on phosphorus inputs.
Result table 7a. Classification of achieving MAI in 2015 (1995-2015 data), 2016 (1995-2016 data), 2017 (1995-2017 data), 2018 (1995-2018 data), 2019 (1995-2019), 2020 (1995-2020), 2021 (1995-2021) and 2022 (1995-2022) for nitrogen: green=MAI fulfilled, yellow= fulfilment is not determined due to statistical uncertainty, and red=MAI not fulfilled.
Number in cels indicate exceedance of MAI in percentages of MAI. They are not shown for 2015-2016 due to changed methodology from 2017 assessment.
Result table 7b. Classification of achieving MAI in 2015 (1995-2015 data), 2016 (1995-2016 data), 2017 (1995-2017 data), 2018 (1995-2018 data), 2019 (1995-2019), 2020 (1995-2020) and 2021 (1995-2021 for phosphorus: green=MAI fulfilled, yellow= fulfilment is not determined due to statistical uncertainty, and red=MAI not fulfilled
Number in cels indicate exceedance of MAI in percentages of MAI. They are not shown for 2015-2016 due to changed methodology from 2017 assessment.
4.3 Discussion text
The table summarizes main findings for the assessment of MAI2022 (data from 1995-2022) on airborne, waterborne and total nitrogen and phosphorus inputs to the Baltic Sea and its sub-basins. In the BSAP update 2021 there where reduction requirements to fulfil MAI for total nitrogen for Baltic Proper, Gulf of Finland and Kattegat and for total phosphorus for Baltic Proper, Gulf of Finland and Gulf of Riga.
Evaluation of MAI fulfilment takes into account and includes uncertainty on inputs. Only significant changes and trends are mentioned in the table below. The mentioned reference period is 1997-2003.
For all sub-basins there is a significant decrease in airborne inputs since the reference period 36% on average. The average annual decrease in airborne inputs is higher during 2017-2022 as compared with 1995-2016.
| HELCOM Assessment unit name (and ID) | Threshold value achieved/failed | Distinct trend between current and previous assessment | Description of outcomes, if pertinent |
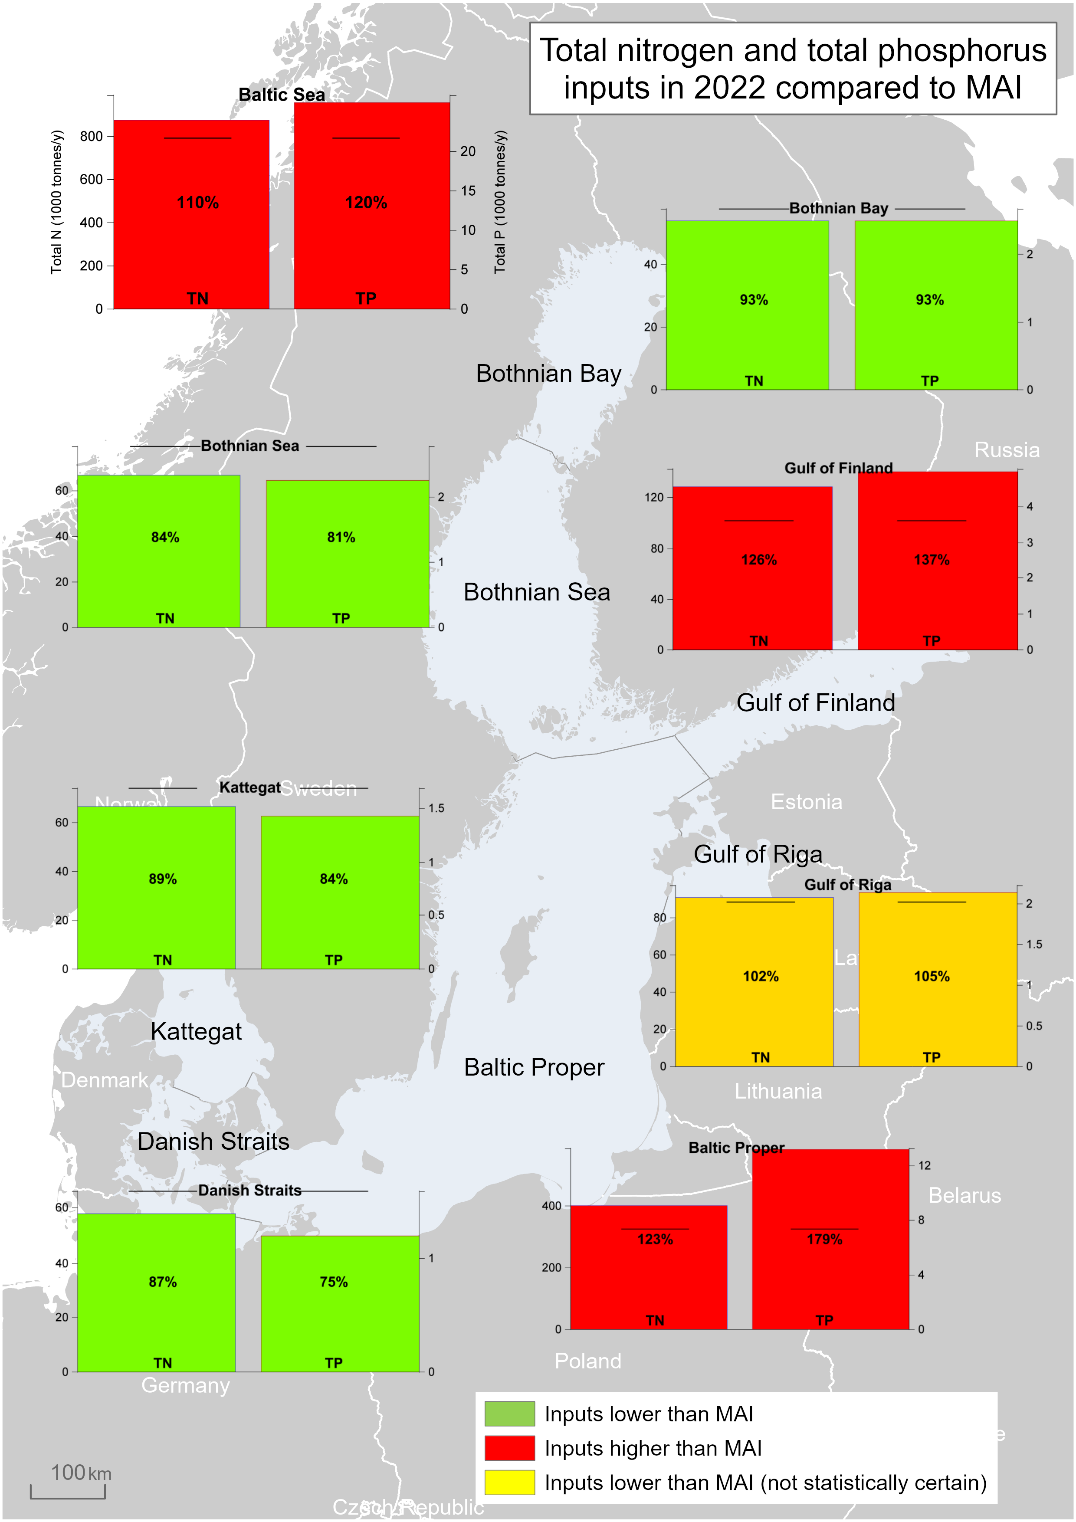
| Bothnian Bay | Achieved for TN and TP | No changes | In 2022 estimated inputs of TN and TP were both 93% of the respective MAI. In 2022 both total TN (18%) and TP (18%) inputs were lower compared with the reference period. Reduction in airborne TN inputs accounts for 35% of the total reduction in TN inputs since the reference period. Since 2008 there is a decrease in total nitrogen inputs (12%) while TP inputs steady decreased (18%) since 1995. Waterborne TN inputs have decreased since 2008 with 9.4% (after increasing until 2008), while the corresponding TP inputs decrease 12% since 2002. |
| Bothnian Sea | Achieved for TN and TP | No changes | In 2022 estimated total inputs of TN and TP were 84% and 81% of the respective MAI. In 2022 both total TN (26%) and TP (23%) inputs were lower compared with the reference period. Reduction in airborne TN inputs accounts for 53% of the total reduction in TN inputs since the reference period. There is a decrease in total TN inputs with 12% since 2003, while TP inputs steady decreased (23%) since 1995. Waterborne TN inputs have decreased since 2003 with 23% and no trend detected between 1995-2003), while the corresponding TP inputs decreased (23%) steadily since 1995. |
| Baltic Proper | Failed for TN and TP | No changes | In 2022 estimated total inputs of TN and TP were 123% and 179% of the respective MAI. In 2022 both total TN (9.7%) and TP (2%) inputs were lower compared with the reference period. Reduction in airborne TN inputs accounts for all the total reduction in TN inputs since the reference period. Since 2009 there is no trend in total nitrogen inputs while TP inputs show a steady decrease (26%) since 1995. Waterborne TN inputs have increased since 2009 (19%), while the corresponding TP inputs decreased (28%) steadily since 1995. |
| Gulf of Finland | Failed for TN and TP | No changes | In 2022 estimated total inputs of TN and TP were 126% and 138% of the respective MAI. In 2022 for total TN no significant change was detected compared with the reference period while TP inputs were 48% lower. Airborne TN inputs were although reduced with 34% since the reference period. Reduction in airborne TN inputs accounts 100% for reduction in TN inputs since the reference period. There is no trend in total TN inputs since 2017, and for TP since 2012 but TN inputs in 2017-2022 is higher during 2004-2016. TP inputs during 2012-2022 is significantly lower that during 1995-2011. Waterborne TN and TP inputs show a corresponding development to their total inputs. |
| Gulf of Riga | For TN and TP not possible to justified due to statistical uncertainty on inputs | No change for TN | In 2022 estimated total inputs of TN and TP were 103% and 106% of the respective MAI. In 2022 total TP inputs were 32% lower compared with the reference period but no changes were assessed for total TN inputs. Airborne TN inputs were although reduced with 36% since the reference period. Reduction in airborne TN inputs accounts 100% for reduction in TN inputs since the reference period. TP inputs were reduced steadily (32%) since 1995. Waterborne TN and TP inputs show a corresponding development to their total inputs. |
| Danish Straits | Achieved for TN and for TP | No changes | In 2022 estimated total inputs of TN and TP were 88% and 75% of the respective MAI. In 2022 both total TN (23%) and TP (22%) inputs were lower compared with the reference period. Reduction in airborne TN inputs accounts for 72% of the total reduction in TN inputs since the reference period. Since 2014 there is no trend in total nitrogen inputs while TP inputs show a steady decrease (17%) since 2000, but with a lower annual rate than in 1995-1999. Waterborne TN and TP inputs show a corresponding development to their total inputs. |
| Kattegat | Achieved for TN and TP | No changes | In 2022 estimated total inputs of TN and TP were 90% and 85% of the respective MAI. In 2022 both total TN (28%) and TP (20%) inputs were lower compared with the reference period. Reduction in airborne TN inputs accounts for 45% of the total reduction in TN inputs since the reference period. Since 2012 there is a minor decrease with 8.2% in total TN inputs while total TP inputs decreased steadily since 1995 with 20%. Waterborne TN inputs has no trend in inputs since 2011, while waterborne inputs decreased steadily since 1995. |
| Baltic Sea | Failed for TN and TP | No changes | In 2022 estimated total inputs of TN and TP were 111% and 121% of the respective MAI. In 2022 both total TN (11%) and TP (32%) inputs were lower compared with the reference period. Reduction in airborne TN inputs accounts for 84% of the total reduction in TN inputs since the reference period. Since 2016 there is no trend in total nitrogen inputs, while TP inputs show a steady decrease (32%) since 1995. There is no trend in waterborne TN inputs since 2016, but the level is higher that the preceding 5 years, while the corresponding TP inputs decreased steadily since 1995. |
TN = total nitrogen; TP = total phosphorus. Previous assessment is MAI-2021.
5 Confidence
The confidence is affected by the certainty of the quality of the nutrient input data, the trend in the inputs and the uncertainty of MAI, in relation to how far the nutrient inputs are from MAI:
The confidence of the assessment is overall high, but can be further detailed as:
- High for basins with nutrient reduction requirements: nitrogen to Kattegat, Gulf of Finland and Baltic Proper and phosphorus to the Baltic Proper, Gulf of Finland and Gulf of Riga.
- Moderate for phosphorus to Bothnian Sea and nitrogen to Danish Straits due to limitations in the MAI calculation.
6 Drivers, Activities, and Pressures
Drivers are often large and disparate concepts and thus hard to quantify as they may for example relate to broad societal changes, globalisation, political will, regulation, or consumer practices. Changes in such drivers can alter human activities and thereby result in changes in pressures. Quantifying drivers directly however is not straightforward and proxies indicative of the impact of drivers on human activities are often the only viable option. For HOLAS 3 initial work has been carried out to explore Drivers (and driver indicators) to evaluate how such information can be utilised within such management frameworks as DAPSIM. Although it is recognised as only addressing a small portion of the drivers (via proxies) of relevance for eutrophication, wastewater treatment (Drivers and driver indicators for Wastewater Treatment) and agriculture (Drivers and driver indicators for Agricultural Nutrient Balance) have been explored in these pilot studies for HOLAS 3.
Diffuse sources constitute the highest proportion of total nitrogen (nearly 50%) and total phosphorus (about 56%) inputs to the Baltic Sea (HELCOM 2022a). For total nitrogen, atmospheric deposition on the sea has the second highest share (24%) followed by natural background loads (20%) and point sources (9%). Natural background loads have the second highest share of total phosphorus inputs to the Baltic Sea (20%), followed by point sources (17%) and atmospheric deposition (7%). Point sources include activities such as municipal wastewater treatment plants, industrial plants and aquacultural plants and diffuse sources consists of natural background sources, and anthropogenic sources as agriculture, managed forestry, scattered dwellings, storm water etc.
Further developing an overview of such components and the relevant data to be able to better quantify the linkages within a causal framework provide the opportunity for more informed management decisions, for example targeting of measures, and can thereby support the achievement of Good Environmental Status. This indicator itself addresses the inputs of nutrients to the Baltic Sea (i.e. pressures) and a number of status indicators exist, thus an improved understanding of the relevant components related to drivers and activities (their data sources and how to evaluate them) can significantly improve the overall understanding of eutrophication and appropriate management of the matter.
Table 6. Brief summary of relevant pressures and activities with relevance to the indicator.
| | General | MSFD Annex III, Table 2a |
| Strong link | Substances, litter and energy
– Input of nutrients – diffuse sources, point sources, atmospheric deposition |
|
| Weak link | Substances, litter and energy
– Input of organic matter – diffuse sources and point sources |
7 Climate change and other factors
The current knowledge on the response of nutrient inputs to climate change was included in the recent HELCOM Climate Change Fact sheet HELCOM Climate Fact Sheet (2021). It was concluded that that river runoff is expected to be increased from the northern part of the catchment while most likely the southern catchments will be dryer. This will potentially lead to corresponding changes in loads from diffuse sources. Especially for phosphorus, effects from measures may have delayed response due to excessive storages in soils and, in some cases, lakes. Scenario simulations demonstrate that land-based nutrient management will have a greater effect on nutrient loads than greenhouse gas emissions. There are still substantial knowledge gaps, such as poor quantitative knowledge of the response of terrestrial biogeochemical processes to climate change. Another main uncertainty is how the anthropogenic drivers (and activities) will change in response to climate change and socioeconomic development.
8 Conclusions
A significant reduction of nutrient inputs has been achieved for the whole Baltic Sea. This assessment shows that the normalized total input of nitrogen[2] was reduced by 11% and phosphorus by 32% between the reference period (1997-2003) and 2022 (Results figure 1). In 2021 the corresponding reductions were 11% for total inputs of nitrogen and 30% for total phosphorus. The maximum allowable input (MAI) of nitrogen in this period was fulfilled in the Bothnian Bay, Bothnian Sea, Danish Straits and Kattegat (Key message figures 1 and Results tables 2a and 2b). In the Gulf of Riga the fulfilment of MAI for nitrogen cannot be judged taking into account uncertainty on inputs. MAI for phosphorus input was also fulfilled in the Bothnian Bay, Bothnian Sea, Danish Straits and Kattegat. In Gulf of Riga the fulfilment of MAI for phosphorus cannot be judged taking into account uncertainty on inputs. In the remaining sub-basins MAI was not fulfilled for either total nitrogen or for total phosphorus. Recent trend in waterborne nitrogen input show no trend to the Baltic Sea, Gulf og Riga, Gulf of Finland, Danish Straits and Kattegat, a decrease to Bothnian Bay and Bothnia Sea, but an increase (with 19% since 2003) to Baltic Proper.
8.1 Future work or improvements needed
The indicator was extended in 2021 by assessing trends and shares of both waterborne nitrogen and phosphorus and airborne nitrogen besides the assessment of total inputs of nitrogen and phosphorus. Further, comparison with every former MAI assessment is included in the indicator. In this MAI2022 testing for trends since the reference period and after the last break point is included, but any trend since 1995 have been excluded. Some minor rearrangement in chapter 4 is introduced, including an extra table with trend estimates for total nitrogen including trends in air- and waterborne inputs per sub-basin. Further an extra table is included in the Key Message.
The indicator assesses MAI as detailed as they are developed and adopted in the 2021 Baltic Sea Action Plan.
There is no short-term need of further development of the indicator besides considering how to take into account significant trends in flows in the normalization procedure.
9 Methodology
9.1 Scale of assessment
Nutrient input data have been compiled in accordance with PLC-water guidelines for the following nine sub-basins: Bothnian Bay, Bothnian Sea, Archipelago Sea, Gulf of Finland, Gulf of Riga, Baltic Proper, Western Baltic, The Sound and Kattegat. The boundaries of the sub-basins coincide with the main terrestrial river basin catchments.
The BALTSEM model has divided the Baltic Sea into seven sub-basins in accordance with natural marine boundaries and hence the MAIs have been calculated for the following seven sub-basins: Kattegat, Danish Straits, Baltic Proper, Bothnian Sea, Bothnian Bay, Gulf of Riga and Gulf of Finland. In the BALTSEM sub-division, the Bothnian Sea includes the Archipelago Sea and the Danish Straits combine Western Baltic and The Sound.
The entire Baltic Sea is covered by the assessment.
9.2 Methodology applied
Data sources
The HELCOM Contracting Parties annually report waterborne inputs of nitrogen and phosphorus from rivers and direct point sources to Baltic Sea sub-basins. Data on atmospheric emissions and monitored atmospheric deposition are submitted by countries to the Co-operative programme for monitoring and evaluation of the long-range transmission of air pollutants in Europe (EMEP), which subsequently compiles and reports this information to HELCOM. In accordance with Recommendation 37-38-1-Rev1 “Waterborne pollution input assessment (PLC-Water)” (HELCOM, 2022), sources of nutrient inputs are assessed every six years.
Nutrient input data can be viewed in HELCOM PLC reports (e.g. HELCOM 2012, HELCOM 2013d and HELCOM 2015) and in the annual Baltic Sea Environmental Facts Sheets (e.g. Svendsen & Gustafsson, 2024) and from the HELCOM PLUS database.
Trend analysis and statistical processing
Annually reported data on riverine and direct inputs are quality assured and approved by national data reporters and data assurers. Assessment dataset for 1995-2022 based on the reported data was established after experts reviewing and filling data gaps in. Riverine data are flow normalized for individual rivers. Input from unmonitored areas is aggregated and normalized for sub-basins. EMEP delivered actual and weather-normalized annual nitrogen deposition data. For information about normalization of airborne and flow normalization of waterborne input data, see chapter 10 and annex 6 of PLC guidelines (HELCOM 2022) and Larsen and Svendsen (2021).
An elaborate scheme for trend analysis have been developed during the past decade (Larsen & Svendsen, 2021). There are dual purposes of the trend analysis: i) to compute a robust estimate of the change in nutrient inputs during the past decades and ii) to obtain robust estimates of the magnitude and uncertainty of current nutrient inputs. Only normalized data are used in the trend analysis. Many of the nutrient input time-series cannot be described accurately by a linear trend. For example: in several cases nutrient inputs decrease faster in the beginning of the time-series than in more recent years, there are also cases with significant jumps due to, e.g., point sources removal, and yet others where there are data quality issues in the early part of the time-series. To accommodate these cases, an elaborate procedure is used to, in effect, split the time-series into segments of at least 5 years length using break point analyses (see assessment protocol table 1 below), and perform linear trend regression on the segments. Trends that are not significant are disregarded and the relevant part of the time-series will be described by the mean value. The methods are described in detail in Larsen & Svendsen (2021) and HELCOM (2022).
Changes in nutrient inputs are substantiated on two time-scales, i) as change since the reference period (1997-2003) and ii) since the last break point in the time series (recent trend). How these changes are defined in relation to the complex trend analysis methodology are indicated in Figure 2.2. In addition, to estimate the magnitude of the change, adequate statistical analysis is performed to assure which changes are significant. This analysis is also described in detail in Larsen & Svendsen (2021) and HELCOM (2022).
Assessment Protocol Table 1. The process for identifying breakpoints, testing for significant slopes and fitting constants (no significant slopes) and regression parameters (significant slopes) in a time series. From Larsen & Svendsen (2021).
| 1. step | 2. step | 3. step | 4. step |
| A significant breakpoint | Test for additional breakpoints in each segment | Test for significant slopes in the segments | Fit a constant in segments with a non- significant slope. Fit regression parameters in the rest of the segments. |
| No breakpoint | Fit a constant for the whole time series | ||
The evaluation of MAI fulfilment is based on comparing MAI for each basin of the Baltic Sea with the trend estimated normalized annual total nitrogen and phosphorus inputs in 2019 including and estimated uncertainty on these inputs (Table 2) based on the most recent segment of the time series, the estimated value of the most recent year (Larsen & Svendsen 2021). In the first and second evaluation of MAI fulfilment uncertainty of average of respectively 2010-2012 and 2012-2014 normalized inputs was estimated from the variation of the three-year inputs around the average.
The testing for significant difference in the trend estimated input and inputs in the reference period (average of normalized annual inputs 1997-2003) is done by calculating 95 % confidence interval on the average normalized inputs in the reference period and the corresponding interval around the estimated inputs for the latest year inputs and testing if the two confidence intervals are statistically different (Larsen & Svendsen, 2021).
Trends with break point analyses are also performed for airborne total nitrogen and for waterborne total nitrogen and total phosphorus inputs.
9.3 Monitoring and reporting requirements
Monitoring methodology
Waterborne inputs
Contracting Parties measure water flow and concentrations of selected parameters in riverine water and point source discharges. Estimates of inputs from unmonitored areas are based on modelling including information of point sources discharges (monitored or estimated). These data are used to calculate total annual inputs to the sea. These measurements and estimates are carried out by the Contracting Parties. The methods for monitoring and calculating waterborne pollution inputs are described in the PLC guidelines (HELCOM, 2022 https://helcom.fi/wp-content/uploads/2022/04/HELCOM-PLC-Water-Guidelines-2022.pdf) last updated by PLC-8 project.
An overview of agreed monitoring of nutrient inputs is also described in the HELCOM PLC guidelines (HELCOM 2022) and monitoring data are available from HELCOM PLUS database (HELCOM PLC) at http://nest.su.se/helcom_plc/.
Atmospheric inputs
Atmospheric emissions and measured atmospheric deposition are reported by countries to the Co-operative Programme for Monitoring and Evaluation of the Long-Range Transboundary Air Pollutants in Europe (EMEP), which compiles and reports to HELCOM. EMEP models the deposition of nitrogen input based on emission measurements and estimates and information on meteorological parameters. The results of the EMEP model are routinely compared to available measurements at EMEP and HELCOM stations. The deposition of phosphorus is not modelled but based on measurements from (rather few) monitoring stations, and a fixed deposition rate of 5 kg P per km2 has been used in the latest PLC assessment (HELCOM 2014b; HELCOM 2015). Details of the monitoring activities and the model are available in the HELCOM Monitoring Manual for nutrient inputs from atmosphere.
Current monitoring
Waterborne inputs
Inputs from large rivers are monitored and the measurements used for calculating inputs are reported. Inputs from smaller unmonitored rivers are generally estimated by models. Inputs from point sources (municipal wastewater treatment plants, industry and aquaculture) discharging directly to the Baltic Sea are reported separately.
Monitoring table 1a. Numbers of rivers, monitored area (2020) and percentages of waterborne nitrogen inputs that were monitored, unmonitored, and direct point source discharges of total waterborne nitrogen inputs to the Baltic Sea sub-basins.
| Sub-basin | Number of rivers | Monitored area (km2) | Monitored area (% of total area) | Total N monitored (%) | Total N unmonitored
(%) |
Total N direct (%) |
| Bothnian Bay | 21 | 234 000 | 88 | 90 | 4 | 6 |
| Bothnian Sea | 20 | 193 000 | 85 | 80 | 14 | 6 |
| Baltic Proper | 46 | 517 000 | 90 | 89 | 10 | 1 |
| Gulf of Finland | 22 | 402 000 | 96 | 89 | 1 | 10 |
| Gulf of Riga | 7 | 121 000 | 89 | 85 | 14 | 1 |
| Danish Straits | 120 | 14 300 | 52 | 40 | 55 | 5 |
| Kattegat | 96 | 77 400 | 88 | 68 | 29 | 3 |
| Baltic Sea | 332 | 1 559 000 | 89 | 87 | 10 | 3 |
Monitoring table 1b. Numbers of rivers, monitored area (2020) and percentages of waterborne phosphorus inputs that were monitored, unmonitored, and direct point source discharges of total waterborne phosphorus inputs to the Baltic Sea sub-basins.
| Sub-basin | Number of rivers | Monitored area (km2) | Monitored area (% of total area) | Total P monitored (%) | Total P unmonitored (%) | Total P direct (%) |
| Bothnian Bay | 21 | 234 000 | 88 | 91 | 5 | 4 |
| Bothnian Sea | 20 | 193 000 | 85 | 80 | 11 | 9 |
| Baltic Proper | 46 | 517 000 | 90 | 94 | 3 | 2 |
| Gulf of Finland | 22 | 402 000 | 96 | 90 | 1 | 9 |
| Gulf of Riga | 7 | 121 000 | 89 | 87 | 11 | 2 |
| Danish Straits | 120 | 14 300 | 52 | 29 | 48 | 23 |
| Kattegat | 96 | 77 400 | 88 | 66 | 27 | 7 |
| Baltic Sea | 332 | 1 559 000 | 89 | 88 | 7 | 5 |
Monitoring tables 1a and 1b show that about 90% of the total Baltic Sea catchment area is covered by monitoring based on more than 300 monitoring stations. For six of the seven sub-basins between 85% and 96% of the catchment areas are monitored, and these catchments are covered by monitoring in mainly large rivers. For Danish Straits only about 50% of the catchment is monitored even though 120 monitoring stations or more than one third of all river monitoring stations in the Baltic Sea catchment area are situated in the catchment due to many small river catchments.
Monitoring tables 1a and 1b also show that estimated/calculated inputs from unmonitored areas constitute 10% of total nitrogen and 7% of total phosphorus waterborne inputs to the Baltic Sea.
Details of the monitoring activities are available in the HELCOM Monitoring Manual for land-based sources.
Atmospheric inputs
Details of the monitoring activities and the model are available in the HELCOM Monitoring Manual for nutrient inputs from atmosphere and Monitoring table 2 gives an overview of the number of nitrogen monitoring stations located at the Baltic Sea used to compare model and monitored nitrogen deposition.
Monitoring table 2. Number of monitoring stations situated close to the Baltic Sea used for measuring wet and dry deposition of nitrogen compounds in 2021.
| Sub-basin | Wet deposition of N | Dry deposition of N |
| Bothnian Bay | 2 | 0 |
| Bothnian Sea | 2 | 1 |
| Baltic Proper | 6 | 6 |
| Gulf of Finland | 3 | 2 |
| Gulf of Riga | 0 | 0 |
| Danish Straits | 5 | 5 |
| Kattegat | 2 | 3 |
| Baltic Sea | 20 | 17 |
Description of optimal monitoring
Waterborne inputs
Guidelines for sampling discharges from point sources and inputs via rivers are given in the PLC guidelines. For riverine inputs, as a minimum 12 samples should be taken each year at a frequency that appropriately reflects the expected river flow pattern. If more samples are taken (e.g. 18, 26 or more) and/or the flow pattern does not show a major annual variation the samples can be more evenly distributed during the year. Overall, for substances transported in connection with suspended solids, lower bias and better precision is obtained with higher sampling frequency.
For rivers with hydrological stations the location of these stations, measurement equipment, frequency of water level and flow (velocity) measurement should at least follow the World Meteorological Organization (WMO) Guide to Hydrological Practices (WMO-No. 168, 2008) and national quality assurance (QA) standards.
Preferably the discharge (or at least the water level) should be monitored continuously and close to where water samples for chemical analyses are taken. If the discharges are not monitored continuously the measurements must cover low, mean and high river flow rates, i.e. they should as a minimum reflect the main annual river flow pattern. Further details are provided in the PLC-water guidelines (HELCOM, 2022).
Atmospheric inputs
Collection of air emission data and modelling atmospheric deposition are coordinated by EMEP. There are rather few stations located at the coast or on small islands in the Baltic Sea, and not all stations are measuring all components. Further, only some stations have long time series. Not all national monitoring stations are included in the list of “HELCOM stations” but could be used by EMEP. There are also some problems with the representativeness of the stations, i.e. rather many in the south-western part of the Baltic Sea but few in the eastern and northern parts that cause challenges when verifying the EMEP model results. For phosphorus it is especially important to establish a more extensive and representative monitoring station network, as there are no models developed to estimate the atmospheric phosphorus deposition. Thorough analysis of the monitoring data would improve the understanding of the development in the atmospheric deposition and also offer recommendations on how to improve and possibly expand monitoring.
10 Data
The data and resulting data products (e.g. tables, figures and maps) available on the indicator web page can be used freely given that it is used appropriately and the source is cited.
Data on air- and waterborne nutrient inputs from 1995 to 2022 are used in this indicator. Data reporting has not been perfect, and some few gaps exist in the dataset. For waterborne inputs, the PLC-6 project corrected suspicious data and filled in data gaps for 1995-2014 to establish a complete and consistent dataset. 2015- 2022 data has been added and assessed by BNI, Stockholm University and DCE, Aarhus University under the PLC-7 and PLC-8 projects. Gaps in time series of national air emissions have also been corrected by EMEP experts.
Data on actual (non-normalized) riverine flow as well as atmospheric and waterborne inputs of nitrogen and phosphorus are available at the link below:
Data: Inputs of nutrients to the sub-basins – 2022 indicator version
The dataset behind the present assessment was compiled by the PLC-8 project and updated by DCE, Aarhus University and BNI, Stockholm University in cooperation with Reduction Scheme Core Expert Group, RedCore EG.
Data on waterborne inputs, water flow and retention are reported by Contracting Parties to the PLC-Water database with reporting WEB application. The data are verified and quality assured using the PLC water database verification tools and national expert quality assurance.
There are gaps in time series of national inputs in the PLC water database. Therefore, DCE and BNI amended the dataset filling in missing and correcting suspicious data to establish an assessment dataset which then was checked and approved for use in this indicator by the Contracting Parties. A description of the methods used to fill data gaps in is given in chapter 1.2 in BSEP 141 (HELCOM, 2013d) and documentation prepared by the PLC-5.5 project.
Data on water- and airborne inputs are available from 1995-2022 and cover the entire drainage basin of the Baltic Sea.
Inputs are calculated from measurements taken from monitored rivers and point sources as well as calculated estimates or modelled inputs from unmonitored areas. Quality assurance guidelines for sample analysis are described in the PLC guidelines and intercalibration activities are carried out periodically. The most recent intercalibration activity with published results was carried out under the PLC-8 project (in Lassen & Larsen, 2021).
No official information about the uncertainty of inputs of nutrients or organic matter or flow data have been reported to HELCOM yet, but uncertainty estimates are included as a request to be reported by the Contracting Parties in the PLC guidelines. The uncertainty of annual total waterborne nitrogen and phosphorus inputs are computed for each individual sub-basin based on statistical analysis of input trends for the period 1995-2019, and examples given in Larsen & Svendsen, 2021.
Atmospheric input data for all Baltic Sea sub-basins are available for the period 1990-2022. Atmospheric transport and deposition of nitrogen compounds are used for modelling atmospheric deposition to the Baltic Sea based on official emission data reported by EMEP Contracting Parties and expert estimates. Atmospheric input and source allocation budgets of nitrogen (oxidized, reduced and total) to the Baltic Sea basins and catchments were computed using the latest version of EMEP MSC-W model. The EMEP MSC-W model is a multi-pollutant, three-dimensional Eulerian model. It takes into account processes of emission, advection, turbulent diffusion, chemical transformations, wet and dry depositions, and inflow of pollutants into the model domain. It is driven by meteorological data from the Integrated Forecast System of ECMWF (European Centre for Medium Range Weather Forecasts). A comprehensive description of the model and its applications is available on the EMEP website.
Compared to the first evaluation of MAI fulfilment (Svendsen et al. 2015), in 2016 EMEP revised the modelled nitrogen air deposition to the Baltic Sea for 1995-2012. This resulted in an increase of the annual deposition to the Baltic Sea of 16 to 23%. The increase of annual nitrogen deposition to the individual sub-basins was between 9 and 27 %. The EMEP deposition model was updated further after the second MAI assessment (HELCOM, 2018). The update mainly concerned changing of the deposition grid resolution from 50km*50km to 0.1°*0.1° (approx. 11km*6km grid cells in the Baltic Sea). The higher resolution was applied for computation of the annual nitrogen deposition 2000-2017, and for the present MAI assessment 1995- 2022 (Gauss et al., 2024). Also, the whole time series of nitrogen emission data is updated annually, and this yearly emission data for 1990-1994 was also available. For years since 2000 the data from FMI on ship emissions have replaced former ship emission data in the deposition calculation. The update of the model, revised reported emission data and use of weather data in the normalization procedure (section “Airborne Inputs” under chapter “Data and updating”) resulted in markedly changed deposition data compared to the previous reporting. Deposition on the Baltic Sea in the reference period (1997-2003) was 294 000 tons nitrogen in the latest EMEP estimate, compared to 227 000 tons nitrogen previously estimated, or 29.5% higher than calculated for the BSAP 2013. The nitrogen deposition in the reference period showed the highest change in the Gulf of Finland (+40%) and Kattegat (39%) and the lowest in the Gulf of Riga (19%).
Atmospheric deposition of oxidized and reduced nitrogen was computed for the entire EMEP domain, which includes the Baltic Sea basin and its catchment (Data figure 1). Calculations are done annually on data from two years prior to the calculations. For further details see the annual report by EMEP to HELCOM (Gauss et al., 2024). Data on air emissions and atmospheric deposition are maintained by EMEP and can be accessed via the EMEP website.
The results of the EMEP MSC-W model are routinely compared to available measurements at EMEP and HELCOM stations. The comparison of calculated versus measured data indicates that the model predicts the observed air concentrations of nitrogen within an accuracy of approximately 20-30%. Further work is required on reducing uncertainties in emission data and better parameterization of physical processes in the EMEP MSC-W model to increase the accuracy in future model estimates.
No official information about the uncertainty of provided nitrogen emission data have been sent to EMEP from neither EMEP nor HELCOM Contracting Parties, and consequently further work on emission uncertainty is essential. Submitted emissions data are passing through QA/QC procedures and stored in the EMEP Centre for Emission Inventories and Projections CEIP in Vienna, Austria. Reviews about the consistency, comparability and trends of national inventories are available at http://www.ceip.at/. There are gaps in time series of national emissions that have to be corrected by experts to make the time series complete.
There are limited data on phosphorus deposition and no emission data for the modelling work has been available for evaluation. For most countries, measurements only covered wet deposition and there was a lack of data on particulate and dry deposition. A fixed deposition rate of 5 kg P per km2 to the Baltic Sea has been used in the PLC-5.5 assessment (HELCOM 2014b, HELCOM 2015). The estimates of phosphorus deposition rates are mainly based on the data from monitoring stations close to the coastline of the Baltic Sea. But there are very few monitoring stations on small islands in the Baltic Sea, and therefore the use of the data mainly from stations on land might lead to an overestimation of deposition. Many monitored concentrations (dry and wet deposition) are very low and close to detection limit. Therefore, the atmospheric phosphorus deposition data and the applied deposition rate is rather uncertain for the whole Baltic roughly ±50% and for minor basins as Gulf of Riga and The Danish Straits even higher uncertainty exists. As atmospheric deposition on average only constitutes 9% of total phosphorus inputs, these uncertainties are less critical than in the case of atmospheric deposition of nitrogen, which on average constitutes about 25% of total nitrogen inputs to the Baltic Sea.
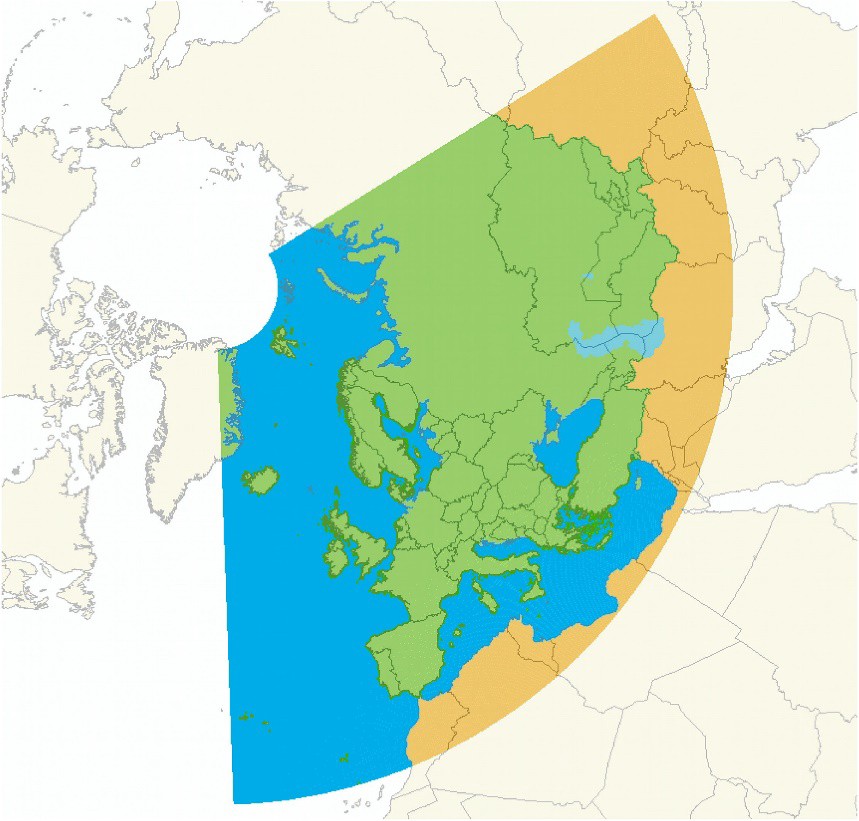
Data figure 1. The EMEP model domain used for computations on atmospheric deposition.
Arrangements for updating the indicator
Annual total waterborne inputs of nitrogen, phosphorus and their fractions are reported every year by the HELCOM Contracting Parties and compiled by the PLC Data Manager at the HELCOM Secretariat. The data collection is based on a combination of monitored data (measurements at monitoring stations close to river mouth and at point sources) and estimates of inputs from unmonitored areas.
The HELCOM PLUS is a modernized PLC database including QA facilities when uploading, and inserting data, and which allow data reports, quality assures from the Contracting Parties improved access to the waterborne input data. Further assessment dataset will be available in an assessment database under development.
Data on air emissions are reported to EMEP, which subsequently models the atmospheric deposition to the Baltic Sea. EMEP hosts the emission and deposition data, which can be accessed via their website. EMEP is contracted by HELCOM to provide selected data products on an annual basis.
The Baltic Nest Institute (BNI), Sweden, and Danish Centre for Environment and Energy (DCE), Aarhus University, Denmark have in cooperation with Reduction Scheme Core Expert Group, RedCore EG elaborated the present core pressure indicator on nutrient inputs.
11 Contributors
Lars M. Svendsen1, Bo Gustafsson2, and Søren E. Larsen1
With support from the HELCOM Reduction Scheme Core Drafting Group (RedCore EG)
1 DCE – Danish Centre for Environment and Energy, Aarhus University
2 Baltic Nest Institute, Sweden
![]()
12 Archive
This version of the HELCOM core indicator report was published in 2024:
HELCOM core indicator on inputs of nutrients for period 1995-2022 (pdf)
Earlier versions of the core indicator:
HELCOM-Core-indicator-on-nutrients-1995-2021_PDF_October2024.pdf (pdf)
HELCOM core indicator on inputs of nutrients for period 1995-2020 (pdf)
HELCOM core indicator on inputs of nutrients for period 1995-2019 (pdf)
HELCOM core indicator on inputs of nutrients for period 1995-2018 (pdf)
HELCOM core indicator on inputs of nutrients for period 1995-2017 (pdf)
HELCOM core indicator on inputs of nutrients for period 1995-2016 (pdf)
13 References
Gauss, M. Aas, Travnikov, O., Gacnik, J., Aas, W., Klein, H. and Nyiri, A. 2024. Atmospheric supply of Nitrogen, Cadmium, Mercury and B(a) to the Baltic Sea in 2022. EMEP Centers Joint Report for HELCOM, Oslo September 2024, 17 pp.
Gustafsson, B.G & Mörth, C.M. 2013 Draft scientific background on revision of the Maximum Allowable Inputs and Country Allocation Scheme of the Baltic Sea Action Plan V.4, document 2-43, HOD 41-2013. https://indicators.helcom.fi/wp-content/uploads/2023/04/HELCOM-Core-indicator-on-nutrients-1995-2021_PDF_October2024.pdf
HELCOM 2024. Inputs of nutrients to the sub-basins (2021). HELCOM core indicator report. Authors: Svendsen, L.M., Gustafsson, B. and Larsen, S.E.
HELCOM 2022a: Assessment of sources of nutrients to the Baltic Sea in 2017. Authors: Svendsen, L.M. and Tornbjerg, H., 113 p.
Helcom 2022. “HELCOM Guidelines for the annual and periodical compilation and reporting of waterborne pollution inputs to the Baltic Sea (PLC-Water) Guidelines for Waterborne pollution inputs to the Baltic Sea (PLC-water) , 173 pp. Authors: Svendsen, L.M., Boutrup, S., Larsen, S.E., Frank-Kamenetsky, D, Michael Gauss3, Bo Gustafsson4, Juuso Haapaniemi, Hansson, K., Kokorite, I., Mönnich, J., Oblomkova, N., Pohl, M., Räike, A., Sokolov, A. , Sonesten, L., Tornbjerg, H.
HELCOM 2021 HELCOM Baltic Sea Action Plan – 2021 update, 60 pp. https://helcom.fi/media/publications/Baltic-Sea-Action-Plan-2021-pdate.pdf
HELCOM 2020 HELCOM Indicator manual, version 2020-1. Baltic Sea Environment Proceedings no 175, 25 pp. https://helcom.fi/wp-content/uploads/2021/01/BSEP175.pdf
HELCOM 2016. HELCOM Recommendation 37-38-1rev1 “Waterborne pollution input assessment (PLC-Water)”. Adopted 16 June 2016. Supersedes HELCOM Recommendation 26/2.
HELCOM 2014a. Eutrophication status of the Baltic Sea 2007-2011 – A concise thematic assessment. Baltic Sea Environment Proceedings No. 143.
HELCOM 2014b. Information on atmospheric deposition of phosphorus. Document 9-3. Seventh meeting of the HELCOM Expert Group on follow-up of national progress towards reaching BSAP nutrient reduction targets (HELCOM LOAD 7-2014).
HELCOM 2013a. HELCOM Copenhagen Declaration “Taking Further Action to Implement the Baltic Sea Action Plan – Reaching Good Environmental Status for a healthy Baltic Sea”. Adopted 3 October 2013.
HELCOM 2013b. Summary report on the development of revised Maximum Allowable Inputs (MAI) and updated Country Allocated Reduction Targets (CART) of the Baltic Sea Action Plan. Supporting document for the 2013 HELCOM Ministerial Meeting.
HELCOM 2013c. Approaches and methods for eutrophication target setting in the Baltic Sea region. Baltic Sea Environment Proceedings No. 133.
HELCOM 2013d. Review of the Fifth Baltic Sea Pollution Load Compilation for the 2013 HELCOM Ministerial Meeting. Baltic Sea Environment Proceedings No. 141.HELCOM 2012. Fifth Baltic Sea Pollution Load Compilation – An Executive Summary. Baltic Sea Environment Proceedings No. 128A.
HELCOM 2007. HELCOM Baltic Sea Action Plan (BSAP). HELCOM Ministerial Meeting. Adopted in Krakow, Poland, 15 November 2007.
Larsen, S.E. & Svendsen, L.M. 2021. Statistical aspects in relation to Baltic Sea Pollution Load Compilation. Task under HELCOM PLC-8 project. Aarhus University, DCE – Danish Centre for Environment and Energy, 60 pp. Technical Report from DCE – Danish Centre for Environment and Energy No. 224.
https://dce2.au.dk/pub/TR224.pdf
Lassen, P. & Larsen, M.M. 2021. Report on the HELCOM PLC-8 intercalibration. Aarhus University, DCE – Danish Centre for Environment and Energy, 130 pp. Technical Report No. 2012.
https://dce2.au.dk/pub/TR212.pdf
Svendsen, L.M., Pyhälä, M., Gustafsson, B., Sonesten, L. and Knuuttila, S., 2015. Inputs of nitrogen and phosphorus to the Baltic Sea. HELCOM core indicator report. Online.
Svendsen, L.M. and Gustafsson, B. 2024. Waterborne nitrogen and phosphorus inputs and water flow to the Baltic Sea 1995-2022. HELCOM Baltic Sea Environmental fact sheet, 47 p. https://helcom.fi/wp-content/uploads/2024/10/BSEFS-on-Waterborne-nitrogen-and-phosphorus-inputs-and-water-flow-to-the-Baltic-Sea-1995-2022.pdf
WMO, 2008. Guide to Hydrological Practices. Volume 1 Hydrology – From measurement to Hydrological Information. WMO No. 168, Sixth Edition, 296 p.
Ærtebjerg, G., Andersen, J.H. & Hansen, O.S. (eds.) 2003. Nutrients and Eutrophication in Danish Marine Waters. A Challenge for Science and Management. National Environmental Research Institute. 126 pp.
14 Other relevant resources
No additional information if required for this indicator.