Filtering the indicators
It is possible to filter the indicator based on type (e.g. state, pressure), category (e.g. core, pre-core) and policy relevance (Baltic Sea Action Plan and Marine Strategy Framework Directive).
Search for Indicators
Reproductive disorders
1.Key message
Reproductive disorders: malformed embryos of amphipods
This indicator is a HELCOM supplementary indicator and is applicable in The Quark, Bothnian Sea, Northern Baltic Proper, Western Gotland Basin, Gulf of Riga and Gulf of Finland
The rate of embryo malformations in benthic amphipods indicates reproductive/developmental toxicity due to the presence of hazardous substances in bottom sediments. The threshold value has not been achieved at all stations within each basin, indicating that toxic effects of contaminants are considered to be present (Figure 1).
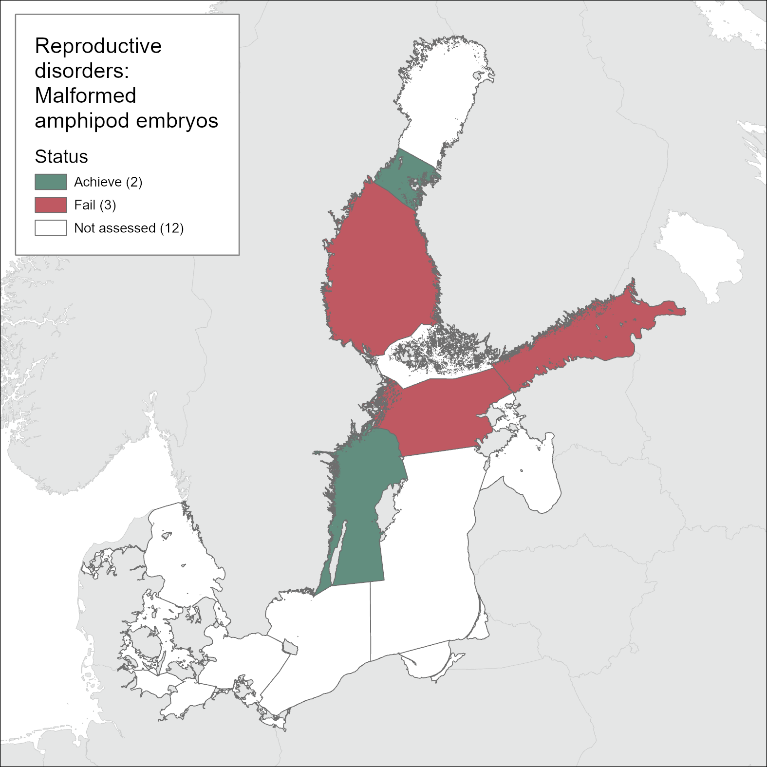
Figure 1. Status evaluation results for HOLAS 3 are based on the evaluation of the indicator Reproductive disorders: malformed embryos of amphipods. The evaluation is carried out using scale 2 HELCOM assessment units (defined in the HELCOM Monitoring and Assessment Strategy Annex 4), combining coastal and offshore amphipod species and using species-specific target values. Not assessed is used for areas in which no agreement on the application of this indicator have currently been made. See ‘data chapter’ for interactive maps and data at the HELCOM Map and Data Service.
The indicator evaluation results are based on the monitoring data on malformations in several Baltic amphipod species (Monoporeia affinis, Gammarus salinus, G. zaddachi, and G. tigrinus) carried out by Sweden, Latvia and Estonia, with complementary data for M. affinis in the Gulf of Finland provided by Russia.
In 2016-2021, the indicator was applied to the waters of Finland, Sweden, Latvia, and Estonia, and the evaluation was conducted for The Quark, Bothnian Sea, Northern Baltic Proper, Western Gotland Basin, and Gulf of Finland. For the Gulf of Riga, only two-years of data were available. As at least three years of observations are needed to conduct the evaluation, it was not possible to assess the status in this basin. Provided that local indicator species and the threshold values are identified, the approach is potentially applicable in all Baltic Sea areas (sub-basins) because amphipod species are present ubiquitously across the region.
The confidence of the indicator in the assessed areas is moderate to high with regard to the spatial coverage since the evaluation data are collected from multiple stations (11 to 20) surveyed on annual basis within each assessment unit. However, whereas more than 20 years of data for setting the threshold values were used for the Swedish data, the time series for all other data collections are much shorter. Therefore, with regard to the target values, the confidence in the threshold values varies from low to high. Thus, the overall confidence is considered to be moderate for this evaluation.
1.1 Citation
The data and resulting data products (e.g. tables, figures and maps) available on the indicator web page can be used freely given that it is used appropriately and the source is cited. The indicator should be cited as follows:
HELCOM (2023). Reproductive disorders: malformed embryos of amphipods. HELCOM supplementary indicator report. Online. [Date Viewed], [Web link].
ISSN 2343-2543

Ringed seal abundance
1 Key message
Population trends and abundance of seals – Ringed seals
This core indicator report evaluates the status of the marine environment based on population trends and abundance of the Baltic Sea ringed seals (other seal species are addressed in separate reports). Good status is achieved for each species when i) the abundance of seals in each management unit has attained a Limit Reference Level (LRL) of at least 10,000 individuals to ensure long-term viability and ii) the population trend, assessed by species-specific growth rate, for a population either under or at Target Reference Level (TRL) is achieved, indicating that growth-rates are not affected by severe anthropogenic pressures.
The ringed seal is evaluated in two management units: the Bothnian Bay and the southern management unit, which consists of sub-populations in the Archipelago Sea, the Gulf of Finland and western Estonia.
For the ringed seal population in Bothnian Bay the Bayesian analyses showed 80% support for growth rate of ≥5.0% for 2003-2012. This is below the threshold of 7%. However, trend calculation for data collected after 2012 was not possible. The inventory results from these years have been anomalously high with extreme inter-annual variation, the results do not fit with the previous trend-lines and show “increases” that are not biologically possible. The ice-conditions are changing in Bothnia Bay and it is hypothesised that the inconsistent survey results are a result of an increased fraction of the total population being observed hauled-out on the ice during the survey period, likely due to lower ice-coverage and earlier ice-breakup. There have, however, been no indication of a major decrease in the population. The highest estimate of hauled out ringed seals during the assessment period (i.e. 2016-2021) was 14 602 (2021), which is over the abundance threshold of Limit Reference Level (LRL) 10 000. With one-out-all-out –approach, the Bothnian Bay ringed seal fail to achieve good environmental status (Figure 1).
In the Gulf of Finland, Archipelago Sea and western Estonia, the numbers of counted ringed seals only sums up to a small fraction of the threshold for abundance and none of the areas are showing signs of increase. The southern ringed seal management unit does not achieve good environmental status (Figure 1).
Confidence of the indicator evaluation is considered to be high for the southern ringed seal management unit and low for the Bothnian Bay ringed seal management unit.
+ 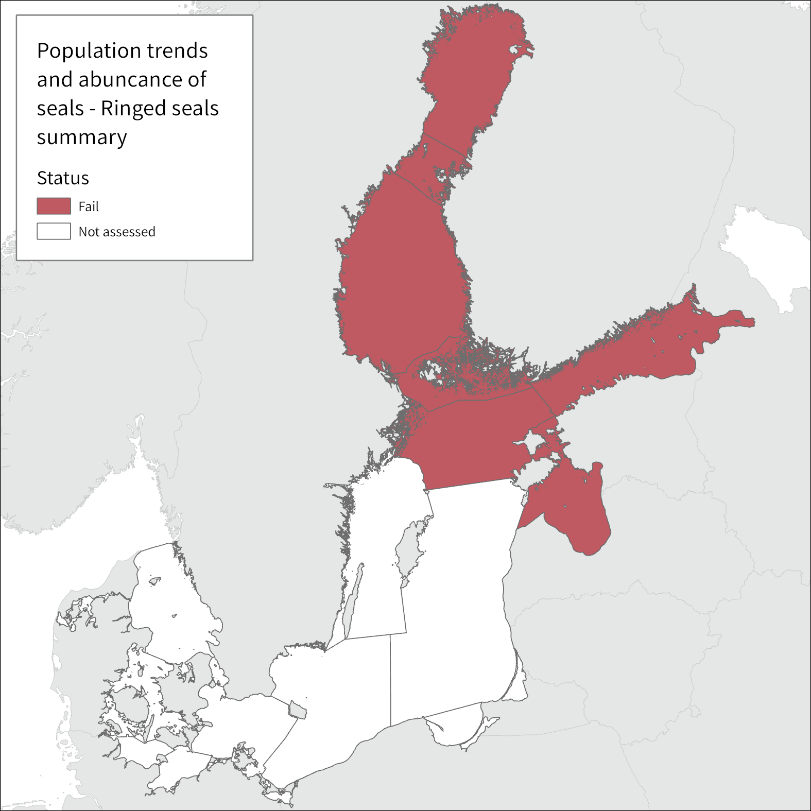
Figure 1. The overall status evaluation results based on evaluation of the indicator ‘population trends and abundance of seals’ – Ringed seals. The evaluation is carried out using Scale 2 HELCOM assessment units (defined in the HELCOM Monitoring and Assessment Strategy Attachment 4), using the one-out-all-out approach. Thus, if a seal management unit, in not good status, has a given assessment unit as part of its range, the assessment unit is marked red. See ‘data chapter’ for interactive maps and data at the HELCOM Map and Data Service.
1.1 Citation
The data and resulting data products (e.g. tables, figures and maps) available on the indicator web page can be used freely given that it is used appropriately and the source is cited. The indicator should be cited as follows:
HELCOM (2023) Population trends and abundance of seals. HELCOM core indicator report. Online. [Date Viewed], [Web link].
ISSN 2343-2543

Ringed seal distribution
1 Key message
Distribution of Baltic seals – ringed seals
This core indicator report evaluates the state of the marine environment based on the distribution of the ringed seal Pusa hispida (other seal species are addressed in separate reports) in the Baltic Sea. The core indicator has three components: Breeding distribution, Moulting distribution and Area of occupancy. Good status is achieved when the distribution of seals is close to pristine conditions (e.g. 100 years ago), or where appropriate, when currently available haul-out sites are occupied (modern baseline), and when no decrease in area of occupation occurs. The current evaluation covers the assessment period 2016-2021.
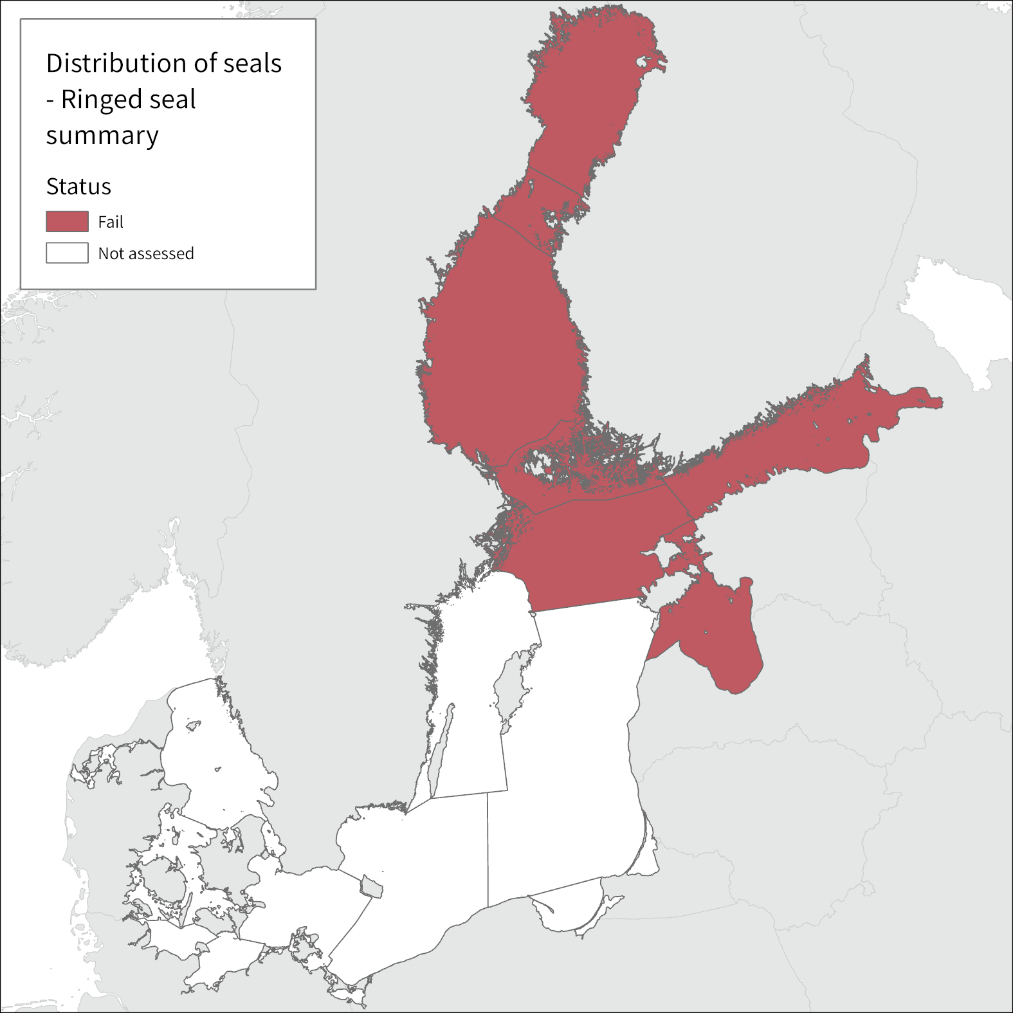
Figure 1: Status evaluation results based on evaluation of the indicator ‘distribution of Baltic Seals – Ringed seals’. The evaluation is carried out using grouping of scale 2 HELCOM assessment units (defined in the HELCOM Monitoring and Assessment Strategy Annex 4). See ‘data chapter’ for interactive maps and data at the HELCOM Map and Data Service.
The ringed seal is evaluated in two management units: the Bothnian Bay and the southern management unit. The latter consists of sub-populations in the Archipelago Sea, the Gulf of Finland and western Estonia.
State of ringed seals: While the at sea area of occupancy of ringed seals is not limited, breeding and moulting distribution is currently significantly reduced compared to pristine conditions in all subpopulations (key message figure 1, and results section). Therefore the ringed seals do not achieve good environmental status for the Distribution indicator.
Confidence of the indicator evaluation is considered to be moderate for ringed seals in the applicable assessment units.
Citation
The data and resulting data products (e.g. tables, figures and maps) available on the indicator web page can be used freely given that it is used appropriately and the source is cited. The indicator should be cited as follows:
HELCOM (2023) Distribution of Baltic seals – ringed seals. HELCOM core indicator report. Online. [Date Viewed], [Web link].
ISSN 2343-2543

Salmon abundance
1. Key message
Abundance of salmon spawners and smolt
This indicator evaluates the status of the Baltic Sea area based on salmon smolt production in rivers flowing into the sea, also making use of additional supporting data on numbers of adult spawners. Determination of whether the threshold value that determines good status is achieved is based on a comparison of estimated smolt production with an estimated potential smolt production capacity.
The evaluation covers the period 2016-2020, and the final result is based on the last year (Figure 1).
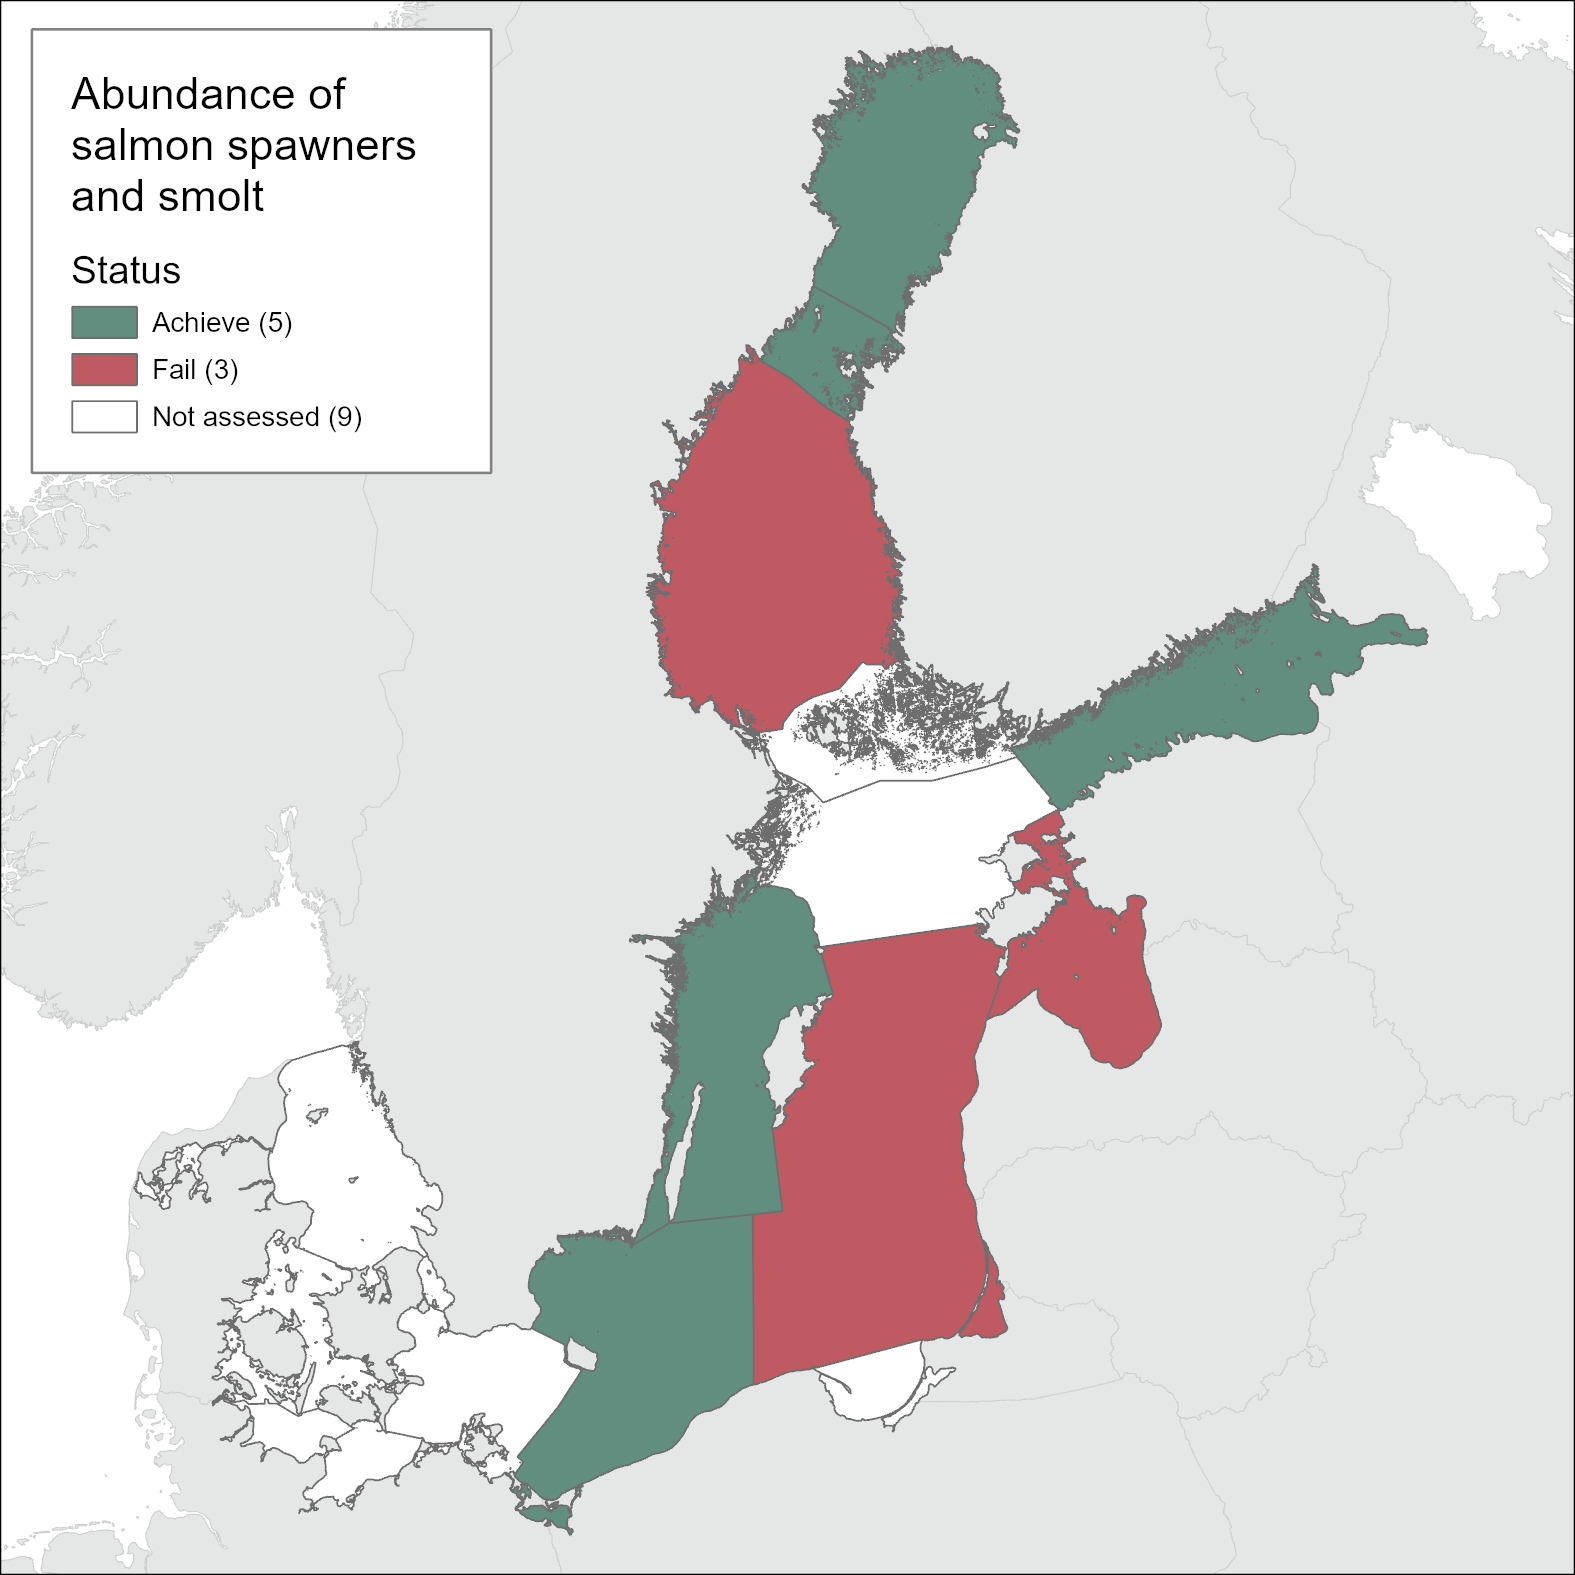
Figure 1. Status evaluation results based on evaluation of the indicator ‘abundance of salmon spawners and smolt’. The evaluation is carried out using Scale 2 HELCOM assessment units (detailed in the HELCOM Monitoring and Assessment Strategy Annex 4). The indicator is applicable in all the countries bordering the Baltic Sea except Denmark, Germany, and Poland. See ‘data chapter’ for interactive maps and data at the HELCOM Map and Data Service.
In the Bothnian Bay and Quark area in the Gulf of Bothnia the total smolt production has varied a little in the last 10 years being however above the GES threshold. In the Bothnian Sea the smolt production dropped slightly below the GES threshold in 2019-2020, but it is predicted to improve back to GES in 2022-2023. Smolt production in rivers flowing into the western Gotland Basin and Bornholm Basin is in GES. The number of adult spawners ascending the rivers has varied a little but particularly in the largest river stocks it been of a sustainable magnitude as a result of stricter management measures in the sea areas. The GES is achieved in 8 out of 17 rivers associated with these assessment units, and it is predicted that it will be achieved in more rivers within the next few years. Apart from Vindelälven all other rivers with high potential smolt production capacity are in GES in the assessment units concerned, which dictates the result of the evaluation in these areas. In the Gulf of Finland, two Estonian wild salmon river stocks are evaluated to be in GES and the third one is expected to improve to GES in the medium term. The rest of the rives in the area are supported with releases of reared salmon in parallel with natural smolt reproduction. The smolt production in these mixed rivers has been strongly varying and in most of the rivers is low but has recently showed an increasing trend. In the eastern Gotland Basin and Gulf of Riga smolt production is below GES and does not show signs of improvement in most of the rivers.
The level of confidence of the evaluation is high in the Bothnian Bay, Quark and Gulf of Finland, and intermediate in other areas.
The indicator is applicable in all the countries bordering the Baltic Sea except Denmark, Germany, and Poland.
1.1. Citation
The data and resulting data products (e.g. tables, figures and maps) available on the indicator web page can be used freely given that it is used appropriately and the source is cited. The indicator should be cited as follows:
HELCOM (2023) Abundance of salmon spawners and smolt. HELCOM core indicator report. Online. [Date Viewed], [Web link].
ISSN 2343-2543

Seafloor litter
1 Key message
Amount and composition of macrolitter on the seafloor
This indicator is a HELCOM pre-core indicator
This HELCOM pre-core indicator is evaluated for the purposes of the ‘State of the Baltic Sea’ report (HOLAS 3) and further development towards a core indicator is expected in the future. An overview of indicator development is set out in the HELCOM indicator manual.
Note: There is no operational indicator for litter on the seafloor in the HELCOM area, but an indicator based on data of marine litter collected in trawls during fish stock surveys is proposed. The indicator concept is the amounts of litter (unit: items per km2 seafloor) in different categories of litter items (plastic, glass/ceramics, metals, natural products, rubber and miscellaneous; for further details see below), distributed in the Baltic Sea. It is important to note that the number of litter items recovered in trawls is only an indication of the true amount of litter on the seafloor. An interim definition of Good Environmental Status (GES) is proposed in the section on GES. The section on results includes a brief summary of data and information available in the Baltic Sea area, but the status is not assessed due to lack of agreement on GES.
Table 1. Evaluation of the preliminary threshold of no significant increase from 2015 to 2021.
| HELCOM Assessment unit name (and ID) | Threshold value achieved/failed | Distinct trend between current and previous evaluation | Description of outcomes, if pertinent |
| Baltic Sea | Achieved for glass, metal, natural products, fisheries related litter (numbers only) rubber and SUP | Stable/decreasing | Indicator evaluation failed to achieve the threshold value for some litter categories. Long degradation time for most litter types. |
| Failed for plastic, fisheries related (weight only) and other litter. | Increasing |
Marine litter is widely recognised as a serious global environmental concern as the increased use of single use plastics, mismanagement of waste and insufficient recycling practices all contribute to increasing amounts of litter ending up in the marine environment. Marine litter can have a variety of environmental impacts: marine animals can ingest litter and thereby the litter can enter the food web serving also as transport mechanism of harmful chemicals, animals can become entangled in litter resulting in death or injury and containers and plastic items are potential sources of contaminants. Floating plastic litter can also be a possible vector for the transfer of alien species but the risk of this happening in the Baltic Sea is considered small. Larger litter items that move in currents can cause habitat damage by scouring or smothering at the seafloor but may also potentially provide habitat as they increase habitat rugosity. Benthic trawl surveys are a convenient way to monitor seafloor litter on the continental shelf, because they are already in use and financed by fish stock assessments, they cover a wide area of the seafloor using standardised methods and, on many surveys, litter is registered.
When litter density was measured in weight, the categories “other”, plastic and fisheries related litter increased significantly in the period from 2015 to 2021 whereas when density was measured in numbers, only “other” and plastic litter increased significantly and thereby failed the preliminary threshold of no significant increase from 2015 to 2021 in both weight, numbers and probability of catching litter. Fisheries related litter passed the threshold when measured in numbers per km2 but not when measured in weight per km2. The categories glass, metal, natural, rubber and single use plastics (SUP) showed no significant increase in weight and numbers per km2 and hence passed the preliminary threshold of no significant increase.
Data on the amount of litter collected in trawls during fish stock surveys is only available for some Baltic Sea regions. The data set covers years from 2012 and forward in areas from the Northern Baltic proper and south, see map below in the section on current monitoring. Other methods for monitoring litter on the seafloor, e.g., in areas not covered by fish stock surveys, are still in the form of pilot studies.
1.1 Citation
The data and resulting data products (e.g. tables, figures and maps) available on the indicator web page can be used freely given that it is used appropriately and the source is cited. The indicator should be cited as follows:
HELCOM (2023). Amount and composition of macrolitter on the seafloor. HELCOM pre-core indicator report. Online. [Date Viewed], [Web link].
ISSN 2343-2543

Seal reproduction
1 Key message
Reproductive status of seals
This core indicator evaluates the status of the marine environment based on the reproductive status of seals in the Baltic Sea, more specifically for grey (Halichoerus grypus) and ringed seals (Pusa hispida). Good status is achieved when the annual pregnancy rate is at least 90%. The overall status is evaluated based on the combined gestation rate (visible foetus during the gestation period) and the postpartum pregnancy rate (corpus albicans and a placental scar during the postpartum period). The aggregated pregnancy rate is calculated for each reproductive period during the assessment period 2016-2021. Grey seal and ringed seal females aged between 6-24 years for the gestation rate and 7-25 years for the postpartum pregnancy signs rate are included in the evaluation.
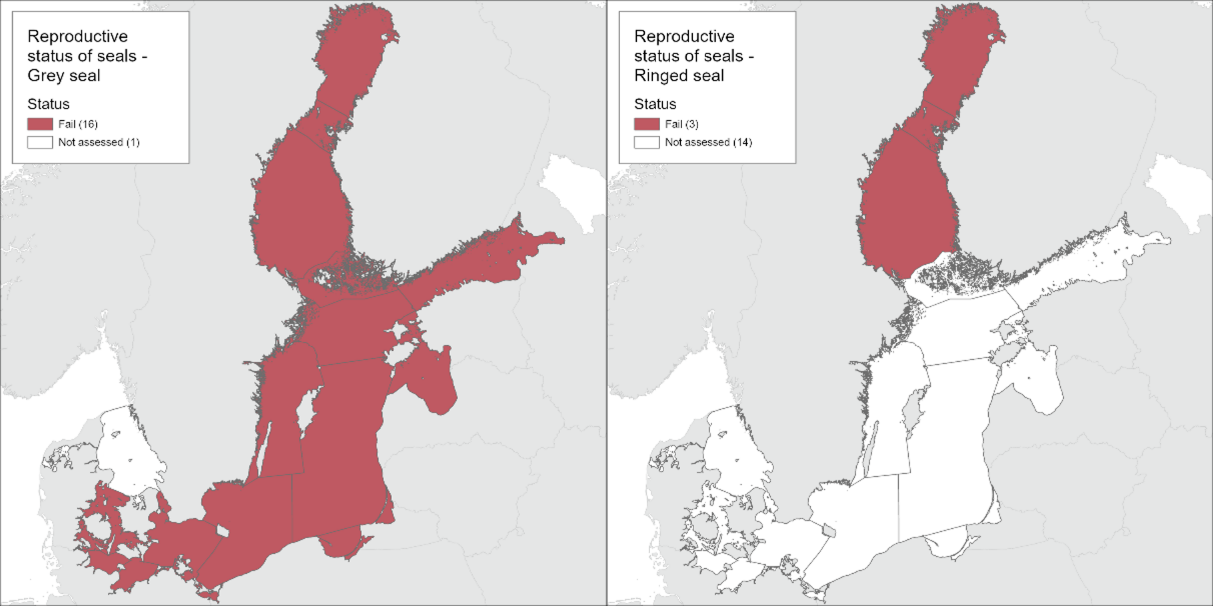
Figure 1. Status evaluation results based on evaluation of the indicator ‘reproductive status of seals’ for grey seals (left) and ringed seals (right). The evaluation is carried out using HELCOM assessment unit scale 2 (defined in the HELCOM Monitoring and Assessment Strategy Annex 4). See ‘data chapter’ for interactive maps and data at the HELCOM Map and Data Service.
Currently, a full status evaluation has been carried out for the grey seal and the ringed seal based on Finish and Swedish data only. While the indicator can be relevant also the harbour seals the amount of data has so far been insufficient for an evaluation. The evaluation of grey seal and ringed seal reproductive status is based on data relevant for assessing reproduction in 2016-2021 and the reproductive rate did not reach the established threshold for either species (Figure 1).
Grey seals occur in the entire Baltic Sea area except for Kattegat where the species has not been breeding since the 1930s, except for a few observations in recent years. The grey seal in the Baltic is evaluated as a single unit since they perform long migrations across the marine region, but excludes grey seals from the Atlantic population (i.e. from the Kattegat). Grey seal reproduction is not in good status with regards to reproductive rate in the entire Baltic when evaluated as one single population.
Ringed seals are evaluated for two management units: 1) the Bothnian Bay and 2) the Gulf of Finland, Archipelago Sea, Gulf of Riga and Estonian coastal waters. Data was only present for the Bothnian Bay management unit, in which the reproductive rate falls below the threshold during the assessment period.
Harbour seals are confined to the Kalmarsund, Southern Baltic Sea, Kattegat and the Limfjord. They are split into two management units 1) Kalmarsund, and 2) Southern Baltic Sea (Danish Straits, Danish, German and the Öresund region including Skåne county in Sweden and Kattegat). A threshold value is set at 90% reproductive rate for five years and older seals. Data was insufficient for an evaluation and hence no evaluation of status has been carried out.
The indicator is applicable in the waters of all the countries bordering the Baltic Sea as the indicator includes all seal species that occur in the region and at least one of the species occurs in all HELCOM assessment units.
1.1 Citation
The data and resulting data products (e.g. tables, figures and maps) available on the indicator web page can be used freely given that it is used appropriately and the source is cited. The indicator should be cited as follows:
HELCOM (2023) Reproductive status of seals. HELCOM core indicator report. Online. [Date Viewed], [Web link].
ISSN 2343-2543
Shallow-water oxygen
1 Key message
Shallow-water oxygen
This indicator is a HELCOM pre-core indicator.
This HELCOM pre-core indicator is evaluated for the purposes of the ‘State of the Baltic Sea’ report (HOLAS 3) and further development towards a core indicator is expected in the future (threshold values are preliminary). An overview of indicator development is set out in the HELCOM indicator manual.
The shallow-water near-bottom oxygen indicator is applied in the Western Baltic Sea, the Gulf of Riga, Gulf of Finland Eastern and the Gulf of Bothnia.
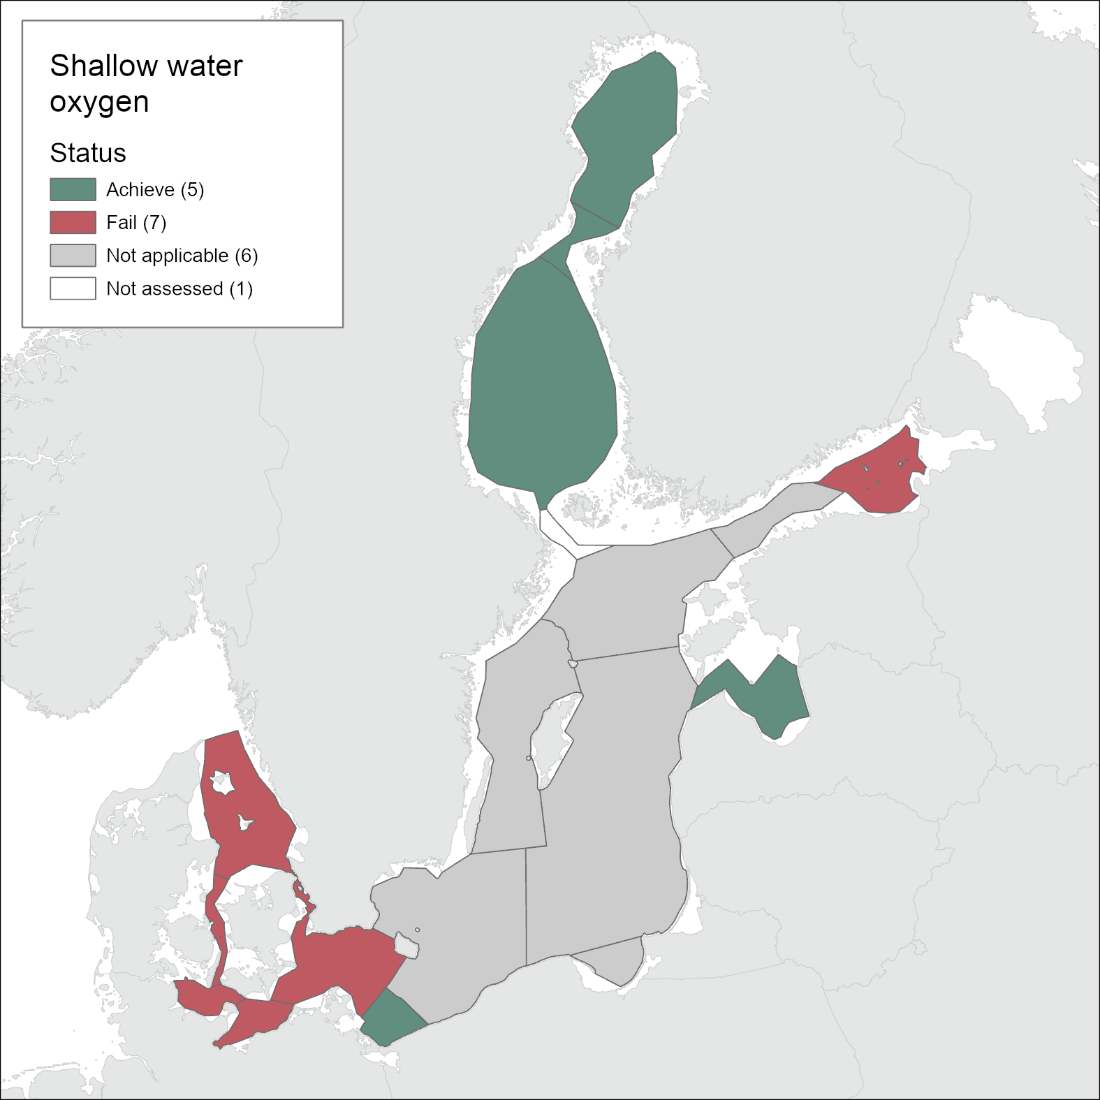
Figure 1. Status evaluation results for the pre-core indicator ‘shallow water oxygen’. The assessment is carried out using Scale 4 HELCOM assessment units (defined in the HELCOM Monitoring and Assessment Strategy Annex 4). See ‘data chapter’ for interactive maps and data at the HELCOM Map and Data Service.
This pre-core indicator uses area-specific approaches to evaluate near bottom oxygen conditions in shallow waters. During the assessment period 2016-2021 good status was found in the Bothnian Sea, the Quark, Bothnian Bay, Gulf of Riga and Pomeranian Bay. The Kattegat, Danish Straits and Arkona Basin were not in good status (Figure 1). The indicator is not applied in the central basins of the Baltic Sea where instead the Oxygen Debt Indicator is used.
1.1 Citation
The data and resulting data products (e.g. tables, figures and maps) available on the indicator web page can be used freely given that it is used appropriately and the source is cited. The indicator should be cited as follows:
HELCOM (2023). Shallow water oxygen. HELCOM core indicator report. Online. [Date Viewed], [Web link].
ISSN 2343-2543.

Soft-bottom macrofauna
1 Key message
State of the soft-bottom macrofauna community
The indicator evaluates the status of the soft-bottom macrofauna community occurring in the open sea areas of the Baltic Sea. In Northern Baltic Proper, Gulf of Finland, Eastern Gotland Basin and Western Gotland Basin only areas above the permanent halocline are evaluated. The current evaluation result shows good status in most of the evaluated assessment units (Figure 1).
The indicator is not used in coastal areas which are evaluated by national methods or in areas below the halocline which should be assessed using the Oxygen debt indicator. The indicator takes into account the relative proportion of sensitive and tolerant species, as well as species richness and abundance.
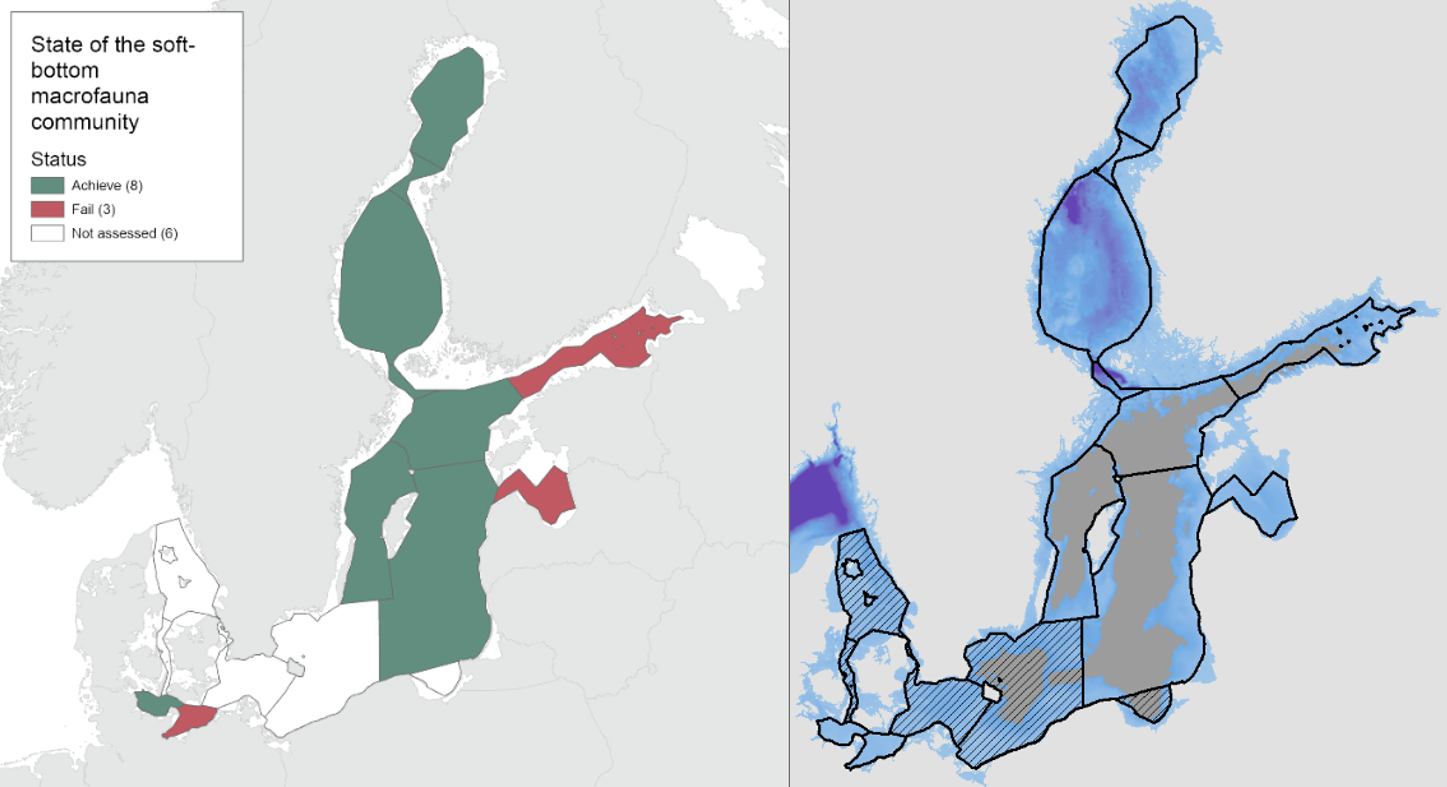
Figure 1. Status evaluation results based evaluation on the indicator ‘State of the soft-bottom macrofauna community’. The evaluation is carried out using Scale 4 HELCOM assessment units (defined in the HELCOM Monitoring and Assessment Strategy Annex 4). The indicator evaluates the open sea areas of the Baltic Sea. The right panel shows the open sea areas and the areas below the permanent halocline (grey) that are not evaluated with this indicator. Striped assessment units are not evaluated due to lack of agreed threshold values. See ‘data chapter’ for interactive maps and data at the HELCOM Map and Data Service.
The current evaluation spans the years 2016-2021, and is based on monitoring data reported by HELCOM Contracting Parties. The status of the indicator is good in all evaluated subbasins, except the Bay of Mecklenburg, Gulf of Riga and Gulf of Finland.
The accuracy of the indicator result is considered to be high in all assessment units, except for Gulf of Riga and Gulf of Finland where the accuracy is low. The spatial data coverage is low in the Northern Baltic Proper and the Gulf of Finland, intermediate in the Eastern Gotland Basin and high other parts. Temporal coverage of data is high or intermediate in all assessment units.
The indicator is applicable in the open sea areas from all countries bordering the Baltic Sea. Currently it is operational only in the evaluated areas due to the lack of agreed threshold values in some assessment units.
Citation
The data and resulting data products (e.g. tables, figures and maps) available on the indicator web page can be used freely given that it is used appropriately and the source is cited. The indicator should be cited as follows:
HELCOM (2023). State of the soft-bottom macrofauna community. HELCOM core indicator report. Online. [Date Viewed], [Web link].
ISSN 2343-2543
TBT and imposex
1 Key message
Tributyltin (TBT) and imposex
This core indicator evaluates the status of the marine environment based on concentrations of tributyltin (TBT) and its breakdown products dibutyltin (DBT) and monobutyltin (MBT) in the Baltic Sea.
Monitoring is carried out in water, biota (marine gastropods) and sediments. Imposex effects of TBT on marine gastropods are used as another source of data on TBT, as a sensitive biological effect caused by organotin. Good status is achieved when the concentrations of TBT are below the threshold value established for each matrix. The indicator presents a status evaluation using all data currently available until 2021 to evaluate the assessment period 2016 – 2021 (Figure 1).
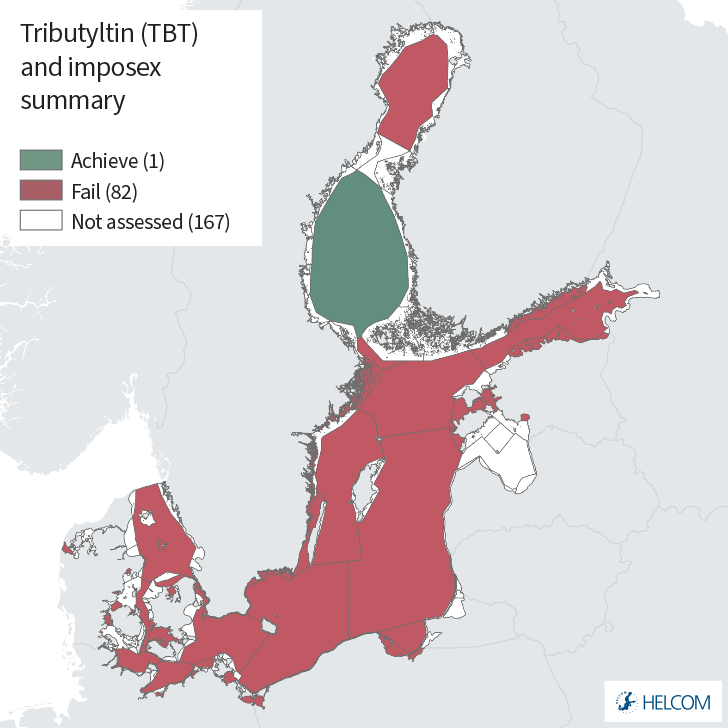
Figure 1. Status evaluation results based on evaluation of the TBT concentrations in sediment and water, and biological effects in biota – marine gastropods (Imposex). One-Out-All-Out (OOAO) method is applied between the three monitored components to provide an overall evaluation of Good Environmental Status (GES). A confidence evaluation is applied in a similar manner. The evaluation is carried out using Level 4 HELCOM assessment units (defined in the HELCOM Monitoring and Assessment Strategy Annex 4). See ‘data chapter’ for interactive maps and data at the HELCOM Map and Data Service.
Some assessment units achieve good environmental status (GES), for example the Polish coastal area POL-OO2 Bornholm Basin/Pomeranian Bay area for the water monitoring matrix and SEA-015 (Bothnian Sea open sea area) for the sediment monitoring matrix. However, when applying a One-Out-All-Out approach across monitoring matrix types GES is only achieved in SEA-015 (Figure 1). Certain stations within the assessment unit level evaluation presented in Figure 1 also achieved GES, for example Finnish station LL3A in the Gulf of Finland (sediment) or Danish station DMU D14 (biota, Imposex), though achievement of GES at the station level (or vice versa) does not automatically result in GES at the assessment unit level due to compilation of several station level evaluations (as discussed below).
Data in one or more of the monitored components was available from Denmark, Estonia, Finland, Germany, Lithuania, Poland and Sweden, offering a broad spatial coverage in the Baltic Sea region. In general, the majority of evaluated assessment units fail to achieve GES. With one exception all significant trends identified are downwards (all for the Imposex component). This result is not unexpected as the main source of TBT is antifouling paints, which have been banned. However, TBT is highly persistend and might accumulate in sediments. Therefore, sediments still represent a potential source of TBT, especially in harbours and shipping lanes, and these pools can be re-suspended during storm events.
The confidence of the indicator evaluation is generally moderate in those assessment units evaluated, with some assessment units in the sediment evaluation showing high confidence and others for the water evaluation showing low confidence. Overall a moderate confidence is deemed to be a suitable reflection of the overall evaluation provided.
The indicator is applicable in the waters of all countries bordering the Baltic Sea.
1.1 Citation
The data and resulting data products (e.g. tables, figures and maps) available on the indicator web page can be used freely given that it is used appropriately and the source is cited. The indicator should be cited as follows:
HELCOM (2023) TBT and imposex. HELCOM core indicator report. Online. [Date Viewed], [Web link].
ISSN: 2343-2543
Total Allowable Catch
Drivers and driver indicators for Total Allowable Catch
Drivers and Driver Indicators
In the HOLAS 3 work, a limited number of drivers and driver indicators were explored, focusing on early testing and development of the driver – driver indicator methodology and concept. The selected topics and reports are not all encompassing and are proof-of-concept examples.
Please note that driver indicators are clearly differentiated from other HELCOM indicators as they do not address status or pressure directly and can thus not be used other than as supporting information on relevant broader processes.
DAPSIM (Driver-Activity-Pressure-State-Impact-Measure) is a conceptual management framework utilized in HELCOM for visualizing the relationships between society and the environment (HELCOM, 2020). Each component in this framework has connections to one or more other components that allow for the effect of any given component on the other components to be either qualitatively or quantitatively addressed throughout the framework. In this framework the D stands for drivers. For HOLAS 3 purposes, drivers were considered to be ‘’societal and environmental factors that, via their effect on human behaviour or environmental conditions, may influence activities, pressures, or the state of the marine environment’’. It was also requested that for HOLAS 3 drivers of societal relevance were the focus of the pilot development work.
To make the information on drivers useful in an assessment context, they should be connected with other DAPSIM framework components through explanatory proxies. Thus, driver indicators are explanatory proxies that can be quantified or succinctly described and are linked to changes in drivers. Therefore, quantification of drivers and understanding the trends are desirable to ensure a concrete link. Analyses of these driver indicators can be used as a tool to understand societal trends, inform policy makers of environmental risks and to comprehend the interconnectedness of society and the environment, and identify efficient measures.

Total nitrogen
1 Key message
Total nitrogen (TN)
The core indicator evaluates average total nitrogen (TN) concentration in surface waters (0 – 10 m) during the entire year (January – December) for the assessment period 2016-2021.
Of the 19 open sea assessment units three sub-basins, the Kattegat, Great Belt and Kiel Bay, achieved good status with TN concentrations below defined threshold values, which reflect good conditions. (Key message figure 1). TN concentrations are still at elevated levels in 16 sub-basins. Improving trends since the 1990s, meaning decreasing TN concentrations, were recorded in 13 out of 19 open-sea assessment units, while deteriorating trends, i.e. increasing TN concentrations, were identified in four sub-basins (Bornholm Basin, Pomeranian Bay, Gdansk Basin and Eastern Gotland Basin). In the remaining two assessment units no significant trend was observed and TN concentrations have generally remained at the level of the 1990s with considerable multi-year variability in the Arkona Basin and Western Gotland Basin.
When comparing the latest two assessments of HOLAS II and HOLAS 3 no status change was observed. Improving trends could not be detected between the current and the previous assessment, while two sub-basins showed a deteriorating status (Eastern Gotland Basin, Gulf of Finland Western). In the majority of sub-basins the status was more or less stable. In seven sub-basins, the TN indicator was applied for the first time, either due to commonly agreed threshold values or as a result of new subdivisions in the eutrophication assessment for the Pomeranian Bay, which was separated from the Bornholm Basin, and the subdivision of the Gulf of Finland into a western and an eastern part.
Concerning the coastal waters TN was assessed in Estonian, Finnish, German, Polish and Swedish waters. In coastal water assessment units the threshold values set for total nitrogen mostly failed to achieve good status. Good status was only observed in some assessment units of Estonian, Finnish, German, Polish and Swedish coastal waters (Annex Table 1). There were a number of cases where a good status of coastal water bodies was assessed adjacent to open sea basins that had a moderate or worse status. This could be due to a lack of alignment of threshold values between coastal waters and open sea basins.

Figure 1. Status evaluation of the indicator ‘Total nitrogen’ – annual monitoring. The evaluation is carried out using Scale 4 HELCOM assessment units (defined in the HELCOM Monitoring and Assessment Strategy Annex 4). Please note hat in coastal areas the evaluation is based on annual data, summer data and winter data, as reported by HELCOM Contracting Parties, and these details are defined in Results table 2. See Results section below for details. See ‘data chapter’ for interactive maps and data at the HELCOM Map and Data Service.
The confidence in the indicator TN status evaluation was high in 10 basins, moderate in eight basins and low in one basin (see Figure 7). Low confidence was caused by insufficient temporal and spatial sampling.
The indicator is applicable in all open sea assessment units and coastal areas. In HOLAS II, the indicator was not operational in all assessment units due to the lack of agreed threshold values in some areas. However, this was successfully resolved and thresholds were agreed so that all open sea assessment units could be assessed for HOLAS 3. The indicator period and method of calculation varies between open sea and coastal areas, and thus the threshold or assessment concentrations are not directly comparable between the open sea and the coast, nor between all coastal assessment units where nationally binding thresholds values may have been set in line with the national assessments under the Water Framework Directive.
1.1 Citation
The data and resulting data products (e.g. tables, figures and maps) available on the indicator web page can be used freely given that it is used appropriately and the source is cited. The indicator should be cited as follows:
HELCOM (2023). Total nitrogen (TN). HELCOM core indicator report. Online. [Date Viewed], [Web link].
ISSN 2343-2543.

Total phosphorus
1 Key message
Total phosphorus (TP)
The core indicator evaluates average total phosphorus (TP) concentration in surface waters (0 – 10 m) during the entire year (January – December) in open sea assessment units for the assessment period 2016-2021.
Of the 19 open sea assessment units, only in the Great Belt good status was achieved with TP concentrations below the defined threshold value (Figure 1). In the remaining 18 sub-basins TP concentrations are still at elevated levels failing to achive good status. Long-term trends show predominantly deteriorating trends since the 1990s in 6 sub-basins (primarily located in the Baltic Proper and the Gulf of Bothnia) and only in the Great Belt and Kiel Bay an improving trend with decreasing TP concentrations has been observed. No clear trend could be identified in 11 sub-basins, but considerable multi-year variability was observed, especially in the Bay of Mecklenburg, Pomeranian Bay and Gdansk Basin. TP concentrations have generally remained at the level of the 1990s with some inter-annual variations in Arkona Basin, Gulf of Riga and Gulf of Finland Western.
When comparing the latest two assessments of HOLAS II and HOLAS 3 no status change was observed. Four sub-basins showed a deteriorating trend (Åland Sea, Bothnian Sea, The Quark and Bothnian Bay) with partly high exceedances of the respective thresholds for TP concentrations. No improving trend between the current and the previous assessment could be detected, while seven sub-basins showed a more or less stable status with generally decreasing EQRS values (increasing TP concentrations) in HOLAS 3 compared to HOLAS II indicating a further worsening. In eight sub-basins, the TP indicator was applied for the first time, so no comparison was possible. The first iteration of the TP indicator was either due to now commonly agreed threshold values or as a result of new subdivisions in the eutrophication assessment for the Pomeranian Bay, which was separated from the Bornholm Basin, and the subdivision of the Gulf of Finland into a western and an eastern part.
Concerning the coastal waters TP was assessed in Estonian, Finnish, German, Polish and Swedish waters. In coastal water assessment units the threshold values set for total phosphorus mostly failed to achieve good status. Only in some assessment units of Estonian, Finnish, Polish and Swedish coastal waters TP concentrations were below the threshold values and good status was achieved (Annex Table 1). There were a number of cases where a good status of coastal water bodies was assessed adjacent to open sea basins that had a moderate or worse status. This could be due to a lack of alignment of threshold values between coastal waters and open sea basins (Table 3 and Annex Table 1) and internal load of phosphorus in the open sea areas.
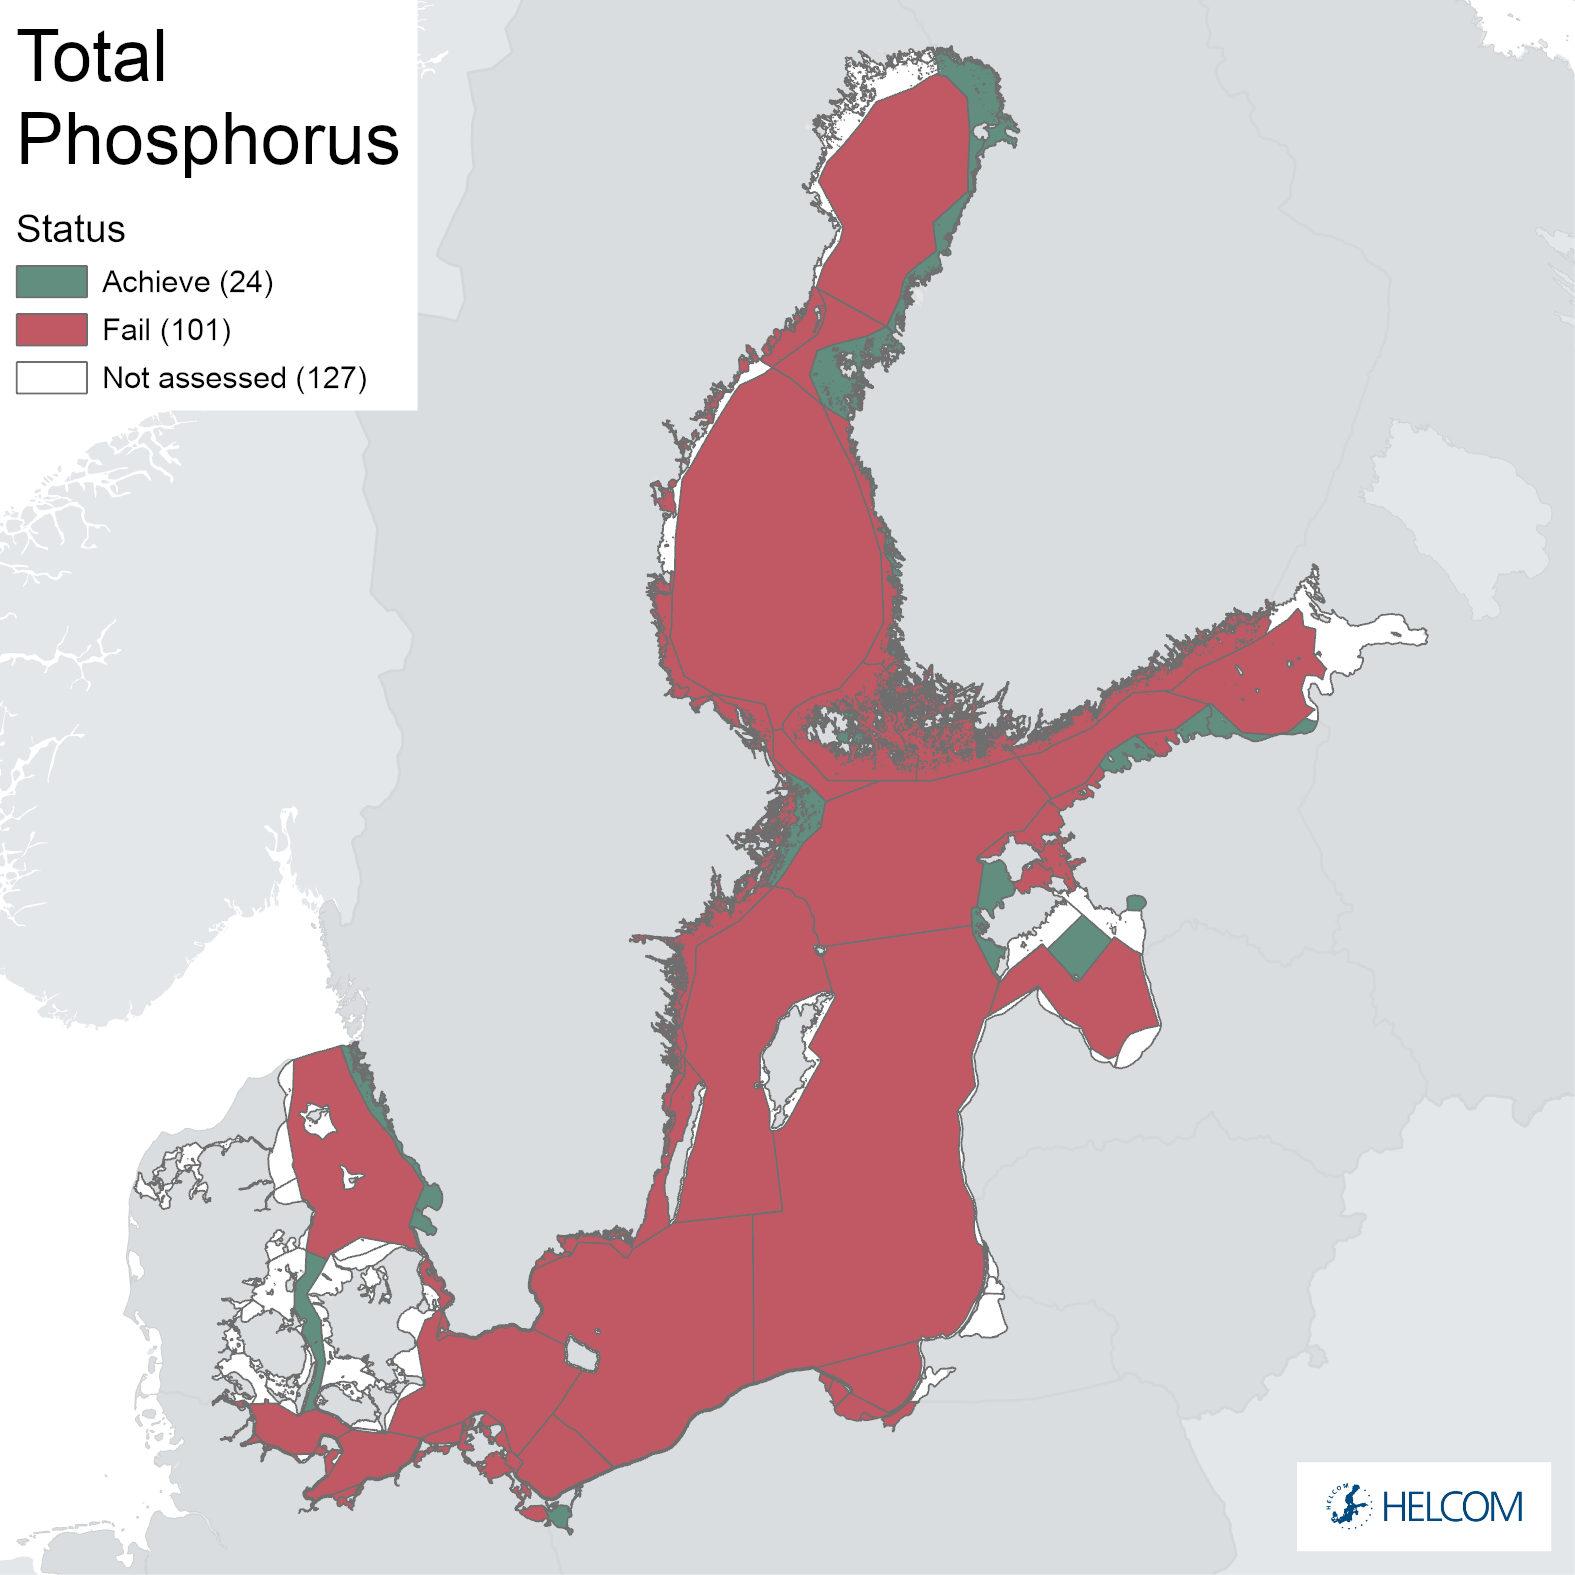
Figure 1. Status evaluation of the indicator ‘Total phosphorus’ – annual monitoring. The evaluation is carried out using Scale 4 HELCOM assessment units (defined in the HELCOM Monitoring and Assessment Strategy Annex 4). Please note that in coastal areas the assessment is based on annual data, summer data and winter data, as reported by HELCOM Contracting Parties, and these details are defined in Table 4. See Results section below for details. See ‘data chapter’ for interactive maps and data at the HELCOM Map and Data Service.
The confidence in the indicator TP status evaluation was high in 10 basins, moderate in 8 basins and low in one basin (see Figure 5). Low confidence was caused by insufficient temporal and spatial sampling.
The indicator is applicable in all open sea assessment units and coastal areas. In HOLAS II, the indicator was not operational in all assessment units due to the lack of agreed threshold values in some areas. However, this was successfully resolved and thresholds were agreed so that all open sea assessment units could be assessed for HOLAS 3. The indicator period and method of calculation varies between open sea and coastal areas, and thus the thresholds or assessment concentrations are not directly comparable between the open sea and the coast, nor between all coastal assessment units where nationally binding thresholds values may have been set in line with the national assessments under the Water Framework Directive.
1.1 Citation
The data and resulting data products (e.g. tables, figures and maps) available on the indicator web page can be used freely given that it is used appropriately and the source is cited. The indicator should be cited as follows:
HELCOM (2023). Total phosphorus (TP). HELCOM core indicator report. Online. [Date Viewed], [Web link].
ISSN 2343-2543.

Trout abundance
1. Key message
Abundance of sea trout spawners and parr
This core indicator evaluates the status of coastal sea areas of the Baltic Sea based on the abundance of sea trout parr in rivers where they breed. The determination of whether good environmental status (GES) is reached is based on a comparison of the observed parr densities in rearing habitats with the reference potential parr densities in the specified habitats. The current evaluation assesses the status of sea trout populations using data from 2016-2020 and expert evaluations (Figure 1).
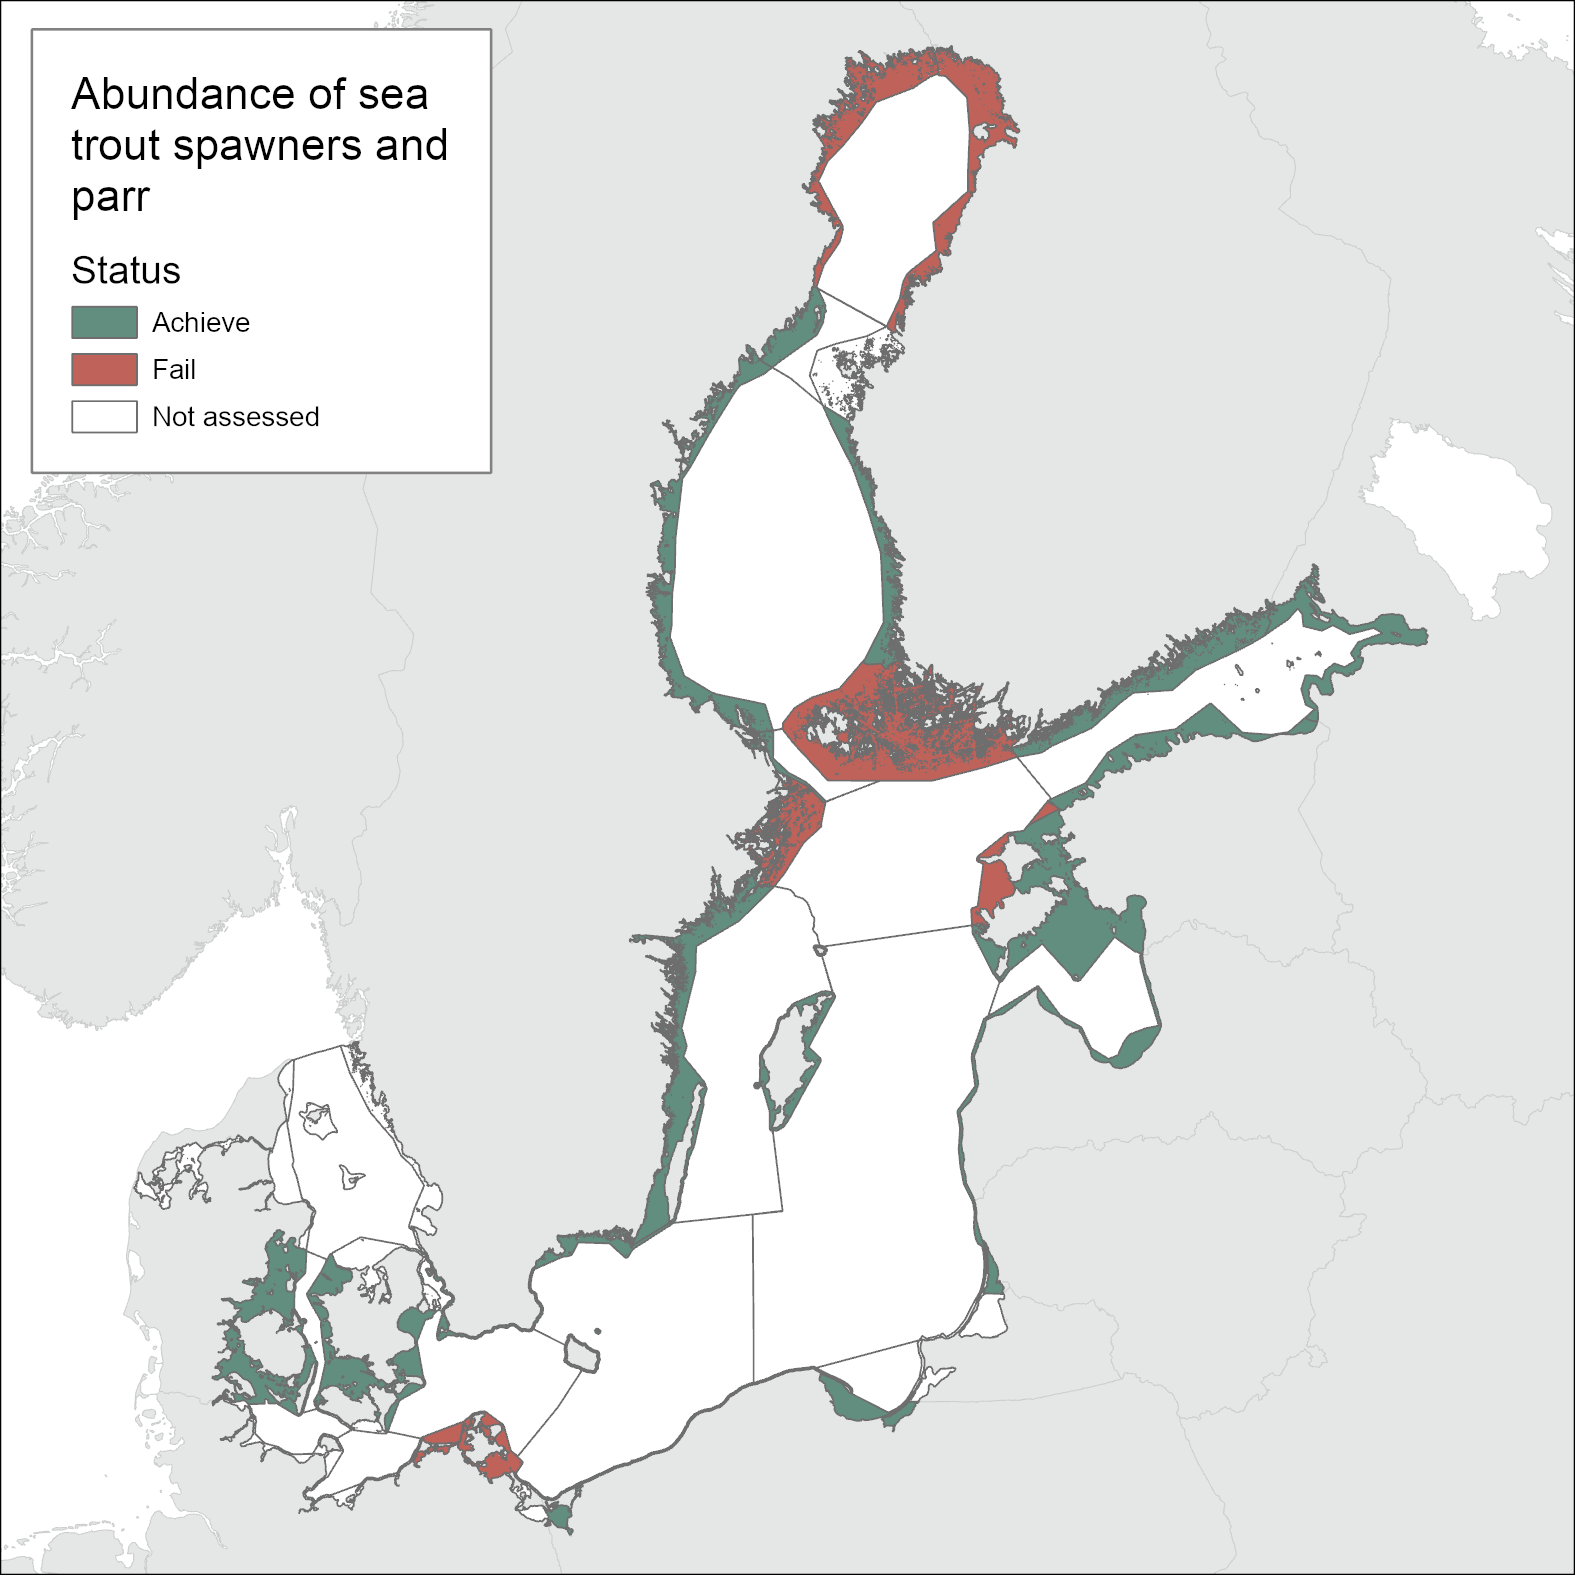
Figure 1. Status evaluation results based on evaluation of the indicator ‘abundance of sea trout spawners and parr’. The evaluation is carried out using Scale 3 HELCOM assessment units (defined in the HELCOM Monitoring and Assessment Strategy Annex 4). See ‘data chapter’ for interactive maps and data at the HELCOM Map and Data Service.
The current evaluation shows that the status reflected by populations of sea trout is not good in coastal areas of the northernmost Baltic Sea. Threshold values are not achieved in the Bothnian Bay and the Archipelago Sea area. A positive development in parr densities and reaching the GES since 2016 has been observed in some rivers in Finland (Gulf of Finland and Bothnian Sea), and Sweden (Bothnian Sea), reflecting management improvements in these countries.
In the Southern Gulf of Finland and Baltic Proper, the status of sea trout stocks is better in eastern and south-western sub-basins where the majority of stocks reach production levels reflecting good status.
The level of confidence of the evaluation is moderate to high, with confidence varying between regions linked to the input data.
The indicator is applicable in the rivers of all countries bordering the Baltic Sea.
Citation
The data and resulting data products (e.g. tables, figures and maps) available on the indicator web page can be used freely given that it is used appropriately and the source is cited. The indicator should be cited as follows:
HELCOM (2023) Abundance of sea trout spawners and parr. HELCOM core indicator report. Online. [Date Viewed], [Web link].
ISSN 2343-2543
Wastewater Treatment
Drivers and driver indicators for Wastewater Treatment
Drivers and Driver Indicators
In the HOLAS 3 work, a limited number of drivers and driver indicators were explored, focusing on early testing and development of the driver – driver indicator methodology and concept. The selected topics and reports are not all encompassing and are proof-of-concept examples.
Please note that driver indicators are clearly differentiated from other HELCOM indicators as they do not address status or pressure directly and can thus not be used other than as supporting information on relevant broader processes.
DAPSIM (Driver-Activity-Pressure-State-Impact-Measure) is a conceptual management framework utilized in HELCOM for visualizing the relationships between society and the environment (HELCOM, 2020). Each component in this framework has connections to one or more other components that allow for the effect of any given component on the other components to be either qualitatively or quantitatively addressed throughout the framework. In this framework the D stands for drivers. For HOLAS 3 purposes, drivers were considered to be ‘’societal and environmental factors that, via their effect on human behaviour or environmental conditions, may influence activities, pressures, or the state of the marine environment’’. It was also requested that for HOLAS 3 drivers of societal relevance were the focus of the pilot development work.
To make the information on drivers useful in an assessment context, they should be connected with other DAPSIM framework components through explanatory proxies. Thus, driver indicators are explanatory proxies that can be quantified or succinctly described and are linked to changes in drivers. Therefore, quantification of drivers and understanding the trends are desirable to ensure a concrete link. Analyses of these driver indicators can be used as a tool to understand societal trends, inform policy makers of environmental risks and to comprehend the interconnectedness of society and the environment, and identify efficient measures.

Water transparency
1 Key message
Water transparency
This core indicator evaluates summer-time (June – September) water clarity based on average Secchi depth during the assessment period 2016-2021.
In open sea areas, good status for water clarity has been achieved in the Kattegat. Single coastal assessment units achieving good status are found in Danish, Finnish, German, Polish and Swedish coastal areas. However, 18 of the total 19 open sea assessment units as well as most of the coastal waters remain in a below-good status.
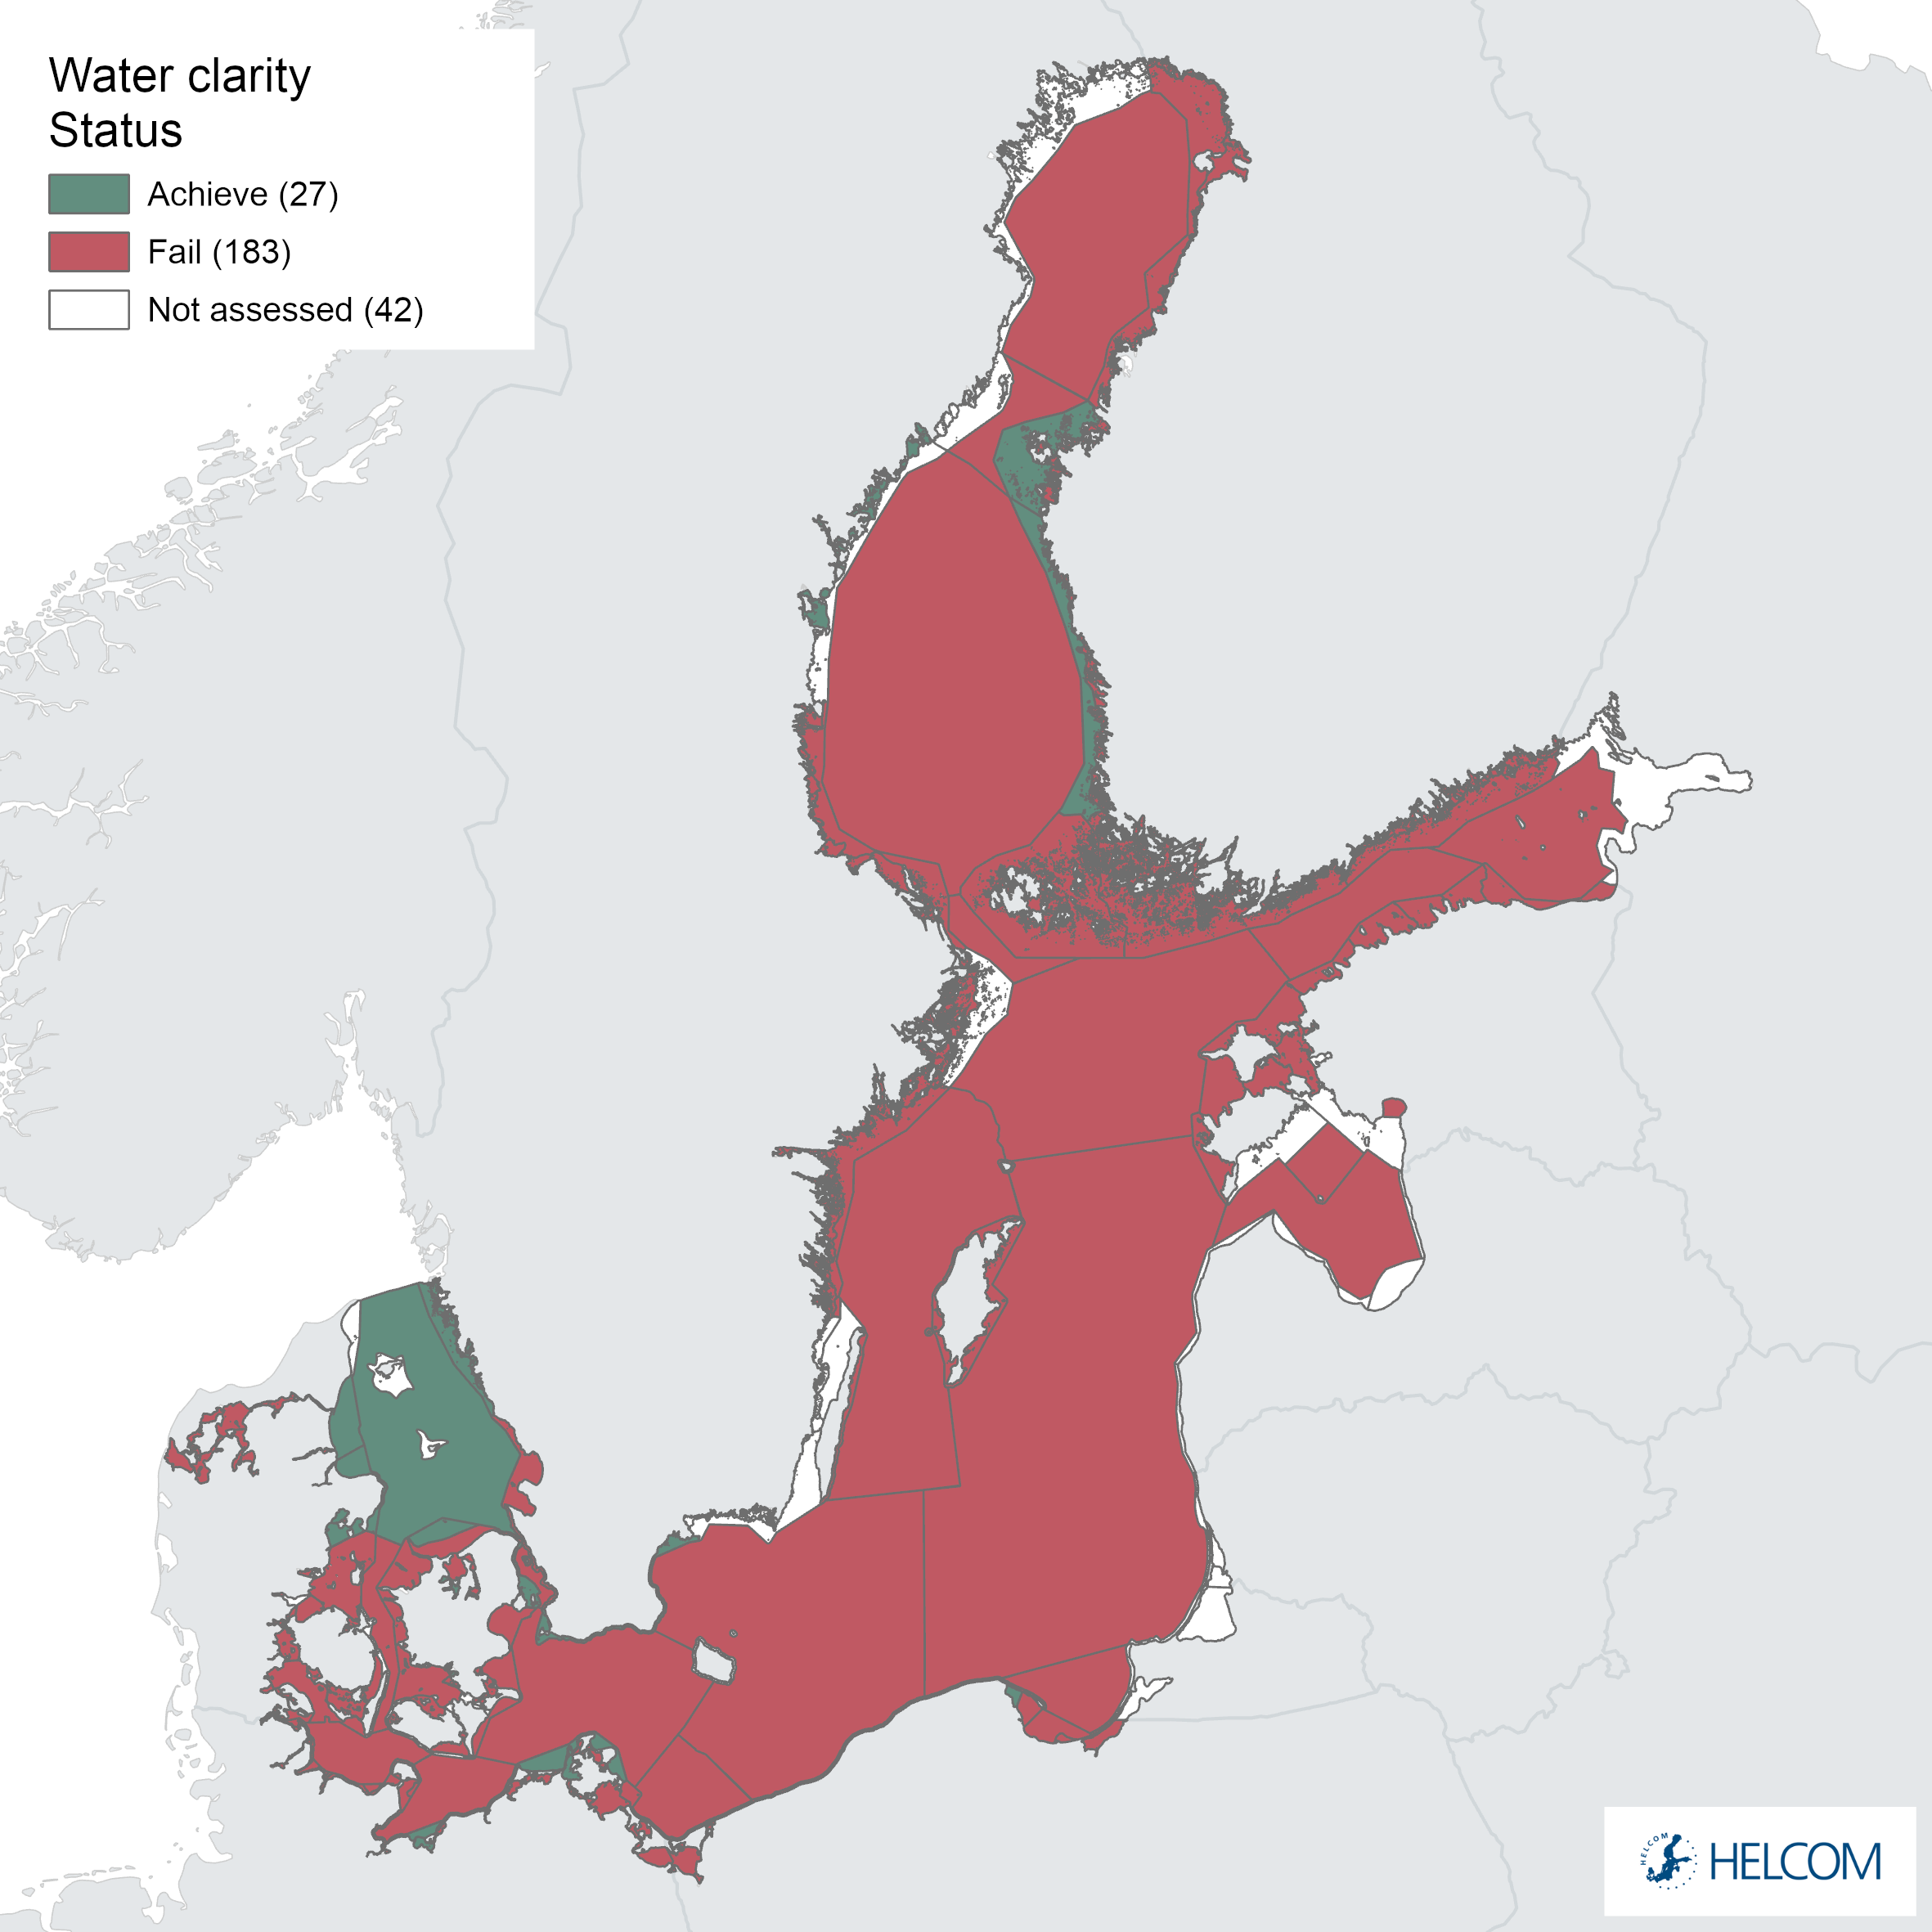
Figure 1. Status assessment evaluation of the indicator ‘Water clarity’. The assessment is carried out using Scale 4 HELCOM assessment units (defined in the HELCOM Monitoring and Assessment Strategy Annex 4). See ‘data chapter’ for interactive maps and data at the HELCOM Map and Data Service.
Since the early 1900’s, there has been a general long term decrease in summer-time water clarity in most of the Baltic Sea. Since the 1990s, water clarity has improved in the southwestern assessment units (Kattegat, Sound, Great Belt and Kiel Bay). In the rest of the Baltic Sea, water clarity has either decreased (Arkona Basin, Eastern Gotland Basin, Western Gotland Basin, Northern Baltic Proper, Eastern Gotland Basin and Gulf of Finland Western) or remained stable during that time (Results figure 3). In comparison to the HOLAS II period (2011-2016), only the Sound has changed its status from achieving to failing good status. The status has improved in seven subbasins and deteriorated in nine sub-basins.
The confidence in the water clarity status evaluation is high in the southwestern parts of the Baltic Sea. In the Quark, Åland Sea, Gulf of Finland Eastern, Gulf of Finland Western and Gulf of Riga open-sea assessment units the indicator confidence was low, due to insufficient sampling. In the remaining open-sea assessment units the indicator confidence was moderate.
The indicator is applicable in the waters of all countries bordering the Baltic Sea.
Citation
The data and resulting data products (e.g. tables, figures and maps) available on the indicator web page can be used freely given that it is used appropriately and the source is cited. The indicator should be cited as follows:
HELCOM (2023). Water clarity. HELCOM core indicator report. Online. [Date Viewed], [Web link].
ISSN 2343-2543.

Waterbirds breeding season
1. Key message
Abundance of waterbirds in the breeding season
This core indicator evaluates the status of the bird species breeding in the Baltic Sea area by assessing fluctuations in abundance. As a rule, good status is achieved when the abundance of 75% of the considered species making up a species group do not decline by more than 30% (20% in species laying only one egg per year) compared to a baseline during the reference period 1991-2000.
The indicator performs status evaluations by aggregating annual single species index values for all waterbird species and on the basis of aggregated indices for five species groups (wading feeders, surface feeders, pelagic feeders, benthic feeders, grazing feeders).
On the scale of the entire Baltic Sea the evaluation for the assessment period 2016-2021 showed a good status for all waterbird species when considered together, but diverging results for the species groups. While surface feeders, pelagic feeders, benthic feeders and grazing feeders achieved the threshold value indicating a good status, wading feeders failed to achieve the threshold value and do not indicate good status (Figure 1).
On a finer spatial scale, the status for breeding waterbirds was evaluated in seven subdivisions of the Baltic Sea (see Figure 11). The results define a different perspective and diverging evaluations between the spatial subdivisions.
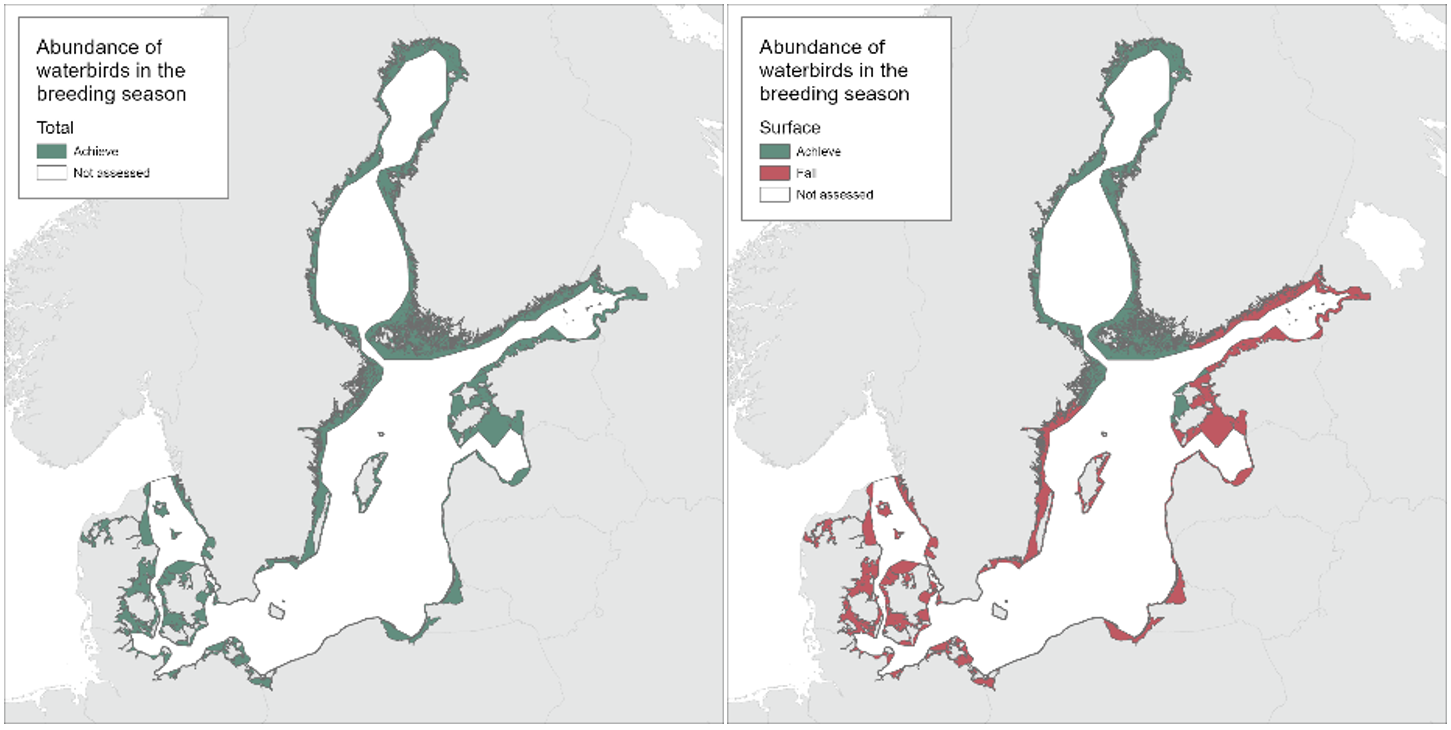
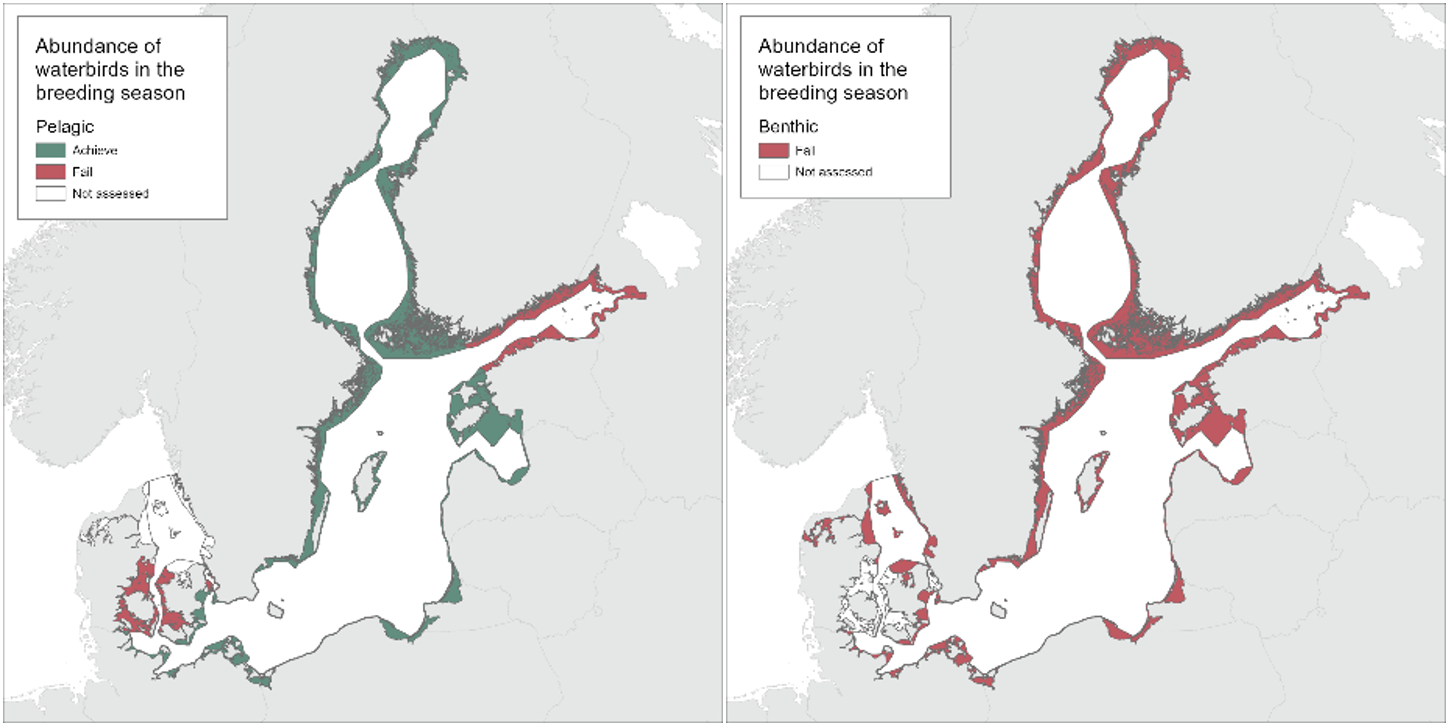
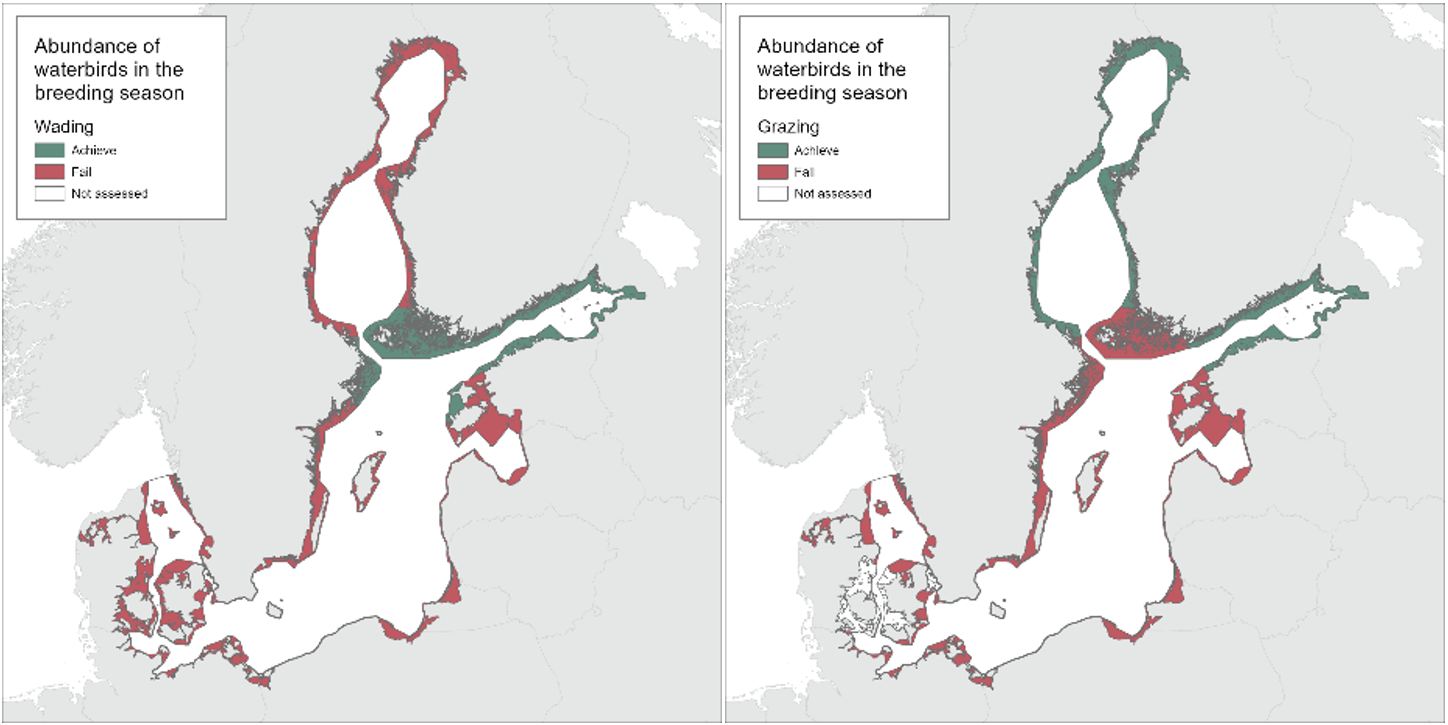
Figure 1. Status of the indicator ‘abundance of waterbirds in the breeding season’. The current evaluation is presented for coastal areas. The evaluation is for the entire Baltic Sea – including all species currently evaluated (top left, Scale 1 HELCOM assessment units, defined in the HELCOM Monitoring and Assessment Strategy Attachment 4) and for seven sudivisions of the Baltic Sea (see Figure 11). Results for the species groups are based on the trends of individual species: surface feeders (top middle), pelagic feeders (top right), benthic feeders (bottom left), wading feeders (bottom middle) and grazing feeders (bottom right).
1.1 Citation
The data and resulting data products (e.g. tables, figures and maps) available on the indicator web page can be used freely given that it is used appropriately and the source is cited. The indicator should be cited as follows:
HELCOM (2023). Abundance of waterbirds in the breeding season. HELCOM core indicator report. Online. [Date Viewed], [Web link].
ISSN 2343-2543.

Waterbirds wintering season
1 Key message
Abundance of waterbirds in the wintering season
This core indicator evaluates the status of abundance of wintering waterbirds in the Baltic Sea region based on monitoring data of 29 species. The wintering waterbirds are considered to reflect good status when at least 75% of the considered species deviate less than 30% downwards (species laying more than one egg per year) or 20% downwards (species laying one egg per year) from the baseline condition during the reference period 1991-2000.
The status evaluation has been carried out on all species grouped together, but also separately on groups of species with similar feeding behaviour. The indicator performs status evaluations by aggregating annual single species index values for all waterbird species in a given group (all species, wading feeders, surface feeders, pelagic feeders, benthic feeders, grazing feeders).
In the period 2016-2021, the abundance of wintering waterbirds in the Baltic Sea was in a poor status, because 69% of the species assessed achieved the threshold value (at least 75% of species meeting threshold value indicates good status). Two species groups, namely pelagic feeders and wading feeders, achieved good status (≥75% of species meeting threshold value), whereas surface feeders, benthic feeders and grazing feeders did not reach the threshold value. These evaluations only reflect the status of coastal waters, because waterbirds wintering predominantly in the open sea and therefore too far offshore to be monitored by land-based surveys are not considered (Figure 1).
The indicator was also applied to six subdivisions (aggregations of up to four sub-basins). A good status of wintering waterbirds was observed in four of the subdivisions (Bornholm Group, Gotland Group, Gulf of Finland, Bothnian Group), but could not be achieved in the other two (Kattegat, Åland Group). The subdivision Belt Sea (Great Belt, The Sound) could not be evaluated. Subdivision evaluations for species groups mostly reflect the same pattern as the overall evaluation, but showed more variation. In Bornholm Group subdivision, data from offshore surveys could enter the evaluation of some species for the first time.
The confidence of the evaluations is estimated to be high.
The indicator is applicable in the waters of all the countries bordering the Baltic Sea.
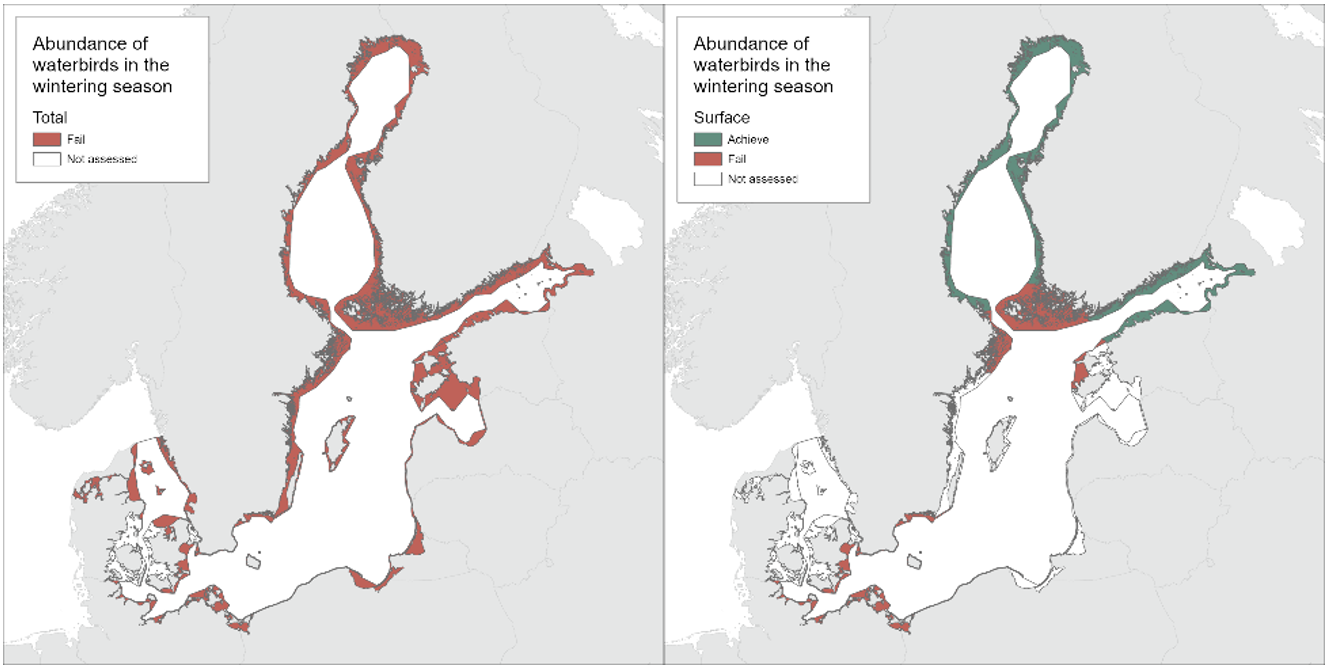
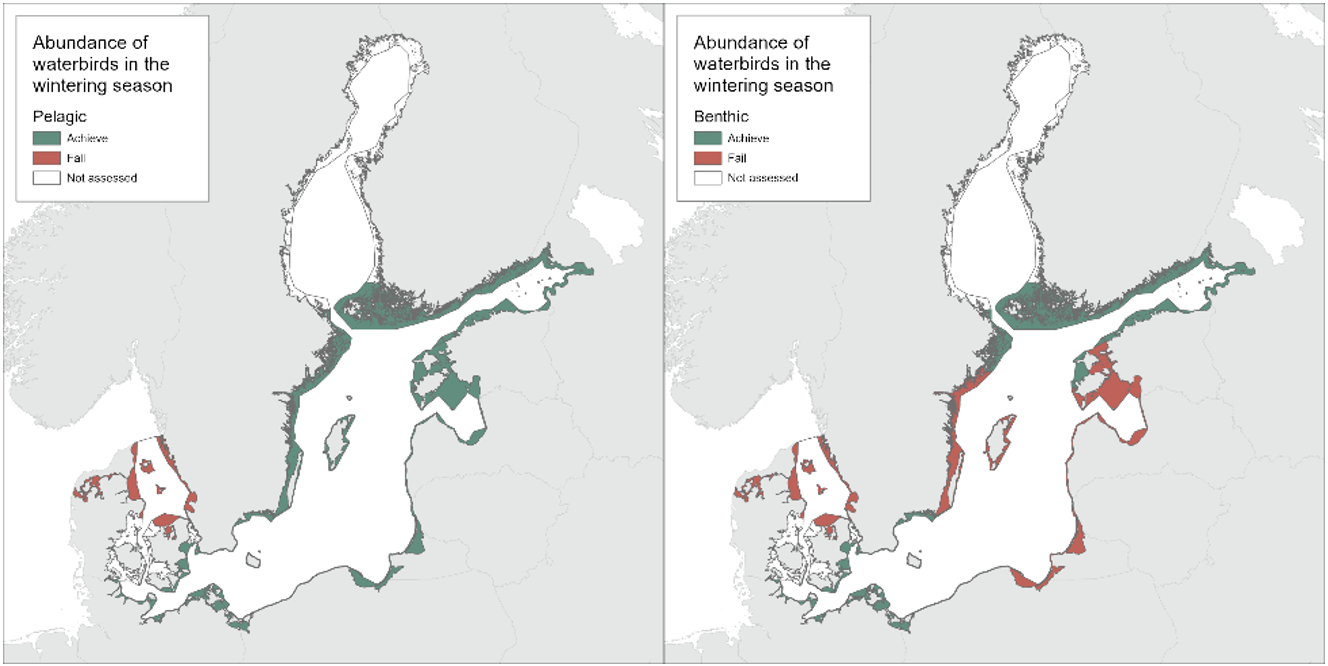
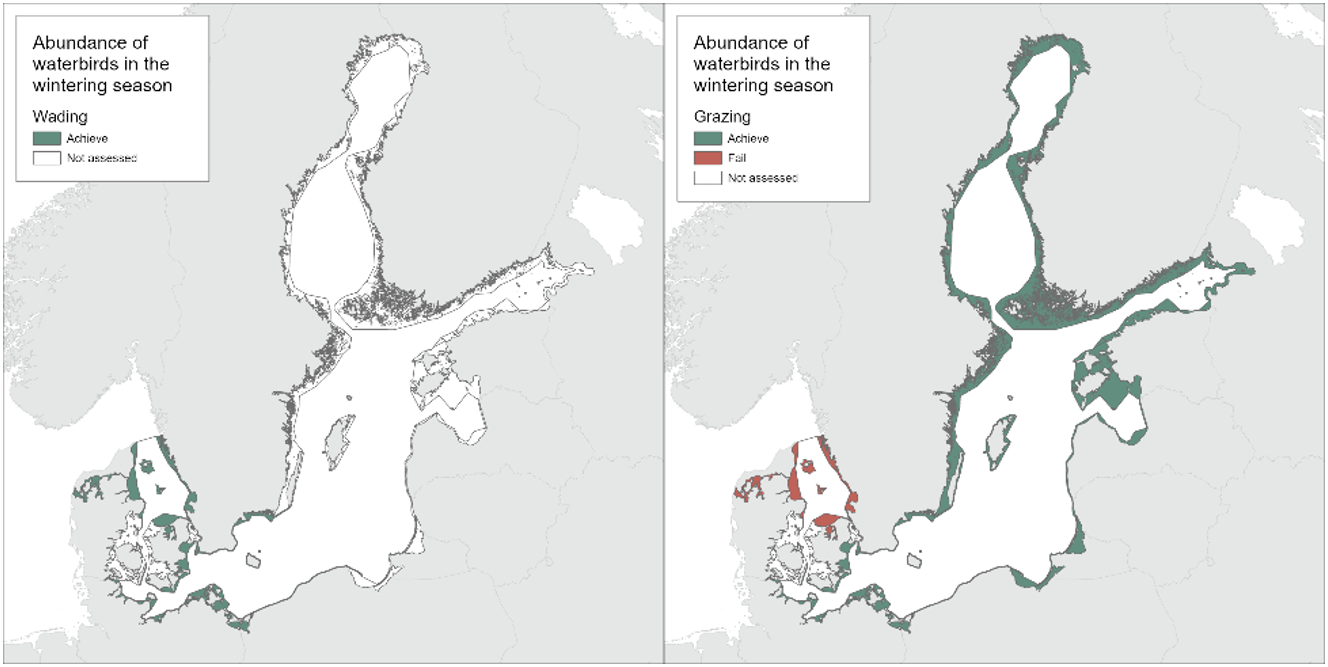
Figure 1. Status of the indicator ‘abundance of waterbirds in the wintering season’. The current evaluation is presented for coastal areas. The evaluation is for the entire Baltic Sea – including all species currently evaluated (top left, Scale 1 HELCOM assessment units, defined in the HELCOM Monitoring and Assessment Strategy Attachment 4) and for seven sudivisions of the Baltic Sea (see Figure 11). Results for the species groups are based on the trends of individual species: surface feeders (top middle), pelagic feeders (top right), benthic feeders (bottom left), wading feeders (bottom middle) and grazing feeders (bottom right). See ‘data chapter’ for interactive maps and data at the HELCOM Map and Data Service.
1.1 Citation
The data and resulting data products (e.g. tables, figures and maps) available on the indicator web page can be used freely given that it is used appropriately and the source is cited. The indicator should be cited as follows:
HELCOM (2023). Abundance of waterbirds in the wintering season. HELCOM core indicator report. Online. [Date Viewed], [Web link].
ISSN 2343-2543.

White-tailed sea eagle
1 Key message
White-tailed sea eagle productivity
This core indicator assesses the status of white-tailed sea eagle reproduction by evaluating the parameter ‘productivity’ and the two supporting variables ‘brood size’ and ‘breeding success’. The indicator reflects an environment un-disturbed by hazardous substances when all three parameters in an assessment unit achieve their respective threshold values. The status of the white-tailed sea eagle productivity has been evaluated for the period 2016-2021 in all areas where an evaluation is possible to carry out (Figure 1).
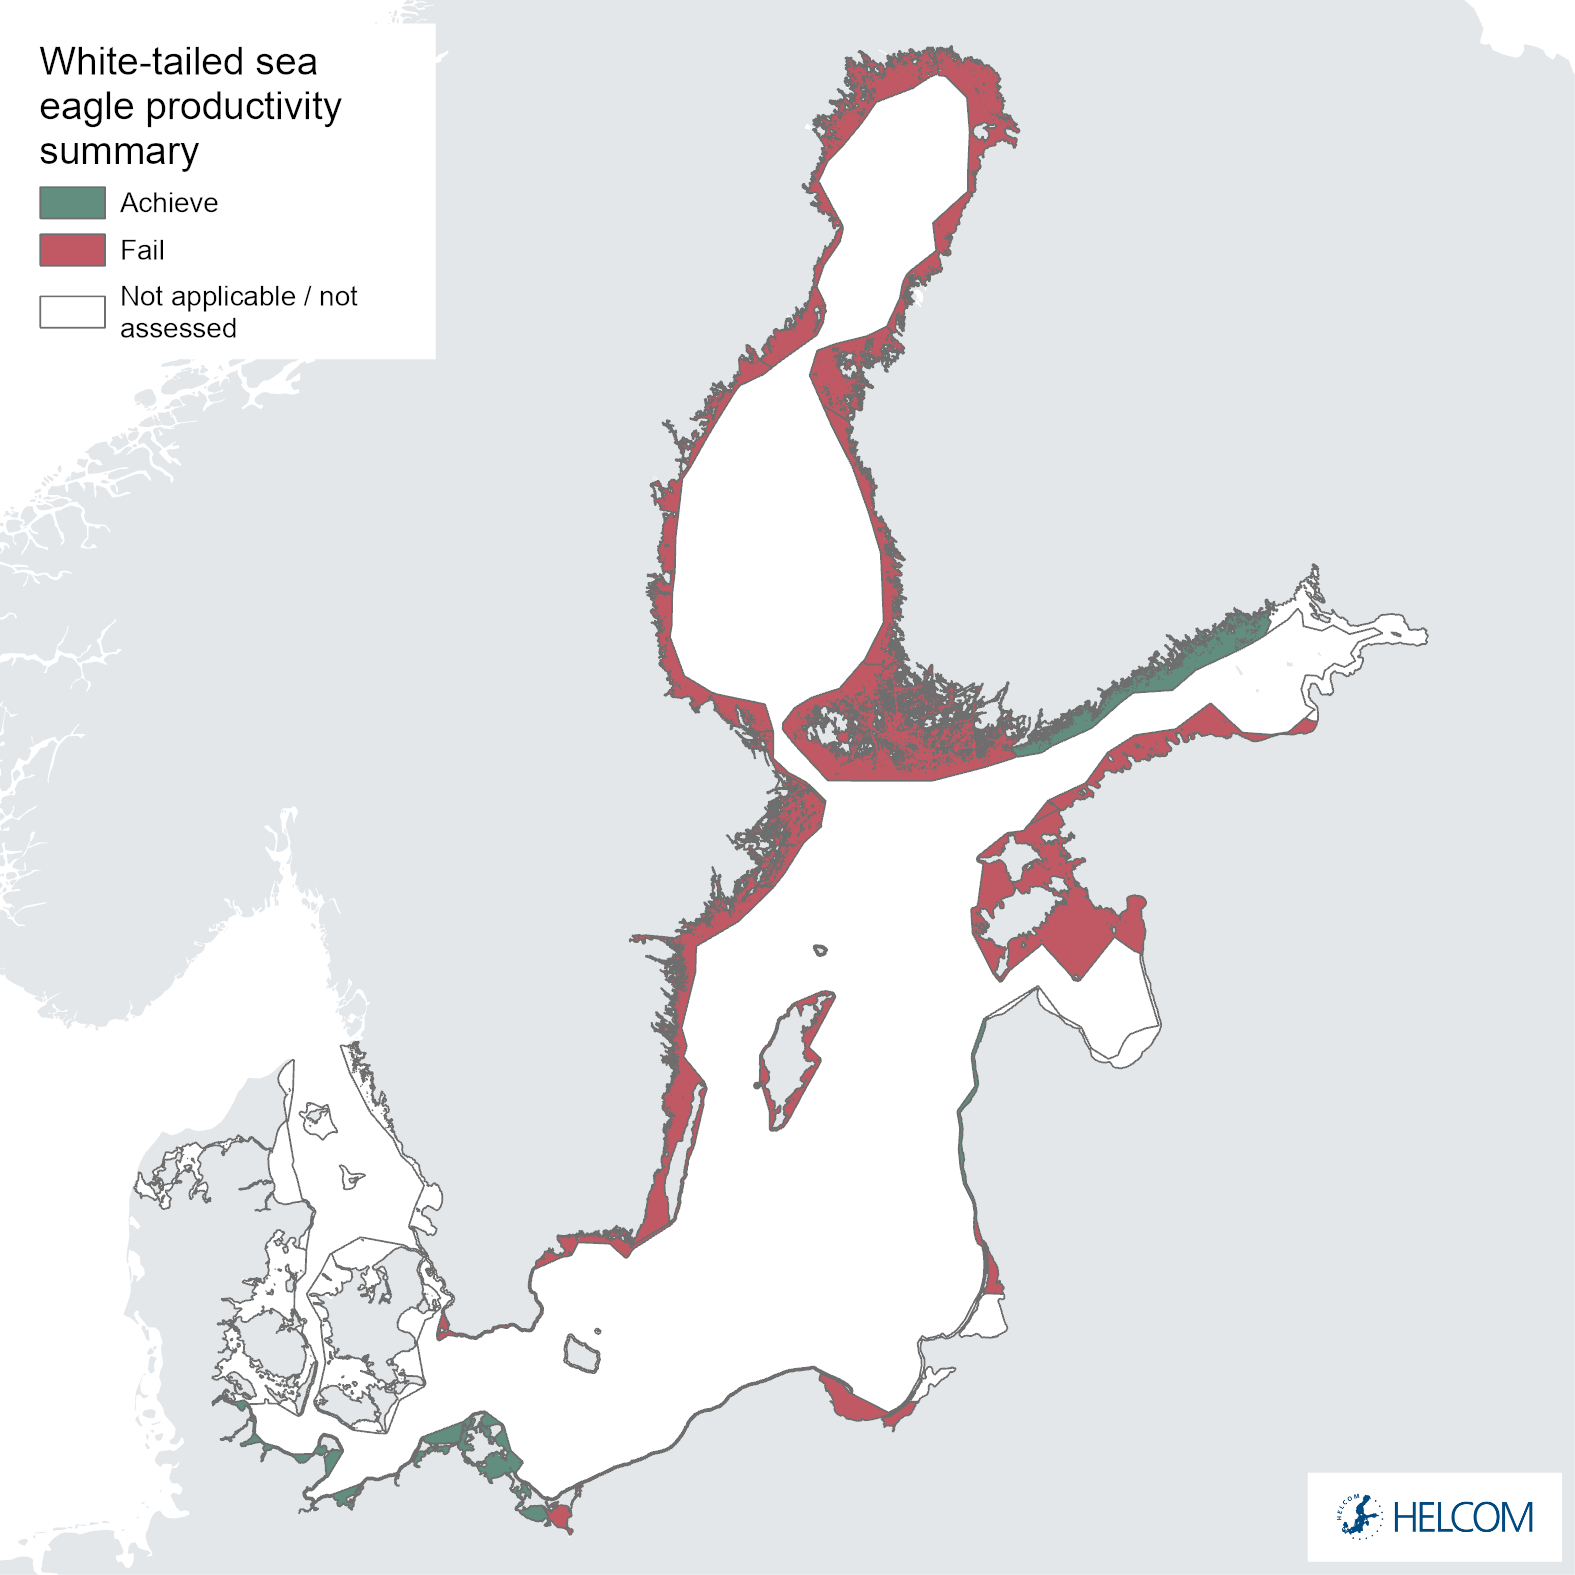
Figure 1. Status evaluation results based on the indicator ‘white-tailed sea eagle productivity. The evaluation was carried out using aggregated Scale 3 HELCOM assessment units (for more information see appendix 1 and the HELCOM Monitoring and Assessment Strategy Annex 4). Assessment for each individual Scale 3 unit was not possible because of small sample sizes in many units. Although numbers of breeding white-tailed sea eagles are generally still increasing, eagles are territorial which limits breeding density – hence the need for custom assessment units. Note that this indicator applies a one-out, all-out (OOAO) approach. Although the productivity parameter only failed the threshold value in three regions, four additional units failed one or both of the other variables, meaning that a total of seven units did not achieve the threshold values overall (see results). Good status was thus achieved in only three assessment units. The indicator is applicable, but not evaluated, in a few regions where sample sizes are very low at present. See ‘data chapter’ for interactive maps and data at the HELCOM Map and Data Service.
There are 13 custom assessment units for this indicator, and 10 were evaluated. Three assessment units were not included in the evaluation due to very low sample sizes or the lack of available data, in the former circumstances thus awaiting future population increases before inclusion in the evaluation process. The productivity of white-tailed sea eagles achieved the threshold value(s), and is therefore in good environmental status (GES) in only 3 assessment units (Figure 1). Seven assessment units did not reach one or more threshold value(s), therefore being classified as sub-GES. This was mainly due to the failure to achieve the threshold value in at least one of the underlying variables of the indicator: brood size and/or breeding success. This indicator applied a one-out, all-out (OOAO) rule, thus all three components must reach the respective threshold values in order to achieve good environmental status. The evaluation shows that nestling brood size was not achieved in five out of 10 evaluated regions, and a similar pattern was observed for breeding success (3 of 10 being sub-GES). Understanding the causes for the failure of the underlying components and changes since the previous evaluation should be explored further.
It should be noted that no white-tailed sea eagles breed in the innermost part of the Gulf of Riga.
The confidence of the indicator status evaluation is considered to be high.
The indicator is applicable in the coastal waters of all the countries bordering the Baltic Sea, up to 10 kilometres from the coast line.
1.1 Citation
The data and resulting data products (e.g. tables, figures and maps) available on the indicator web page can be used freely given that it is used appropriately and the source is cited. The indicator should be cited as follows:
HELCOM (2023) White-tailed sea eagle productivity. HELCOM core indicator report. Online. [Date Viewed], [Web link].
ISSN 2343-2543

Zooplankton
1 Key message
Zooplankton mean size and total stock (MSTS)
This Zooplankton Mean Size and Total Stock HELCOM core indicator evaluates the zooplankton community structure to determine whether it reflects good environmental status (GES). Due to strong environmental gradients and community variations, size distribution and zooplankton total stock corresponding to good status vary between the Baltic Sea sub-basins. As a rule, good status is achieved when large-bodied zooplankters (older stages of calanoid copepods and adult cladocerans) are abundant in the plankton community.
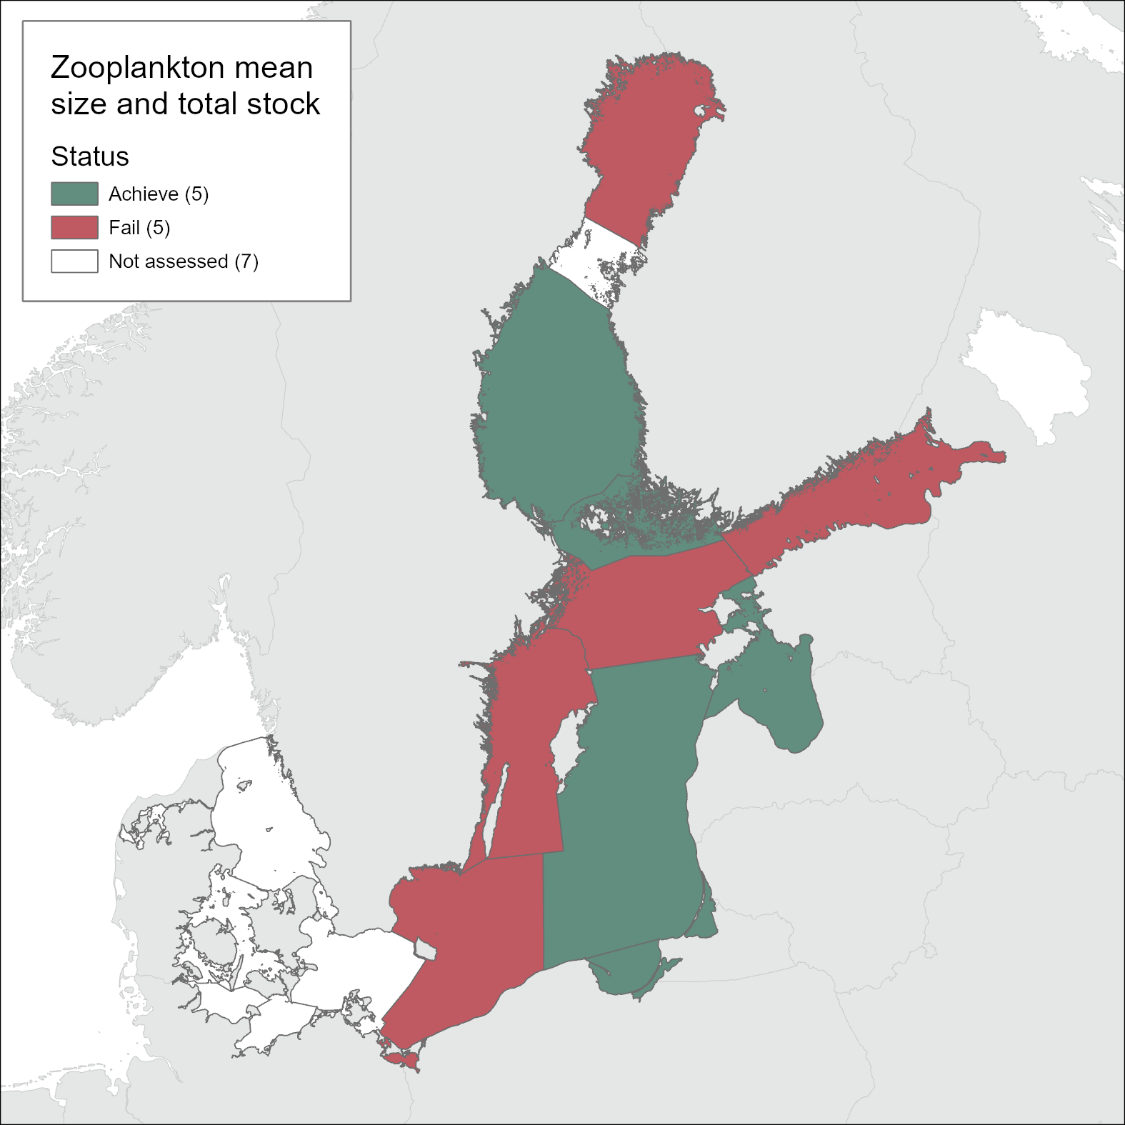
Figure 1. Evaluation of the status evaluation results for zooplankton indicator ‘Mean size and total stock’ (MSTS) in HOLAS 3. Due to national database issues Danish zooplankton data are not included in this evaluation. The evaluation is carried out using Scale 2 HELCOM assessment units (for more information see the HELCOM Monitoring and Assessment Strategy Annex 4. Click here to access interactive maps at the See ‘data chapter’ for interactive maps and data at the HELCOM Map and Data Service.
The indicator-based status evaluation has been completed for the following subbasins: Gulf of Bothnia, Gulf of Finland, Åland Sea, and Northern Baltic Proper, Gulf of Riga, Western Gotland Basin, Gdansk Basin and Bornholm. The evaluation for the other subbasins is mostly hampered by the availability of the data and lack of national expert engagement.
Good status during the assessment period 2016-2021 was found in the Bothnian Sea, Åland Sea, Gulf of Riga, Eastern Gotland Basin and Gdansk Basin (Figure 1). In the rest of the evaluated subbasins, the MSTS does not comply with a good status during the assessment period, mostly, due to the low mean size values. This negative development results from both an increased contribution of rotifers and cladocerans, a probable consequence of eutrophication, and a decreased share of copepods, especially the older stages, which is a probable consequence of size-selective predation by zooplanktivorous fish. It is also possible, albeit not verified, that altered environmental conditions (e.g., decreased salinity, increased temperature and deep-water hypoxia) have contributed to these trends. The detected trends in the mean size and total stocks of zooplankton communities indicate that in many Baltic Sea areas, today’s pelagic food web structure is not optimal for energy transfer from primary consumers (phytoplankton) to fish.
The confidence of the indicator evaluation with regards to spatial and temporal resolution is low to intermediate and varies across the basins since the data used cover fairly long time periods for the sub-basins where the evaluation results are completed, and monthly sampling frequency is usually applied. However, the number of stations is usually low.
The indicator is applicable in the waters of all the countries bordering the Baltic Sea. However, currently the indicator is not operational in some assessment units, and further development work is needed to make it operational in the entire system.
- As a rule, good status is achieved when large-bodied zooplankters are abundant in the plankton community.
- Ten of the 17 HELCOM Scale 2 Assessment Units are evaluated.
- The confidence in the indicator evaluation is deemed to be moderate as the data series are generally reasonably long (i.e. >20 years), sampling frequency is at least monthly, but the number of stations is low.
- Good status is achieved in the Bothnian Sea, Åland Sea, Gulf of Riga, Eastern Gotland Basin, and Gdansk Basin.
- Good status is not achieved in the Bothnian Bay, Gulf of Finland, Northern Baltic Proper, Western Gotland Basin, and Bornholm.
1.1 Citation
The data and resulting data products (e.g. tables, figures and maps) available on the indicator web page can be used freely given that it is used appropriately and the source is cited. The indicator should be cited as follows:
HELCOM (2023) Zooplankton mean size and total stock. HELCOM core indicator report. Online. [Date Viewed], [Web link].
ISSN 2343-2543